Article

Optimization and Component Identification of Ultrasound-Assisted Extraction of Polyphenols from Coriander (Coriandrum sativum L.) and Evaluation of Polyphenol Content Changes and Antioxidant Activity During Storage

1
College of Food and Biology Engineering, Xuzhou University of Technology, Xuzhou 221018, China
2
College of Food Science & Nutritional Engineering, China Agricultural University, Beijing 100083, China
*
Authors to whom correspondence should be addressed.
These authors contributed equally to this work.
Separations 2025, 12(8), 217; https://doi.org/10.3390/separations12080217
Submission received: 8 July 2025 / Revised: 9 August 2025 / Accepted: 14 August 2025 / Published: 16 August 2025

Abstract

Coriander (Coriandrum sativum L.) has significant value in the food industry due to its unique flavor and health benefits. However, its polyphenol content and antioxidant activity have not been systematically analyzed during storage. This study optimized the extraction process of coriander polyphenols using ultrasound-assisted extraction combined with response surface methodology. The polyphenol composition was systematically identified, and changes in polyphenol content and antioxidant activity during storage were investigated. The optimal process conditions for extracting coriander polyphenols were determined as 40% ethanol concentration, 1:121 g/mL material-to-liquid ratio, 81 °C extraction temperature, and 10 min extraction time. This optimized protocol yielded 16.231 mg GAE/g, a 119.28% increase over conventional methods using the same raw material. Fifty polyphenolic compounds were identified using high-resolution mass spectrometry. The main types of polyphenols identified were quercetin, kaempferol, and hydroxycinnamic acid derivatives. Notably, 41 of these compounds were reported in coriander for the first time. In vitro tests revealed that coriander polyphenols exhibit potent antioxidant properties, with IC50 values of 73.43 μg/mL for DPPH and 82.15 μg/mL for ABTS. Furthermore, the polyphenol content and antioxidant capacity of coriander increased significantly during storage, with total phenolic content rising by 40.5%, DPPH activity by 32.5%, and ABTS activity by 56.5%. Key individual polyphenols showed differential changes: rutin continuously accumulated, while chlorogenic acid and ferulic acid exhibited an initial increase followed by a decrease. This study provides strong technical support for the use of coriander polyphenols in functional foods and medicines.

1. Introduction

Coriander (Coriandrum sativum L.) is a widely used spice and traditional medicinal herb valued for its distinctive flavor and nutritional content [1]. It has attracted significant attention in the fields of food, medicine, and health [2,3]. Coriander is rich in polyphenols, which have a strong ability to scavenge free radicals and exhibit multiple biological activities, including anti-inflammatory, antibacterial, and anticancer effects [4,5,6]. These properties make it an important source for developing functional foods and natural medicines [7,8]. Studies have shown that the main polyphenols in coriander are flavonoids and phenolic acids. These compounds play a key role in preventing fat oxidation, regulating the immune system, and improving metabolic syndrome [9].
However, most current studies focus on the qualitative and semi-quantitative analysis of one or a few polyphenols. Due to the limited sensitivity and resolution of traditional analytical methods, a systematic and comprehensive analysis of the full range of polyphenols in coriander remains elusive [10]. Furthermore, the polyphenol content and antioxidant activity of coriander are subject to dynamic changes due to environmental factors during storage and processing after harvest [11]. Nevertheless, systematic studies investigating these changes and their impact on product quality and health benefits remain insufficient [12,13].
Efficient extraction of polyphenols is crucial for in-depth study and large-scale application [14,15]. However, the low efficiency of current extraction methods limits the industrial development and use of coriander polyphenols. This bottleneck affects not only the development of natural polyphenol antioxidants, but also their application in food preservation and functional medicine.
Ultrasound-assisted extraction (UAE) technology is an effective solution that overcomes the limitations of traditional extraction methods. Its main advantage is the unique cavitation effect, which enhances the penetration of solvents and disrupts plant cell walls. This greatly improves the extraction efficiency of polyphenolic active compounds and helps preserve the structural integrity of heat-sensitive components [16,17]. A large body of research confirms UAE’s excellent capability of efficiently extracting polyphenols from coriander and similar plant matrices. For example, Chen et al. used a 650 W ultrasonic probe to treat raspberries, achieving an anthocyanin yield comparable to that from traditional solvent extraction in just three minutes, whereas traditional extraction takes 53 min [18]. Similarly, Lemmadi et al. used UAE technology to extract polyphenols from saffron seeds in 34 min, reducing the time by half compared to traditional methods [19]. Furthermore, Chemat et al. demonstrated that UAE can reduce energy consumption by 30% to 50% and processing time by 50% to 90% [20]. A comparative study by Gallo et al. showed no significant difference in the extraction rate of coriander polyphenols between UAE and microwave-assisted extraction (MAE), but UAE extracts exhibited stronger DPPH radical scavenging activity [21]. Compared with other novel green extraction technologies, such as supercritical CO2 extraction, MAE, or enzyme-assisted extraction, UAE offers the advantages of shorter extraction time and lower energy consumption. It also demonstrates greater competitiveness in terms of equipment cost, operational simplicity, and scalability from laboratory to industrial production [16,17,20].
In this study, the extraction of polyphenolic compounds from coriander (CSPCs) was optimized using ultrasound-assisted extraction guided by response surface methodology. A total of 50 polyphenolic compounds were identified in the CSPCs using an ultra-performance liquid chromatography system coupled with a Q Exactive HF Orbitrap mass spectrometer (UPLC-Q Exactive HF Orbitrap-MS). Changes in total phenolic content (TPC), major polyphenolic components, and antioxidant activities during storage were also investigated. This study provides a solid theoretical foundation and technical support for the development and application of CSPCs in functional foods, natural antioxidants, and the field of medicine.

2. Materials and Methods

2.1. Plant Materials

Coriander was bought from a market (Xuzhou, China). It was divided into two portions: one for extraction process optimization experiments and the other for storage experiments. The coriander was washed, freeze-dried (Scientz-18N, Ningbo Scientz Biotechnology Co., Ltd., Ningbo, China) for 48 h, and then ground (800-Y, Yongkang Bo’ou Hardware Products Co., Ltd., Yongkang, China) and passed through an 80-mesh sieve. The powdered sample had a moisture content of 5.2 ± 0.3%; it was stored in a desiccator at 4 °C and analyzed within one week.

2.2. Chemicals and Reagents

Na2CO3, FeCl3, 2,2′-azino-bis (3-ethylbenzothiazoline-6-sulfonic acid) (ABTS, ≥98%), K2S2O8, Folin–Ciocalteu phenol reagent, K3[Fe(CN)6], CCl3COOH, ethanol, and 2,2-diphenyl-1-picrylhydrazyl (DPPH, ≥98%) were ordered from Macklin Technology Co., Ltd. (Shanghai, China). The reference substances ascorbic acid and gallic acid were acquired from TCI Chemicals Development Co., Ltd. (Shanghai, China).

2.3. Optimization of the Extraction of CSPCs

2.3.1. Quantification of Total Phenolic Content

A 10 mL volume of the reaction mixture, containing 1.2 mL of 0.94 mol/L Na2CO3, 0.4 mL of 10% Folin–Ciocalteu phenol reagent, 7.4 mL of ddH2O, and 1.0 mL of sample solution, was kept at room temperature for 90 min. A760 was measured using a spectrophotometer (T6, Beijing Purkinje General Instrument Co., Ltd., Beijing, China). Despite its widespread use for preliminary quantification and comparative analysis of phenolic compounds due to simplicity and speed, the Folin–Ciocalteu method lacks specificity as other reducing substances can interfere, potentially overestimating polyphenol content [22,23]; nevertheless, it remains the standard screening method, with results expressed as gallic acid equivalents (mg GAE/g) [24,25].

2.3.2. Extraction of CSPCs and Single-Factor Experiment Design

Single-factor experiments assessed the TPC of CSPCs. Investigated parameters included material-to-liquid ratio (1:40 to 1:140 g/mL), ethanol concentration (30–80% v/v), extraction temperature (40–90 °C), and extraction time (5–60 min) [26,27,28]. Each variable was examined individually while the others were held constant.
The specific procedure was as follows: First, 0.5000 g of coriander sample was accurately weighed, and ethanol solution of a certain concentration and volume was added. Ultrasonic treatment was performed (Scientz-18N, Ningbo Scientz Biotechnology Co., Ltd.) at a set temperature. After ultrasonication, the sample was cooled to room temperature and then centrifuged at 9500 rpm for 20 min (H1580, Hunan Xiangyi Laboratory Instrument Development Co., Ltd., Changsha, China). The supernatant was transferred to a 100 mL volumetric flask and diluted with ethanol solution prior to TPC quantification.

2.3.3. Box–Behnken Experiment

After the single-factor test, a 43-level Box–Behnken experiment was performed with total phenolic content of CSPCs used as the response value (Table 1). The association between the predictor and outcome variables was described using a quadratic polynomial equation, as reported in reference [29].
Y = α 0 + i = 1 n   α i X i + i = 1 n   α i i X i 2 + i j = 1 n   α i j X i X j  
where Y is total phenolic content of CSPCs; Xi and Xj indicate the independent parameters; n is the independent parameter number (1–4); α0 is the intercept; and αi, αii, and αij are linear, quadratic, and interactive model coefficients, respectively.
Analysis of variance was employed to test the significance of the derived mathematical model. Determining whether this model could reliably predict CSPC content under different extraction scenarios relied on assessing its overall significance and lack-of-fit statistics. To gain deeper insights into the model’s explanatory power and precision, the coefficient of determination (R2), adjusted determination coefficient ( R a d j 2 ), and coefficient of variance (CV, %) values were scrutinized [30,31].

2.4. Identification of Polyphenolic Compounds in CSPCs

2.4.1. Purification of CSPCs

Dynamic adsorption and desorption were performed using an AB-8 macroporous-resin-filled column (dimensions: 2.6 cm × 30 cm, total bed volume: 150 mL). The pretreated resin was pretreated with 95% ethanol, HCl, and NaOH, followed by rinsing to ensure neutrality. The CSPC extract was first rotary-evaporated under reduced pressure at 40 °C to remove ethanol (RE-5203, Shanghai Yarong Biochemical Instruments Co., Ltd., Shanghai, China) and then lyophilized for 48 h to obtain a powder. A 2.00 g portion (FA2004, Sunny Hengping Scientific Instrument Co., Ltd., Shanghai, China) of this lyophilized powder was dissolved in 20 mL of ddH2O, and the pH (pH meter, PHSJ-4A, INASE Scientific Instrument CO., Ltd., Shanghai, China) was carefully adjusted to 4.6 ± 0.1 with HCl to prepare the CSPC extract solution. This 20 mL CSPC extract solution was then passed through the resin-packed column for adsorption. The column was then washed with ddH2O until the eluate turned clear. Desorption was carried out using 90% ethanol. The desired fraction was collected, concentrated under reduced pressure, and lyophilized for future phytochemical composition analysis and bioactivity evaluations [32].

2.4.2. Analysis by UPLC-Q Exactive HF Orbitrap-MS

A 100 mg purified CSPC sample was precisely measured in a polypropylene centrifugation vessel. Then, 1 mL of methanol aqueous solution (80% v/v) was introduced. Mechanical homogenization was performed using a high-speed automated grinder for precisely 3 min (JXFSTPRP-48, Shanghai Jingxin Industrial Development Co., Ltd., Shanghai, China). The homogenate was chilled and subjected to ultrasonication for 10 min. Following phase separation through centrifugation, the clarified upper layer was collected. Ten microliters of internal standard solution (100 μg/mL) was added. For this study, 2-amino-3-(2-chlorophenyl)-propionic acid, a compound structurally analogous to polyphenols, was selected as the internal standard. Its primary functions are to correct analytical errors and enable the calculation of the relative percentage of polyphenolic compounds. The calculation method is as follows: (1) relative concentration = internal standard concentration × (sample peak area/internal standard peak area); (2) sum the relative concentrations of all compounds to obtain the total relative concentration; (3) relative percentage content (%) = (sample relative concentration/total relative concentration) × 100%. Finally, prior to analysis, the extraction solution was filtered through a 0.22 μm syringe filter [33].
The polyphenolic components within CSPCs were analyzed using a Thermo UPLC-Q Exactive HF Orbitrap-MS [34]. A column (Zorbax Eclipse C18, 2.1 × 100 mm, 1.8 μm, Agilent Technologies Inc., Santa Clara, CA, USA) was used, and the column temperature was set at 3 °C. The mobile phase consisted of solvent A (water containing 0.1% HCOOH) and solvent B (acetonitrile). The elution program was as follows (0.3 mL/min, 2 μL injection volume): 0–2 min, 5% B; 2–6 min, linear increase to 30% B and held until 7 min; 7–12 min, increase to 78% B and maintained until 14 min; 14–17 min, increase to 95% B and held until 20 min; 20–21 min, decrease to 5% B and equilibrated to 25 min. The ion source parameters for both positive and negative modes were as follows: heater temperature at 325 °C, sheath gas flow rate at 45 arb, auxiliary gas flow rate at 15 arb, sweep gas flow rate at 1 arb, electrospray voltage at 3.5 kV, capillary temperature at 330 °C, and S-Lens RF level set to 55%. Full scanning (MS1) was performed in the m/z range of 100–1500. Data-dependent MS/MS (dd-MS2, TopN = 5) was acquired with a resolution of 60,000.
Compound Discoverer 3.3 software facilitated retention time alignment, peak detection, and feature extraction. Compound characterization relied on identification parameters, including reference standard retention time deviation (within ± 0.2 min), precursor ion mass error (<5 ppm), and fragment ion spectral match scores (>70), using both the online Thermo mzCloud and local Thermo mzVault databases.
The process of sample preparation is shown in Figure 1.

2.5. Quantitative Determination of the Major Constituents in CSPCs by UPLC-MS/MS

2.5.1. Sample Pretreatment

First, 100 mg of lyophilized CSPC powder, accurately weighed, was placed into a 5 mL centrifuge tube. Then, 1 mL of an 80% methanol aqueous solution was added. Mechanical homogenization was performed using a high-speed automated grinder for precisely 3 min. The homogenate was chilled and subjected to ultrasonication for 10 min. Following phase separation through centrifugation, the clarified upper layer was collected. It was diluted to an appropriate concentration to ensure that it fell within the linear range of the calibration curve. Then, it was filtered through a 0.22 μm nylon membrane filter prior to UPLC-MS/MS analysis.

2.5.2. Chromatographic Conditions

This experimental procedure was based on the methodologies reported by Xiao et al. [35] and Bajkacz et al. [36], with appropriate optimizations and modifications made to suit the specific experimental conditions. The quantitative analysis of phenolic acids was performed using an Agilent 1290 UPLC system (Agilent Technologies, Inc., Santa Clara, CA, USA) with an Acquity UPLC HSS C18 column (2.1 × 100 mm, 1.8 μm, Waters Corporation, Milford, MA, USA.). The column temperature was set at 35 °C, with a flow rate of 0.3 mL/min and an injection volume of 2.0 μL. The mobile phase consisted of solvent A (0.1% formic acid in water) and solvent B (acetonitrile). The gradient elution program was as follows: 5% B from 0 to 0.5 min, 5% to 15% B from 0.5 to 1 min, 15% to 35% B from 1 to 2.5 min, 35% to 95% B from 2.5 to 4 min, held at 95% B from 4 to 6.5 min, decreased from 95% to 5% B from 6.5 to 6.6 min, and held at 5% B from 6.6 to 8 min.
Quantitative analysis of flavonoids was also performed using an Agilent 1290 UPLC system. Chromatographic separation was achieved on an Acquity UPLC HSS T3 column (2.1 × 100 mm, 1.8 μm, Waters Corporation, Milford, MA, USA.), with the column temperature maintained at 40 °C and a flow rate of 0.3 mL/min. The mobile phase consisted of solvent A (0.1% formic acid in water) and solvent B (acetonitrile), and the injection volume was 5 μL. The gradient elution program was as follows: 10% B from 0 to 1 min, 10% to 90% B from 1 to 14 min, 90% B from 14 to 15 min, 90% to 10% B from 15 to 15.1 min, and held at 10% B from 15.1 to 18 min.

2.5.3. Mass Spectrometry Conditions

The detection of both phenolic acids and flavonoids was performed using electrospray ionization in negative ion mode (-ESI) on an Agilent 6490 triple quadrupole mass spectrometer, with quantification conducted via multiple reaction monitoring (MRM).
Source parameters for phenolic acid detection were as follows: The gas temperature was set at 300 °C with a flow rate of 5 L/min. The nebulizer pressure was maintained at 45 psi. The sheath gas temperature was 250 °C with a flow rate of 11 L/min. The capillary voltage was 3500 V, and the nozzle voltage was 500 V.
Source parameters for flavonoid detection were as follows: The gas temperature was set at 320 °C with a flow rate of 9 L/min. The nebulizer pressure was maintained at 40 psi. The sheath gas temperature was 350 °C with a flow rate of 11 L/min. The capillary voltage was set at 3500 V, while the nozzle voltage in negative mode was 1300 V.
The quantitative ion pairs and their corresponding fragmentor voltages and collision energies for the relevant compounds are listed in Table 2.

2.6. Antioxidant Assays

2.6.1. DPPH Assay

After 2 mL of sample (or reference antioxidant: ascorbic acid) and 2 mL of 1.6 mM DPPH were mixed, the mixture was put under darkness for 30 min. A517 nm was measured. The result was determined using Equation (2) [37].
Scavenging   percentage   % = 1 A s A b   A c × 100
where As: sample absorbance, Ab: blank (excluding DPPH), and Ac: negative control (excluding sample).

2.6.2. ABTS Radical Scavenging Assay

Prior to use, ABTS (2.45 mmol/L K2S2O8 and 7 mmol/L ABTS) was diluted with PBS (10 mmol/L, pH 7.4) until the absorbance reached approximately 0.7. Then, 0.5 mL of sample (or reference antioxidant: ascorbic acid) and 4.5 mL of ABTS were mixed. Then, the mixture was incubated for 6 min under darkness. A734 nm was measured. The result was calculated using Equation (2) [38].

2.6.3. Ferric Reducing Antioxidant Power Assay

A mixture containing 1 mL of sample (or ascorbic acid reference), 2.5 mL of phosphate buffer (pH 6.6), and 2.5 mL of 1% potassium ferricyanide (K3[Fe(CN)6]) was prepared. This solution underwent incubation at 50 °C for 20 min. Subsequently, 2 mL of 10% CCl3COOH was introduced, followed by centrifugation (5000 rpm, 5 min). To 4 mL of the resulting supernatant, 2 mL of 0.1% FeCl3 was added. Absorbance at 700 nm was recorded. Results were computed using AS (sample) minus Ab (blank).

2.7. Coriander Storage Experiment

Fresh coriander samples were divided into 7 portions, each approximately 500 g, and stored at 25 °C with 50–60% relative humidity (WS-A1, Tianjin Kehui Instrument Factory, Tianjin, China) for 6 days. One portion was taken daily to determine the polyphenol content and antioxidant capacity.

2.8. Statistical Analysis

Triplicate measurements were conducted for each trial, and the results are reported as the mean ± standard deviation. One-way ANOVA with Duncan’s multiple range test was performed using SPSS (version 25.0, IBM Corp., Armonk, NY, USA). The IC50 values for DPPH and ABTS were determined using OriginPro 9.1 (OriginLab Corporation, Northampton, MA, USA). The optimization of extraction methods and variables in relation to the response value, ANOVA, quadratic mathematical models, and optimal conditions was performed and determined using Design Expert, version 13.0 (Stat-Ease Inc., Minneapolis, MN, USA).

3. Results and Discussion

3.1. Single-Factor Experiment

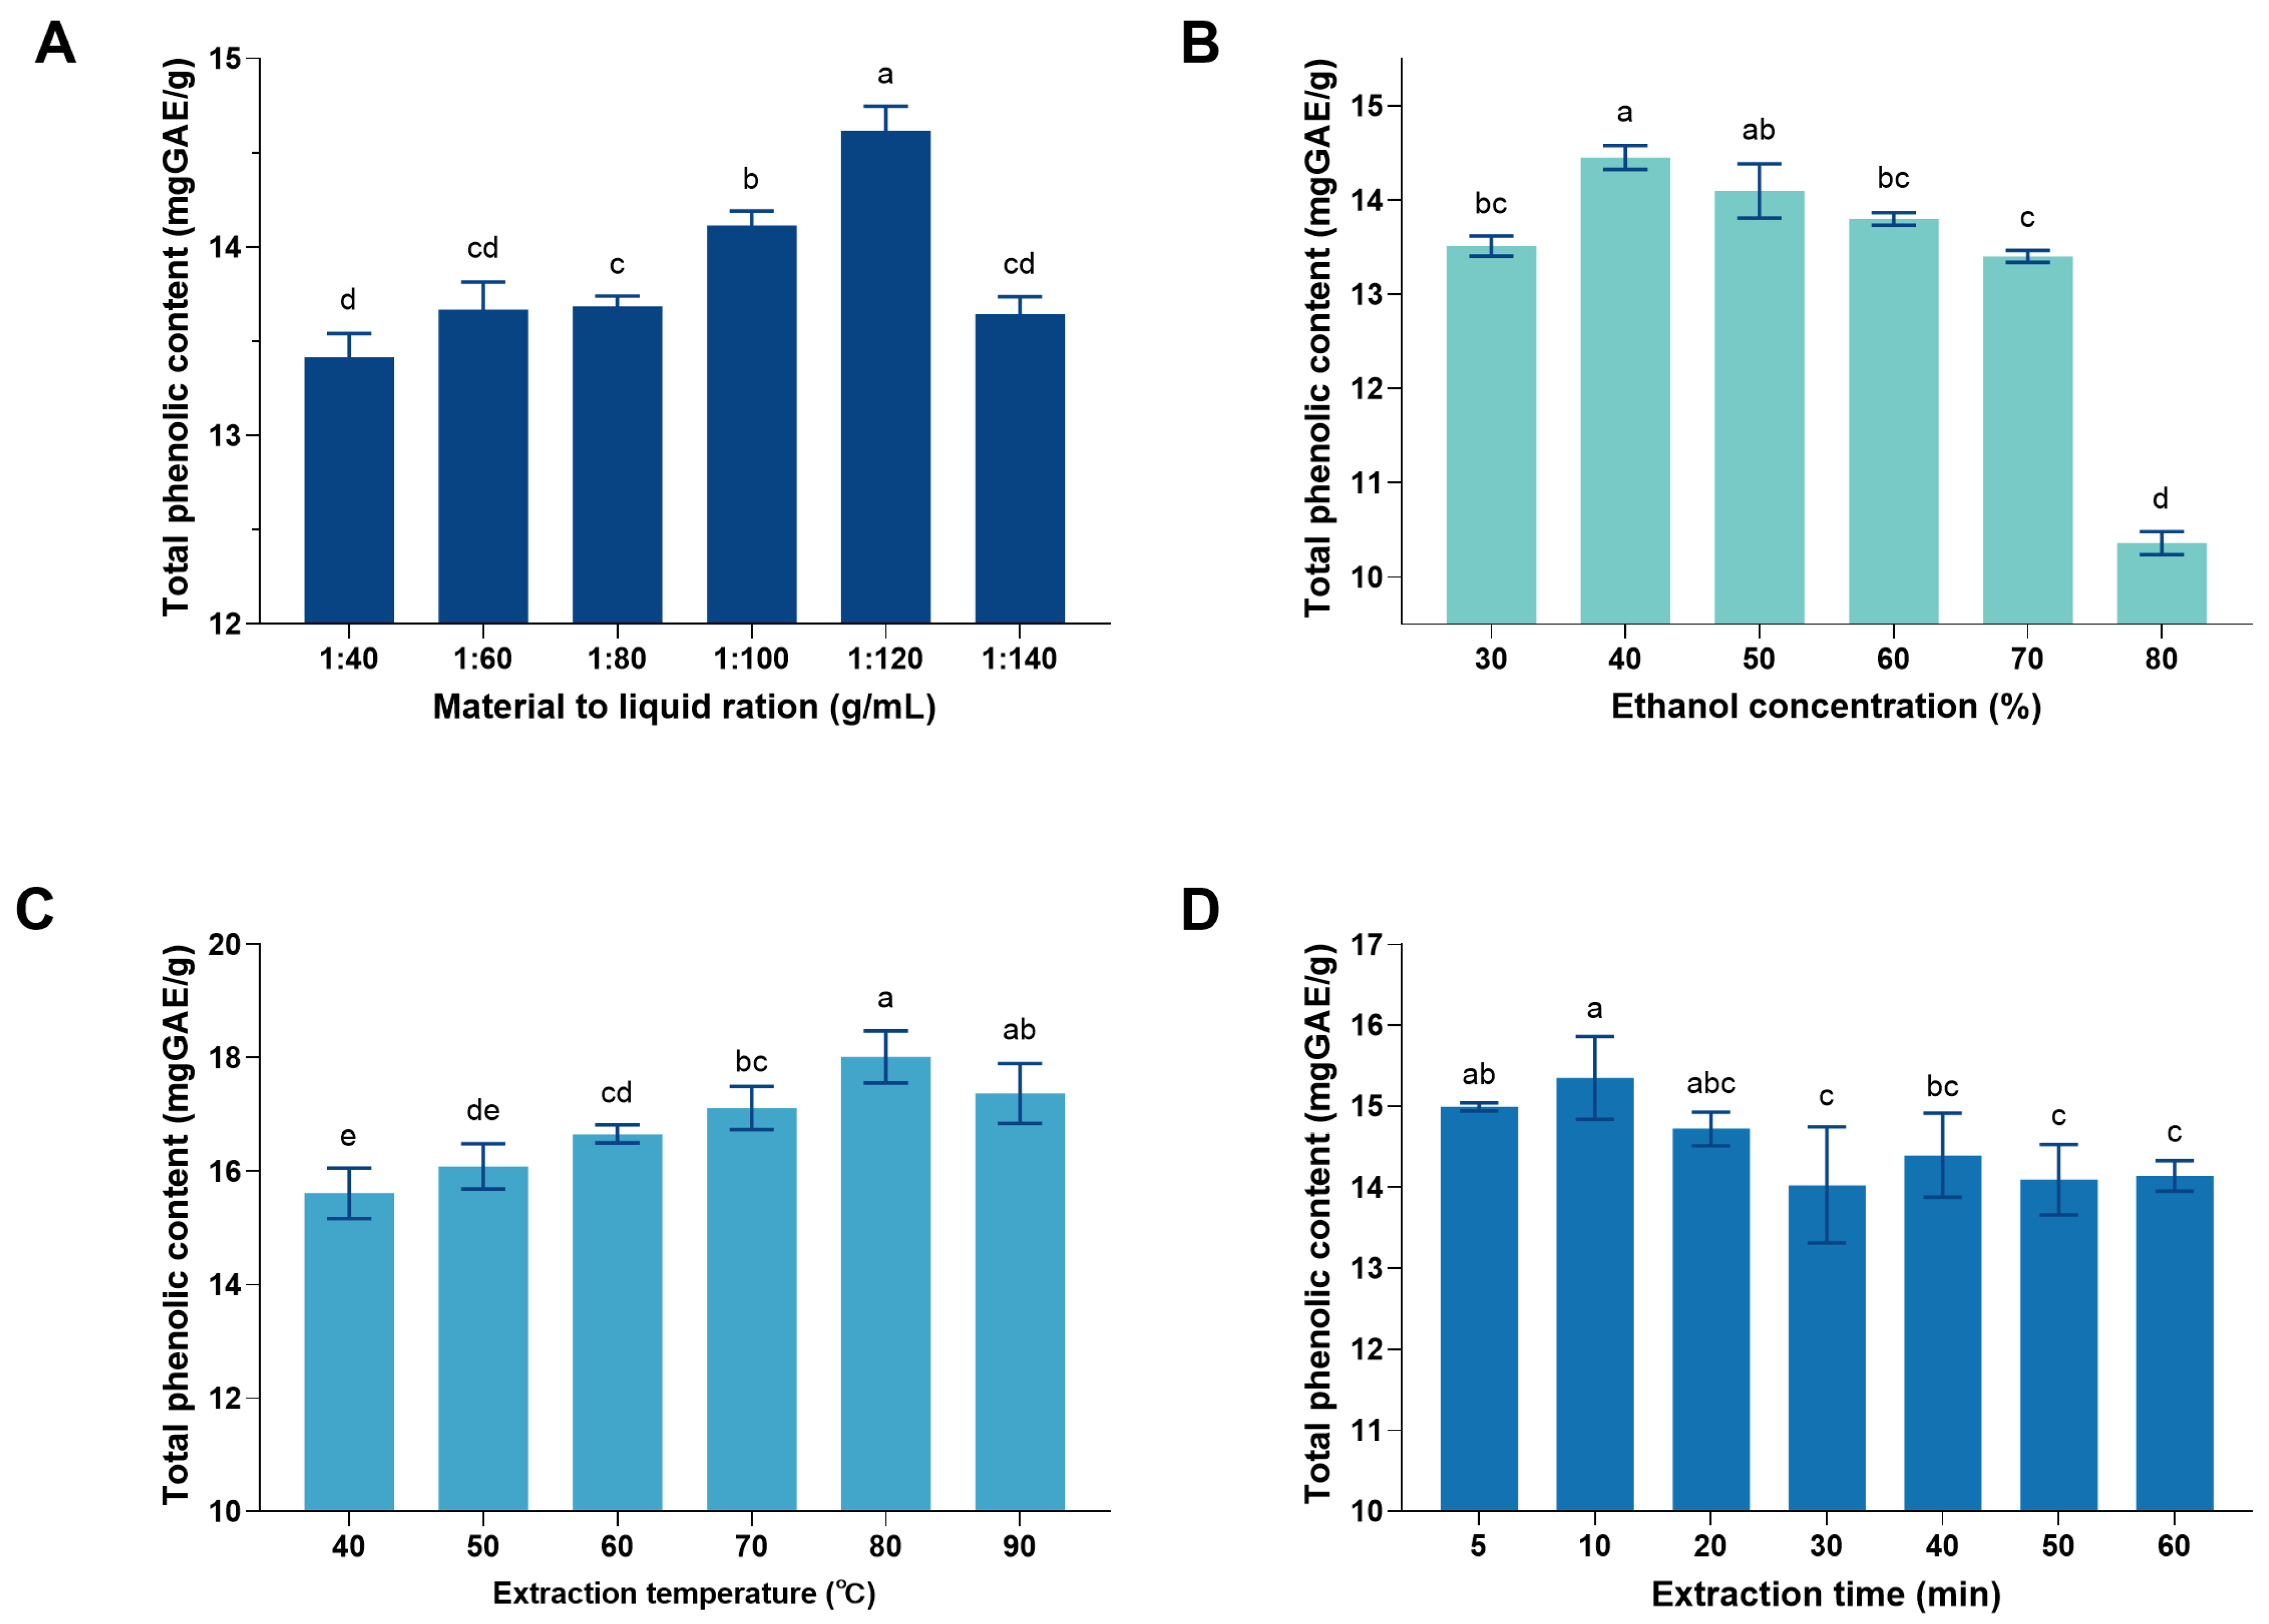
To investigate the effects of extraction conditions on the total phenolic content of coriander, this study examined four factors: material-to-liquid ratio, ethanol concentration, extraction temperature, and extraction time.
The material-to-liquid ratio is a key factor influencing the extraction process, as it regulates the concentration gradient between the solid and liquid phases, thereby determining the driving force for mass transfer. The results (Figure 2A) show that the total phenolic content first increases and then decreases with an increasing material-to-liquid ratio, reaching a maximum at 1:120 (g/mL). Initially, insufficient solvent volume led to incomplete extraction, while excessively high ratios may reduce extraction efficiency [39]. This phenomenon can be explained by the fact that an appropriate increase in solvent not only expands the contact area and enhances osmotic pressure but also reduces the viscosity of the solution, thereby accelerating the mass transfer rate and enhancing the ultrasonic cavitation effect. However, when the material-to-liquid ratio is too high, the penetration of ultrasonic waves may weaken, which can hinder the extraction process [40]. Considering these factors comprehensively, 1:120 was selected as the optimal material-to-liquid ratio to balance extraction efficiency and process economy.
As a polar solvent, ethanol can effectively dissolve and extract polyphenolic compounds from plant matrices [27]. As shown in Figure 2B, total phenolic content increases significantly as ethanol concentration rises from 30% to 40%, but decreases gradually when the concentration exceeds 40%. This phenomenon has two main causes. First, the presence of ethanol creates a concentration gradient inside and outside the cells, promoting the diffusion of polyphenols into the solvent. Second, ethanol disrupts the binding between polyphenols and the plant matrix, thereby enhancing extraction efficiency. However, an excessively high ethanol volume fraction alters the solvent’s polarity, reducing its ability to dissolve highly polar polyphenols and negatively affecting the extraction outcome. In summary, a 40% ethanol volume fraction is optimal, consistent with the “like dissolves like” principle, where a suitable ethanol concentration effectively dissolves and extracts polyphenolic compounds [41].
With the increase in extraction temperature, the total phenolic content continuously rises, reaching a peak at 80 °C. Further temperature increases may cause oxidation or degradation of phenolic compounds, leading to a decrease in their content (Figure 2C). This is mainly because higher temperatures accelerate the movement of phenolic compounds and solvent molecules, thereby enhancing extraction efficiency [42,43]. However, excessively high temperatures may cause structural damage to target components and solvent evaporation, negatively affecting the extraction process. Based on these considerations, 80 °C was selected as the ultrasonic extraction temperature for subsequent experiments.
Regarding the extraction time, the results show that the total phenolic content reaches its highest level at 10 min (Figure 2D). This indicates that a moderate duration of ultrasonic treatment facilitates the diffusion and release of polyphenols, whereas excessively long treatment may cause degradation of phenolic compounds and thus reduce extraction yield [44]. Therefore, 10 min was ultimately determined to be the optimal ultrasonic extraction time.
Based on these findings, material-to-liquid ratio, ethanol concentration, extraction temperature, and extraction time were identified as significant factors influencing phenolic extraction from coriander and were selected for subsequent optimization using response surface methodology.

3.2. Box–Behnken Experiment

3.2.1. Establishment of Regression Equation and ANOVA

Based on the results of the single-factor experiments, ethanol concentration (X1), material-to-liquid ratio (X2), extraction temperature (X3), and extraction time (X4) were selected as the extraction factors for the Box–Behnken design. This experimental design consisted of 29 runs, and the response values (Y: total phenolic content from CSPCs) are shown in Table 3.
The data in Table 3 were subjected to regression analysis using Design Expert 13.0 software, resulting in the following objective function with the total phenolic content of coriander (Y) as the response variable:
Y = 16.52 + 0.0169X1 + 0.0254X2 + 0.0414X3 − 0.0071X4 + 0.0100X1X2 − 0.0047X1X3 + 0.0190X1X4 − 0.0272X2X3 − 0.0110X2X4 − 0.0067X3X4 − 0.1127X12 − 0.1512X22 − 0.1980X32 − 0.1518X42.
The ANOVA and regression coefficients for the examined model are summarized in Table 4. The results indicate that, during the extraction process, the total phenolic content (Y) is significantly influenced by the independent variables within the experimental range in a linear manner. The F-test shows a high F-value of 33.41 with an extremely low p-value (p < 0.0001), demonstrating the model’s high significance. The lack-of-fit p-value is 0.0824, indicating a good model fit. This model is highly reliable for predicting the polyphenol content in CSPCs, with a coefficient of determination (R2) close to 1 at 0.9709 and an adjusted R2 of 0.9419. The low coefficient of variation (C.V. = 0.1921%) further confirms the accuracy and reliability of the experimental results.
Through the experimental design optimization of ethanol concentration, extraction temperature, material-to-liquid ratio, and extraction time, the corresponding data were analyzed. The significance of the quadratic regression coefficients indicates that the material-to-liquid ratio (p < 0.05) and extraction temperature (p < 0.01) have significant effects on the extraction of polyphenols from coriander. The interaction terms do not have significant effects on the extraction. The quadratic terms X12, X22, X32, and X42 (p < 0.0001) have extremely significant effects on coriander polyphenol extraction. The order of factors influencing the extraction of coriander polyphenols is as follows: X12, X22, X32, X42 > X3 > X2 > X1 > X2X3 > X1X4 > X4 > X2X4 > X1X2 > X3X4 > X1X3.
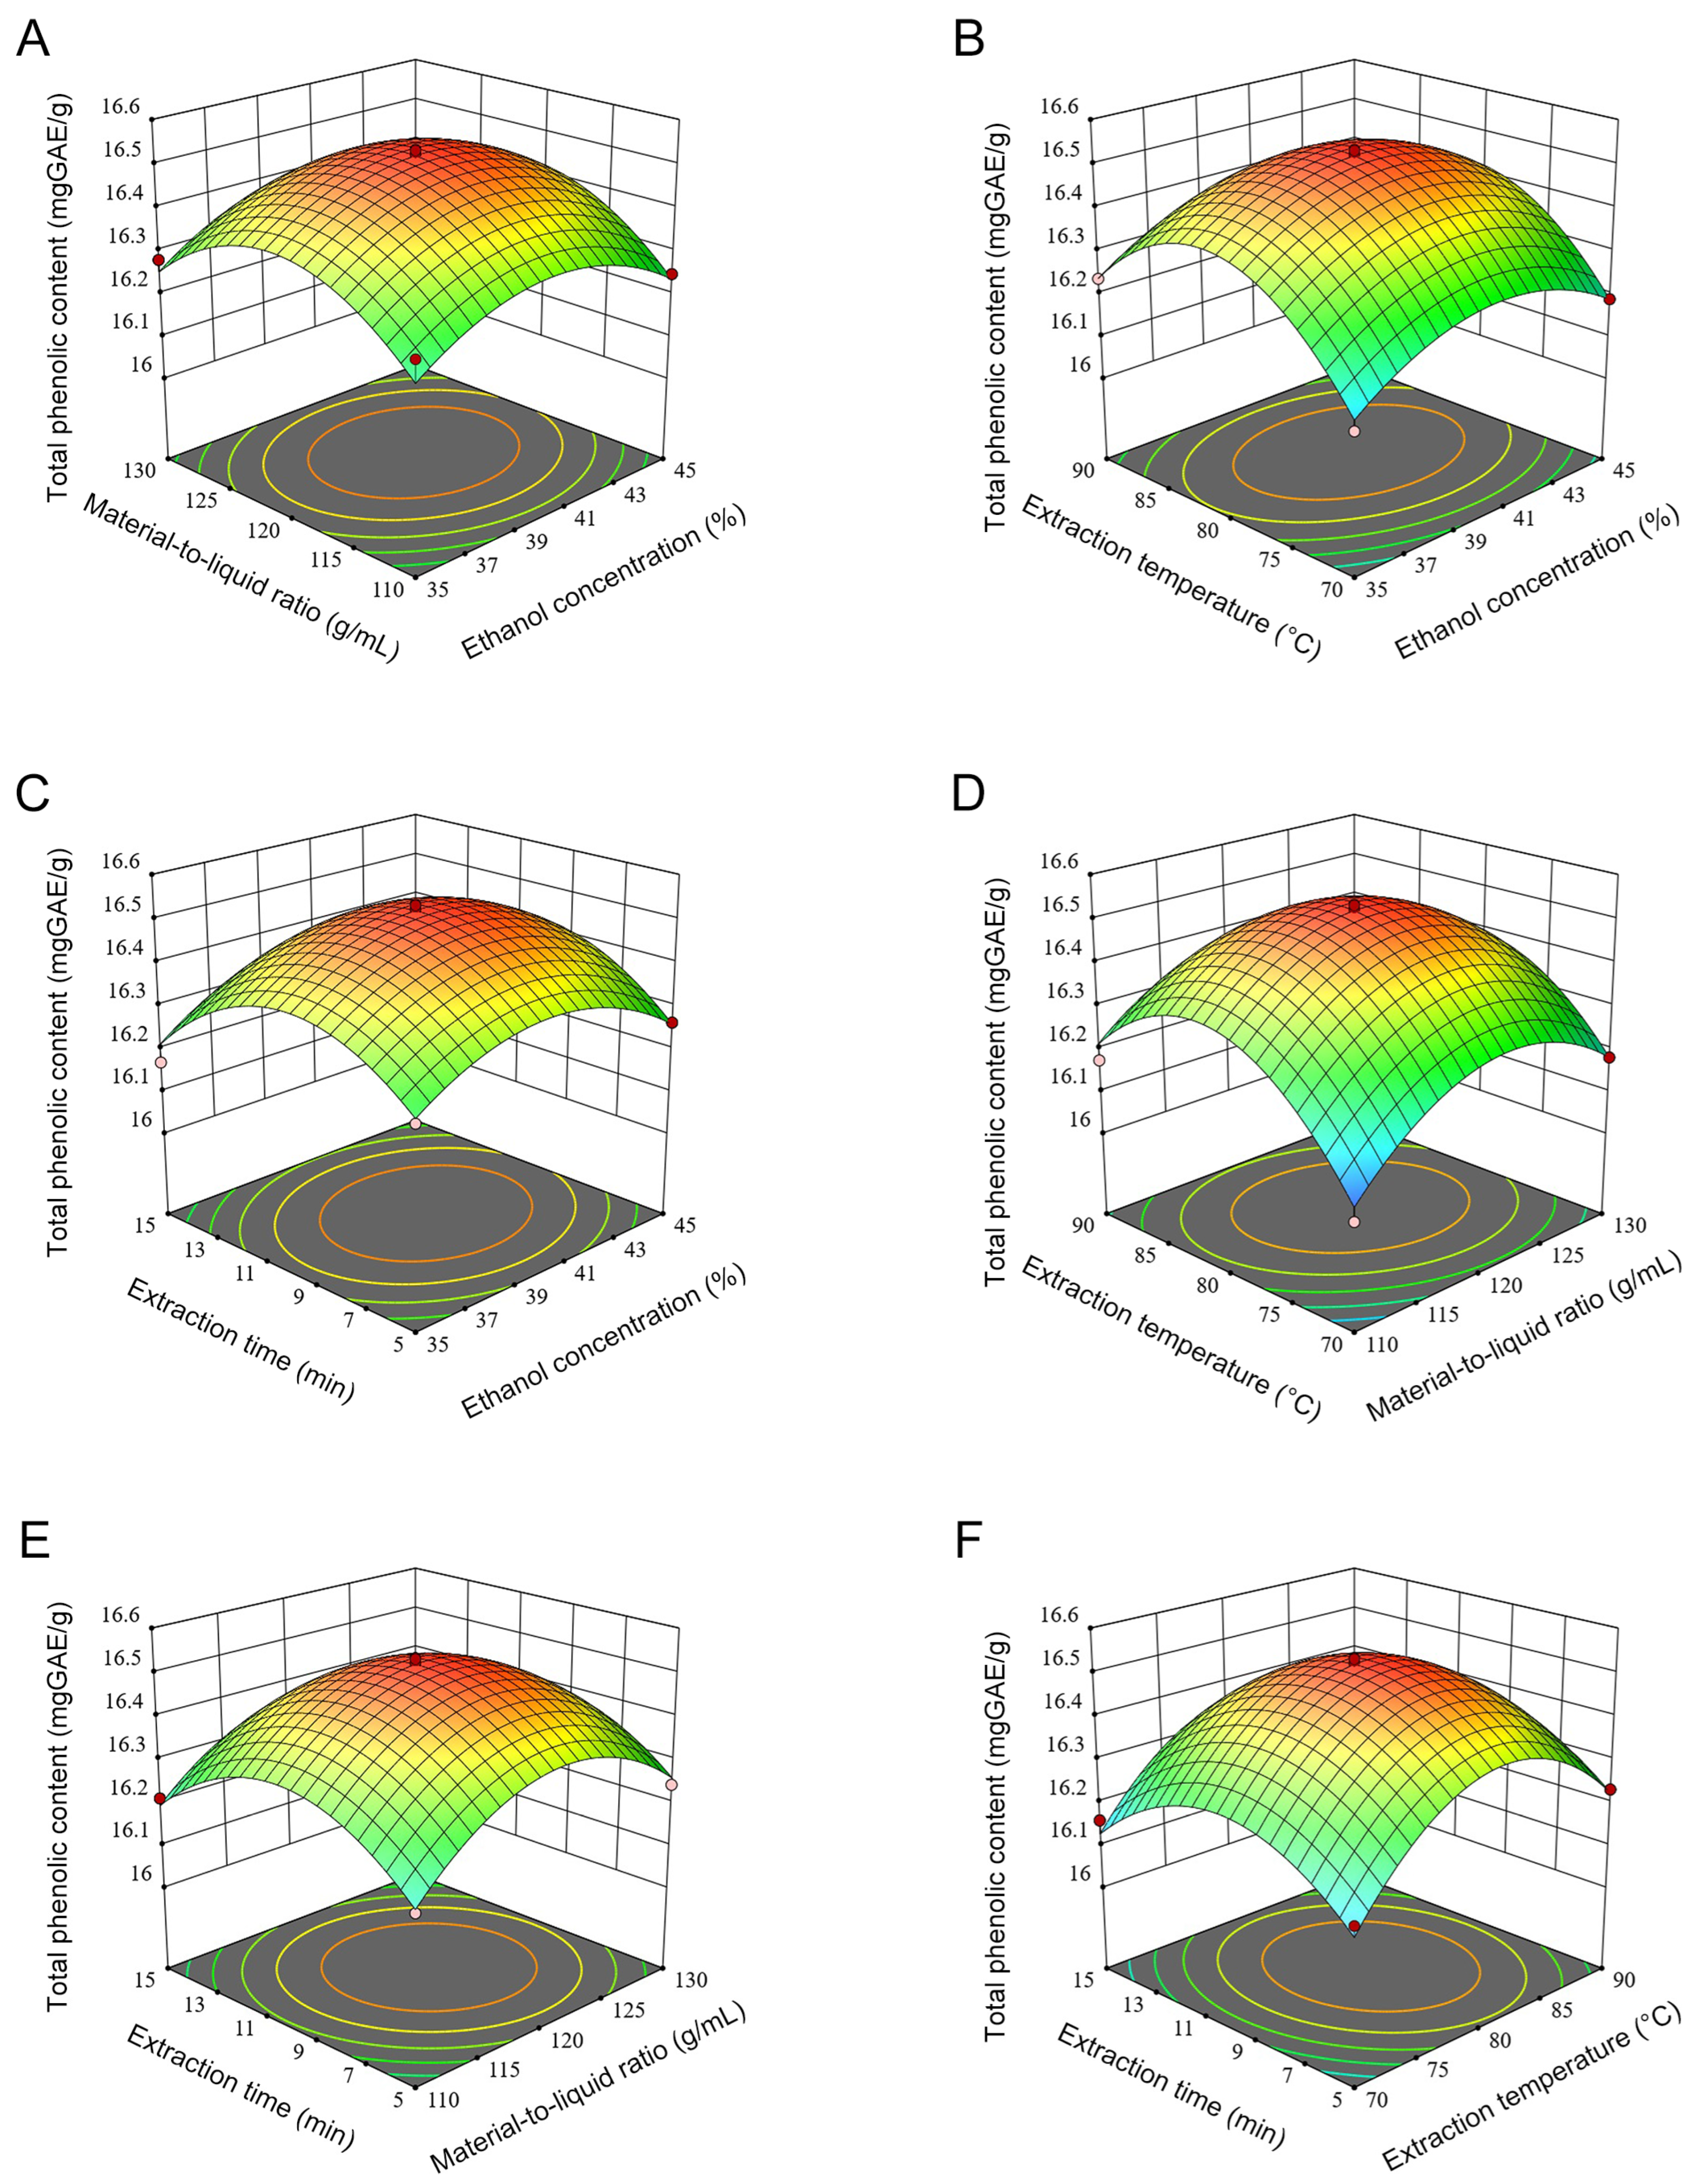
Figure 3 presents response surface plots based on the regression model; these plots intuitively illustrate the effects of different variables on the total polyphenol content of coriander. The plots show that the interaction between the material-to-liquid ratio and extraction temperature is the most significant, followed by the interaction between ethanol concentration and extraction time, while the interaction between ethanol concentration and extraction temperature is the least significant.
Specifically, Figure 3A,D,E depict the interactions between the material-to-liquid ratio and the ethanol concentration, extraction temperature, and extraction time, respectively. These figures reveal clear nonlinear effects and optimal ranges for these factors. For instance, excessively high or low material-to-liquid ratios lead to decreased polyphenol content, underscoring the critical role of this ratio in regulating extraction efficiency. Figure 3B,F demonstrate the synergistic effects of ethanol concentration with extraction temperature and time, respectively, emphasizing the complex interplay between solvent concentration and thermal conditions. An appropriate temperature range can effectively promote polyphenol release while preventing component degradation from excessive heat. Figure 3C illustrates the interaction between ethanol concentration and extraction time. It shows that prolonging extraction time within a certain concentration range offers limited improvement in polyphenol content. Excessively long extraction times may reduce the yield.
These response surface plots clearly reveal the key factors affecting coriander polyphenol extraction and their interactions, providing important theoretical foundations and practical guidance for subsequent process optimization and parameter control.

3.2.2. Verification of the Extraction Conditions Provided by the Predictive Model

To assess the regression model’s predictive accuracy against actual experimental outcomes, coriander total polyphenol content served as the validation metric. The model identified optimal preparation parameters for maximizing total polyphenol content: an ethanol concentration of 40.376%, a material-to-liquid ratio of 1:120.786 (g/mL), an extraction temperature of 80.984 °C, and an extraction time of 9.884 min. For practical experimental implementation, slightly adjusted conditions were tested: 40% ethanol, a 1:121 (g/mL) ratio, 81 °C, and 10 min. Five replicate experiments under these practical settings produced an average extraction yield of 16.231 GAE mg/g. This empirical result closely aligns with the model’s theoretical prediction of 16.523 GAE mg/g, differing by less than 2%.
Sriti et al. used a stirring extraction method (1 g sample, 10 mL methanol, 30 min) to determine the polyphenol content of Tunisian and Canadian coriander samples, with TPC values of 15.16 mg GAE/g and 12.10 mg GAE/g, respectively [45]. Gallo et al. obtained a TPC value of 0.4181 mg GAE/g (dry weight) using ultrasound-assisted extraction (3 g sample, 30 mL 50% ethanol, room temperature, 30 min) [21]. The TPC values reported in these studies are all lower than those found in the present study. Considering the significant varietal differences among coriander samples from different origins that may introduce systematic errors, this study used the same batch of raw material for parallel comparison between Gallo’s method and the optimized method. The method used follows that of Gallo et al. (3 g sample, 30 mL 50% ethanol, room temperature, 30 min), yielding a TPC of 7.402 ± 0.21 mg GAE/g (n = 3). In contrast, the optimized process (40% ethanol, 1:121 g/mL, 81 °C, 10 min) achieved 16.231 ± 0.18 mg GAE/g, representing an increase of 119.28% compared to Gallo’s method. This improvement significantly exceeds yields from prior methodologies [21]. Consequently, the Box–Behnken design successfully optimized the extraction process, establishing a dependable framework for industrial-scale applications.

3.3. Identification of Polyphenolic Compounds in CSPCs by UPLC-Q Exactive HF Orbitrap-MS

Comprehensive profiling of the constituents in CSPCs was conducted using UPLC-Q Exactive HF Orbitrap-MS, with total ion chromatograms (TICs) acquired in both positive and negative ionization modes (Supplementary Figure S1). This thorough analysis led to the identification of 50 polyphenolic compounds within CSPCs. Among these, nine compounds—quercetin, quercetin 3-O-β-D-glucuronide, rutin, kaempferol, kaempferol 3-glucorhamnoside, isoquercitrin, chlorogenic acid, p-coumaric acid, and ferulic acid—were previously reported (denoted by superscript a in Table 5). The remaining 41 compounds, including nicotiflorin, esculin, and 1-caffeoylquinic acid (denoted by superscript b in Table 5), are newly identified in CSPCs. As summarized in Table 5, these 50 polyphenolic constituents comprise 7 flavonoids, 14 flavonols, 1 flavanol, 16 phenolic acids, 3 biflavonoids, 1 dihydrochalcone, and 8 other polyphenolic compounds.
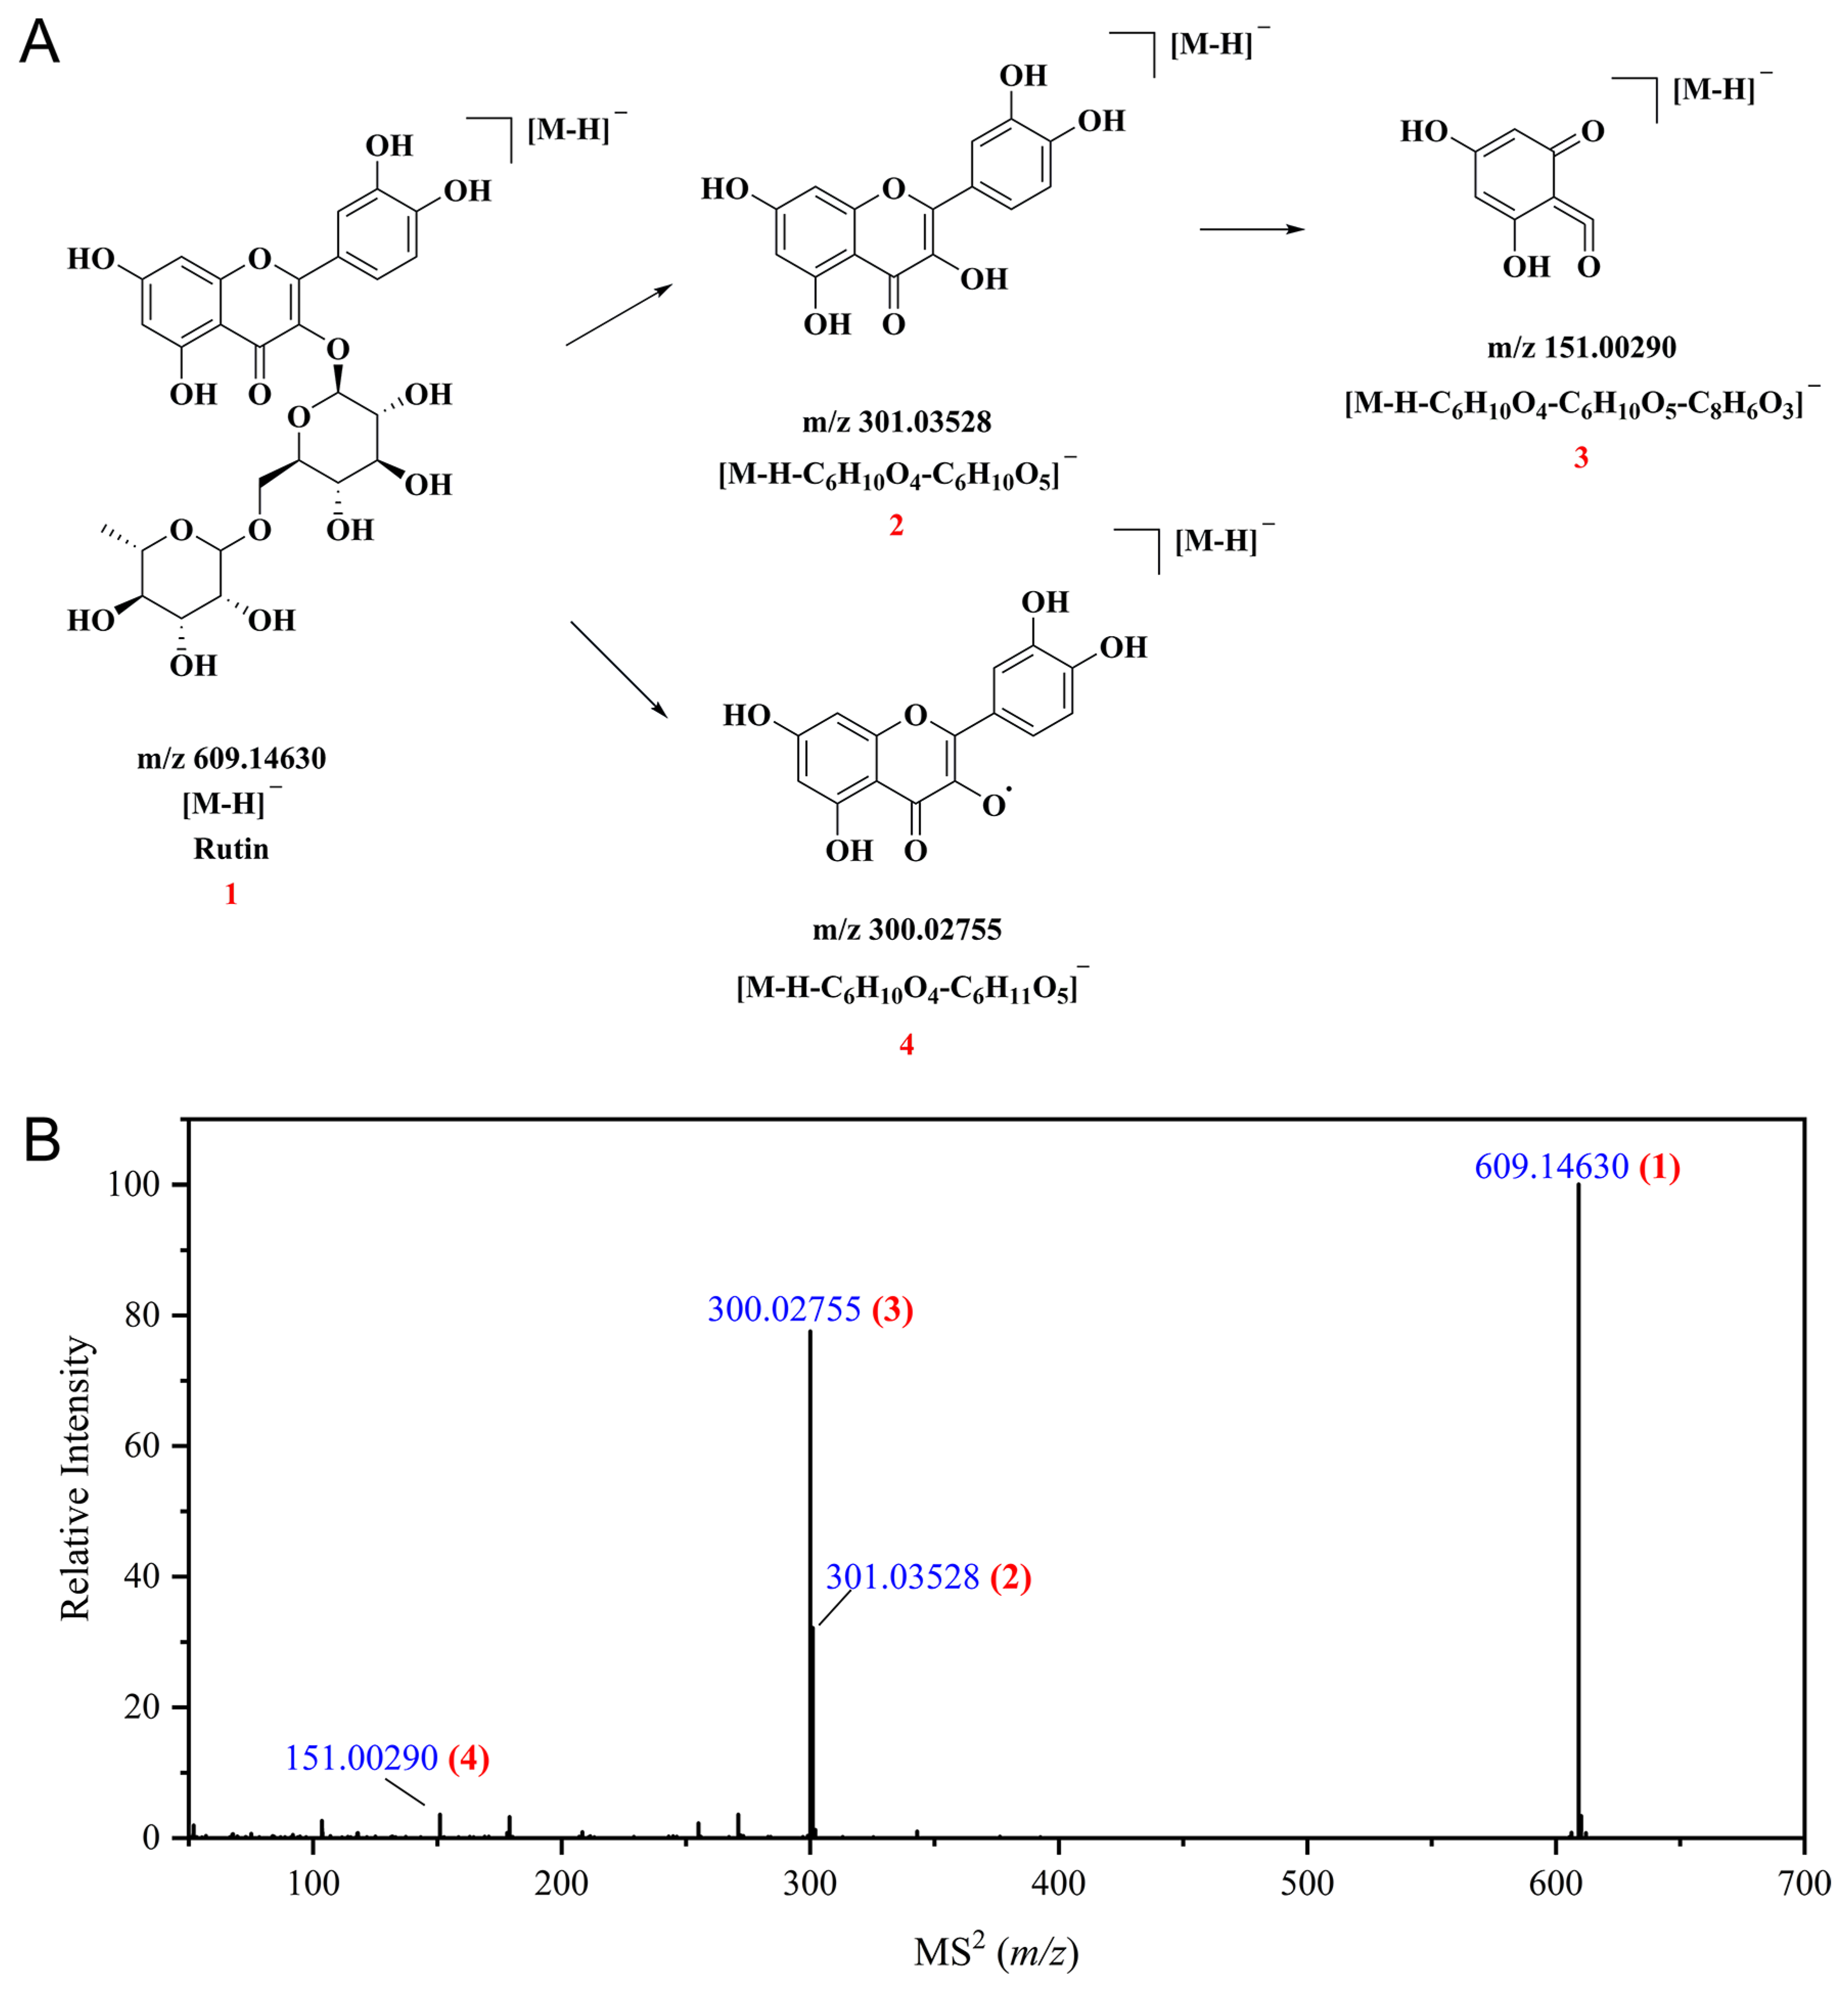
Rutin is a flavonoid compound characterized by a polyphenolic structure based on a 2-phenylchromone core, with a fundamental carbon skeleton of the C6-C3-C6 configuration. Its structural feature is that the hydroxyl group at position 3 of the quercetin molecule is linked to a rutinose. The Retro-Diels–Alder (RDA) reaction is one of the common and important fragmentation pathways for flavonoids. In negative ion mode, the precursor ion [M-H] of rutin was detected at m/z 609.14630 (1). Upon loss of the rutinose moiety, fragment ions at m/z 301.03528 (2, [M-H-C6H10O4-C6H10O5]) and m/z 300.02755 (4, [M-H-C6H10O4-C6H11O5]) were generated. Fragment ion 2 further undergoes the RDA reaction, producing a characteristic fragment ion at m/z 151.00290 (3, [M-H-C6H10O4-C6H11O5-C8H6O3]). The related MS2 spectrum and the proposed fragmentation pathway are shown in Figure 4.
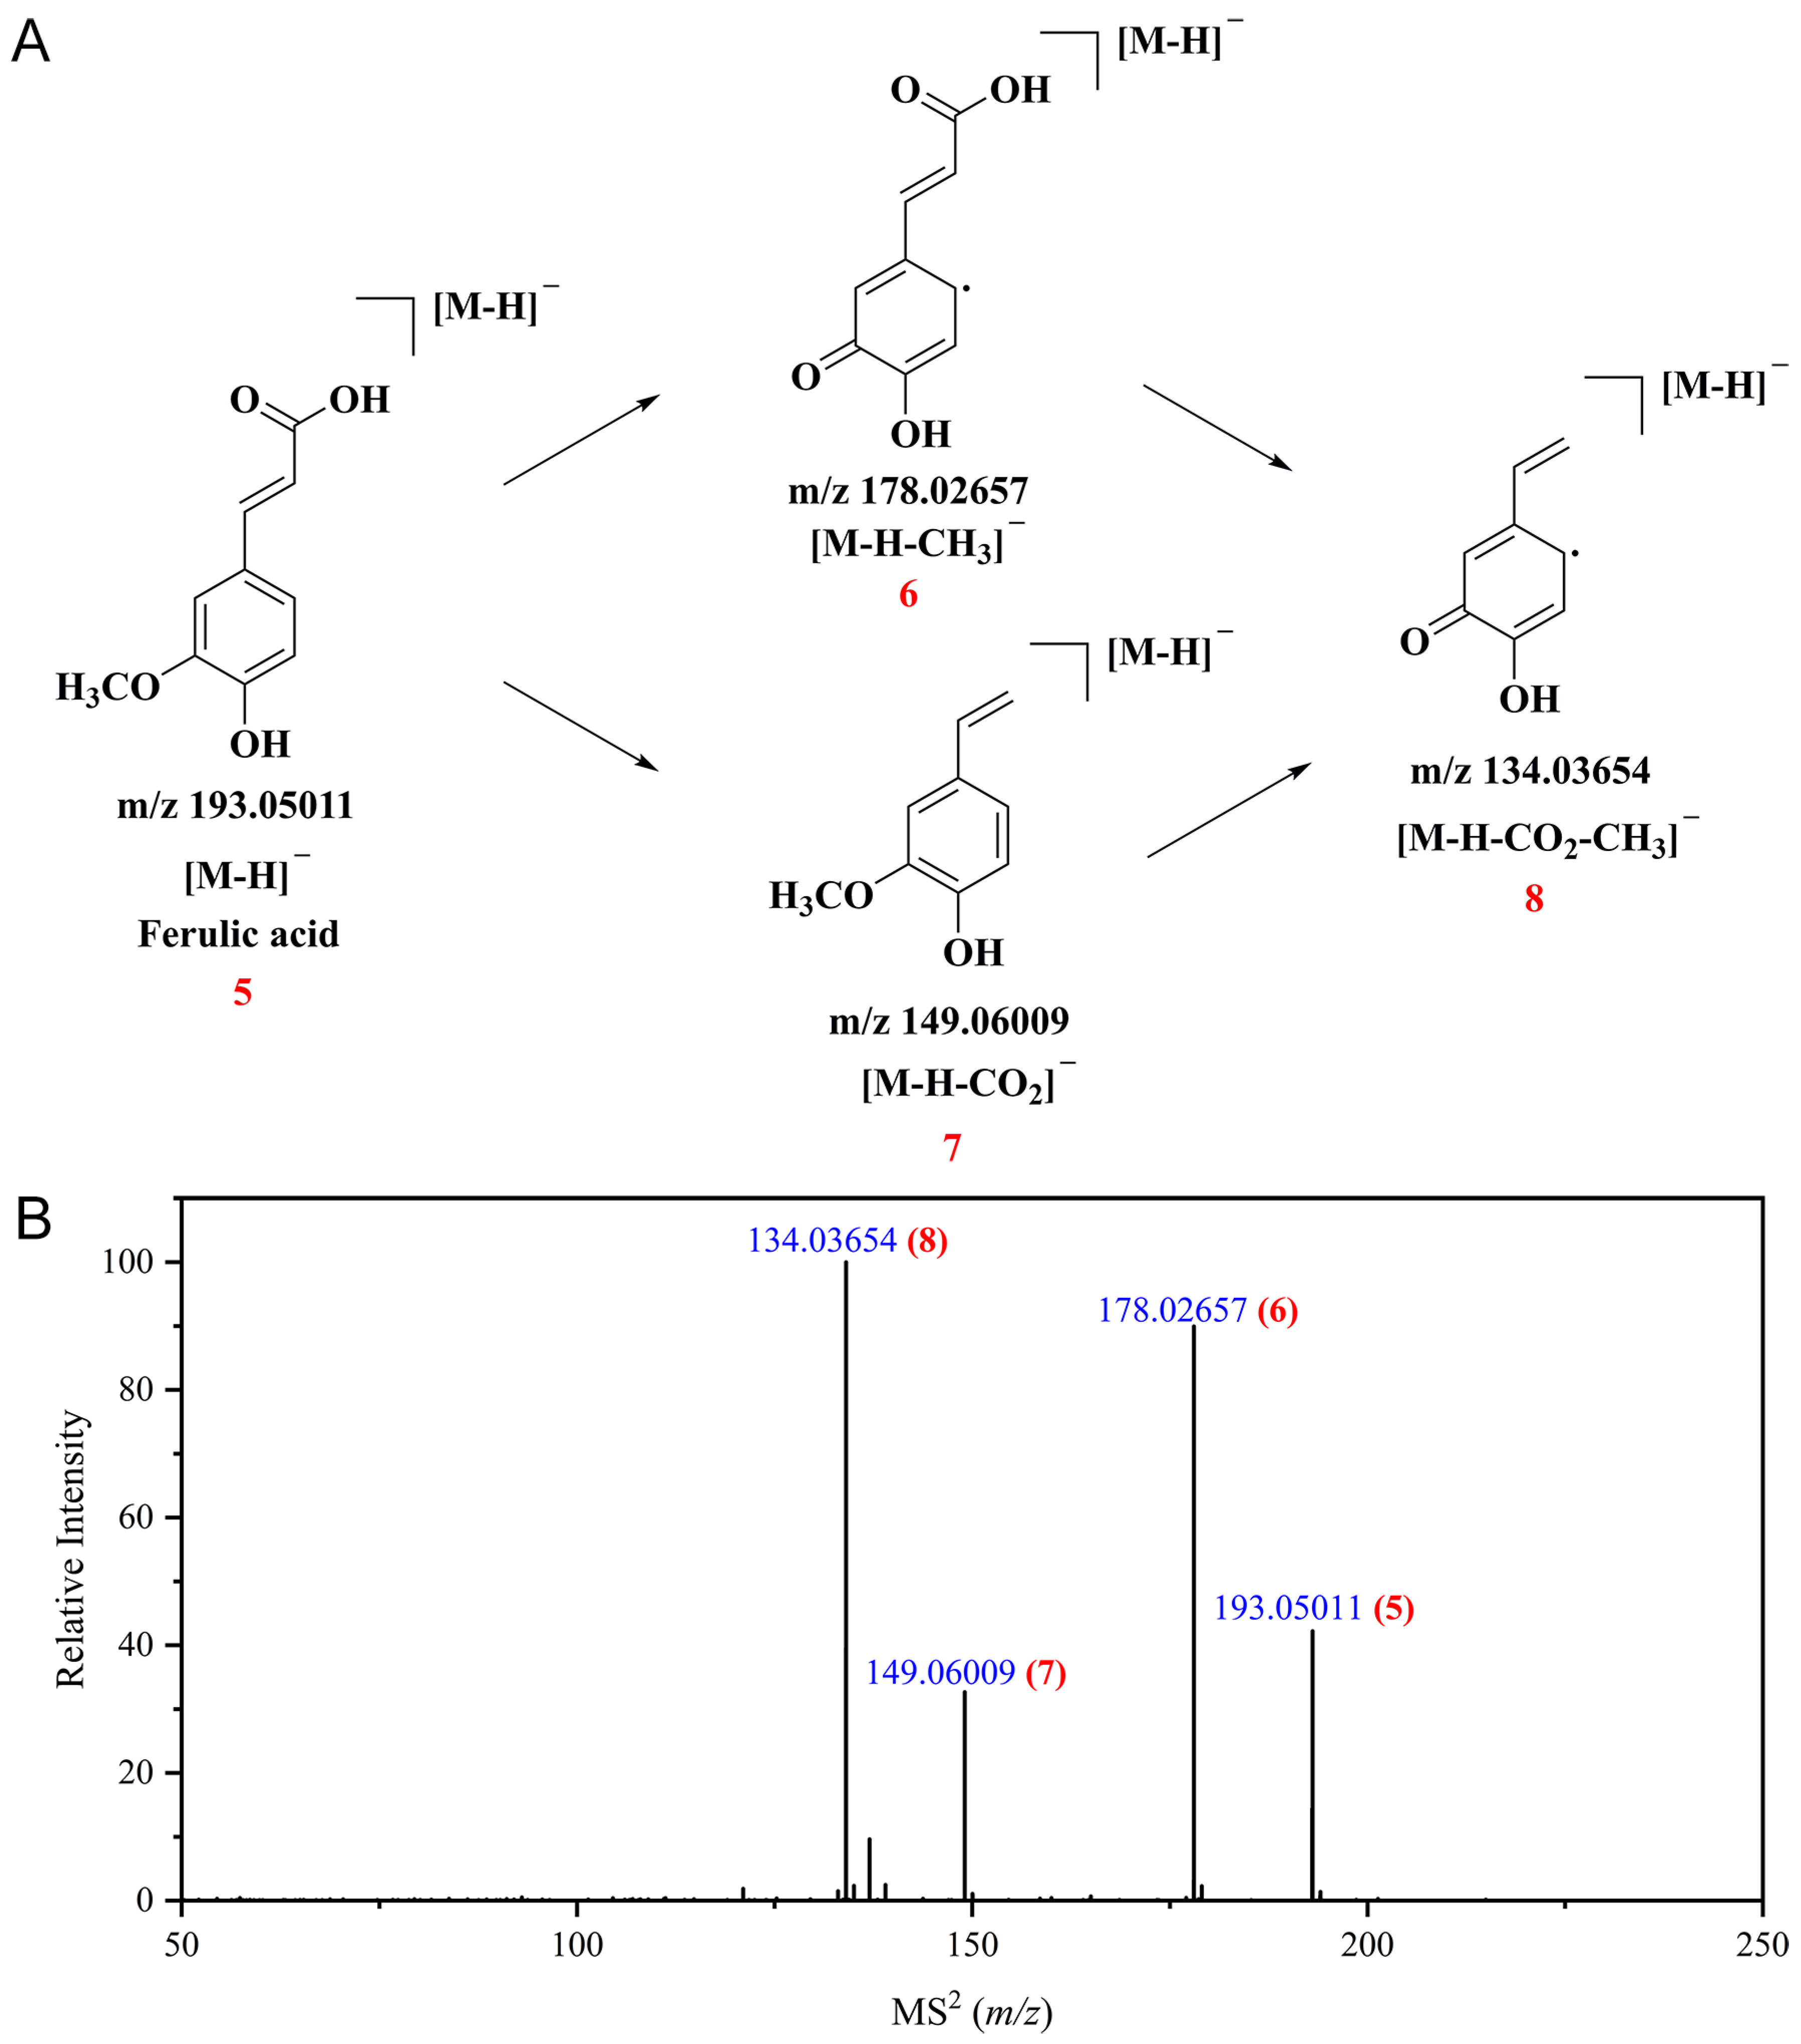
Ferulic acid is classified as a hydroxycinnamic acid derivative. In negative ion mode, the precursor ion [M-H] of ferulic acid was detected at m/z 193.05011 (5). The precursor ion loses a methyl group (CH3) or a carbon dioxide molecule (CO2), generating fragment ions at m/z 178.02657 (6, [M-H-CH3]) and m/z 149.06009 (7, [M-H-CO2]), respectively. Subsequently, fragment ions 6 and 7 undergo further fragmentation: fragment ion 6 loses a CO2 molecule, while fragment ion 7 loses a CH3 group, both producing the same fragment ion 8 (m/z 134.03654, [M-H-CO2-CH3]). The related MS2 spectrum and the proposed fragmentation pathway are shown in Figure 5.

3.4. Polyphenol Profiling and Quantitative Validation

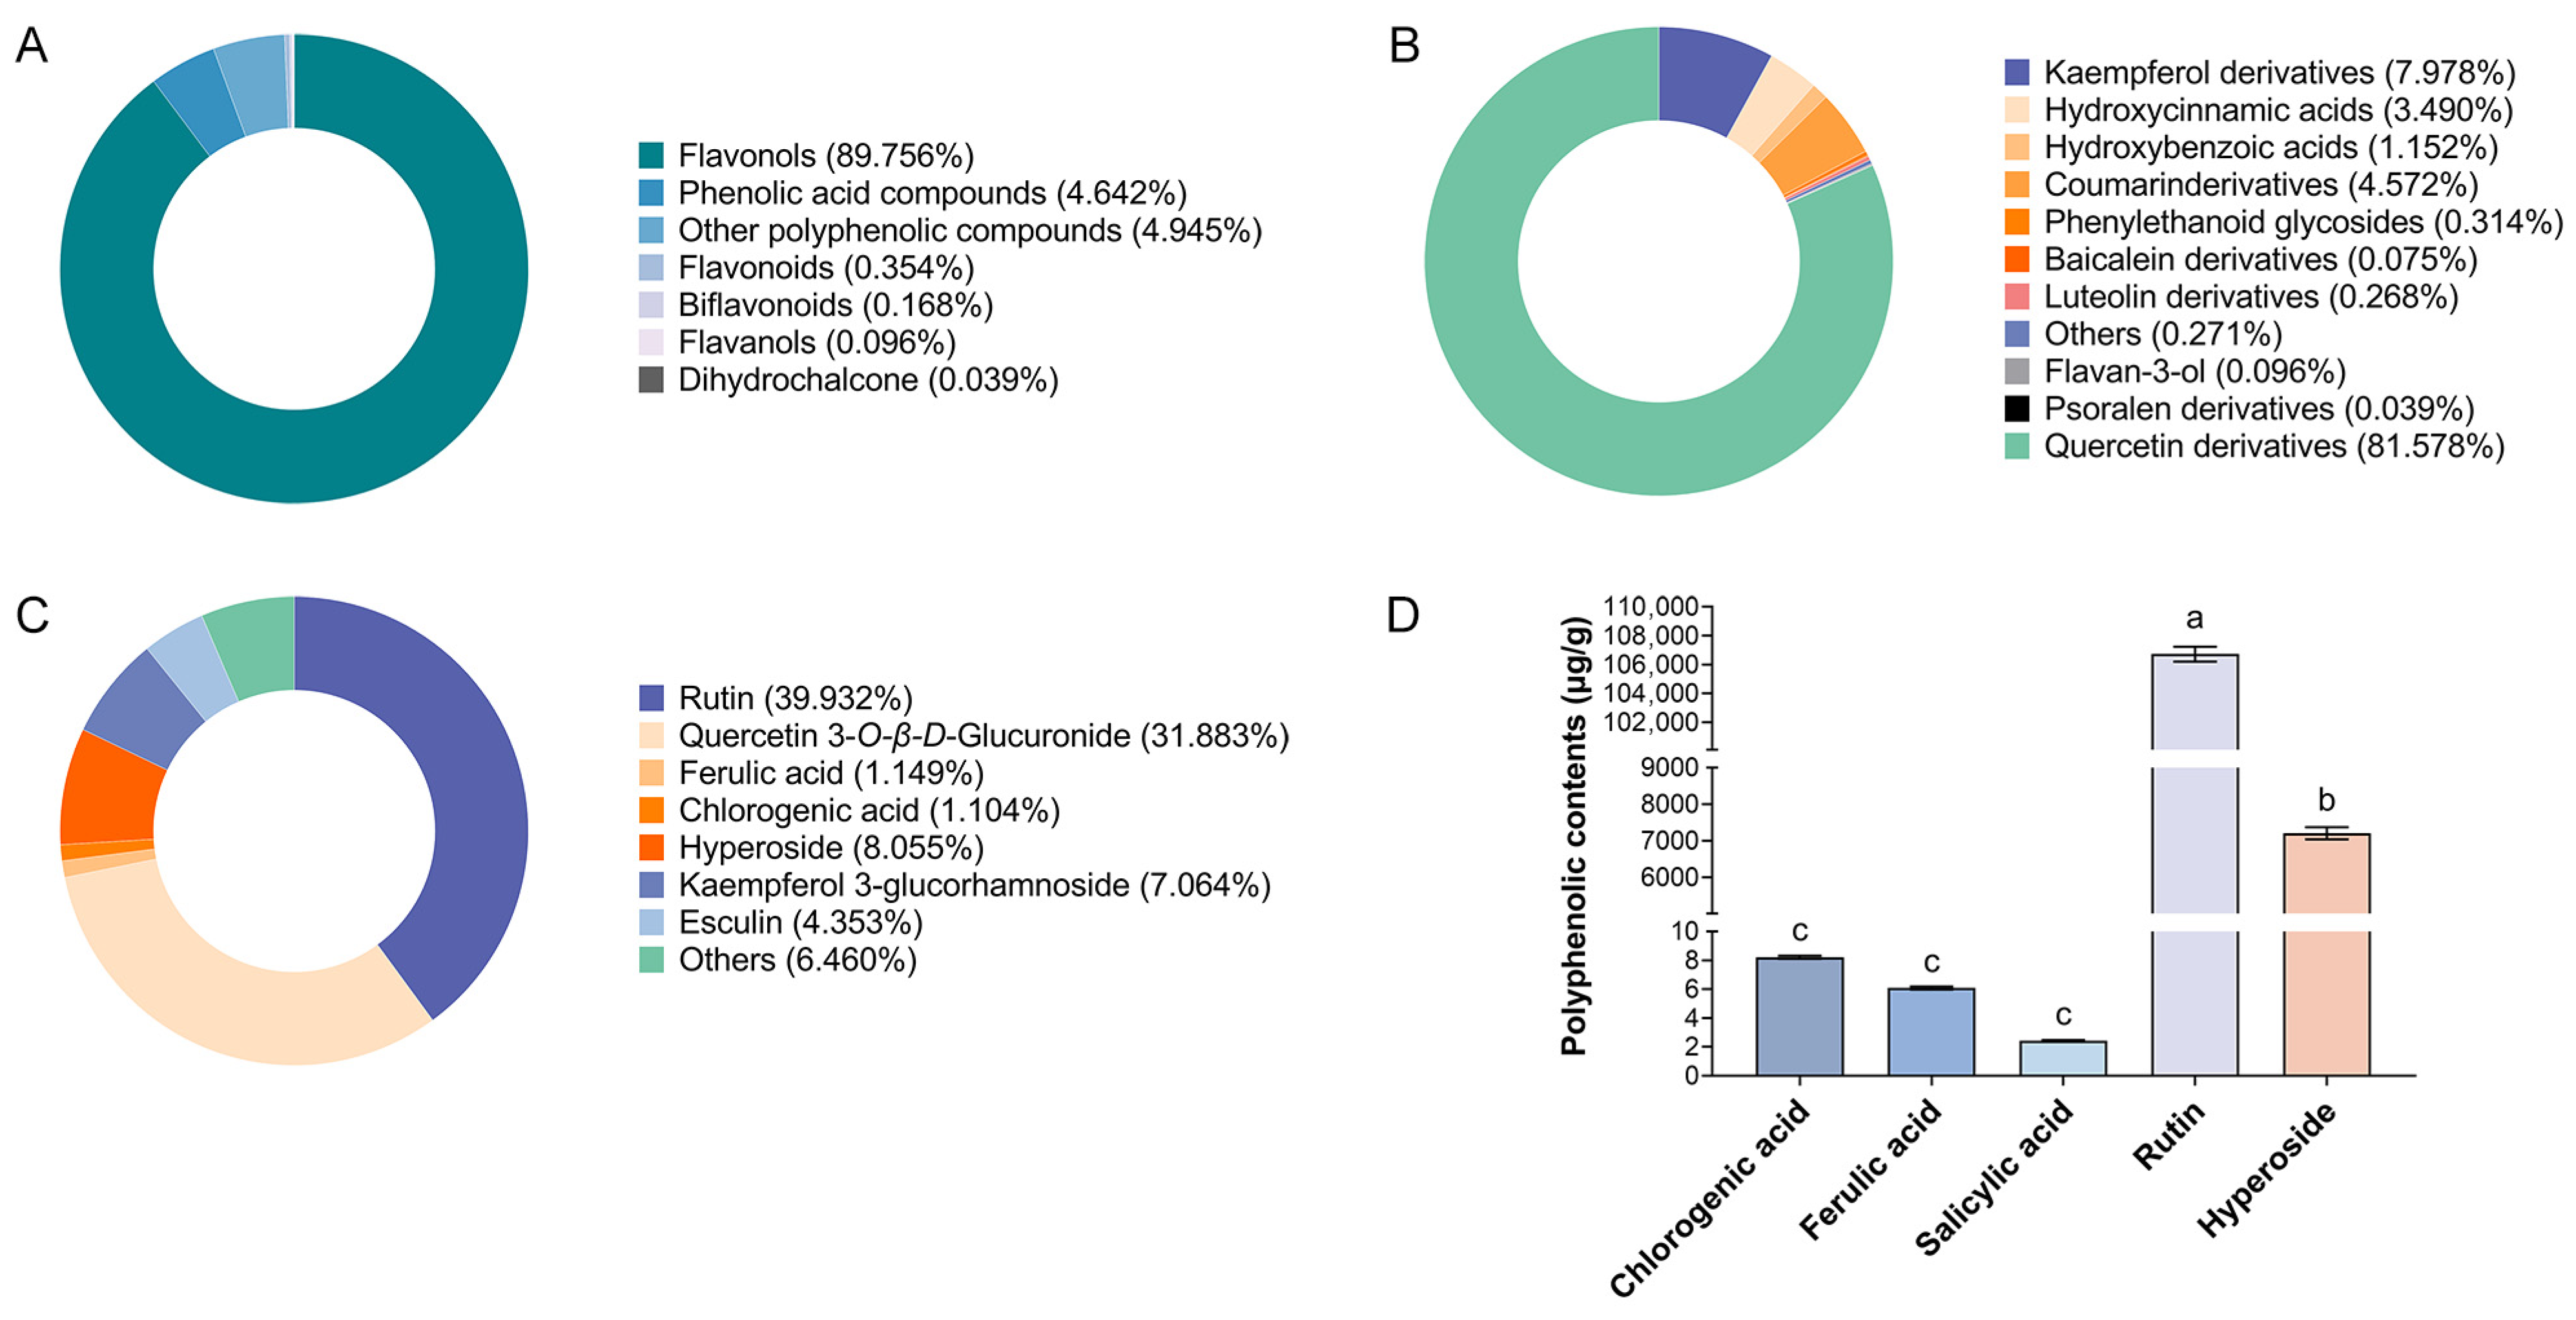
In non-target analysis, relative content is commonly used to preliminarily characterize the relative levels of different compounds [47,48]. As shown in Figure 6A, polyphenols in coriander are dominated by flavonols (accounting for 89.756%), followed by phenolic acids (4.642%), while other types account for a lower proportion. Further subclassification (Figure 6B) reveals that quercetin derivatives have the highest content, followed by kaempferol derivatives and others. Figure 6C lists seven major compounds with relative content greater than 1%, including rutin, quercetin 3-O-β-D-glucuronide, hyperoside, and others. These results are consistent with the literature: Scandar et al. reported that the main polyphenols in coriander include rutin, quercetin, kaempferol, hyperoside, ferulic acid, and chlorogenic acid [7]; Ohara et al. identified eight compounds, including rutin, tryptophan, and phenylalanine [6].
It should be noted that the “relative content” data used in this study is essentially based on the relative abundance calculated from chromatographic peak areas. Due to significant differences in response factors of various compounds in the LC-MS/MS system, this relative content only reflects the relative instrument response intensity among compounds (i.e., the relative signal strength), and its accuracy cannot be equated with absolute quantification based on standards [47,48]. Therefore, a compound with a relative content of 20% may actually have a lower concentration than a compound with a relative content of 10%. Given this limitation, relative content analysis should be interpreted with caution, and its primary value lies in providing an overall overview and classification information of compound distribution within the sample.
To obtain benchmark concentration values for key components, this study selected five polyphenols for absolute quantification based on literature reports [6,7], preliminary experimental results, and the availability of commercial standards: rutin, hyperoside, chlorogenic acid, ferulic acid, and salicylic acid (Figure 6D, MRM chromatogram in Supplementary Figure S2). The results showed that the content of rutin was significantly higher than that of the other four compounds (p < 0.05), followed by hyperoside. Notably, this concentration ranking is consistent with the trend observed in the relative content analysis (Figure 6C), supporting the reliability of the non-targeted approach in identifying major components.

3.5. Antioxidant Activities

The DPPH test is a commonly used approach to assess the antioxidant efficacy of plant-derived extracts [49]. Figure 7A presents an overview of the DPPH scavenging activity of CSPCs, demonstrating a concentration-dependent pattern for both CSPCs and ascorbic acid. Within the tested range—19.92–637.50 µg/mL for CSPCs and 3.91–125.00 µg/mL for ascorbic acid—the scavenging rates varied from 23.41 ± 0.02% to 90.05 ± 0.01% for CSPCs and 14.78 ± 0.01% to 94.63 ± 0.69% for ascorbic acid. Their IC50 values were recorded at 73.43 µg/mL and 30.45 µg/mL, respectively.
ABTS radical scavenging activity reflects the hydrogen-donating and chain-breaking capacity of samples [50,51]. The ABTS radical scavenging activity of CSPCs is summarized in Figure 7B. CSPCs showed a dose-dependent ABTS radical scavenging capacity within the tested concentration range. At concentrations of 19.92–637.5 µg/mL, the scavenging effects of CSPCs on ABTS radicals ranged from 20.53 ± 0.74% to 99.40 ± 0.01%. The IC50 value of CSPCs in scavenging ABTS radicals was found to be 82.15 μg/mL, which was lower than that of ascorbic acid (107.84 μg/mL). The results demonstrated that CSPCs had a significant ability to scavenge ABTS radicals.
The ferric reducing antioxidant power (FRAP) measures the ability of antioxidants to reduce ferric ions (Fe3+) to ferrous ions (Fe2+), resulting in the formation of potassium ferrocyanide. When ferric chloride is added, Fe2+ reacts with Fe(CN)63− to form Prussian blue, a deep blue complex. The absorbance is measured at 700 nm, where a higher absorbance indicates stronger reducing power of the sample. The FRAP activity of CSPCs is summarized in Figure 7C. At concentrations of 0.02–2.55 mg/mL, the absorbance at 700 nm ranged from 0.025 ± 0.005 to 0.978 ± 0.098.
The study by Msaada et al. demonstrated that the antioxidant activity of coriander varies by origin: Tunisian coriander exhibited the strongest DPPH radical scavenging ability (IC50 = 27.00 µg/mL), followed by Egyptian coriander (IC50 = 32.00 μg/mL), while Syrian coriander showed the weakest activity (IC50 = 36.00 µg/mL) [52]. The DPPH scavenging ability of the coriander used in this study fell between those of the Tunisian and Egyptian samples.
Moreover, antioxidant activities differ among various parts of the plant. Iqbal et al. found that the leaves of coriander had the highest antioxidant activity, followed by the seeds, with the stems exhibiting the lowest activity [10]. This is consistent with the findings of Zekovic et al., who used ethanol extraction and reported DPPH IC50 values of 389 μg/mL and 510 μg/mL for leaf and seed extracts, respectively—significantly higher than the IC50 values measured in this study [53].
These differences in activity may be attributed to variations in extraction methods and sample characteristics. Notably, the coriander polyphenol extracts obtained in this study using ultrasound-assisted extraction exhibited superior DPPH scavenging activity compared to other published works [46,53,54]. This suggests that ultrasound-assisted extraction optimizes the extraction efficiency of active compounds, enhancing antioxidant capacity.
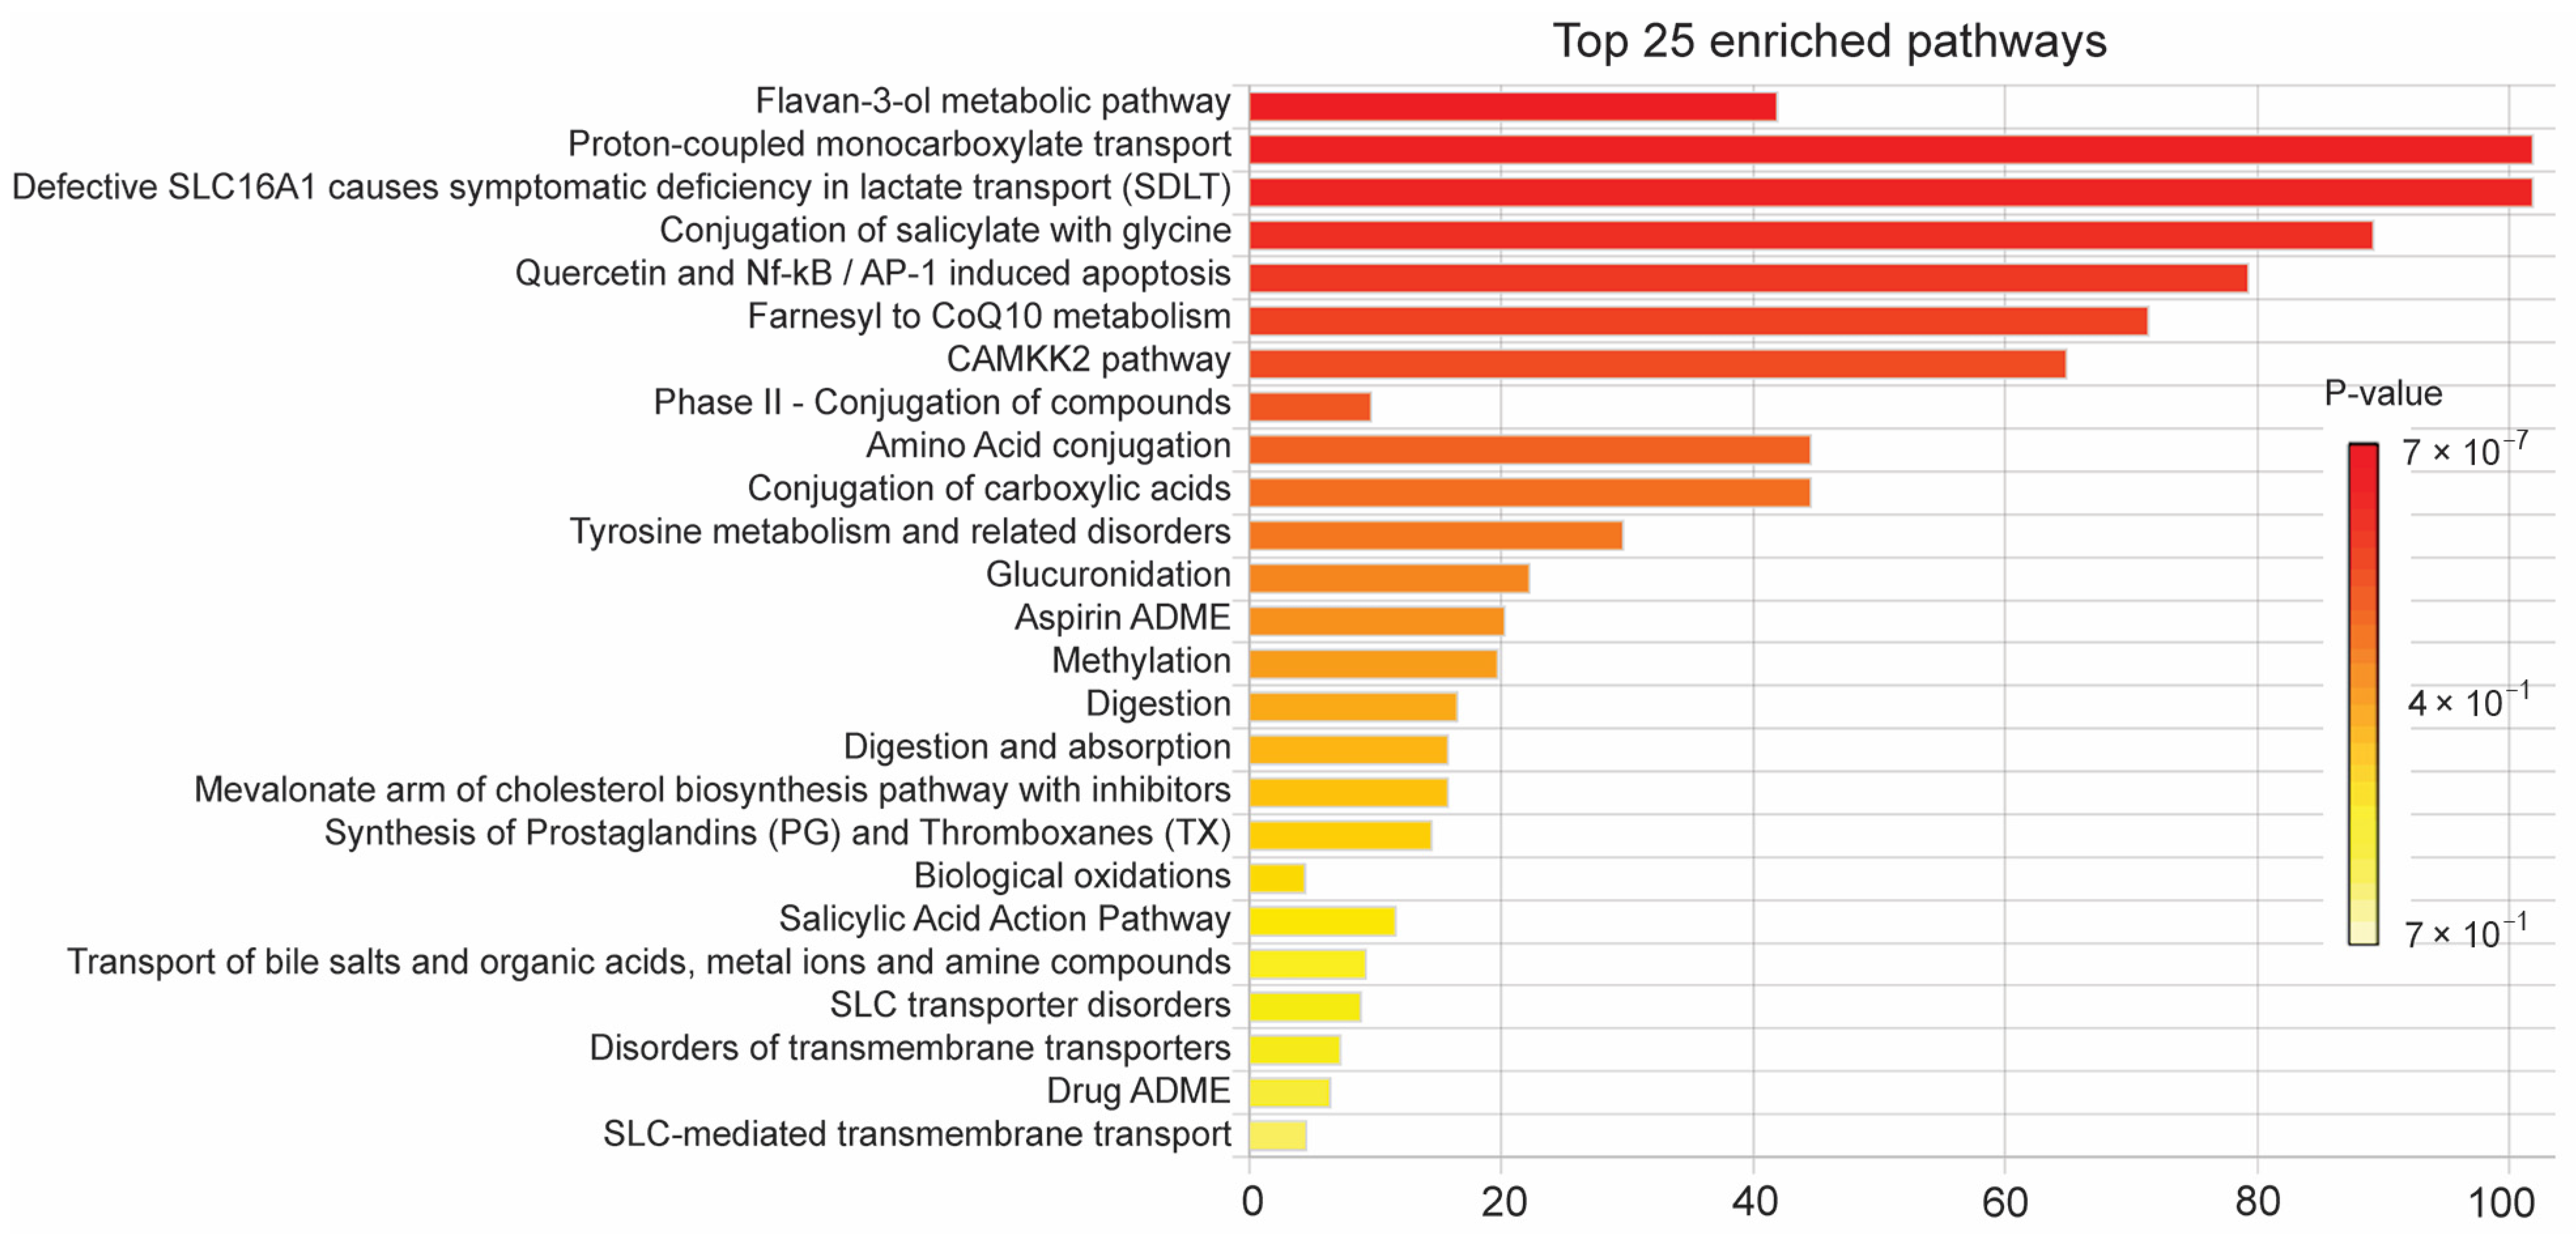
Pathway enrichment analysis is a key bioinformatics tool for interpreting metabolomics data. By identifying significantly enriched metabolic pathways (p < 0.05), it reveals systemic functional changes in biological samples. In this study, pathway enrichment analysis of CSPCs was performed using the MetaboAnalyst platform (https://www.metaboanalyst.ca, accessed on 30 May 2025, Figure 8) to elucidate the molecular mechanisms underlying their antioxidant activity at the metabolic level.
The research results indicate that CSPCs exhibit significant antioxidant capacity. Through pathway enrichment analysis, we found that several key pathways are closely related to the major active components in CSPCs. First, the flavan-3-ol metabolism pathway, identified as the top enriched pathway, is directly associated with cianidanol (compound 22 in Table 5), which was identified in the CSPCs. Flavan-3-ols may exert antioxidant effects by directly scavenging reactive oxygen species or chelating transition metal ions such as Fe2+ and Cu2+ [55].
Secondly, quercetin and its derivatives (such as rutin and hyperoside) dominate the CSPCs, accounting for approximately 89.76% of the total polyphenol content (see Figure 6A), with rutin being the most abundant (see Figure 6D). The enrichment analysis suggests that quercetin exerts indirect antioxidant effects by inhibiting the pro-inflammatory transcription factors NF-κB and AP-1 [56]. This mechanism well explains the experimental result in this study where the ABTS radical scavenging rate was significantly higher than DPPH, indicating the important role of quercetin derivatives in antioxidant protection.
In summary, this study not only systematically delineates the key metabolic pathways underlying the antioxidant activity of CSPCs but also provides a theoretical basis and potential targets for subsequent functional validation experiments. Future research will focus on these mechanisms to further clarify the molecular action pathways of active components in CSPCs, promoting their application development in antioxidant therapy and related disease prevention and treatment.

3.6. The Changes in Polyphenol Content and Antioxidant Capacity of Coriander During Storage

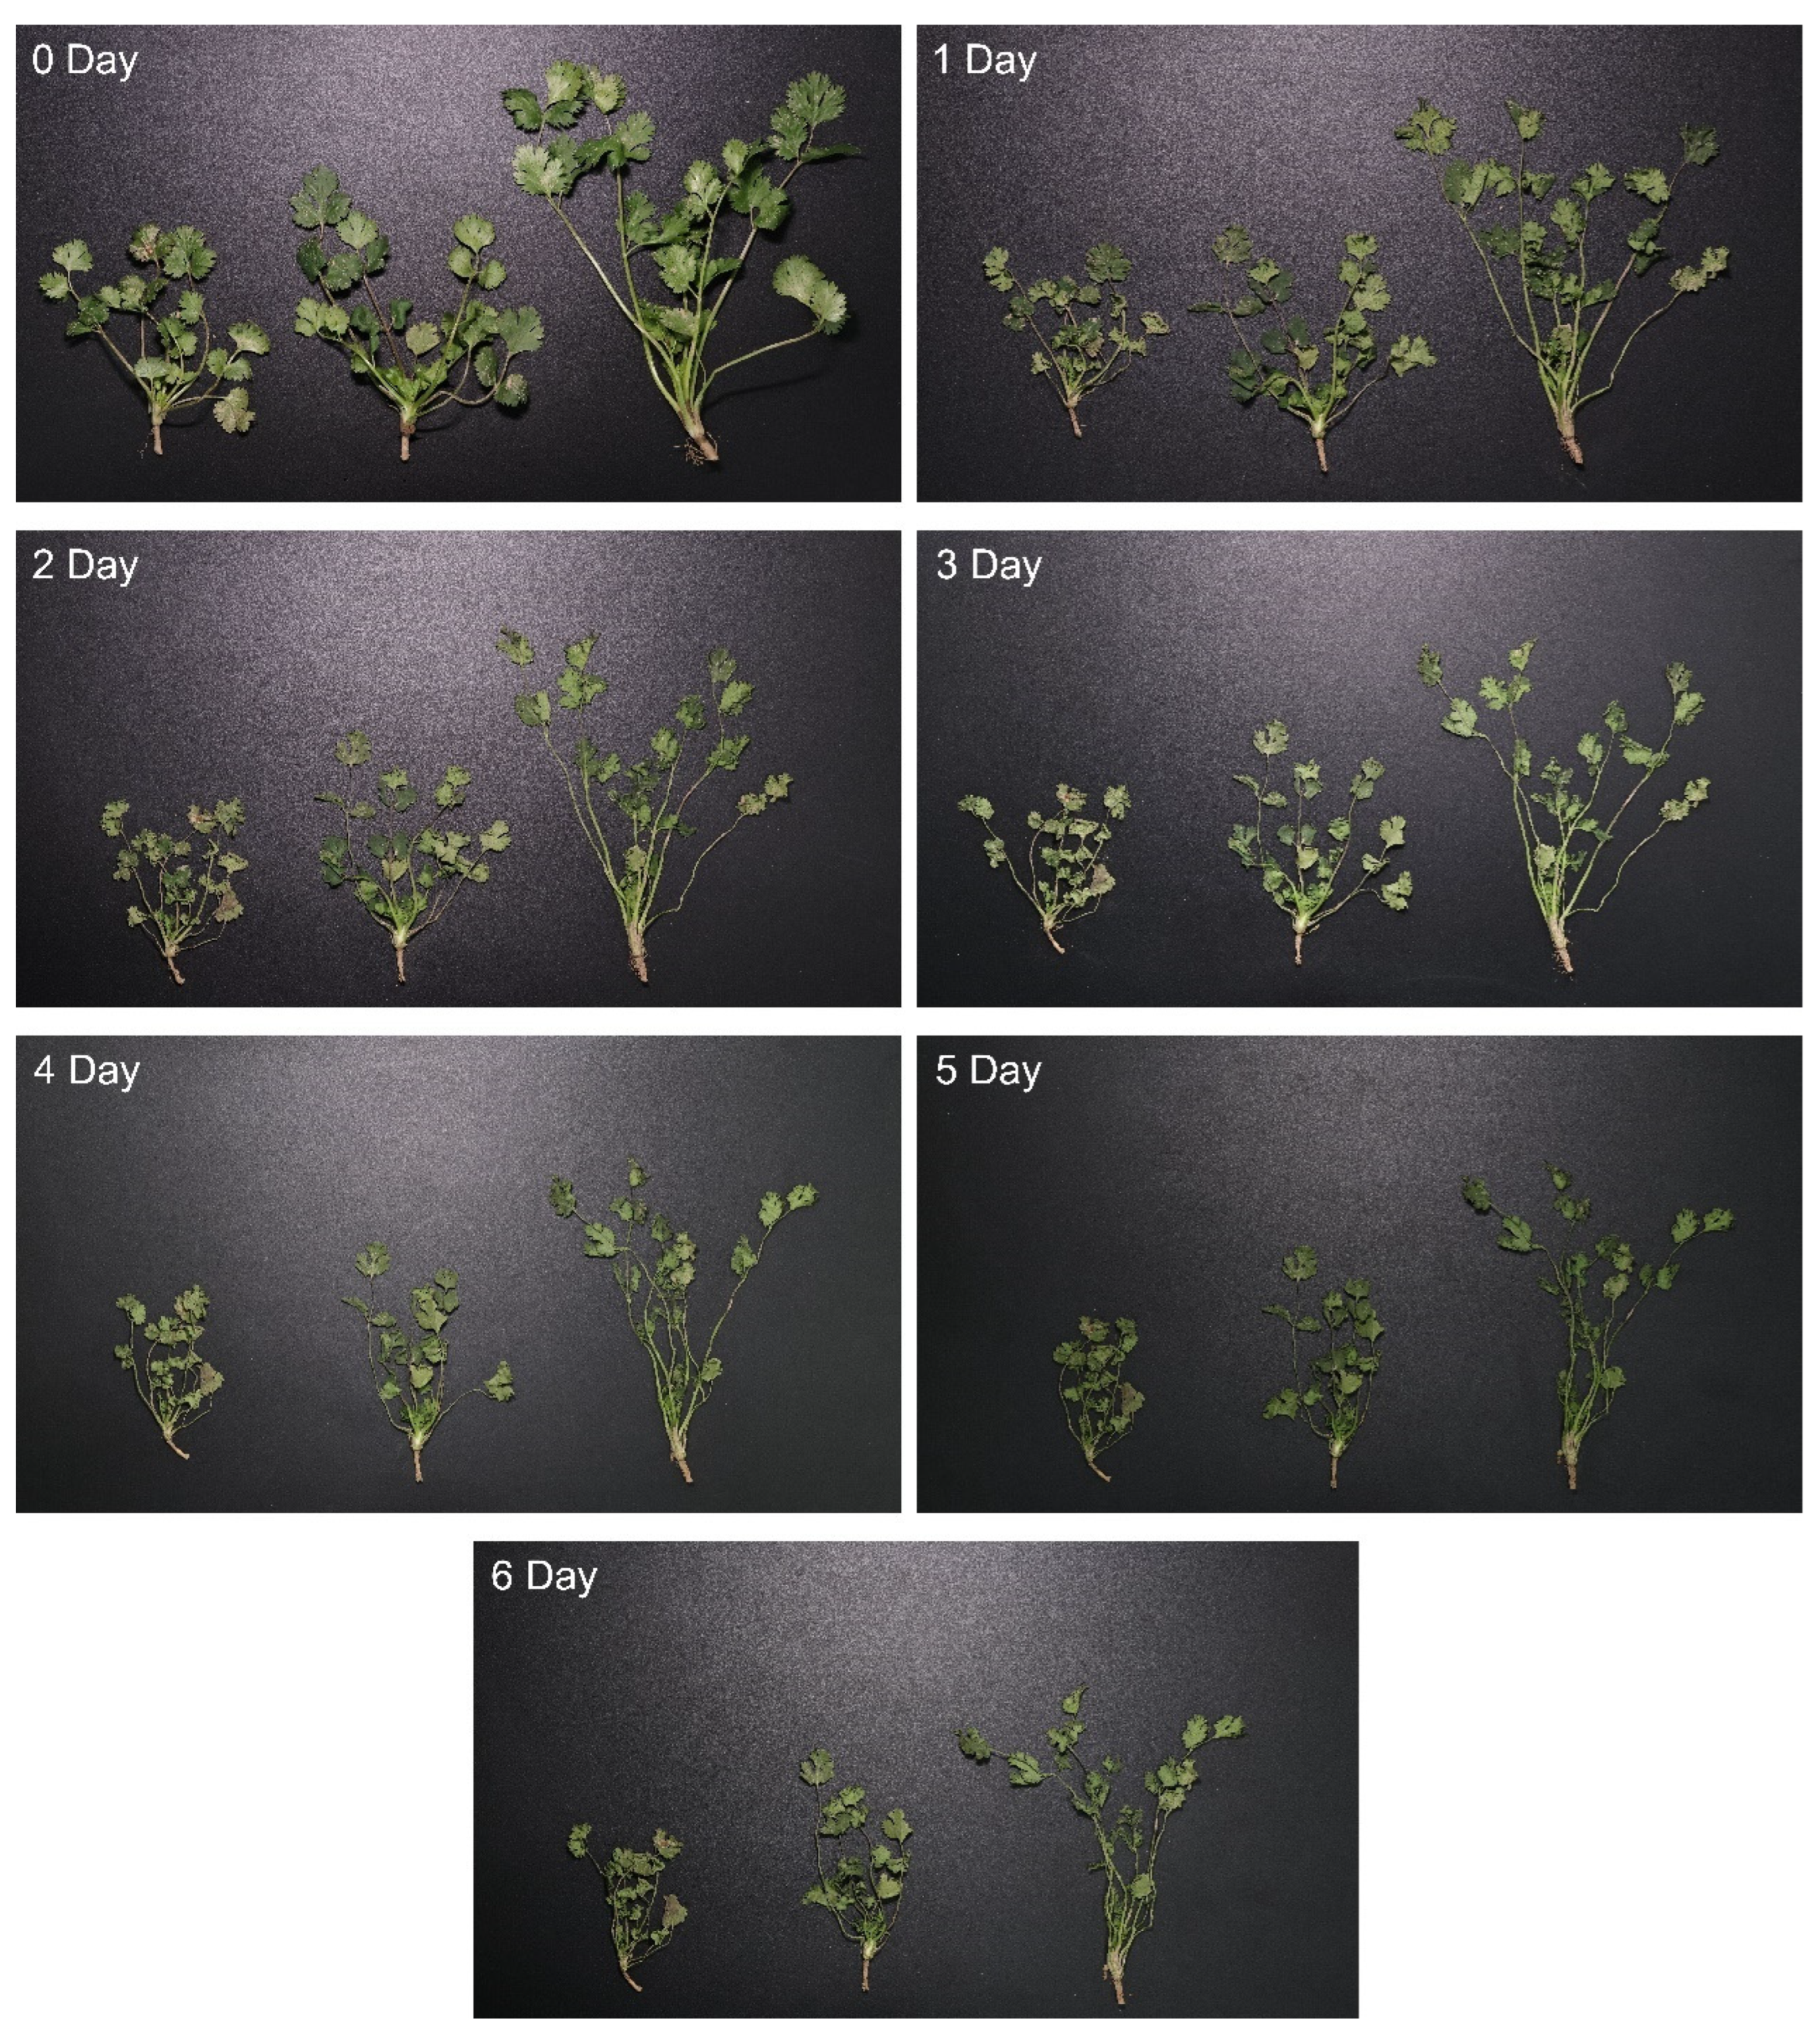
Figure 9 shows how the appearance of coriander changed from day 0 to day 6 during storage. Initially, the leaves were green and full, and the stems were straight, indicating fresh and healthy conditions. Over time, however, the leaves gradually became wilted and dull in color, curling at the edges and turning yellow. The stems also softened gradually. By day 3, the coriander had clearly lost its freshness, with increased leaf drying and some leaf drop. By day 5, most of the leaves had turned yellow and dry, and the whole plant had shrunk. By day 6, the coriander had almost completely withered, the leaves had become loose and fallen off, and the color had changed from green to brownish yellow, rendering it unfit for consumption.
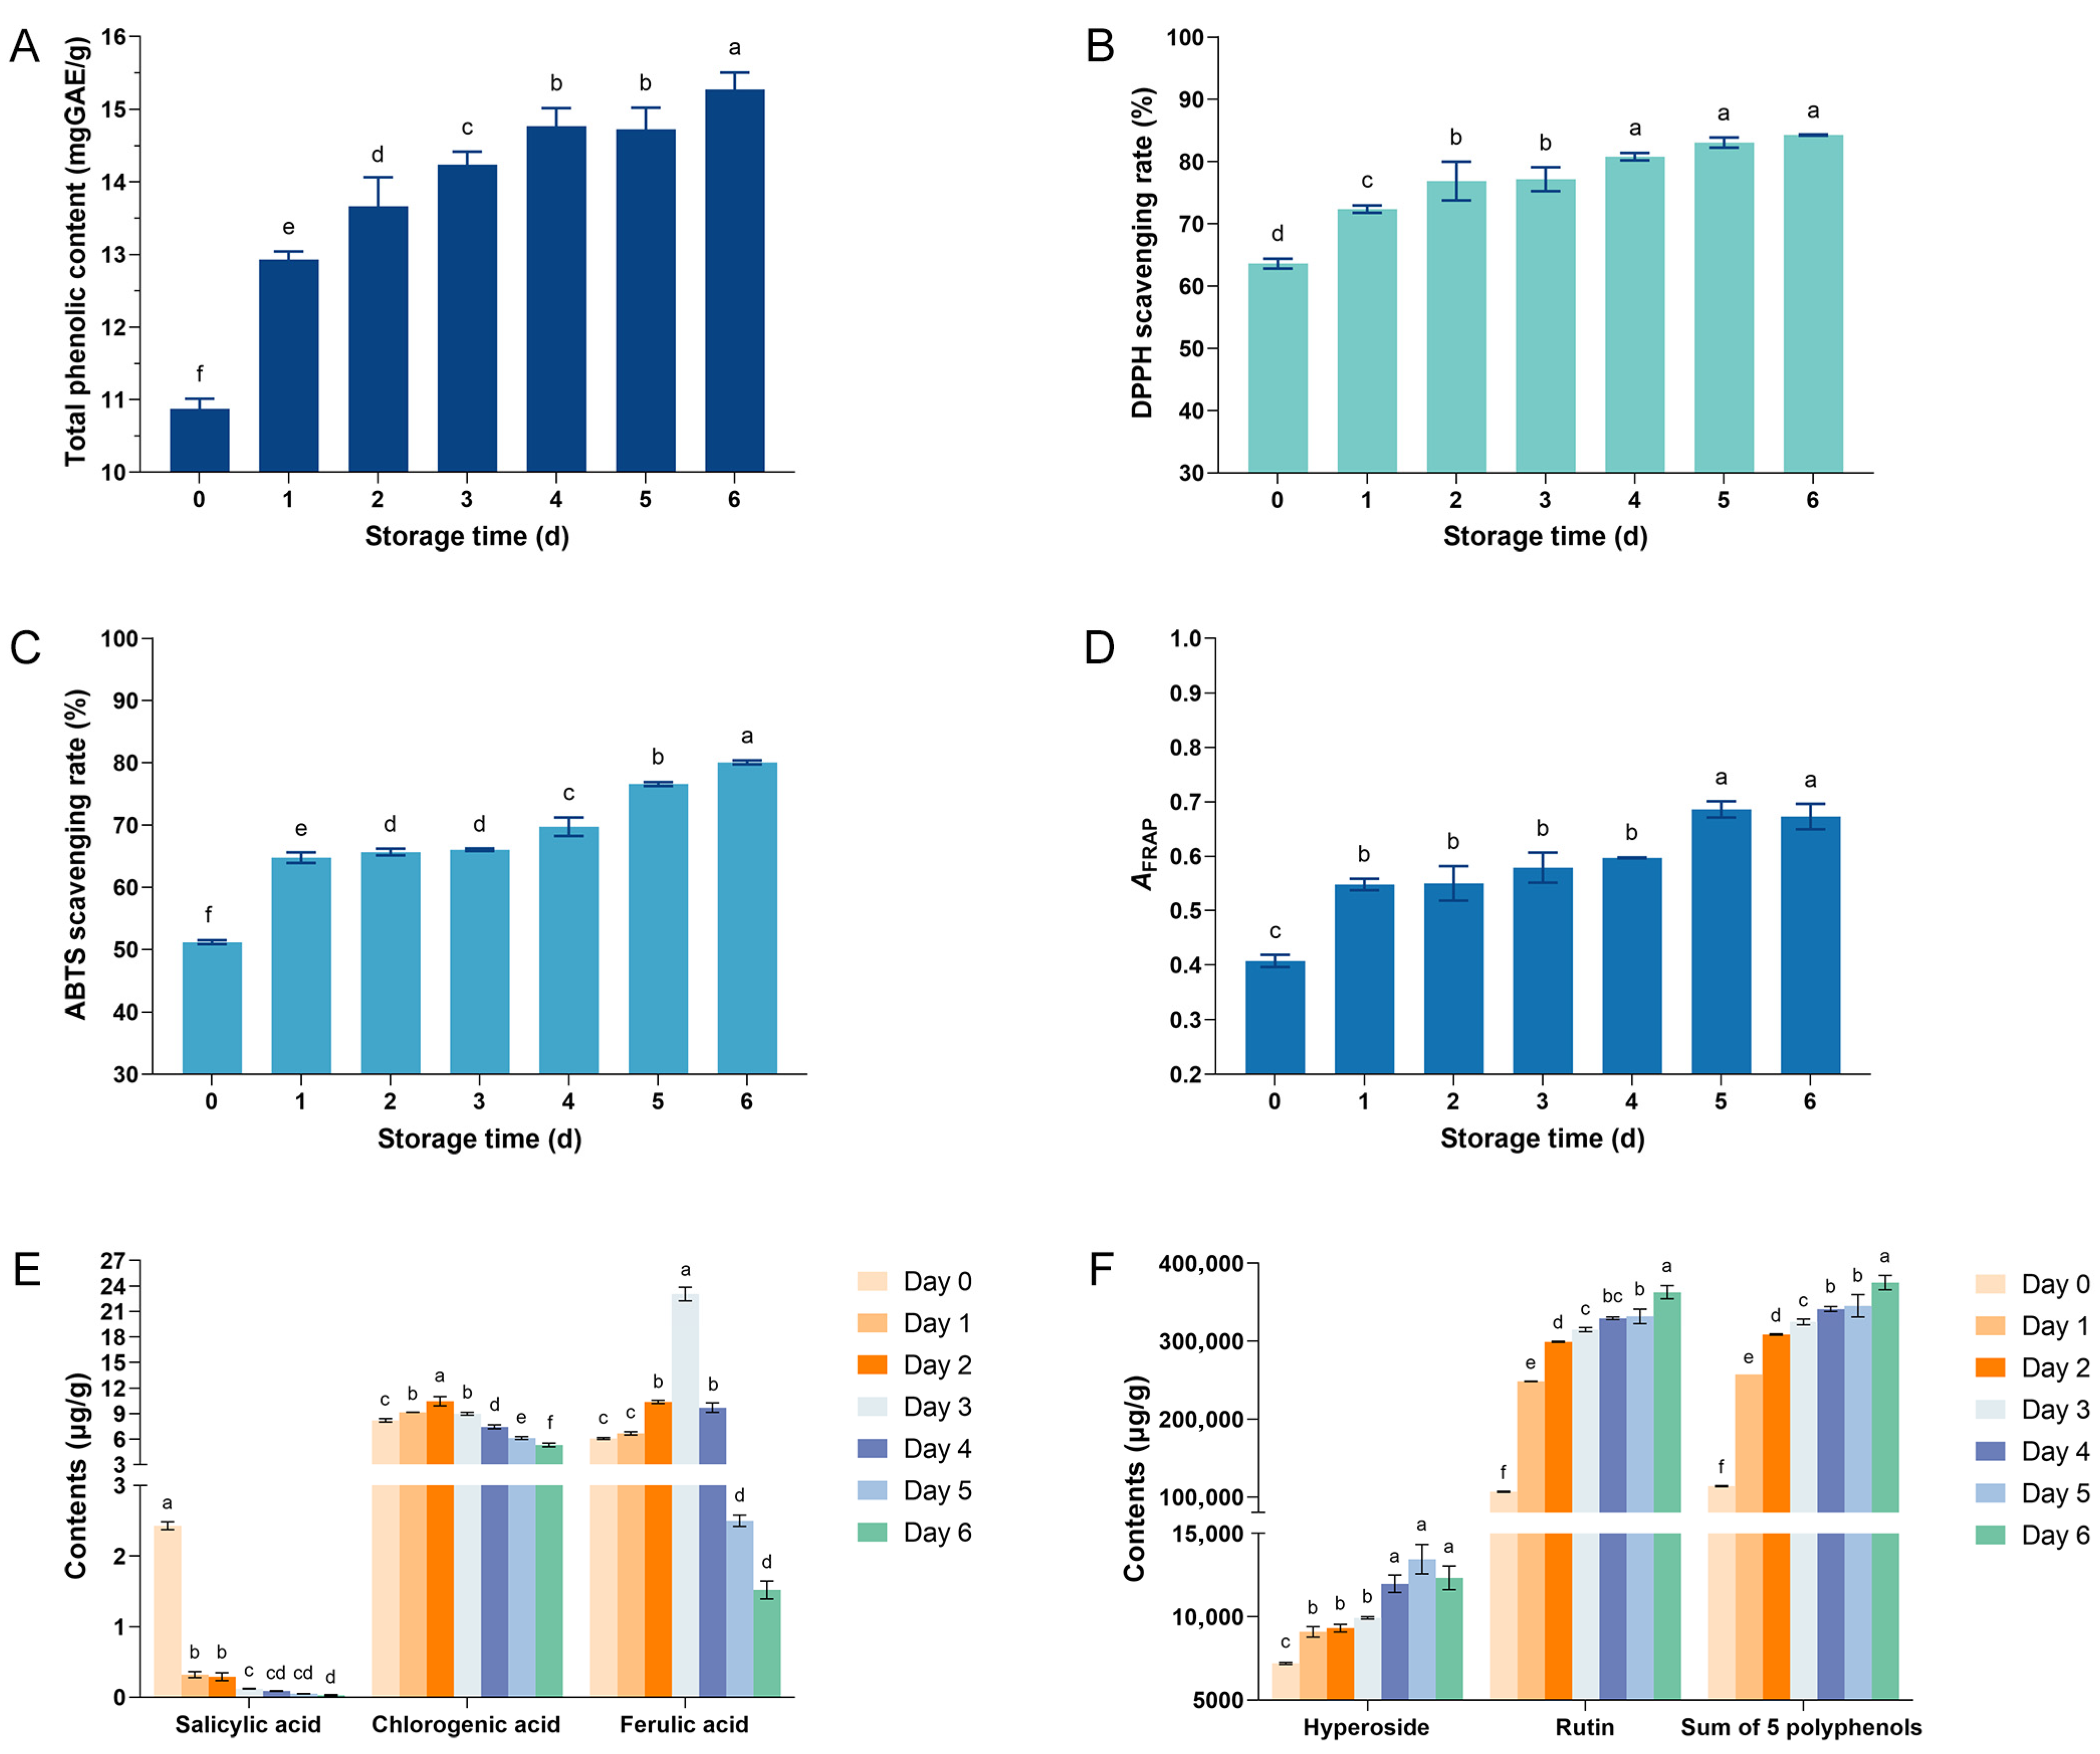
Figure 10 shows that the total phenolic content of the coriander samples increased significantly during storage, rising from 10.87 mg GAE/g to 15.28 mg GAE/g (an increase of 40.5%) over the first 6 days. Concurrently, the DPPH and ABTS radical scavenging rates rose from 63.62% and 51.15% to 84.30% and 80.05%, respectively, corresponding to increases of 32.5% and 56.5%. FRAP exhibited an overall upward trend, peaking on day 5 of storage before declining slightly on day 6, though remaining at a high level. These results suggest that coriander’s antioxidant capacity significantly improves with prolonged storage time. This trend closely aligns with the increase in total phenolic content, further confirming the enhancement of antioxidant activity.
It should be noted that although the Folin–Ciocalteu method is widely used for the preliminary quantification and comparative analysis of phenolic compounds in plant extracts and food samples due to its simplicity and rapidity, its specificity is limited. Other reducing substances present in the samples, such as ascorbic acid and sugars, can also react with the Folin–Ciocalteu reagent, potentially leading to measured values higher than the actual polyphenol content [22,23]. Nevertheless, the Folin–Ciocalteu method remains a recognized standard for preliminary screening in this field [24,25]. To ensure the accuracy of the experimental results, this study further employed UPLC-MS/MS to determine the contents of rutin, hyperoside, chlorogenic acid, ferulic acid, and salicylic acid under different storage durations (Figure 10E,F). The UPLC-MS/MS analysis results (Figure 10F) showed that the total content of the five polyphenols increased with prolonged storage time, consistent with the trend of total phenolic content measured by the Folin–Ciocalteu method, thereby validating the effectiveness of the Folin–Ciocalteu assay for total phenol determination.
Specifically, the content of rutin was significantly higher than that of the other four polyphenols (p < 0.05), followed by hyperoside. During the storage process, rutin content continuously increased; hyperoside content showed an upward trend during the first five days but slightly decreased on the sixth day. This phenomenon is consistent with the plant’s stress response mechanism. Šamec et al. pointed out that stress activates the plant defense system, leading to increased synthesis of phenolic compounds and enhanced antioxidant capacity [11]. Capanoglu et al. further explained that rutin is synthesized through the phenylpropanoid metabolic pathway, in which phenylalanine ammonia-lyase (PAL) acts as the rate-limiting enzyme [57]. After harvesting, environmental stress continuously induces the synthesis of flavonoids such as rutin and hyperoside to resist stress. Similar findings were also reported by Tak et al. [58]. Additionally, the study by Li et al. demonstrated that during storage, bound phenols degrade and convert into free phenols [59]. Compared to bound phenols, free phenols not only exhibit higher antioxidant activity but are also more easily extracted and detected by solvents. This conversion leads to a significant increase in the measured total phenolic content.
For phenolic acids, both chlorogenic acid and ferulic acid showed a trend of initially increasing and then decreasing, with peak levels observed on day 2 and day 3, respectively. Salicylic acid had the lowest content overall and exhibited a declining trend throughout. The literature indicates that the synthesis of both chlorogenic acid and ferulic acid is related to PAL activity but involves different downstream enzymes [60,61,62]. However, as storage time prolongs, oxidative reactions of phenolic acids gradually dominate, leading to a decline in their content. In particular, salicylic acid content continuously decreases, which may be attributed to the relatively low number of enzymes associated with salicylic acid synthesis in coriander. The combined effect likely causes the oxidation rate to exceed the synthesis rate [63]. The specific regulatory mechanisms underlying this process remain to be elucidated in future studies.

4. Conclusions

In this study, ultrasound-assisted extraction was employed to optimize the extraction of polyphenolic compounds from coriander. High-resolution mass spectrometry was used to identify the polyphenolic compounds. Additionally, the dynamic changes in polyphenol content and antioxidant activity during storage were investigated. The optimum extraction conditions for polyphenols from coriander were established using response surface methodology as follows: ethanol concentration of 40%, material-to-liquid ratio of 1:121 (g/mL), extraction temperature of 81 °C, and extraction time of 10 min, resulting in significantly improved extraction efficiency. These conditions led to a significant enhancement in extraction efficiency. Using UPLC-Q Exactive HF Orbitrap-MS, a total of 50 polyphenolic compounds were identified, significantly expanding the known chemical profile of coriander polyphenols. The main types of polyphenols identified included quercetin derivatives (mainly rutin and quercetin-3-O-β-D-glucuronide), kaempferol derivatives, and hydroxycinnamic acid derivatives. Notably, 41 of these compounds, such as nicotiflorin, esculin, and 1-caffeoylquinic acid, were reported in coriander for the first time. In vitro antioxidant tests showed that coriander polyphenol extracts have strong free radical scavenging activity, with IC50 values of 73.43 μg/mL for DPPH and 82.15 μg/mL for ABTS. They also exhibited notable ferric reducing antioxidant power. Furthermore, the total polyphenol content and antioxidant capacity of coriander increased significantly during storage: total phenolic content rose by 40.5%, DPPH scavenging activity increased by 32.5%, and ABTS scavenging activity improved by 56.5%. Different polyphenol components exhibited varied responses: rutin and hyperoside increased continuously, while chlorogenic acid and ferulic acid initially increased and then decreased. Salicylic acid gradually degraded. These changes may be related to the activation of defense mechanisms in response to environmental stress and the conversion of bound polyphenols into free forms. Further in-depth studies will be conducted to explore these mechanisms.
In summary, this study provides a comprehensive characterization of the diverse composition and potent antioxidant activity of coriander polyphenols. It also establishes a robust theoretical basis and technical support for their use in functional foods, natural antioxidants, and medicinal applications.

Supplementary Materials

The following supporting information can be downloaded at: https://www.mdpi.com/article/10.3390/separations12080217/s1, Figure S1: Total ion current (TIC) chromatogram of the identified polyphenolic compounds in CSPCs (A: negative mode; B: positive mode); Figure S2: Multiple Reaction Monitoring (MRM) chromatograms of five polyphenolic compounds, showing the standards (a) and samples (b), along with a schematic of the fragmentation patterns of the quantitative ion pairs (c). (A: rutin; B: hyperoside; C: ferulic acid; D: chlorogenic acid; E: salicylic acid).

Author Contributions

Writing—original draft, H.Y.; data curation and formal analysis, C.X., Y.M. (Yue Ma); writing—review and editing and funding acquisition, X.C., J.W.; visualization and resources, Y.M. (Yaqi Miao), H.G. All authors have read and agreed to the published version of the manuscript.

Funding

This work was funded by the National Natural Science Foundation of China (31401553) and Major Natural Science Research Projects for Higher Education Institutions in Jiangsu Province (19KJA480002).

Data Availability Statement

The original contributions presented in this study are included in the article, and further inquiries can be directed to the corresponding author.

Acknowledgments

The authors would like to thank all those who contributed directly or indirectly to this project.

Conflicts of Interest

The authors declare no conflicts of interest.

Abbreviations

The following abbreviations are used in this manuscript:
CSPCsPolyphenolic compounds in coriander
DPPH2,2-Diphenyl-1-picrylhydrazyl
ABTS2,2′-Azino-bis (3-ethylbenzothiazoline-6-sulfonic acid)
FRAPFerric reducing antioxidant power
TPCTotal phenolic content
ANOVAAnalysis of variance
SDStandard deviation
UPLCUltra-performance liquid chromatography system

References

  1. Mannaa, M.; Seo, Y.; Park, I. Addition of coriander during fermentation of Korean soy sauce (Gangjang) causes significant shift in microbial composition and reduction in biogenic amine levels. Foods 2020, 9, 1346. [Google Scholar] [CrossRef] [PubMed]
  2. Mahmoud, M.F.; Ali, N.; Mostafa, I.; Hasan, R.A.; Sobeh, M. Coriander oil reverses dexamethasone-induced insulin resistance in rats. Antioxidants 2022, 11, 441. [Google Scholar] [CrossRef] [PubMed]
  3. Zhong, Y.; Xie, Y.; Lyu, J.; Xie, Y.; Zhao, C.; Yu, J. Coriander microgreens and baby greens: Comparison of volatile and non-volatile metabolites and potential therapeutic effects on type 2 diabetes mellitus and obesity. Food Res. Int. 2025, 202, 115759. [Google Scholar] [CrossRef]
  4. Ishikawa, T.; Kondo, K.; Kitajima, J. Water-soluble constituents of coriander. Chem. Pharm. Bull. 2003, 51, 32–39. [Google Scholar] [CrossRef] [PubMed]
  5. Priyadarshi, S.; Harohally, N.V.; Roopavathi, C.; Naidu, M.M. Isolation, identification, structural elucidation and bioactivity of Heneicos-1-ene from Coriandrum sativum L. foliage. Sci. Rep. 2018, 8, 17414. [Google Scholar] [CrossRef]
  6. Ohara, R.; Sugahara, T.; Sugie, Y.; Onda, H.; Yoshino, N.; Nishi, K.; Ishida, M.; Kikuzaki, H. Identification of components in coriander (Coriandrum sativum L.) inhibiting degranulation of RBL-2H3 cells. Fitoterapia 2022, 163, 105298. [Google Scholar] [CrossRef]
  7. Scandar, S.; Zadra, C.; Marcotullio, M.C. Coriander (Coriandrum sativum) polyphenols and their nutraceutical value against obesity and metabolic syndrome. Molecules 2023, 28, 4187. [Google Scholar] [CrossRef]
  8. Chaurasia, P.K.; Bharati, S.L. Coriander: A holistic outlook on its chemistry and pharmacology. Food Chem. 2025, 469, 142444. [Google Scholar] [CrossRef]
  9. Pawłowska, K.A.; Baracz, T.; Skowrońska, W.; Piwowarski, J.P.; Majdan, M.; Malarz, J.; Stojakowska, A.; Zidorn, C.; Granica, S. The contribution of phenolics to the anti-inflammatory potential of the extract from Bolivian coriander (Porophyllum ruderale subsp. ruderale). Food Chem. 2022, 371, 131116. [Google Scholar] [CrossRef]
  10. Iqbal, M.J.; Butt, M.S.; Shehzad, A.; Asghar, M. In vitro antioxidant and chromatographic quantification of supercritical fluid extracts obtained from coriander (Coriandrum sativum L.). J. Chem. Soc. Pak. 2018, 40, 733–741. [Google Scholar]
  11. Šamec, D.; Karalija, E.; Šola, I.; Vujčić Bok, V.; Salopek-Sondi, B. The role of polyphenols in abiotic stress response: The influence of molecular structure. Plants 2021, 10, 118. [Google Scholar] [CrossRef]
  12. Kaur, G.; Kaur, P.; Kaur, A. Physico-chemical properties, bioactive compounds and color parameters of coriander puree: Effect of pretreatments and freezing. J. Food Sci. Technol. 2018, 55, 3473–3484. [Google Scholar] [CrossRef] [PubMed]
  13. Thirugnanasambandham, K.; Sivakumar, V. Enhancement of shelf life of Coriandrum sativum leaves using vacuum drying process: Modeling and optimization. J. Saudi Soc. Agric. Sci. 2016, 15, 195–201. [Google Scholar] [CrossRef]
  14. Gantner, M.; Guzek, D.; Najda, A.; Brodowska, M.; Górska-Horczyczak, E.; Wojtasik-Kalinowska, I.; Godziszewska, J. Oxidative and microbial stability of poultry meatballs added with coriander extracts and packed in cold modified atmosphere. Int. J. Food Prop. 2017, 20, 2527–2537. [Google Scholar] [CrossRef]
  15. Zamindar, N.; Sadrarhami, M.; Doudi, M. Antifungal activity of coriander (Coriandrum sativum L.) essential oil in tomato sauce. J. Food Meas. Charact. 2016, 10, 589–594. [Google Scholar] [CrossRef]
  16. Luque-García, J.L.; de Luque Castro, M.D. Ultrasound: A powerful tool for leaching. TrAC Trends Anal. Chem. 2003, 22, 41–47. [Google Scholar] [CrossRef]
  17. Thakur, B.R.; Singh, R.K.; Nelson, P.E. Quality attributes of processed tomato products: A review. Food Rev. Int. 1996, 12, 375–401. [Google Scholar] [CrossRef]
  18. Chen, F.; Sun, Y.; Zhao, G.; Liao, X.; Hu, X.; Wu, J.; Wang, Z. Optimization of ultrasound-assisted extraction of anthocyanins in red raspberries and identification of anthocyanins in extract using high-performance liquid chromatography–mass spectrometry. Ultrason. Sonochem. 2007, 14, 767–778. [Google Scholar] [CrossRef]
  19. Lemmadi, S.; Adoui, F.; Dumas, E.; Karoune, S.; Santerre, C.; Gharsallaoui, A. Optimization of ultrasound-assisted extraction of phenolic compounds from the aerial part of plants in the Chenopodiaceae family using a box–behnken design. Appl. Sci. 2025, 15, 4688. [Google Scholar] [CrossRef]
  20. Chemat, F.; Zill-e-Huma; Khan, M.K. Applications of ultrasound in food technology: Processing, preservation and extraction. Ultrason. Sonochem. 2011, 18, 813–835. [Google Scholar] [CrossRef]
  21. Gallo, M.; Ferracane, R.; Graziani, G.; Ritieni, A.; Fogliano, V. Microwave assisted extraction of phenolic compounds from four different spices. Molecules 2010, 15, 6365–6374. [Google Scholar] [CrossRef] [PubMed]
  22. Prior, R.L.; Wu, X.; Schaich, K. Standardized methods for the determination of antioxidant capacity and phenolics in foods and dietary supplements. J. Agric. Food Chem. 2005, 53, 4290–4302. [Google Scholar] [CrossRef]
  23. Everette, J.D.; Bryant, Q.M.; Green, A.M.; Abbey, Y.A.; Wangila, G.W.; Walker, R.B. Thorough study of reactivity of various compound classes toward the Folin−Ciocalteu reagent. J. Agric. Food Chem. 2010, 58, 8139–8144. [Google Scholar] [CrossRef]
  24. Tyagi, K.; Lui, A.C.W.; Zhang, S.; Peck, G.M. Folin-Ciocâlteu, RP-HPLC (reverse phase-high performance liquid chromatography), and LC-MS (liquid chromatography-mass spectrometry) provide complementary information for describing cider (Malus spp.) apple juice. J. Food Compos. Anal. 2025, 137, 106844. [Google Scholar] [CrossRef]
  25. Yang, M.; Wang, S.; Zhou, R.; Zhao, Y.; He, Y.; Zheng, Y.; Gong, H.; Wang, W. Optimization and component identification of ultrasound-assisted extraction of functional compounds from waste blackberry (Rubus fruticosus Pollich) seeds. J. Sci. Food Agric. 2024, 104, 9169–9179. [Google Scholar] [CrossRef]
  26. Hu, D.; Xue, R.; Zhuang, X.; Zhang, X.; Shi, S. Ultrasound-assisted extraction optimization of polyphenols from Boletus bicolor and evaluation of its antioxidant activity. Front. Nutr. 2023, 10, 1135712. [Google Scholar] [CrossRef]
  27. Che, H.; Zhang, R.; Wang, X.; Yu, H.; Shi, X.; Yi, J.; Li, J.; Qi, Q.; Dong, R.; Li, Q. Ultrasound-assisted extraction of polyphenols from Phyllanthi Fructus: Comprehensive insights from extraction optimization and antioxidant activity. Ultrason. Sonochem. 2024, 111, 107083. [Google Scholar] [CrossRef]
  28. Oroian, M.; Ursachi, F.; Dranca, F. Ultrasound-assisted extraction of polyphenols from crude pollen. Antioxidants 2020, 9, 322. [Google Scholar] [CrossRef]
  29. Al-Dhabi, N.A.; Ponmurugan, K.; Maran, P. Development and validation of ultrasound-assisted solid-liquid extraction of phenolic compounds from waste spent coffee grounds. Ultrason. Sonochem. 2017, 34, 206–213. [Google Scholar] [CrossRef]
  30. Bezerra, M.A.; Santelli, R.E.; Oliveira, E.P.; Villar, L.S.; Escaleira, L.A. Response surface methodology (RSM) as a tool for optimization in analytical chemistry. Talanta 2008, 76, 965–977. [Google Scholar] [CrossRef] [PubMed]
  31. Haque, S.K.M. Application of combined Box–Behnken design with response surface methodology and desirability function in optimizing pectin extraction from fruit peels. J. Sci. Food Agric. 2024, 104, 149–173. [Google Scholar] [CrossRef]
  32. Yang, Y.; Liang, Q.; Zhang, B.; Zhang, J.; Fan, L.; Kang, J.; Lin, Y.; Huang, Y.; Tan, T.-C.; Ho, L.-H. Adsorption and desorption characteristics of flavonoids from white tea using macroporous adsorption resin. J. Chromatogr. A 2024, 1715, 464621. [Google Scholar] [CrossRef]
  33. Kostikova, V.A.; Chernonosov, A.A.; Kuznetsov, A.A.; Petrova, N.V.; Krivenko, D.A.; Chernysheva, O.A.; Wang, W.; Erst, A.S. Identification of flavonoids in the leaves of Eranthis longistipitata (Ranunculaceae) by liquid chromatography with high-resolution mass spectrometry (LC-HRMS). Plants 2021, 10, 2146. [Google Scholar] [CrossRef]
  34. Barnaba, C.; Larcher, R.; Nardin, T.; Dellacassa, E.; Nicolini, G. Glycosylated simple phenolic profiling of food tannins using high resolution mass spectrometry (Q-Orbitrap). Food Chem. 2018, 267, 196–203. [Google Scholar] [CrossRef] [PubMed]
  35. Xiao, X.; Liu, F.; Sun, M.; Tang, Z.; Wu, Y.; Lyu, J.; Khan, K.S.; Yu, J. Development of a high-performance liquid chromatography method for simultaneous quantification of sixteen polyphenols and application to tomato. J. Chromatogr. A 2024, 1733, 465254. [Google Scholar] [CrossRef] [PubMed]
  36. Bajkacz, S.; Baranowska, I.; Buszewski, B.; Kowalski, B.; Ligor, M. Determination of flavonoids and phenolic acids in plant materials using SLE-SPE-UHPLC-MS/MS method. Food Anal. Method 2018, 11, 3563–3575. [Google Scholar] [CrossRef]
  37. Alonso Carrillo, N.; Aguilar Santamaría, M.d.l.Á.; Vernon Carter, E.J.; Jiménez Alvarado, R.; Cruz Sosa, F.; Román Guerrero, A. Extraction of phenolic compounds from Satureja macrostema using microwave-ultrasound assisted and reflux methods and evaluation of their antioxidant activity and cytotoxicity. Ind. Crops Prod. 2017, 103, 213–221. [Google Scholar] [CrossRef]
  38. Ozgen, M.; Reese, R.N.; Tulio, A.Z., Jr.; Scheerens, J.C.; Miller, A.R. Modified 2,2-azino-bis-3-ethylbenzothiazoline-6-sulfonic acid (ABTS) method to measure antioxidant capacity of selected small fruits and comparison to ferric reducing antioxidant power (FRAP) and 2,2′-diphenyl-1-picrylhydrazyl (DPPH) methods. J. Agric. Food Chem. 2006, 54, 1151–1157. [Google Scholar] [CrossRef]
  39. Xu, H.; Zhang, Y.; Wang, S.; Wang, W.; Yu, N.; Gong, H.; Ni, Z. Optimization of functional compounds extraction from Ginkgo biloba seeds using response surface methodology. Qual. Assur. Saf. Crops Foods 2022, 14, 102–112. [Google Scholar] [CrossRef]
  40. Li, J.; Chen, Z.; Shi, H.; Yu, J.; Huang, G.; Huang, H. Ultrasound-assisted extraction and properties of polysaccharide from Ginkgo biloba leaves. Ultrason. Sonochem. 2023, 93, 106295. [Google Scholar] [CrossRef]
  41. Espada-Bellido, E.; Ferreiro-González, M.; Carrera, C.; Palma, M.; Barroso, C.G.; Barbero, G.F. Optimization of the ultrasound-assisted extraction of anthocyanins and total phenolic compounds in mulberry (Morus nigra) pulp. Food Chem. 2017, 219, 23–32. [Google Scholar] [CrossRef]
  42. Boateng, I.D.; Kumar, R.; Daubert, C.R.; Flint-Garcia, S.; Mustapha, A.; Kuehnel, L.; Agliata, J.; Li, Q.; Wan, C.; Somavat, P. Sonoprocessing improves phenolics profile, antioxidant capacity, structure, and product qualities of purple corn pericarp extract. Ultrason. Sonochem. 2023, 95, 106418. [Google Scholar] [CrossRef] [PubMed]
  43. Liu, C.; Qiao, L.; Gao, Q.; Zhang, F.; Zhang, X.; Lei, J.; Ren, M.; Xiao, S.; Kuang, J.; Deng, S.; et al. Total biflavonoids extraction from Selaginella chaetoloma utilizing ultrasound-assisted deep eutectic solvent: Optimization of conditions, extraction mechanism, and biological activity in vitro. Ultrason. Sonochem. 2023, 98, 106491. [Google Scholar] [CrossRef] [PubMed]
  44. Wu, W.; Jiang, S.; Liu, M.; Tian, S. Simultaneous process optimization of ultrasound-assisted extraction of polyphenols and ellagic acid from pomegranate (Punica granatum L.) flowers and its biological activities. Ultrason. Sonochem. 2021, 80, 105833. [Google Scholar] [CrossRef]
  45. Sriti, J.; Wannes, W.A.; Talou, T.; Vilarem, G.; Marzouk, B. Chemical composition and antioxidant activities of Tunisian and Canadian coriander (Coriandrum sativum L.) fruit. J. Essent. Oil Res. 2011, 23, 7–15. [Google Scholar] [CrossRef]
  46. El-Zaeddi, H.; Calín-Sánchez, Á.; Nowicka, P.; Martínez-Tomé, J.; Noguera-Artiaga, L.; Burló, F.; Wojdyło, A.; Carbonell-Barrachina, Á.A. Preharvest treatments with malic, oxalic, and acetylsalicylic acids affect the phenolic composition and antioxidant capacity of coriander, dill and parsley. Food Chem. 2017, 226, 179–186. [Google Scholar] [CrossRef]
  47. Li, H.; Zhao, X.; Li, X.; Liang, J.; Qin, S.; Li, J.; Zhang, A.; Xu, L.; Tang, D.; Li, F. Characterization of volatile flavour compounds and characteristic flavour precursors in poultry eggs based on multi-omics and machine learning. Food Chem. 2025, 489, 144840. [Google Scholar] [CrossRef]
  48. Buszewski, B.; Walczak, J.; Žuvela, P.; Liu, J.J. Non-target analysis of phospholipid and sphingolipid species in egg yolk using liquid chromatography/triple quadrupole tandem mass spectrometry. J. Chromatogr. A 2017, 1487, 179–186. [Google Scholar] [CrossRef]
  49. Adesegun, S.A.; Alabi, S.O.; Olabanji, P.T.; Coker, H.A.B. Evaluation of antioxidant potential of Melanthera scandens. J. Acupunct. Meridian 2010, 3, 267–271. [Google Scholar] [CrossRef]
  50. Pérez-Jiménez, J.; Arranz, S.; Tabernero, M.; Díaz- Rubio, M.E.; Serrano, J.; Goñi, I.; Saura-Calixto, F. Updated methodology to determine antioxidant capacity in plant foods, oils and beverages: Extraction, measurement and expression of results. Food Res. Int. 2008, 41, 274–285. [Google Scholar] [CrossRef]
  51. Li, C.; Wang, E.; Elshikh, M.S.; Alwahibi, M.S.; Wang, W.; Wu, G.; Shen, Y.; Abbasi, A.M.; Shan, S. Extraction and purification of total flavonoids from Gnaphalium affine D. Don and their evaluation for free radicals’ scavenging and oxidative damage inhabitation potential in mice liver. Arab. J. Chem. 2021, 14, 103006. [Google Scholar] [CrossRef]
  52. Msaada, K.; Jemia, M.B.; Salem, N.; Bachrouch, O.; Sriti, J.; Tammar, S.; Bettaieb, I.; Jabri, I.; Kefi, S.; Limam, F.; et al. Antioxidant activity of methanolic extracts from three coriander (Coriandrum sativum L.) fruit varieties. Arab. J. Chem. 2017, 10, S3176–S3183. [Google Scholar] [CrossRef]
  53. Zeković, Z.; Pavlić, B.; Cvetanović, A.; Đurović, S. Supercritical fluid extraction of coriander seeds: Process optimization, chemical profile and antioxidant activity of lipid extracts. Ind. Crops Prod. 2016, 94, 353–362. [Google Scholar] [CrossRef]
  54. Dhakshayani, G.M.; Priya, S.J.A. A comparative study of phytochemical, antioxidant, anticarcinogenic, and antidiabetic potential of coriander (Coriandrum sativum L.): Microgreen and mature plant. Food Raw Mater. 2022, 10, 283–294. [Google Scholar] [CrossRef]
  55. Kubicova, L.; Bachmann, G.; Weckwerth, W.; Chobot, V. (±)-Catechin—A mass-spectrometry-based exploration coordination complex formation with FeII and FeIII. Cells 2022, 11, 958. [Google Scholar] [CrossRef]
  56. Boots, A.W.; Haenen, G.R.M.M.; Bast, A. Health effects of quercetin: From antioxidant to nutraceutical. Eur. J. Pharmacol. 2008, 585, 325–337. [Google Scholar] [CrossRef] [PubMed]
  57. Capanoglu, E.; Beekwilder, J.; Matros, A.; Boyacioglu, D.; Hall, R.D.; Mock, H.P. Correlation of rutin accumulation with 3-O-glucosyl transferase and phenylalanine ammonia-lyase activities during the ripening of tomato fruit. Plant Foods Hum. Nutr. 2012, 67, 371–376. [Google Scholar] [CrossRef]
  58. Tak, A.M.; Hami, A.; Bhat, B.; Bhat, S.A.; Masoodi, K.Z.; Bhat, M.A.; Shah, M.D.; Khan, M.K.; Zargar, S.M. Unravelling rutin content of tartary buckwheat of north western Himalayas and insights into nucleotide polymorphisms in PAL gene to infer the associations with rutin biosynthesis. 3 Biotech 2022, 12, 156. [Google Scholar] [CrossRef]
  59. Li, R.; Rosado-Souza, L.; Sampathkumar, A.; Fernie, A.R. The relationship between cell wall and postharvest physiological deterioration of fresh produce. Plant Physiol. Biochem. 2024, 210, 108568. [Google Scholar] [CrossRef]
  60. Zhong, J.; Ran, Q.; Han, Y.; Gan, L.; Dong, C. Biosynthetic mechanisms of plant chlorogenic acid from a microbiological perspective. Microorganisms 2025, 13, 1114. [Google Scholar] [CrossRef]
  61. Lallemand, L.A.; Zubieta, C.; Lee, S.G.; Wang, Y.; Acajjaoui, S.; Timmins, J.; McSweeney, S.; Jez, J.M.; McCarthy, J.G.; McCarthy, A.A. A structural basis for the biosynthesis of the major chlorogenic acids found in coffee. Plant Physiol. 2012, 160, 249–260. [Google Scholar] [CrossRef] [PubMed]
  62. Dong, H.; Li, M.; Jin, L.; Xie, X.; Li, M.; Wei, J. Cool temperature enhances growth, ferulic acid and flavonoid biosynthesis while inhibiting polysaccharide biosynthesis in Angelica sinensis. Molecules 2022, 27, 320. [Google Scholar] [CrossRef] [PubMed]
  63. Khan, M.I.R.; Poor, P.; Janda, T. Salicylic acid: A versatile signaling molecule in plants. J. Plant Growth Regul. 2022, 41, 1887–1890. [Google Scholar] [CrossRef]
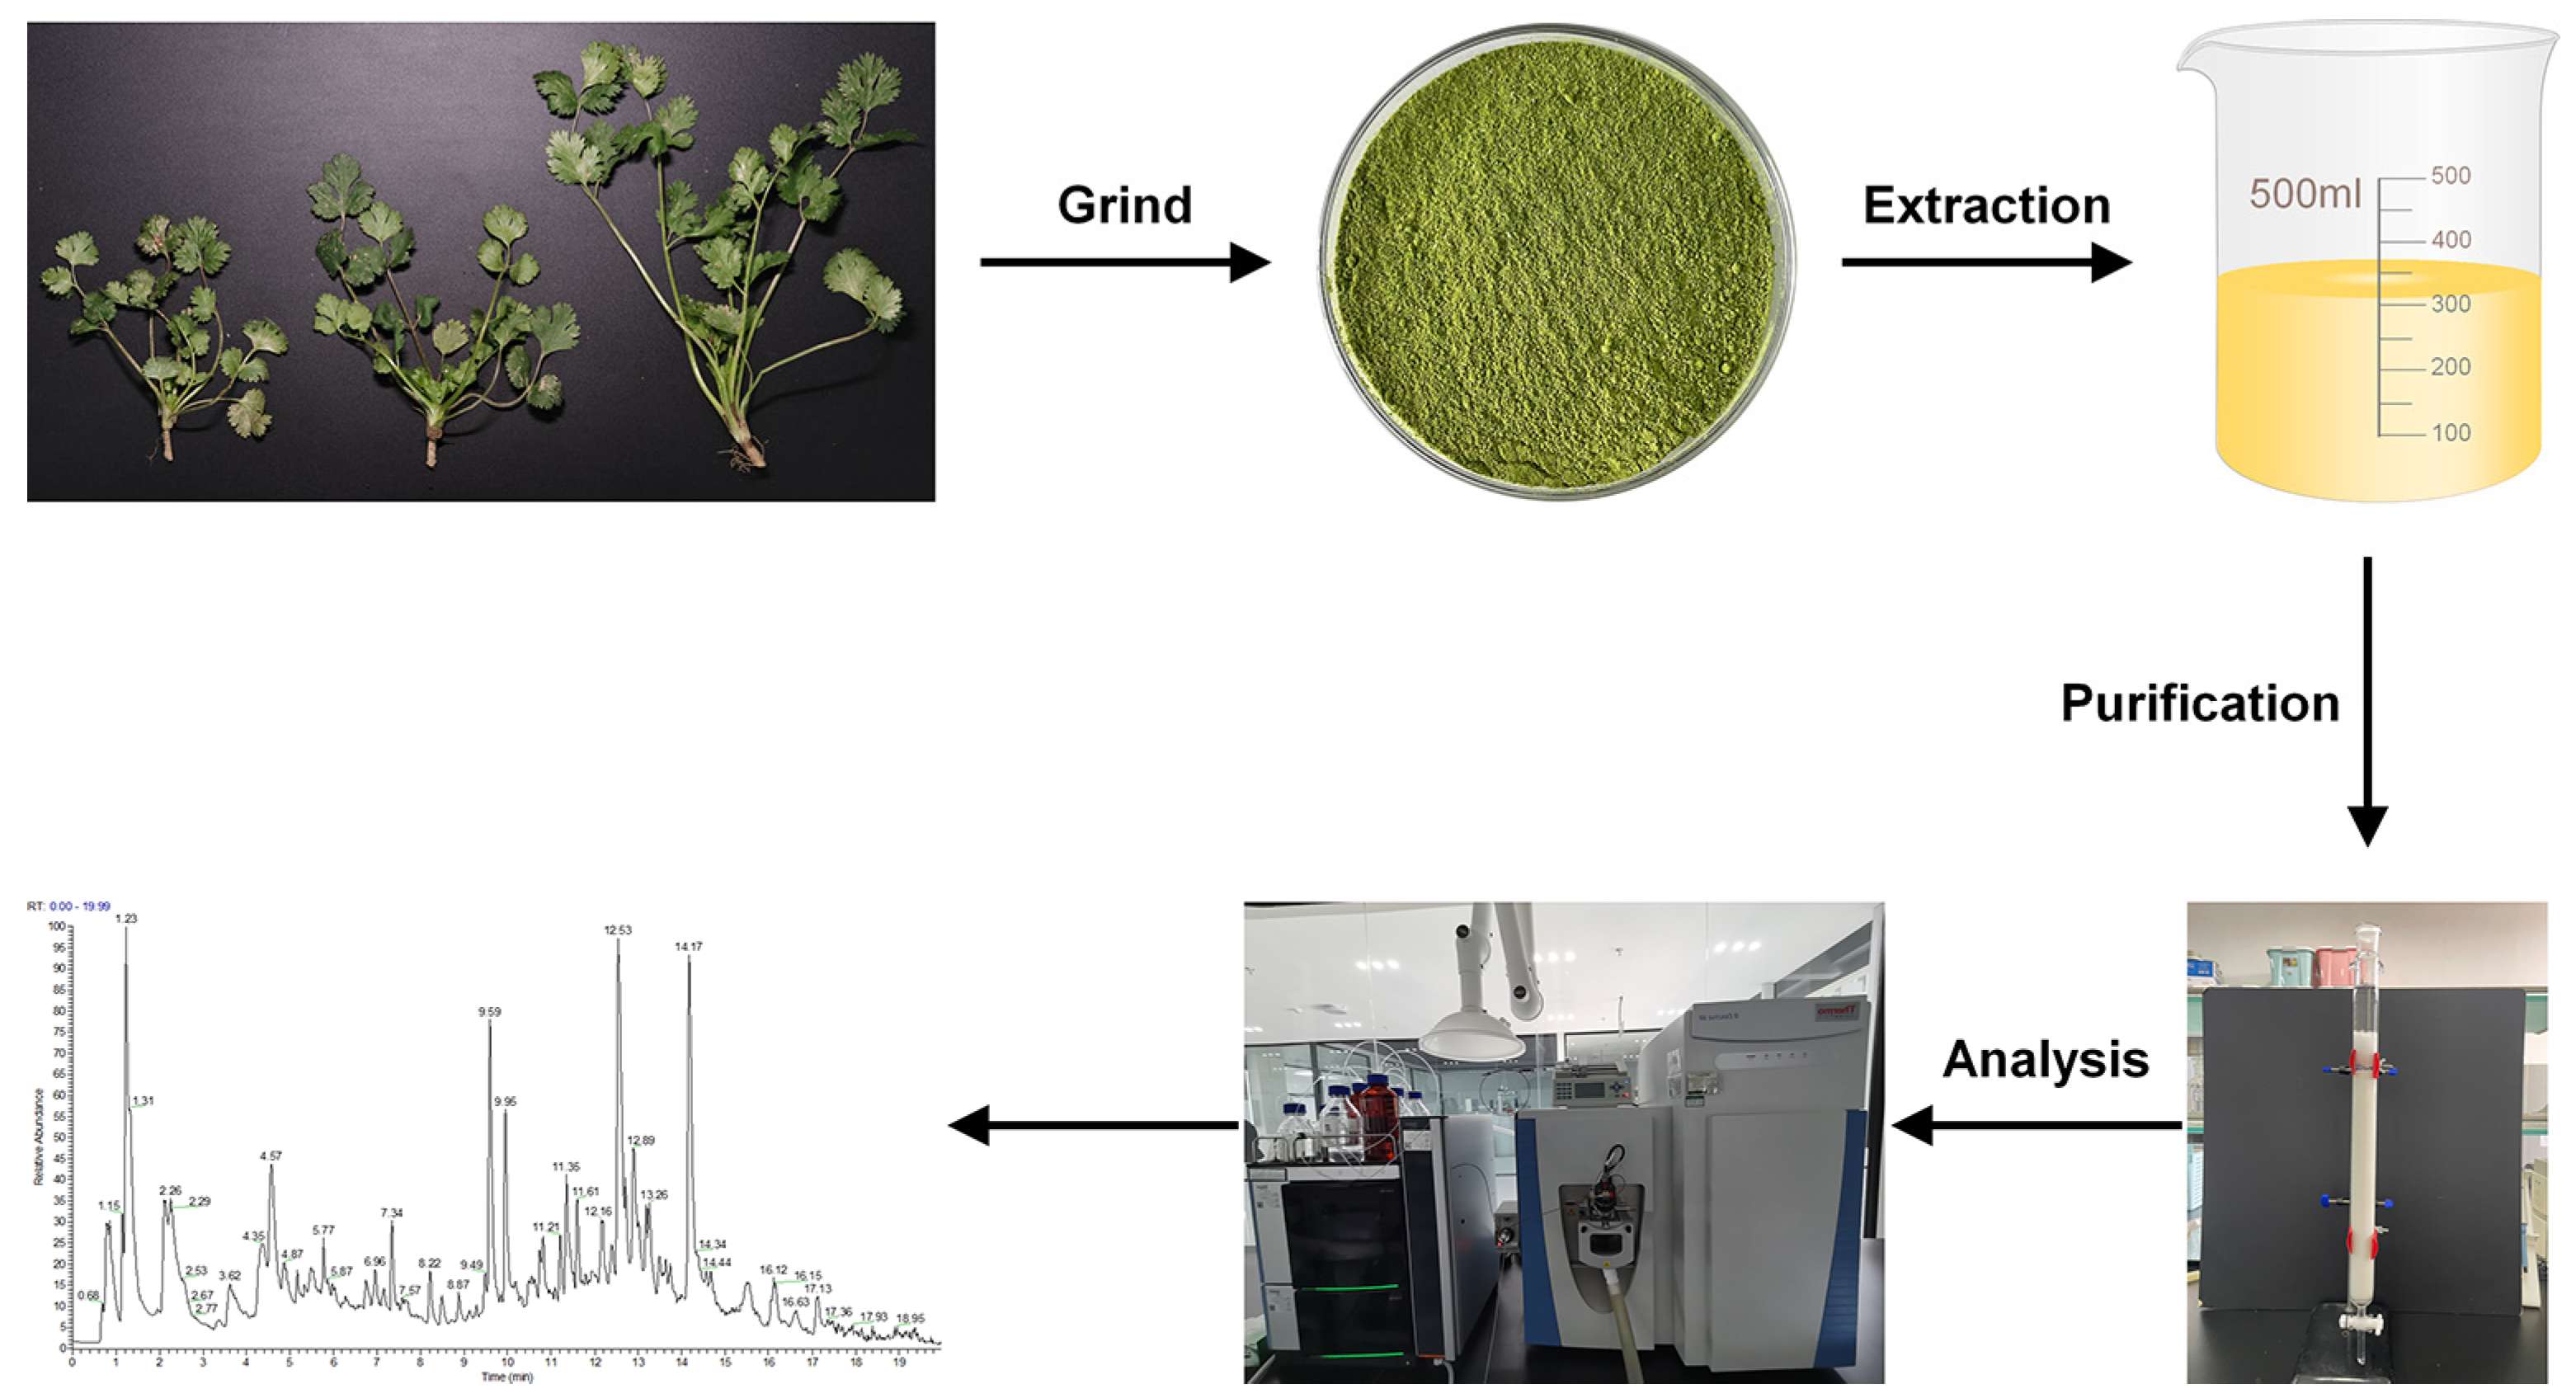
Figure 1. The process of sample preparation.
Separations 12 00217 g001
Figure 2. Results of single-factor experiments for total phenolic content (TPC) from polyphenolic compounds from coriander (CSPCs). Material-to-liquid ratio (A), ethanol concentration (B), extraction temperature (C), extraction time (D). Different lowercase letters indicate significant differences determined by one-way ANOVA followed by Duncan’s multiple range test (p < 0.05).
Separations 12 00217 g002
Figure 3. Response surface analysis of the interaction effects of various factors on the extraction yield of coriander polyphenols. (A) The interaction between the material-to-liquid ratio and ethanol concentration; (B) the interaction between the extraction temperature and ethanol concentration; (C) the interaction between extraction time and ethanol concentration; (D) the interaction between extraction temperature and material-to-liquid ratio; (E) the interaction between extraction time and material-to-liquid ratio; (F) the interaction between extraction time and extraction temperature.
Separations 12 00217 g003
Figure 4. Possible fragmentation pathways (A) and MS2 spectrum (B) of rutin.
Separations 12 00217 g004
Figure 5. Possible fragmentation pathways (A) and MS2 spectrum (B) of ferulic acid.
Separations 12 00217 g005
Figure 6. Polyphenol profiling in CSPCs. Primary classification (A), secondary classification (B), tertiary classification (C), absolute quantification of major polyphenols (D). Different lowercase letters indicate significant differences determined by one-way ANOVA followed by Duncan’s multiple range test (p < 0.05).
Separations 12 00217 g006
Figure 7. The antioxidant activities of CSPCs. (A) DPPH, (B) ABTS, (C) FRAP (ferric reducing antioxidant power).
Separations 12 00217 g007
Figure 8. Enrichment analysis of CSPCs.
Separations 12 00217 g008
Figure 9. The appearance changes of coriander during storage.
Separations 12 00217 g009
Figure 10. Changes in polyphenol content and antioxidant activity of coriander at different storage durations. (A) Total phenolic content; (B) DPPH; (C) ABTS; (D) FRAP; (E,F) Contents of rutin, hyperoside, chlorogenic acid, ferulic acid, salicylic acid, and their total (five polyphenols). Different lowercase letters indicate significant differences determined by one-way ANOVA followed by Duncan’s multiple range test (p < 0.05).
Separations 12 00217 g010
Table 1. Response surface experimental factors.
Independent VariablesCoded SymbolsLevel
−101
Ethanol concentration (%)X1354045
Material-to-liquid ratio (g/mL)X21:1101:1201:130
Extraction temperature (°C)X3708090
Extraction time (min)X451015
Table 2. Mass spectra properties of five polyphenols in CSPCs.
CompoundsIon Pair
(m/z)
Fragmentor Voltage
(V)
Collision Energy
(V)
Chlorogenic acid191.0/353.110717
Ferulic acid134.0/193.09317
Salicylic acid93.1/137.18317
Rutin300.0/609.524141
Hyperoside300.0/463.118030
Table 3. Box–Behnken design results.
RunX1 (%)X2 (g/mL)X3 (°C)X4 (min)Total Phenolic Content
(mg GAE/g)
145120801516.255
240120801016.518
345130801016.296
440130801516.231
53512080516.253
640130701016.181
740110901016.174
840130901016.202
935120801516.169
1040110801516.211
1145120701016.189
1235130801016.281
134013080516.243
1435110801016.273
1540120701516.159
164012070516.152
1740110701016.044
1840120801016.531
1940120801016.522
2045120901016.286
2135120701016.121
2240120901516.212
2335120901016.237
2445110801016.248
254011080516.179
264512080516.263
2740120801016.491
2840120801016.533
294012090516.232
Table 4. ANOVA and regression coefficients of the extraction condition model for the response variable.
SourceSum of SquaresDFsMean SquareF-Valuep-ValueSignificance
Model0.4568140.032633.41<0.0001**
X10.003410.00343.520.0818
X20.007810.00787.940.0137*
X30.020610.020621.070.0004**
X40.000610.00060.61640.4455
X1X20.000410.00040.40950.5325
X1X30.000110.00010.09240.7656
X1X40.001410.00141.480.2441
X2X30.003010.00303.040.1031
X2X40.000510.00050.49550.4930
X3X40.000210.00020.18660.6723
X120.082510.082584.42<0.0001**
X220.148410.1484151.92<0.0001**
X320.254310.2543260.36<0.0001**
X420.149410.1494152.93<0.0001**
Residual0.0137140.0010
Lack of fit0.0125100.00134.420.0824Not significant
Pure error0.001140.0003
Cor total0.470528
R20.9709
R2adj0.9419
C.V.%0.1921
* Indicates a significant difference (p < 0.05); ** indicates a very significant difference (p < 0.01). R2: coefficient of determination; R2adj: adjusted R2, adjusted coefficient of determination; C.V.: coefficient of variation; DFs: degrees of freedom.
Table 5. Identification of major compounds in CSPCs by UPLC-Q Exactive HF Orbitrap-MS.
No.NameClassificationIonization
Mode
RT (min)FormulaPredictedMeasuredDeltaMass
(ppm)
MS/MS
(m/z)
Match
Score
A: Flavonoids
1Scutellarin bBaicalein derivatives[M-H]6.847C21H18O12462.07983462.080110.6399.07227, 327.05093, 285.04056, 269.04535, 193.4917472.15
2Wogonoside b[M+H]+9.051C22H20O11460.10056460.0998−1.65297.07523, 285.07513, 270.05183, 165.05437, 147.0438473.48
3Luteollin 5-glucoside bLuteolin derivatives[M-H]7.193C21H20O11448.10056448.100870.69285.04068, 133.02950, 151.0031380.51
4Cynaroside b[M-H]7.316C21H20O11448.10056448.100620.14285.04050, 284.03275, 151.0031978.45
5Luteolin-4′-O-glucoside b[M-H]7.523C21H20O11448.10056448.100780.5369.05130, 285.04065, 135.0444283.17
6Nobiletin bOthers[M+H]+11.209C21H22O8402.13147402.13074−1.8388.11447, 373.09100, 343.2259275.43
7Sinensetin b[M+H]+11.735C20H20O7372.1209372.12031−1.59358.10406, 343.08066, 312.0984570.15
B: Flavonols
8Kaempferol 3-glucorhamnoside a [9]Kaempferol derivatives[M-H]6.92C27H30O15594.15847594.158680.35285.04037, 284.0325, 151.0031390.17
9Nicotiflorin b[M+H]+6.857C27H30O15594.15847594.15781−1.11449.10699, 287.05435,147.0649088.64
10Kaempferol-7-O-β-D-glucopyranoside b[M+H]+6.749C21H20O11448.10056448.09991−1.45287.05447, 270.05148, 153.0178482.21
11Ternatumoside II b[M-H]6.811C27H30O15594.15847594.158680.35285.04053, 284.03259, 255.0297586.34
12Kaempferol a [7][M-H]9.069C15H10O6286.04774286.047850.4267.02969, 151.0029895.16
13Rutin a [10,46]Quercetin derivatives[M-H]6.549C27H30O16610.15338610.15350.19301.03528, 300.02737, 151.0029097.70
14Quercetin 3-O-β-D-Glucuronide a [46][M-H]6.784C21H18O13478.07474478.074750.02301.03531, 300.02774, 151.1447195.52
15Isoquercitrin a [9][M+H]+6.738C21H20O12464.09548464.09478−1.51315.04922, 303.04922, 145.0493284.73
16Quercetin a [7][M+H]+6.736C15H10O7302.04265302.04201−2.12285.03864, 219.06436, 153.0179998.66
17Hyperoside b[M-H]6.766C21H20O12464.09548464.095690.46300.02753, 255.03510, 151.0029492.15
18Avicularin b[M+H]+7.007C20H18O11434.08491434.08436−1.27417.15305, 399.07016, 303.04935, 151.11162, 115.0390996.58
19Morin bOthers[M-H]9.168C15H10O7302.04265302.04256−0.31193.01343, 178.99783, 151.0028485.14
20Fisetin b[M+H]+6.75C15H10O6286.04774286.04717−1.97270.05154, 255.10130, 121.06470,94.56
21Narcissoside b[M-H]6.98C28H32O16624.16903624.16896−0.12315.05087, 314.04315, 300.02731, 299.0194778.14
C: Flavanol compounds
22Cianidanol bFlavan-3-ol[M-H]11.019C15H14O6290.07904290.0789−0.47251.07666, 245.08165, 243.0659988.59
D: Phenolic acids
23Ginkgolic acid C13:0 bHydroxybenzoic acids[M-H]19.138C20H32O3320.23514320.23503−0.35275.24109, 275.23792, 263.184323, 202.6057071.35
24Ginkgolic Acid C15:1 b[M-H]19.403C22H34O3346.25079346.2503−1.44302.25656, 301.2533972.84
25Protocatechuic acid b[M-H]3.948C7H6O4154.02661154.02587−4.79109.02859, 91.0178676.68
26Salicylic acid b[M-H]5.061C7H6O3138.03169138.03161−0.61119.02849, 109.04427, 91.0338990.15
274-Methoxysalicylic acid b[M-H]3.07C8H8O4168.04226168.0417−3.33149.02376, 123.04437, 122.0287270.58
28p-Coumaric acid a [7][M+H]+5.681C9H8O3164.04734164.04726−0.52147.04385, 137.05957, 135.0439586.42
29Octyl gallate b[M-H]5.966C15H22O5282.14672282.1466−0.45263.12863, 237.14928, 189.12787, 123.0806471.52
30Anacardic acid b[M+H]+12.516C22H36O3348.26644348.2658−1.85331.26245, 303.26770, 191.14284, 1310702473.48
31Diffractic acid b[M-H]8.453C20H22O7374.13655374.136640.23329.13962, 299.12900, 178.0630671.56
32Chlorogenic acid a [7,46]Hydroxycinnamic acids[M-H]5.463C16H18O9354.09508354.095120.12336.67032, 191.05548, 179.03432, 173.0448595.47
33Cryptochlorogenic acid b[M-H]5.338C16H18O9354.09508354.095210.35317.62381, 191.05566, 179.03450, 173.0450490.58
34Sinapic acid b[M+H]+5.243C11H12O5224.06847224.06827−0.93207.06480, 175.03867, 147.04376, 119.0491490.45
35Ferulic acid a [7][M-H]7.103C10H10O4194.05791194.05735−2.9178.02657, 149.06009, 134.0365494.17
361-Caffeoylquinic acid b[M-H]4.511C16H18O9354.09508354.095190.3191.05565, 179.03445, 135.0444292.78
37Ethyl caffeate b[M-H]9.48C11H12O4208.07356208.07312−2.12189.05530, 179.03447, 161.02382, 135.0444280.42
38Methyl 4-hydroxycinnamate b[M+H]+6.837C10H10O3178.06299178.06283−0.93161.05956, 133.06476, 105.0701779.48
E: Biflavonoids
39Sciadopitysin bBiflavonoids[M-H]13.186C33H24O10580.13695580.137150.35565.11438, 547.10358, 415.04605, 403.08221, 388.05878, 165.0186273.89
40Ginkgetin b[M-H]11.854C32H22O10566.1213566.121410.2533.08832, 403.08249, 389.06705, 117.0337770.71
41Bilobetin b[M-H]10.874C31H20O10552.10565552.105760.21519.07202, 389.06671, 269.2121671.48
F: Dihydrochalcone
42Phloridzin bPsoralen derivatives[M-H]7.606C21H24O10436.13695436.136980.07391.07040, 273.07675, 167.0342774.02
G: Other polyphenolic compounds
43Esculin bCoumarin derivatives[M-H]4.875C15H16O9340.07943340.07931−0.36177.01865, 176.01111, 133.0287898.15
44Esculetin b[M-H]5.779C9H6O4178.02661178.02596−3.64158.90924, 133.02864, 105.03358, 89.0385482.33
45Lithospermic acid bOthers[M+H]+8.543C27H22O12538.11113538.111−0.23521.10736, 341.06516, 323.05457, 297.07550, 181.0494275.55
461,5-Isoquinolinediol b[M+H]+4.949C9H7NO2161.04768161.04755−0.8144.04416, 134.05989, 120.0444183.92
47Pinoresinol b[M-H]8.203C20H22O6358.14164358.14147−0.47339.12360, 324.10019, 309.07672, 177.0186280.50
48Salidroside bPhenylethanoid glycosides[M-H]4.724C14H20O7300.1209300.12083−0.24179.05545, 176.35088, 161.04488, 119.03410, 89.0233082.70
49Oleuropein b[M-H]7.626C25H32O13540.18429540.184810.97401.10913, 377.12436, 359.11392, 345.0979070.21
50Forsythoside E b[M-H]4.524C20H30O12462.17373462.173880.32317.12265, 309.11725, 293.13855, 179.07007, 147.06500, 129.0545576.16
a Indicates reported before, b indicates not reported before. RT: retention time; MS: mass spectrometry; MS/MS: tandem mass spectrometry fragmentation; m/z: mass-to-charge ratio.
Disclaimer/Publisher’s Note: The statements, opinions and data contained in all publications are solely those of the individual author(s) and contributor(s) and not of MDPI and/or the editor(s). MDPI and/or the editor(s) disclaim responsibility for any injury to people or property resulting from any ideas, methods, instructions or products referred to in the content.