1. Introduction
Surface mining operations in the Athabasca Oil Sands Region (AOSR) of northern Alberta have generated over 1.18 trillion liters of tailings, a slurry composed of residual hydrocarbons, sand, clay, and oil sands process water (OSPW). These tailings gradually settle and consolidate into fluid fine tailings (FFT) [
1,
2]. The FFT matrix contains 25 to 35% (
w/
w) solids in the form of clay, sorbed petroleum hydrocarbons (PHCs), and unextracted bitumen (3 to 5% (
w/
w) and <1% (
w/
w) unrecovered naphtha (for tailings where naphtha was used during extraction), with the remaining matrix dominated by OSPW [
3,
4]. The Tailing Management Framework (TMF) issued by the Alberta Energy Regulators in 2015 has encouraged oil sand operators to continue their investigation into management strategies for the reduction in their FFT inventory [
1]. One approach to managing these tailings is water-capped tailings technology (WCTT). This method involves placing FFTs at the base of an exhausted mine pit and capping it with water to form a pit lake (PL). Over time, the FFT consolidates and stabilizes beneath the water cover, helping isolate contaminants and support eventual ecological recovery [
5].
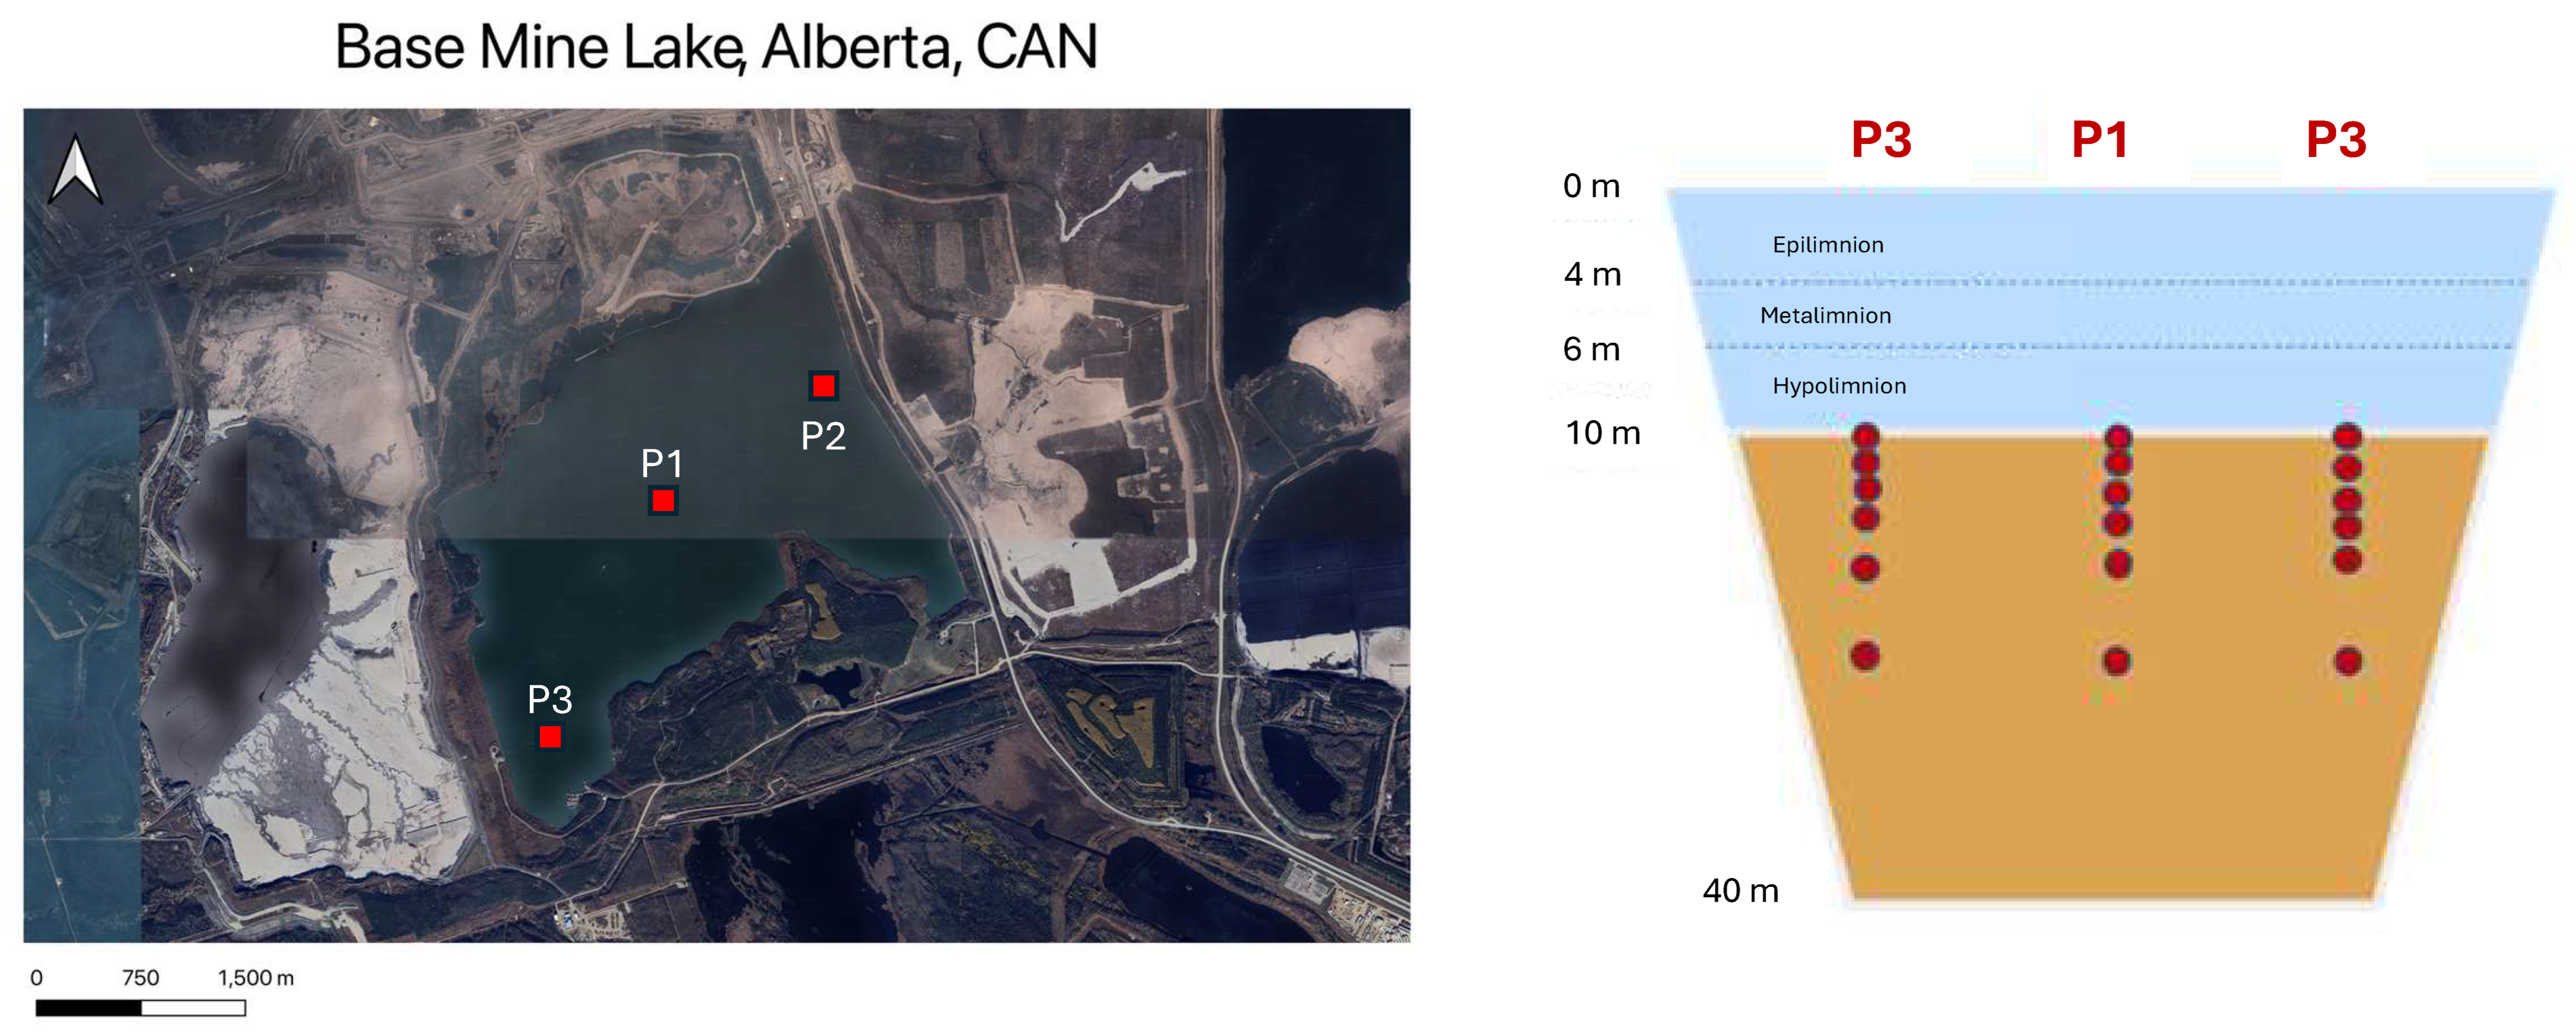
The focus of this study is Base Mine Lake (BML) (
Figure 1), the first full-scale PL in the Athabasca Oil Sands Region (AOSR) commissioned by Syncrude, Alberta, Canada in 2012 [
5]. As of October 2012, the FFT deposit underlying BML had reached a maximum thickness of 48 m and was submerged under a 52 million m
3 water cover, with a surface area of approximately 8 km
2 and an average depth of 6.5 m. Settlement and densification of the FFT between 2012 and 2017 resulted in a water cap depth increase to roughly 10.5 m. Freshwater additions, ranging from 2 to 6 million m
3, to BML have been undertaken to simulate future water inflow from adjacent reclaimed landforms [
2]. Water is currently pumped from the BML water cap for utilization in the oil sands extraction process such that the lake maintains a surface elevation of 308.7 ± 0.5 m above sea level [
2]. Field studies beginning in 2015 have extensively characterized the temporal and spatial geochemistry of OCC mobilization from the fluid water interface (FWI) into the overlaying water column [
5,
6].
The FFT at BML is known to support anaerobic microbial processes, including methanogenesis, sulphate reduction, and fermentation of labile hydrocarbons. These processes influence the mobility of oxygen-consuming constituents (OCCs), which complicates long-term water quality predictions [
1,
6]. The FFT underlying a PL is expected to be anoxically dominated by diverse microbial communities capable of anaerobic methanotrophy, methanogenesis, and nitrate and sulphur reduction [
3,
4,
7]. Fermentation of PHCs sorbed to FFT produces H
2 and acetate, which may be subsequently utilized by these anaerobic microbial communities [
5]. As FFT settles and densifies, porewater containing OCCs derived from these anaerobic microbial degradations of labile PHCs, such as gases (e.g., H
2S, CH
4), dissolved organic carbon (DOC), and dissolved ions (e.g., NH
4+, HS
−, and Fe
2+), have the potential to be mobilized into to the overlying water cap [
8]. Oxidation processes, including microbial methanotrophy and abiotic reactions, play a central role in modulating methane cycling in fluid fine tailings. As methane is generated through anaerobic methanogenesis, the availability of oxidants (e.g., oxygen, nitrate, and sulfate) controls its mobility and emission to the water cap. Understanding the biogeochemical cycling of petroleum hydrocarbons (PHCs) within the FFT and their exchange with the water column is crucial for predicting long-term water quality [
7]. However, the complex mix of residual PHCs in FFT, often appearing as an unresolved complex mixture, makes it difficult to track the cycling of individual isomers [
9].
This study applies the increased peak capacity of comprehensive two-dimensional gas chromatography coupled to time-of-flight mass spectrometry (GC × GC/TOFMS) to assess the variability of residual hydrocarbons derived from inputs of naphtha and/or bitumen within near-surface FFT (defined herein as the region extending 0.2–1.9 m from FWI from FWI) and a reference sample below these depths (range = 3.8–5.0 m from FWI) at BML in 2017. GC × GC offers superior separation power over conventional GC, enabling the differentiation of structurally similar isomers commonly found in petroleum-related contaminants. The TOFMS detector, combined with advanced deconvolution algorithms, enhances the identification of co-eluting compounds, improving confidence in peak assignments for non-target analysis. Chemometric fingerprinting, used here to refer to the integration of GC × GC/TOFMS with multivariate statistics like PCA and HCA, extends traditional hydrocarbon profiling by capturing species-level resolution. This allows for better assessment of source contributions, transformation patterns, and spatial variability in complex matrices such as FFT. The goal was to determine the source fingerprint for PHC attribution and apply statistical techniques to assess how PHC isomers differ between platforms, which could indicate in situ biogeochemical cycling and the potential release of OCCs into the overlying water cap.
2. Materials and Methods
2.1. Site Location and Sampling Method
Sampling of FFT was conducted in July 2017 where eighteen FFT samples were collected from the proximity of three platforms located in BML P1 (six samples), P2 (six samples), and P3 (six samples) using a non-commercial pneumatic piston sampling device deployed from a specialized sampling boat as per the protocol from [
2]. While passive samplers are increasingly used for time-integrated monitoring of hydrophobic contaminants and can offer cleaner extracts and lower detection limits, this study focuses on grab sampling to capture spatial trends and concentration gradients across BML. The primary focus of sampling was the samples collected from the near-surface FFT depth profile (0.2–1.9 m from FWI), which have been proposed by Dompierre [
2] to undergo exchange with the water column. Four samples from each platform were collected from just below the FFT–Water cap (FWI) interface in increments of 0.2 m, one sample was collected 0.5 m from the previous set of samples, and a sample was collected below these depths (range = 3.8–5.0 m from FWI) in each platform as a point of reference. At platform 3, the sample from the 0.2 m depth did not contain sufficient sediment for analysis, and, thus, the first sample analyzed was from 0.4 m from the FWI. Although unequal depths across platforms may appear inconsistent, the design reflects logistical constraints and sediment availability, while still ensuring comparative coverage across biologically and chemically active zones. This approach enables the exploration of depth-related variability in contaminant speciation, redox conditions, and potential source/sink dynamics within the FFT.
2.2. Chemicals and Reagents
Dichloromethane, methanol, and hexane (distilled in glass) were purchased from EMO Millipore Corporation (Oakville, ON, Canada). The following compounds were purchased and used as recovery/internal standards in this study: m-terphenyl (96%, Sigma-Aldrich, Oakville, ON, Canada) and benzo[a]anthracene-d12 (98%, Sigma-Aldrich). The following standards were purchased for semi-quantification of target compounds: 1-methylnaphthalene (95%, Sigma-Aldrich), 2-ethylnaphthalene (98%, Sigma-Aldrich), 2,3,5-trimethylnaphthalene (98%, Sigma-Aldrich), 1,4,6,7-tetramethylnaphthalene (98%, Sigma-Aldrich), 1-methylfluorene (98%, Sigma-Aldrich), 1,8-dimethyl-9H-fluorene (98%, Sigma-Aldrich), 9-methylanthracene (98%, Sigma-Aldrich), 9,10-dimethylanthracene (98%, Sigma-Aldrich), 3-methylbenzothiophene (96%, Sigma-Aldrich), 4-methyldibenzothiophene (96%, Sigma-Aldrich), 4,6-dimethyldibenzothiophene (97%, Sigma-Aldrich), Supelco SS TCL Polynuclear Aromatic Hydrocarbon Mix in methylene chloride–benzene (Sigma-Aldrich), and Supelco C7–C40 Saturated Alkane Mixture in hexane (Sigma-Aldrich).
2.3. Extraction Procedure
The method for total lipid extraction (TLE) of the solvent extractable organics from FFT is summarized in Dereviankin 2020 [
10]. Briefly, 500 mL Nalgene bottles containing FFT were thawed overnight and freeze-dried for 72 h to remove residual moisture. The freeze-dried FFT sample was aliquoted in triplicate and spiked with recovery standard, m-terphenyl. A 1:1 hexane–acetone solution was introduced into the sample matrix to extract the organic constituents from the FFT. The mixture underwent microwave extraction with a MARS Microwave Extractor (Serial # MD7382, Oakville, ON, Canada) with the following parameters: power at 100%, ramp to 115 °C, and hold for 10 min. The microwaved extract was decanted and passed through a 1.5 µm VWR glass microfiber filter (product number: 691, 28333-125, Oakville, ON, Canada) and washed with hexane. Samples were diluted to their final volume with hexane, and the extract was transferred into GCMS vials using a 0.45 µm PTEE filter syringe. Prior to analysis, all vials were spiked with benzo[a]anthracene-d12 as the internal standard.
2.4. Instrumental Analysis: GC × GC/QTOF
The FFT total lipid extracts were analyzed using a Pegasus 4D system (LECO Corp., St Joseph, MI, USA). The non-polar/polar (NP/P) column orientation utilized a DB1-MS column (60 m × 0.25 mm × 0.25 μm film thickness, ON, CAN) as the primary column and a DB-17ms column (1.25 m × 0.10 mm × 0.10 μm film thickness, ON, CAN) as the secondary column. This setup was selected after method optimization specific to BML FFT samples, as it provided the optimal resolution of both aromatic hydrocarbons and low molecular weight (C7–C12) paraffins—species critical to tracking biogeochemical lability. A modulation period of 7.5 s was chosen based on prior tests showing that longer periods mitigated peak wrapping and improved the resolution of heavier alkylated species. Full details on method development and optimization can be found in Dereviankin [
10]. The primary oven was programmed to hold at 80 °C for 15 min and ramp to 335 °C at a rate of 1.66 °C/min. The secondary oven offset was set to +5 °C relative to the primary oven. A modulation period of 7.5 s was used. The modulator temperature offset was +3 °C relative to the secondary oven. The ion source and transfer line temperatures were set to 240 °C and 280 °C, respectively. Helium was used as the carrier gas at a flow rate of 1 mL/min. The time-of-flight mass spectrometer was scanned over a mass range of
m/
z 40 to 600 at a sample acquisition rate of 100 scans/s with a solvent delay set to 1300 s. The detector voltage was offset by 100 V with an acquisition voltage of 1678. Data processing of GC × GC/QTOFMS data was performed by ChromaTOF version 4.50.8.0 (LECO Corp), which included automatic peak finding with mass spectral deconvolution. Library searches were conducted with the NIST/EPA/NIH Mass Spectral Library 2008 (NIST 08, Gaithersburg, MC, USA) and a user library containing alkylated polyaromatic hydrocarbon reference standards.
2.5. Statistical Analysis
Univariate, multivariate, and parametric statistical analyses were performed using JMP Software Package (Version 15.1) and customized code in R Studio (Version 1.2.5033). Data were tested for normality and homogeneity of variance using Shapiro–Wilk (α = 0.05). Data that did not meet the parametric assumptions of normality and homoscedasticity were log-transformed [
11]. Principal component analysis (PCA) and Hierarchical Clustering Analysis (HCA) were performed using JMP Software Package (Version 15.1) and customized code in R Studio (Version 1.2.5033), following the log transformation of the dataset. Isomers that were not present in more than 75% of the samples were removed from the dataset prior to incorporation into HCA and PCA.
4. Discussion
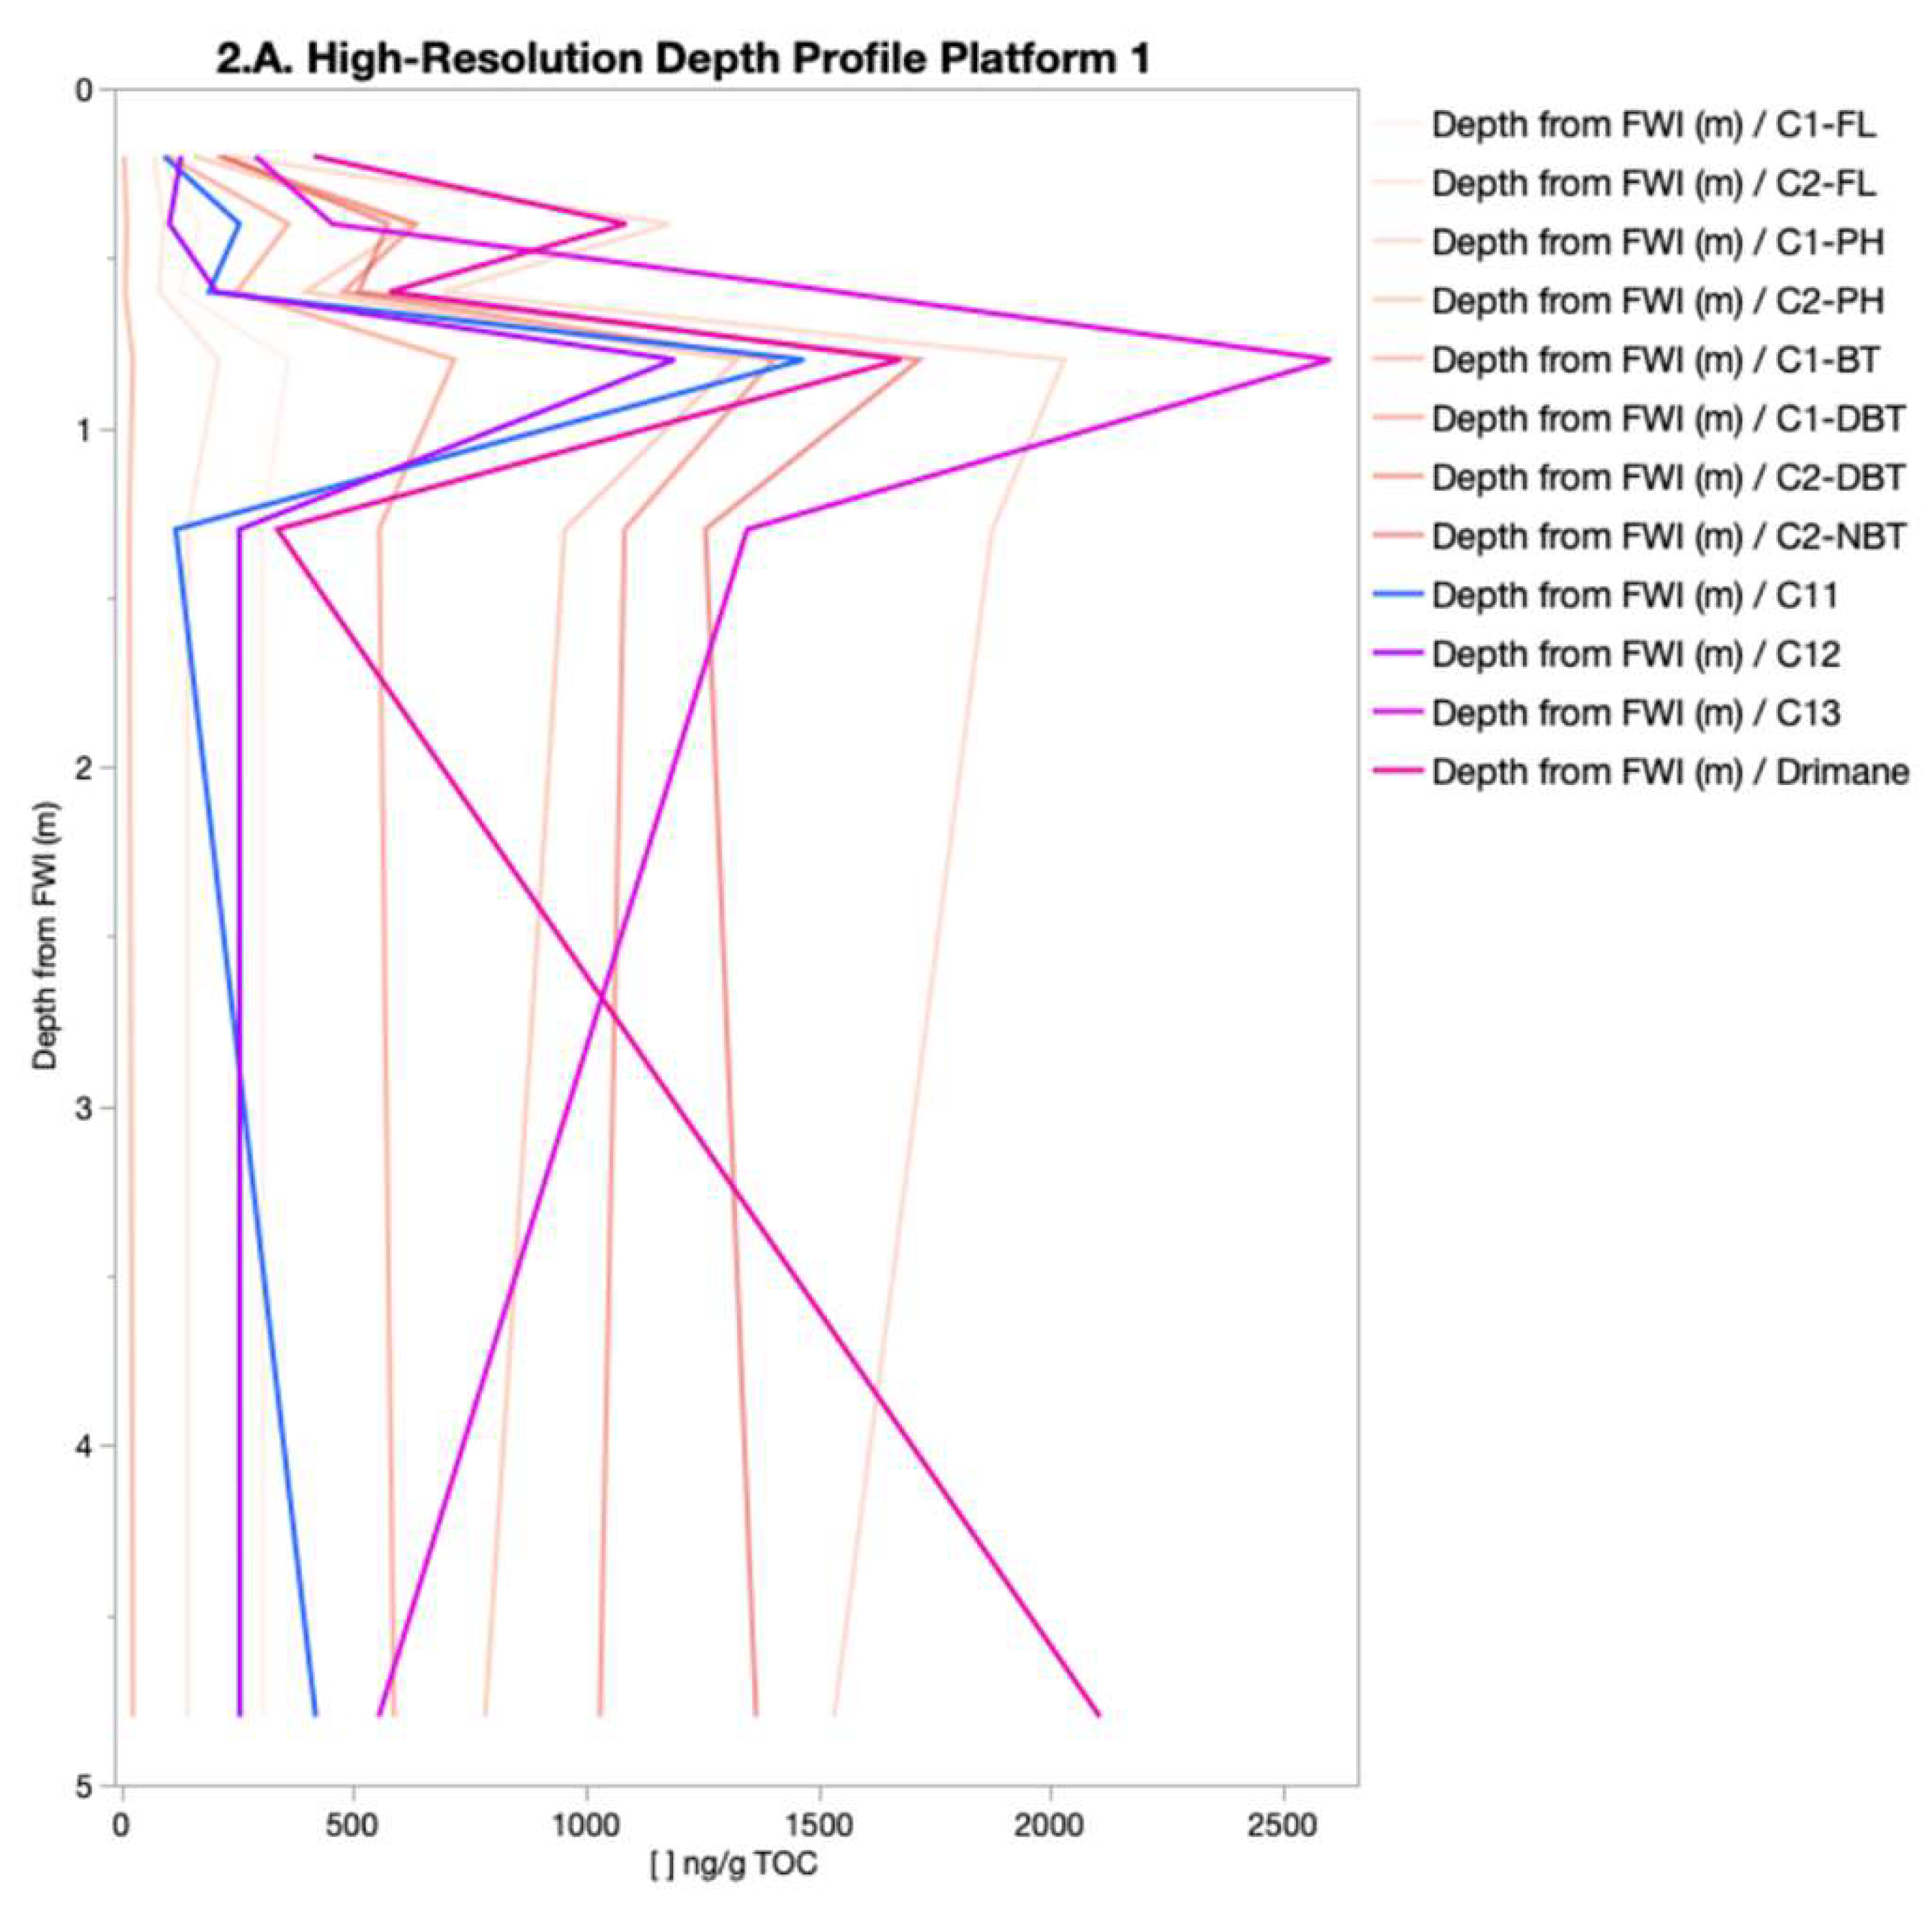
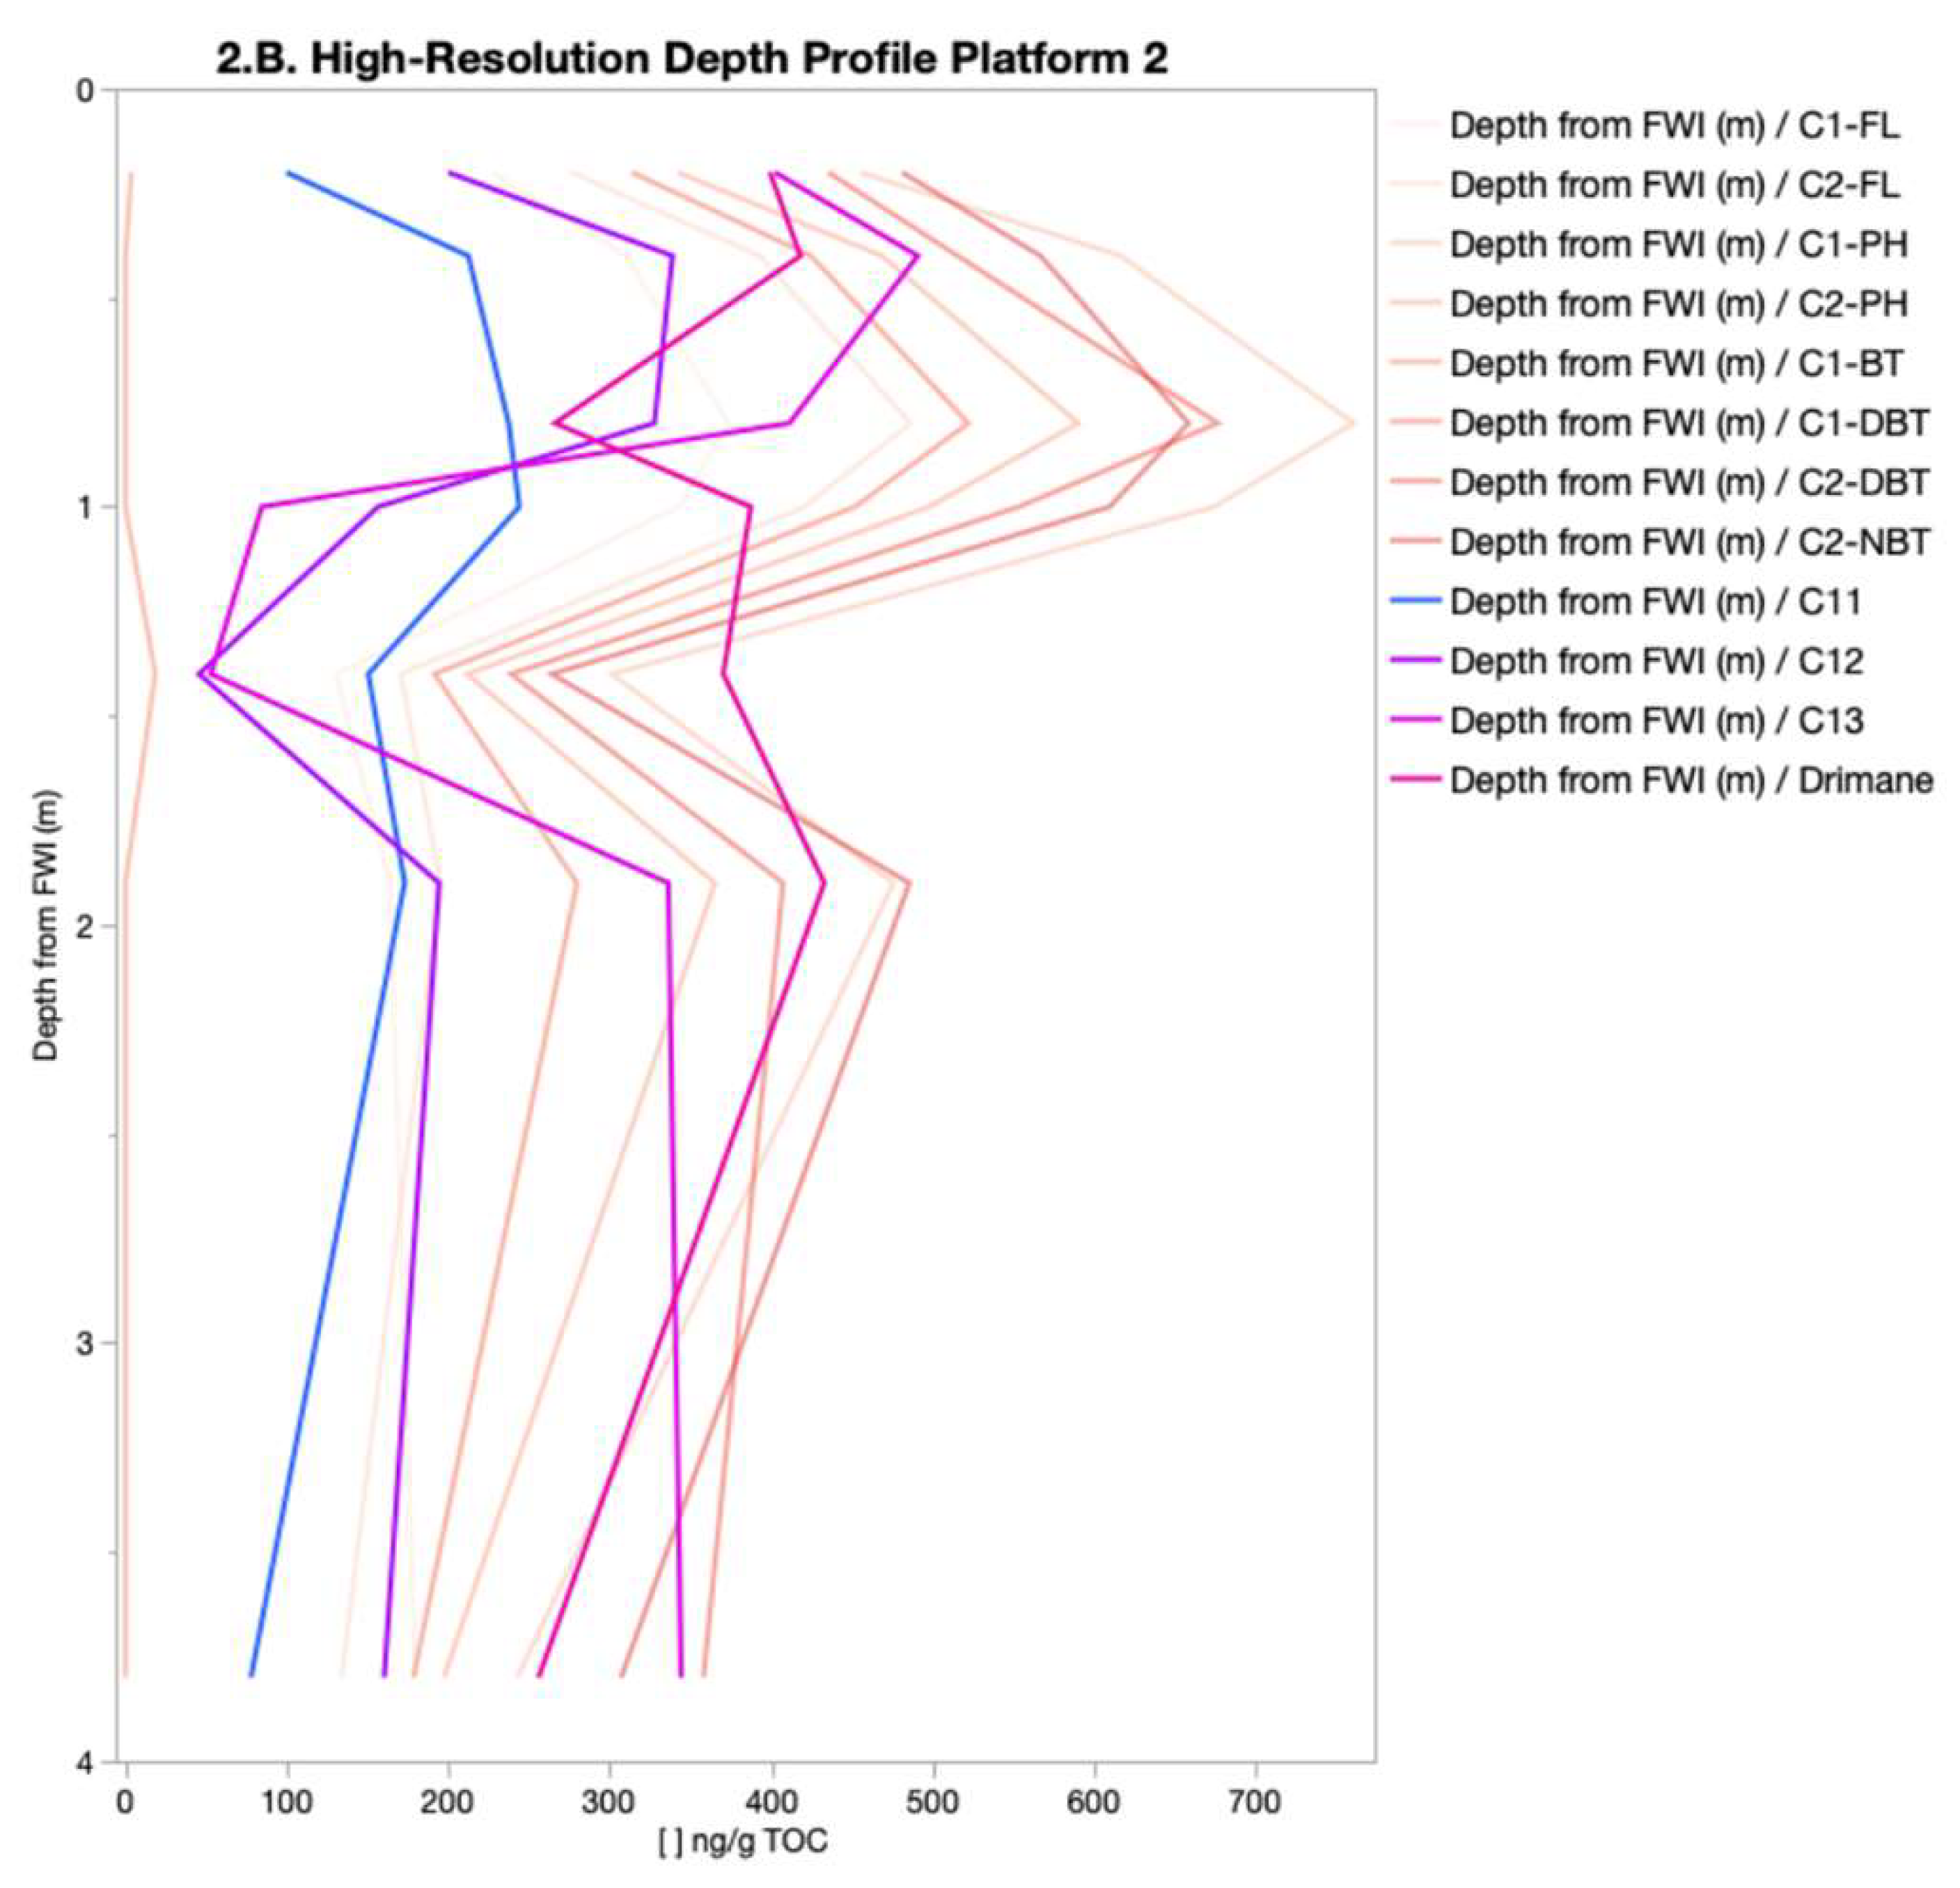
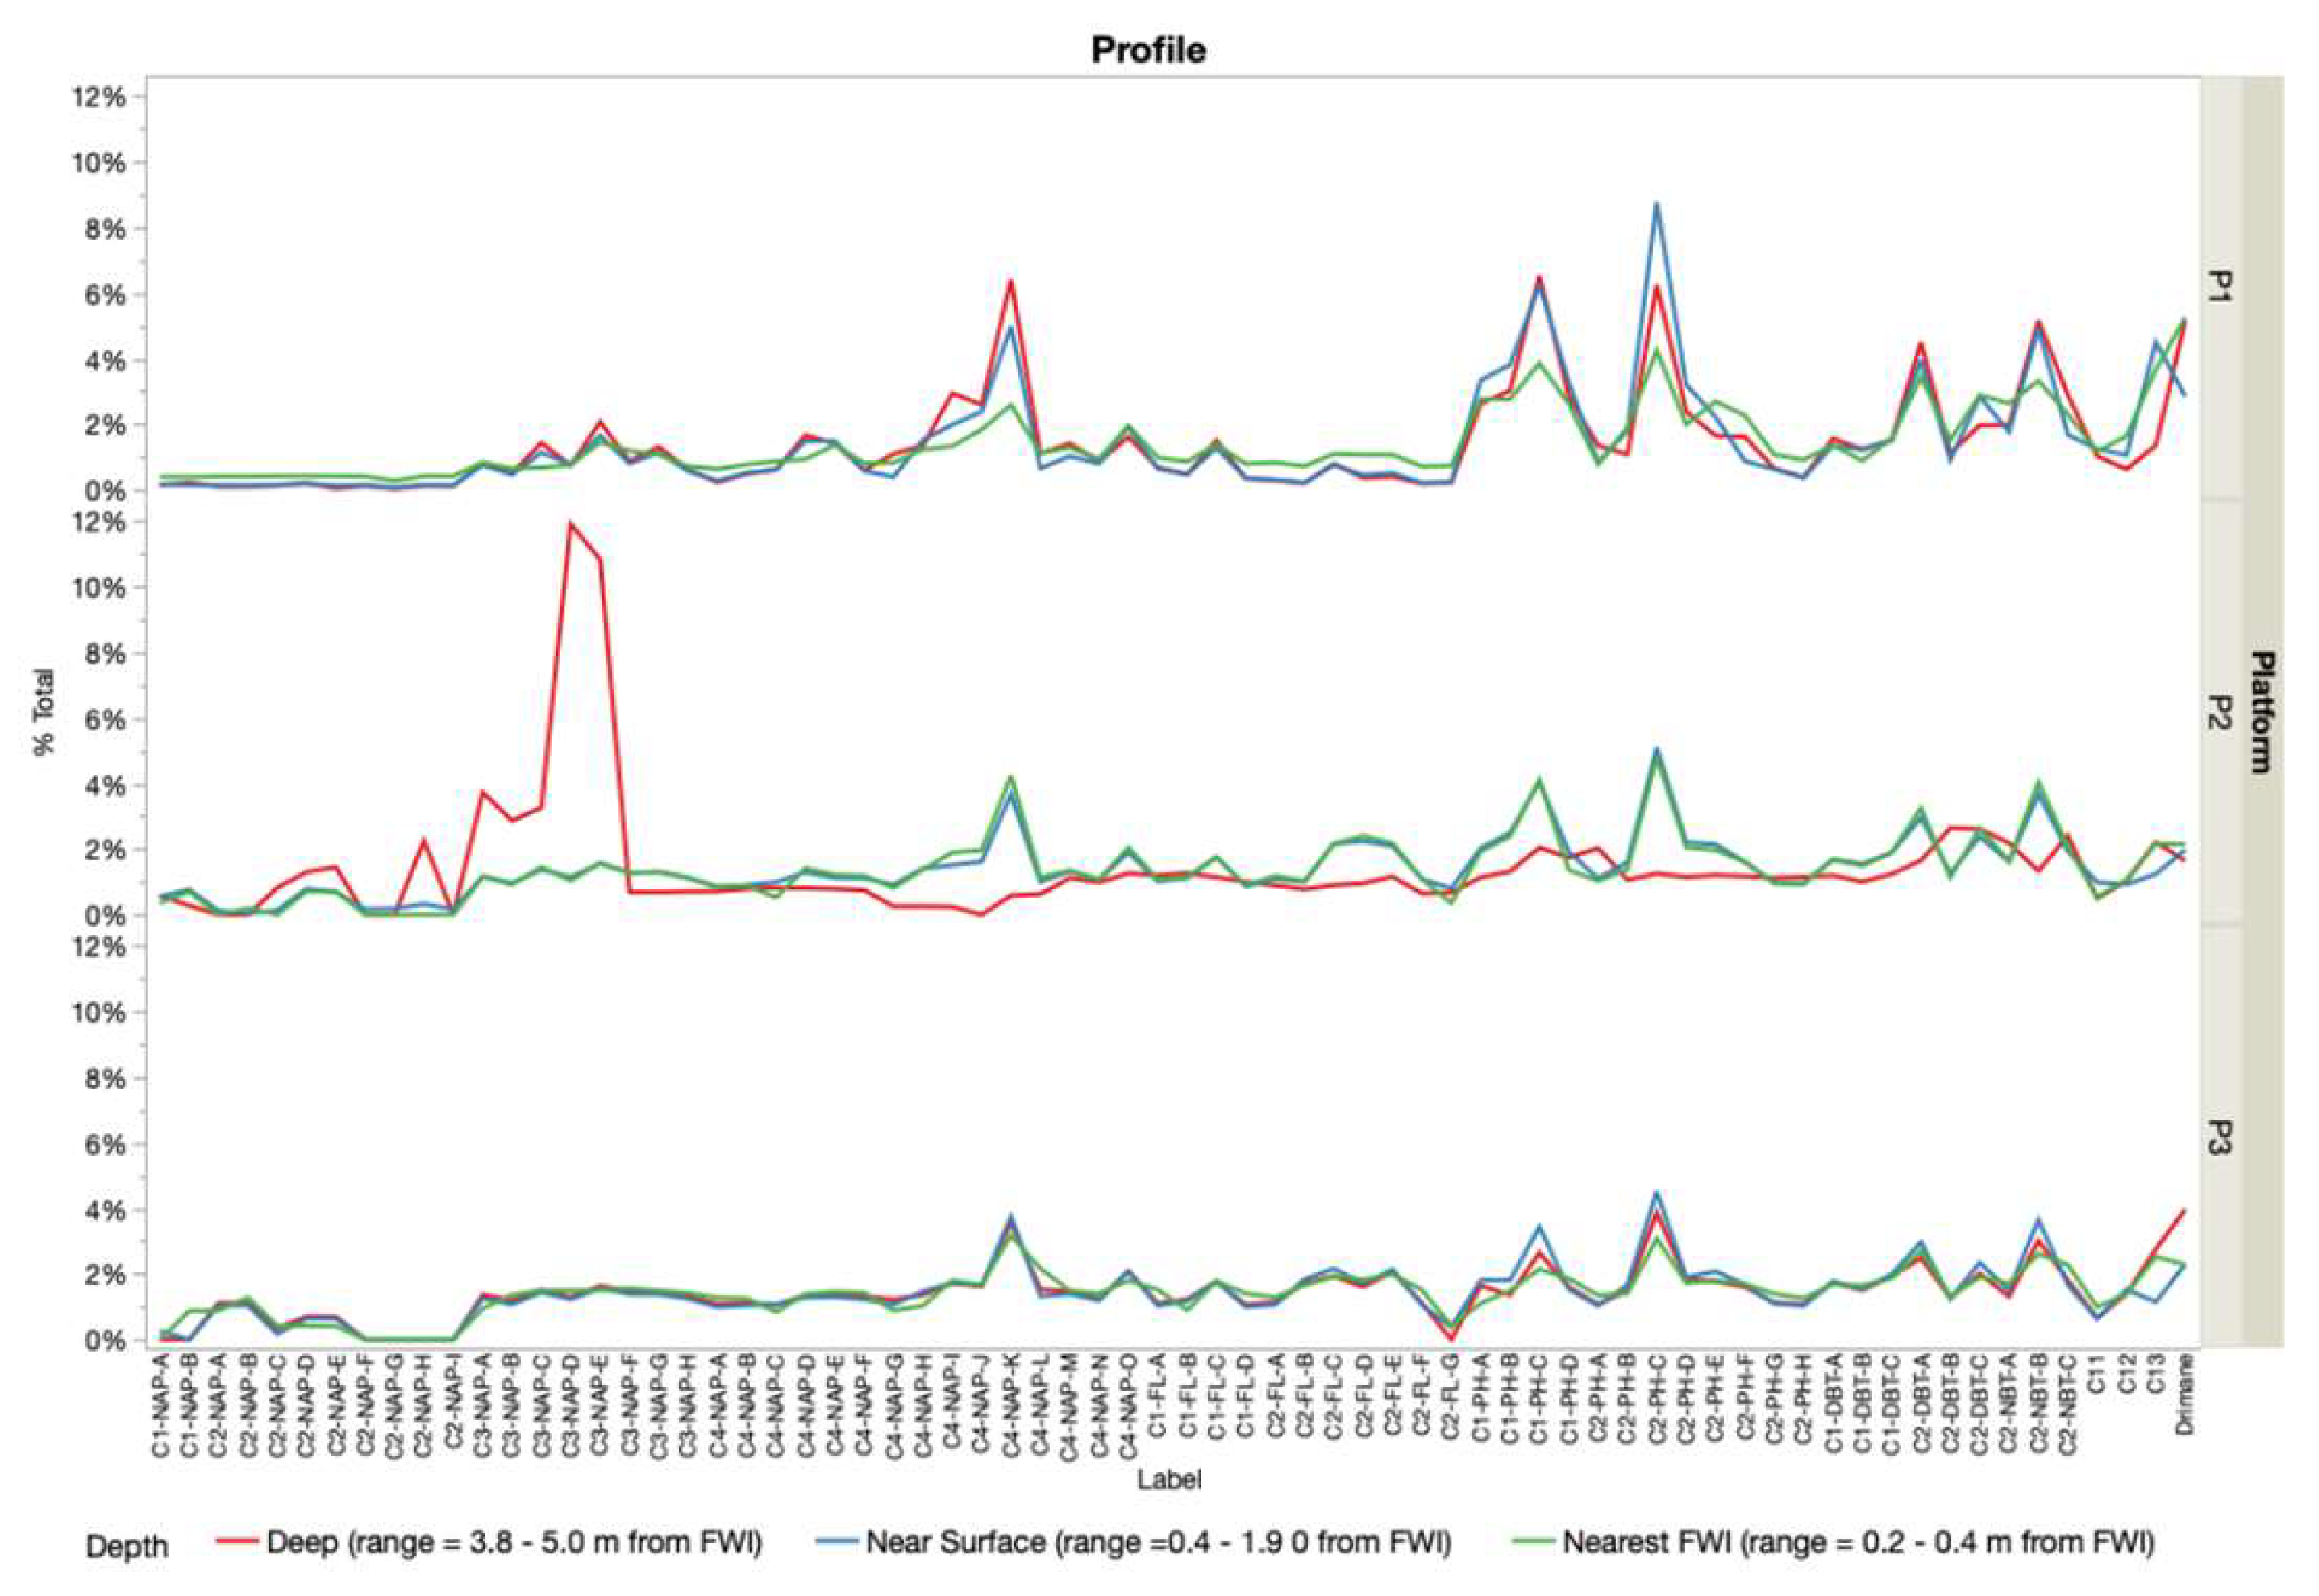
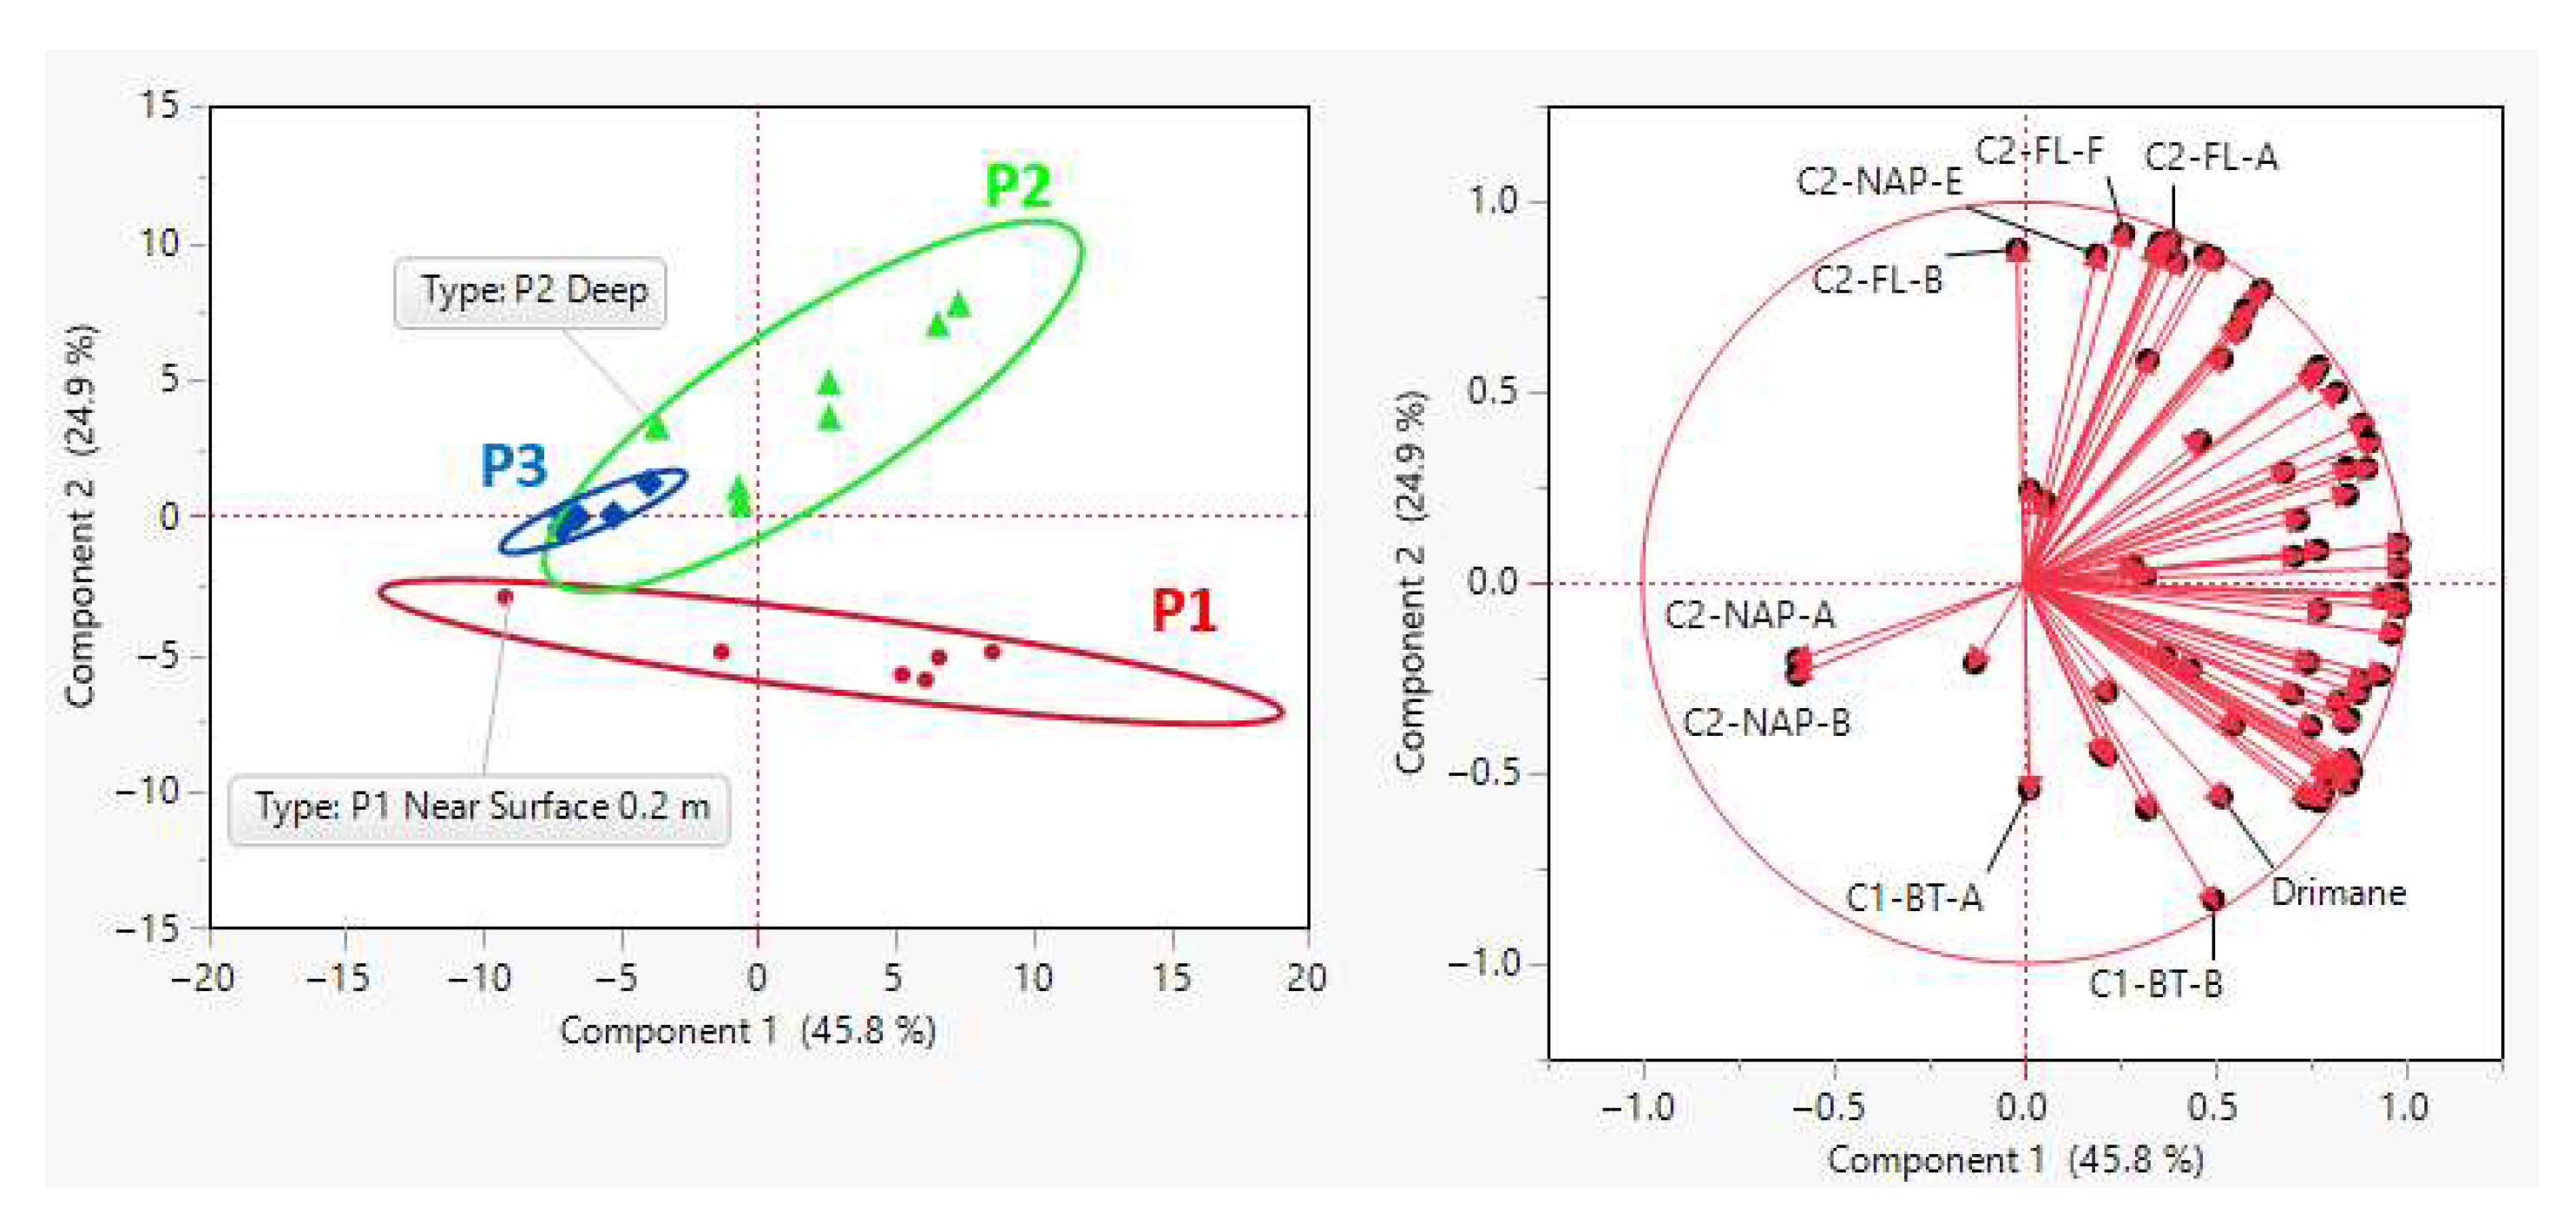
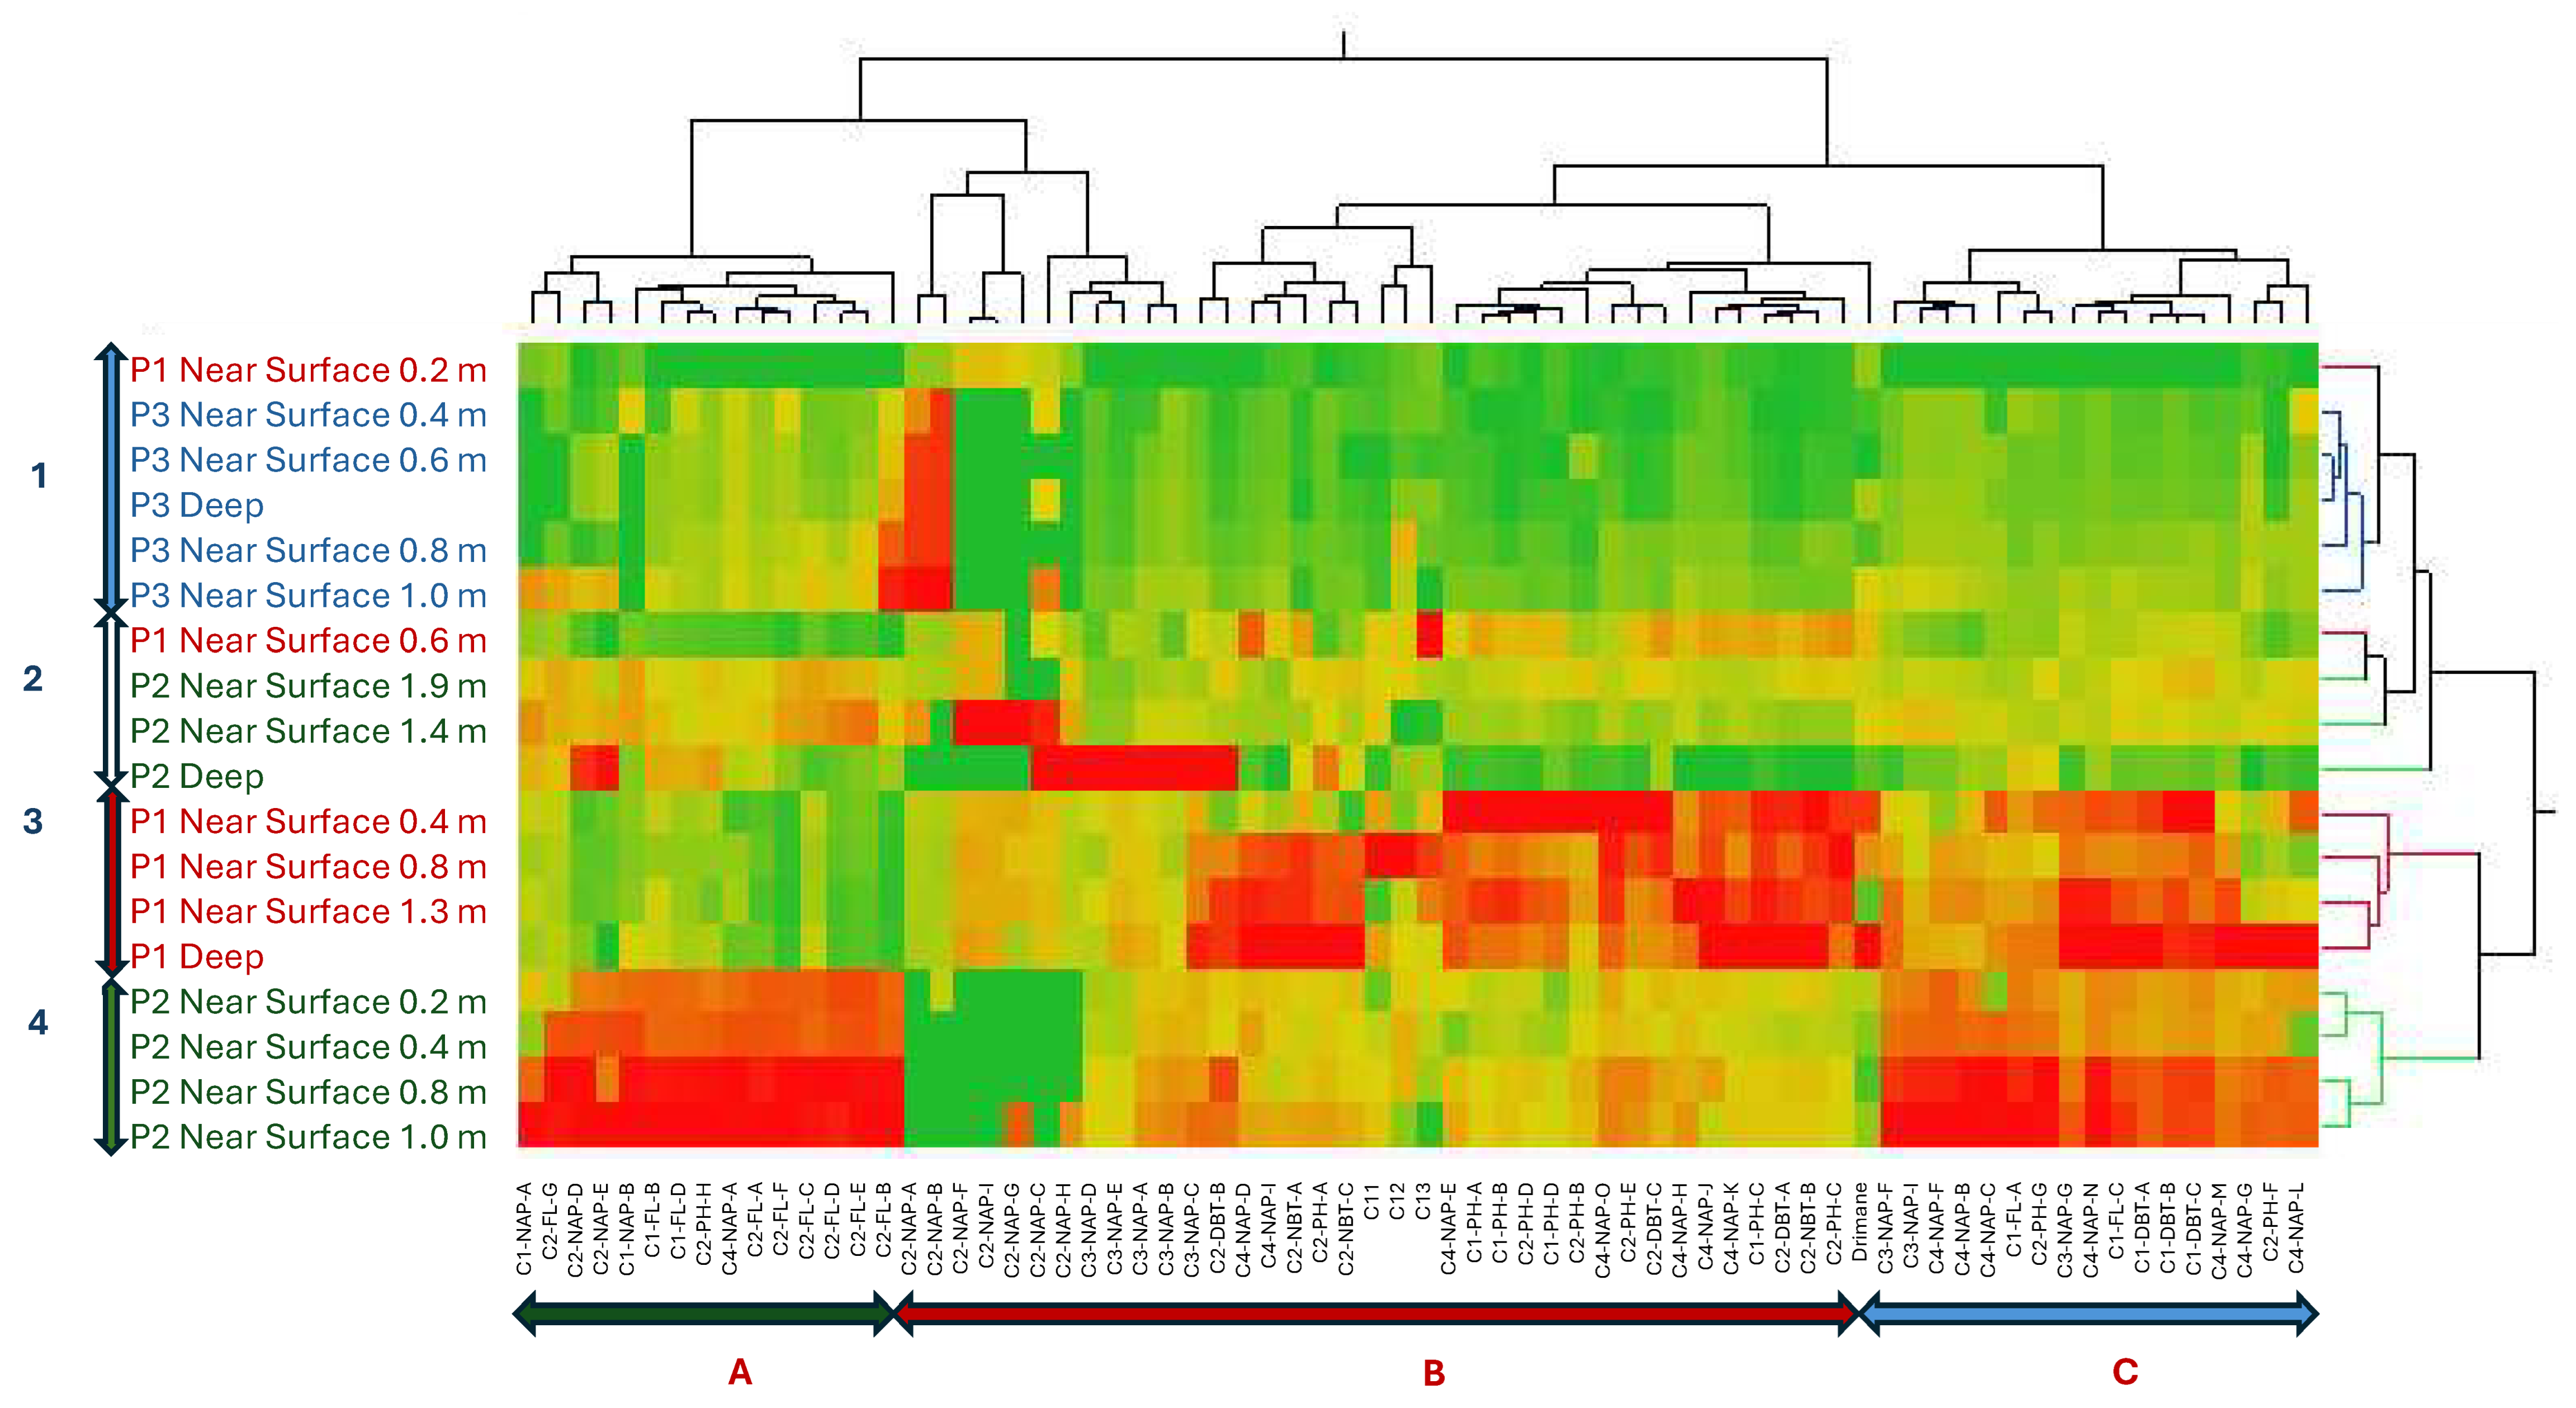
The spatial distribution of PHC concentrations (
Figure 2 and
Figure 3) revealed a consistent source signature, indicating a shared origin across samples. This was indicated by the dominance of specific isomers within their respective chemical classes (C1-DBT-C, C1-FL-C, C1-PH-C, C2-DBT-A, C2-FL-C, C2-NAP-E, C2-PH-C, C3-CAP-E, and N4-NAP-K). The presence of a consistent isomer fingerprint aligns with the expectation that the FFT in BML was filled from the same tailing storage facility. While the overall source consistency was expected, the variations in isomer concentrations between platform depth intervals point to possible influences from filling occurring at different times, biogeochemical cycling, and/or species exchange with the water column. The contribution of PHC inputs within P1 and P2 was distinguished by differences in the relative concentration of labile, low-molecular-weight isomers compared to heavier-molecular-weight isomers. Two-way HCA clustering highlighted that both platforms preferentially retained the same higher-molecular-weight polycyclic aromatic hydrocarbons (C3-NAP, C4-NAP, and C1-DBT) across depth intervals. However, P1 showed a depletion of lower-molecular-weight isomers (C1-NAP-A, C2-NAP-B, D, E, C4-NAP-A, C2-PH-H, C1, and C2-FL) compared to P2. This suggests that P1 may have undergone increased biogeochemical cycling, either through anaerobic microbial degradation or species exchange with the water column. Alternatively, the PHC inputs at P1 may have originally been depleted in these lower-molecular-weight isomers relative to the heavier ones. As the lower-molecular-weight species are expected to be preferentially biodegraded and have higher water solubilities [
12,
13], increased concentration of the lower-molecular-weight species relative to the heavier molecular weight species in P2 may be indicative of the potential release of by-products of biogeochemical cycling and/or species exchange with the water column. In addition to these platform-specific differences, the depth-resolved trends observed across all platforms likely reflect underlying redox gradients, microbial activity, and physicochemical partitioning. These factors influence the fate of labile compounds, such as n-alkanes, which are more readily degraded under anaerobic conditions, compared to the more recalcitrant aromatic hydrocarbons. This enhanced biodegradability of lower-molecular-weight n-alkanes relative to aromatic hydrocarbons likely contributes to their variable distribution, particularly in zones with higher microbial activity or oxygen availability.
5. Conclusions
This study confirmed that PHCs in near-surface FFT at BML originate from a common source. However, PCA and HCA revealed that specific isomer concentrations vary across platforms, likely due to biogeochemical cycling and/or exchange with the overlying water column. Notably, P1 and P2 retained similar higher-molecular-weight isomers (C3-NAP, C4-NAP, and C1-DBT class isomers), while P1 showed depletion in several lower-molecular-weight isomers (C1-NAP-A, C2-NAP-B/D/E, C4-NAP-A, C2-PH-H, C1, and C2-FL), indicating greater alteration or loss. In contrast, P3 exhibited less variation, suggesting minimal alteration. These chemometric tools are essential for distinguishing between original inputs and post-depositional changes, offering a robust framework for environmental forensic assessment of tailings-impacted systems.
While this study provides a comprehensive assessment of PHC depth profiles within Base Mine Lake FFT using GC × GC TOFMS, several limitations should be acknowledged. Source attribution remains partially uncertain due to the potential influence of ongoing biogeochemical transformation processes, such as anaerobic microbial degradation and exchange with the water column. These processes may alter the original chemical fingerprints of labile compounds, particularly lower-molecular-weight n-alkanes. Additionally, the use of grab sampling captures only a snapshot in time and may miss longer-term or seasonally variable trends, which could be more effectively monitored using passive samplers. Future research should incorporate advanced analytical strategies, including deconvolution algorithms and normalization of labile species against more recalcitrant markers, to better resolve degradation effects. Integration of microbial community data could further elucidate the role of biodegradation in PHC dynamics. These directions would strengthen the mechanistic understanding and long-term monitoring frameworks for tailings reclamation.
