Article

Directed Message-Passing Neural Networks for Gas Chromatography

by
Daniel Struk
1,
Rizky Ilhamsyah
1,
Jean-Marie D. Dimandja
1,2,* and
Peter J. Hesketh
1
1
GW Woodruff School of Mechanical Engineering, Georgia Institute of Technology, Atlanta, GA 30332, USA
2
School of Chemical & Biomolecular Engineering, Georgia Institute of Technology, Atlanta, GA 30332, USA
*
Author to whom correspondence should be addressed.
Separations 2025, 12(8), 200; https://doi.org/10.3390/separations12080200
Submission received: 29 May 2025 / Revised: 23 July 2025 / Accepted: 25 July 2025 / Published: 30 July 2025

Abstract

In this paper, the directed message-passing neural network architecture is used to predict several quantities of interest in gas chromatography: retention times, Clarke-Glew 3-point thermodynamic parameters for simulation, and retention indices. The retention index model was trained with 48,803 training samples and reached 1.9–2.6% accuracy, whereas the thermodynamic parameters and retention time were trained by using 230 training data samples yielding 17% accuracy. Furthermore, the accuracy as a function of the number of training samples is investigated, showing the necessity of large, accurate datasets for training deep learning-based models. Lastly, several uses of such a model for the identification of compounds and the optimization of GC parameters are discussed.

1. Introduction

Recently, machine learning and more specifically neural networks have seen tremendous growth in their usage in chemistry [1,2,3]. This has allowed for the prediction of products from chemical reactions to filter possible materials when directly testing materials would be expensive or time-consuming. Machine learning has also proven useful for analytical chemistry, seeing usage in both liquid chromatography [4,5,6] and ion chromatography [7,8] for the prediction of elution times and identification.
Gas chromatography is a widely used analytical chemistry technique for the separation and identification of volatile organic compounds and has seen use in a variety of fields, such as pharmaceuticals [9,10], agriculture [11,12], and forensics [13,14]. In gas chromatography, compounds are separated based on their boiling points and polarity relative to the stationary phase of the column, through which the sample passes. The stationary phase is typically a polymer, such as a polysiloxane, which can be chosen to yield the best possible separation. Compounds will hopefully elute from the column at separate times, and these times are determined by many factors beyond the stationary phase chemistry, such as the mobile phase velocity, the GC temperature (which is controlled as a function of time), etc. Gas chromatographs are frequently coupled with mass spectrometers for high accuracy compound identification. However, for non-targeted analysis, mass spectrum identification alone could lead to compounds’ misidentification, necessitating a cross-identification with compound elution parameters such as elution time or retention index.
There are models for predicting the retention time using thermodynamic parameters, such as the three-parameter thermodynamic model [15,16], ln K = A + B T + C l n T , where K is the distribution factor and A, B, and C are the three thermodynamic parameters. While this would allow for accurate simulation and identification, these parameters are difficult to calculate from first principles, and only very limited databases exist. For instance, Ref. [17] has 1868 entries, with some of them being duplicate compounds for different columns. If there was a model that was able to accurately predict either the retention times or the thermodynamic parameters, the parameters governing a GC experiment could be optimized by simultaneously maximizing the pairwise peak distances while trying to minimize the peak widths.
Compound identification through elution time, although straightforward, has some limitations. For instance, elution time is reproducible for a single system using the same parameters; such parameters might not be reproducible for a different system. In order to account for this, frequently raw elution times are not used for identification but rather normalized retention indices. Several different forms of retention indices exist, with the Kovats and Van Den Dool indices using alkane elution times for normalization and Lee indices using aromatic elution times. The Van den Dool index can be calculated via [18]
R I x = 100 n + t x t n t n + 1 t n
and the Kovats index via [19]
R I x = 100 n + ln t x l n ( t n ) ln t n + 1 ln t n
where tx, tn, and tn+1 refer to the elution times of the unknown compound and the two bracketing alkanes with carbon number n (preceding) and n + 1 (succeeding). The equation for the Lee index is analogous to the Van Den Dool equation but using the elution times of aromatics in place of those for the alkanes [20]. With the Van Den Dool and Kovats indices both using alkanes as the normalizing compounds, these two indices are frequently close to each other as compared to the Lee index, which can vary greatly compared to the other two. The National Institute of Standards and Technology (NIST) maintains a database of retention indices, with their mass spectra database available online [21] or through their compound identification programs. Prior work by our group as well as other groups has used retention indices to aid in the identification of compounds [22,23,24,25]. A shortcoming of the NIST database is that it only contains retention index data for several broad classes of columns: nonpolar, which refers to polydimethylsiloxane columns such HP-1 columns, and polar, which refers to polyethylene glycol columns such as DB-Wax columns.
Besides helping identify compounds, the retention index can also be used for the optimization or more specifically the column selection of two-dimensional gas chromatography. For a 2-D GC separation, the qualitative separation in the first dimension can be predicted by the retention indices of the analytes in the first-dimension column, and the qualitative separation in the second dimension can be predicted by an exponential function of the difference in the retention indices of the compounds for the two columns [26,27]. If a model that predicts retention indices can be trained for each column, then the best pair of columns could be picked for any given set of analytes.
While the NIST database does have data on a wide variety of compounds, it is unrealistic to expect every single compound to be tested and listed. As such there have been efforts to predict retention indices based on the compound characteristics. For instance, C.T. Peng used a simple linear fit of 82 different rules based on different groups and substitutions for nonpolar columns and 119 different rules for polar columns, achieving less than 3% relative error [28,29]. Although the studies are empirical, this shows a promising systematic correlation between the compound structure and the elution parameters. Deep learning approaches have also been attempted using convolutional neural networks and deep residual multilayer perceptrons, with errors of 0.8–2.2% [30,31]. This multimodal method relied on several inputs, including an image of the molecular structure and the SMILES. Inclusion of an image of the molecular structure increased the accuracy versus a model using only SMILES data but also limited the scope of the applicability due to limitations imposed by the fixed image size. Thus, a model that has the accuracy of the multimodal method but without the drawbacks is desirable.
Recently a more specialized deep learning approach, directed message-passing neural networks, has been developed, with a specific architecture named “Chemprop” being used for the prediction of numerous chemical properties, such as IR spectra [32], lipophilicity [33], solvation free energy [34], and more [35]. The model architecture is described more fully in [35]. In short, in the Chemprop model, the SMILES representation of a molecule is used as input, which is then transformed into a directed molecular graph which undergoes several matrix operations before outputting the desired feature. This includes several iterative operations which are designed to propagate the effect of each atom within the molecule as well as several iterative operations that are designed to extract the desired features. In this study, we investigate the capability of the Chemprop architecture in predicting elution time, thermodynamics parameters, and retention indices. We aim to understand the achievable accuracy given its data availability and discuss how predictive models can improve compound identification.

2. Materials and Methods

For all models, Chemprop 2.1.1 was used. Data in the form of the thermodynamic parameters for gas chromatography simulations was retrieved from [17]. The data was grouped by column stationary phase, and the stationary phase with the highest number of compounds was Rxi-5Sil MS, so that stationary phase was used for the sample data. The parameters for 287 compounds on an Rxi-5Sil MS stationary phase were retrieved and used to train a directed message-passing neural network model. Furthermore, these parameters were used in accordance with the simulations described in [15] to simulate multiple gas chromatography experiments. The specific parameters of these simulated experiments were constant inlet pressure at 15 psi (relative to the outlet pressure of 14.7 psi), column length of 30 m, column diameter of 250 um, and film thickness of 0.25 um. Three different temperature ramp rates were simulated, 5 °C/min, 10 °C/min, and 15 °C/min. The predicted retention times were then also used to train a neural network model.
Nonpolar retention index data on 60,104 distinct compounds and polar retention index data on 5853 distinct compounds were retrieved from the NIST 17 database, and the accompanying SMILES data for each compound was retrieved from the NIH PubChem database [36]. When available Kovats indices were used preferably over Van Den Dool indices, and Lee indices were not used at all. Compounds with multiple retention index entries were reduced to a single value by taking the average of the multiple entries. Several models, all with the directed message-passing architecture, were fit, including on the initial data and one on data that was filtered according to whether it was corroborated by multiple sources, i.e., had multiple distinct sources, and whether the standard deviation of the entries was below 20 units. This is due to some of the data included in the NIST 17 data having potential flaws, and some of the entries were corrected in later versions [37]. This filtering reduced the sizes of the nonpolar and polar datasets to 7817 and 3192 distinct compounds, respectively. A model was also trained on the intersection of these two datasets, yielding 2463 compounds. These five models, the nonpolar/polar and unfiltered/filtered models, were each trained and tested three times on different splits as cross-validation, and the means of their statistics are reported. All of the datasets used to train the various models are summarized in Table 1.
Preliminary testing of different values of the hidden directed edge feature size was performed using values of 50, 100, 150, 300, 400, and 500 using the nonpolar retention index data. Further increases above the default value of 300 were seen to have a beneficial effect on the mean square error, but this effect was diminishing; thus, the feature size was kept at the default value of 300 as increasing it could lead to overfitting and decreasing it could lead to too few parameters to describe molecules. The default value of 64 was used for the batch size to prevent problems with convergence, training speed, or memory. Likewise, all variables concerning the learning rate were kept at their default values, and the adam optimizer was used. Specifically, the learning rate increased from 10−4 to 10−3 during the first two warmup epochs, and then exponentially decreased back to 10−4 for the remaining epochs. The mean square error was selected as the error function. Training consisted of 80 epochs, and then testing was performed on the model that had the best validation score during training.
Several versions of the model using the nonpolar data were also trained using different proportions of the dataset; however, other than for these models, the default values of 0.8 for training, 0.1 for validation, and 0.1 for testing were used in accordance with [38]. Specifically, for the version of the model that was trained on different numbers of compounds, the proportion used for training was varied from 0.05 to 0.8, the proportion used for validation was held at 0.1, and the rest of the data was used for testing.
Furthermore, several models were trained using different depths for the hidden directed edge features and fully connected layers. For the hidden directed edge depth, this ranged from 3 (default value) to 10, and for the number of feed-forward layers, this ranged from 1 (default value) to 10. Both the various models trained on various numbers of compounds, and the various models with different depths were trained on the filtered data.

3. Results

The accuracies of the directed message-passing network trained on absolute retention times and the model trained on thermodynamic parameters from [17] are summarized in Table 2 and Table 3, respectively. Both models show greater than 10% error. This is likely highly attributable to the small number of samples. It is possible to iteratively calculate the thermodynamic parameters from retention times and vice versa, and it is difficult to say whether the model type seems to be able to predict one particularly better than the other.
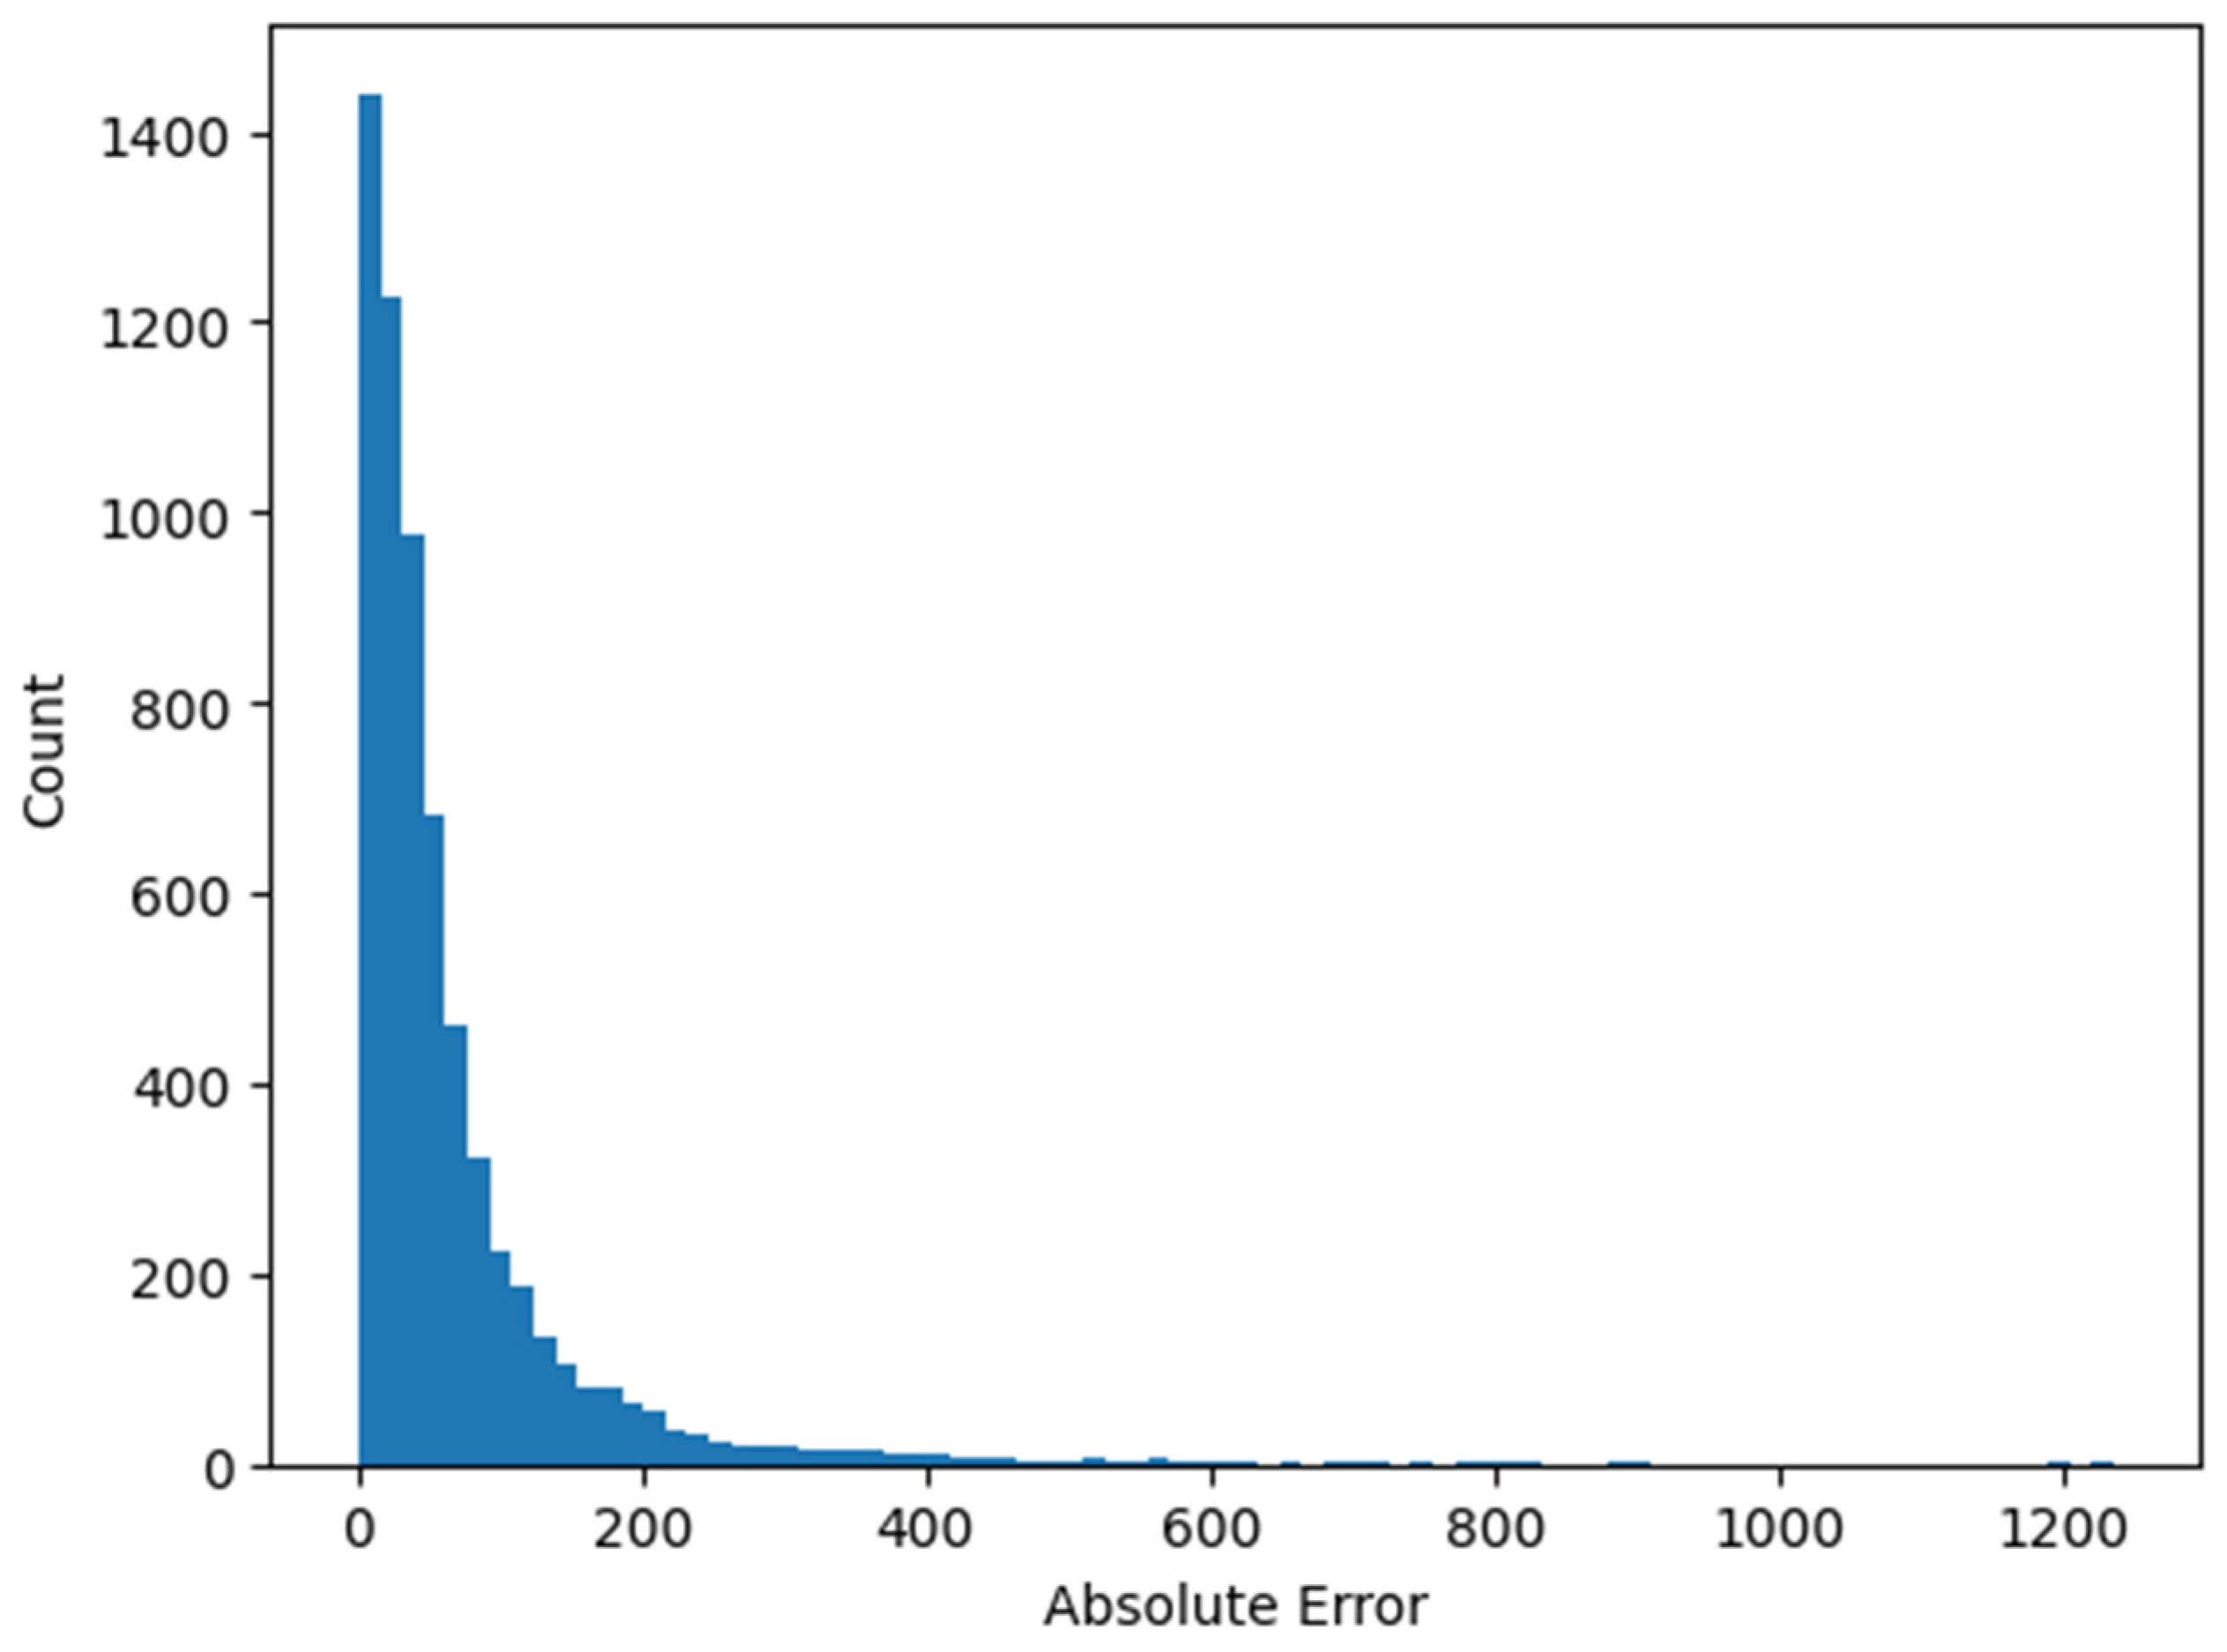
The accuracy of the models trained on the NIST unfiltered and filtered retention index datasets is summarized in Table 4. Plots of the errors of the nonpolar and polar models as functions of the reported retention index are shown in Figure 1 and Figure 2. As each plot contains thousands of the points, there is a large cluster of points around zero error with a countable number of outliers.
In all five models, there is a difference between the error for the test set and the full set ranging from approximately 6 units to 13 units. There should be a difference as the full set includes data that the model was specifically trained on, but large differences can be indicative of overfitting, i.e., the model is failing to generalize to data outside of the test dataset. The use of a validation set is specifically designed to prevent overfitting, and it seems to have been successful in these models.
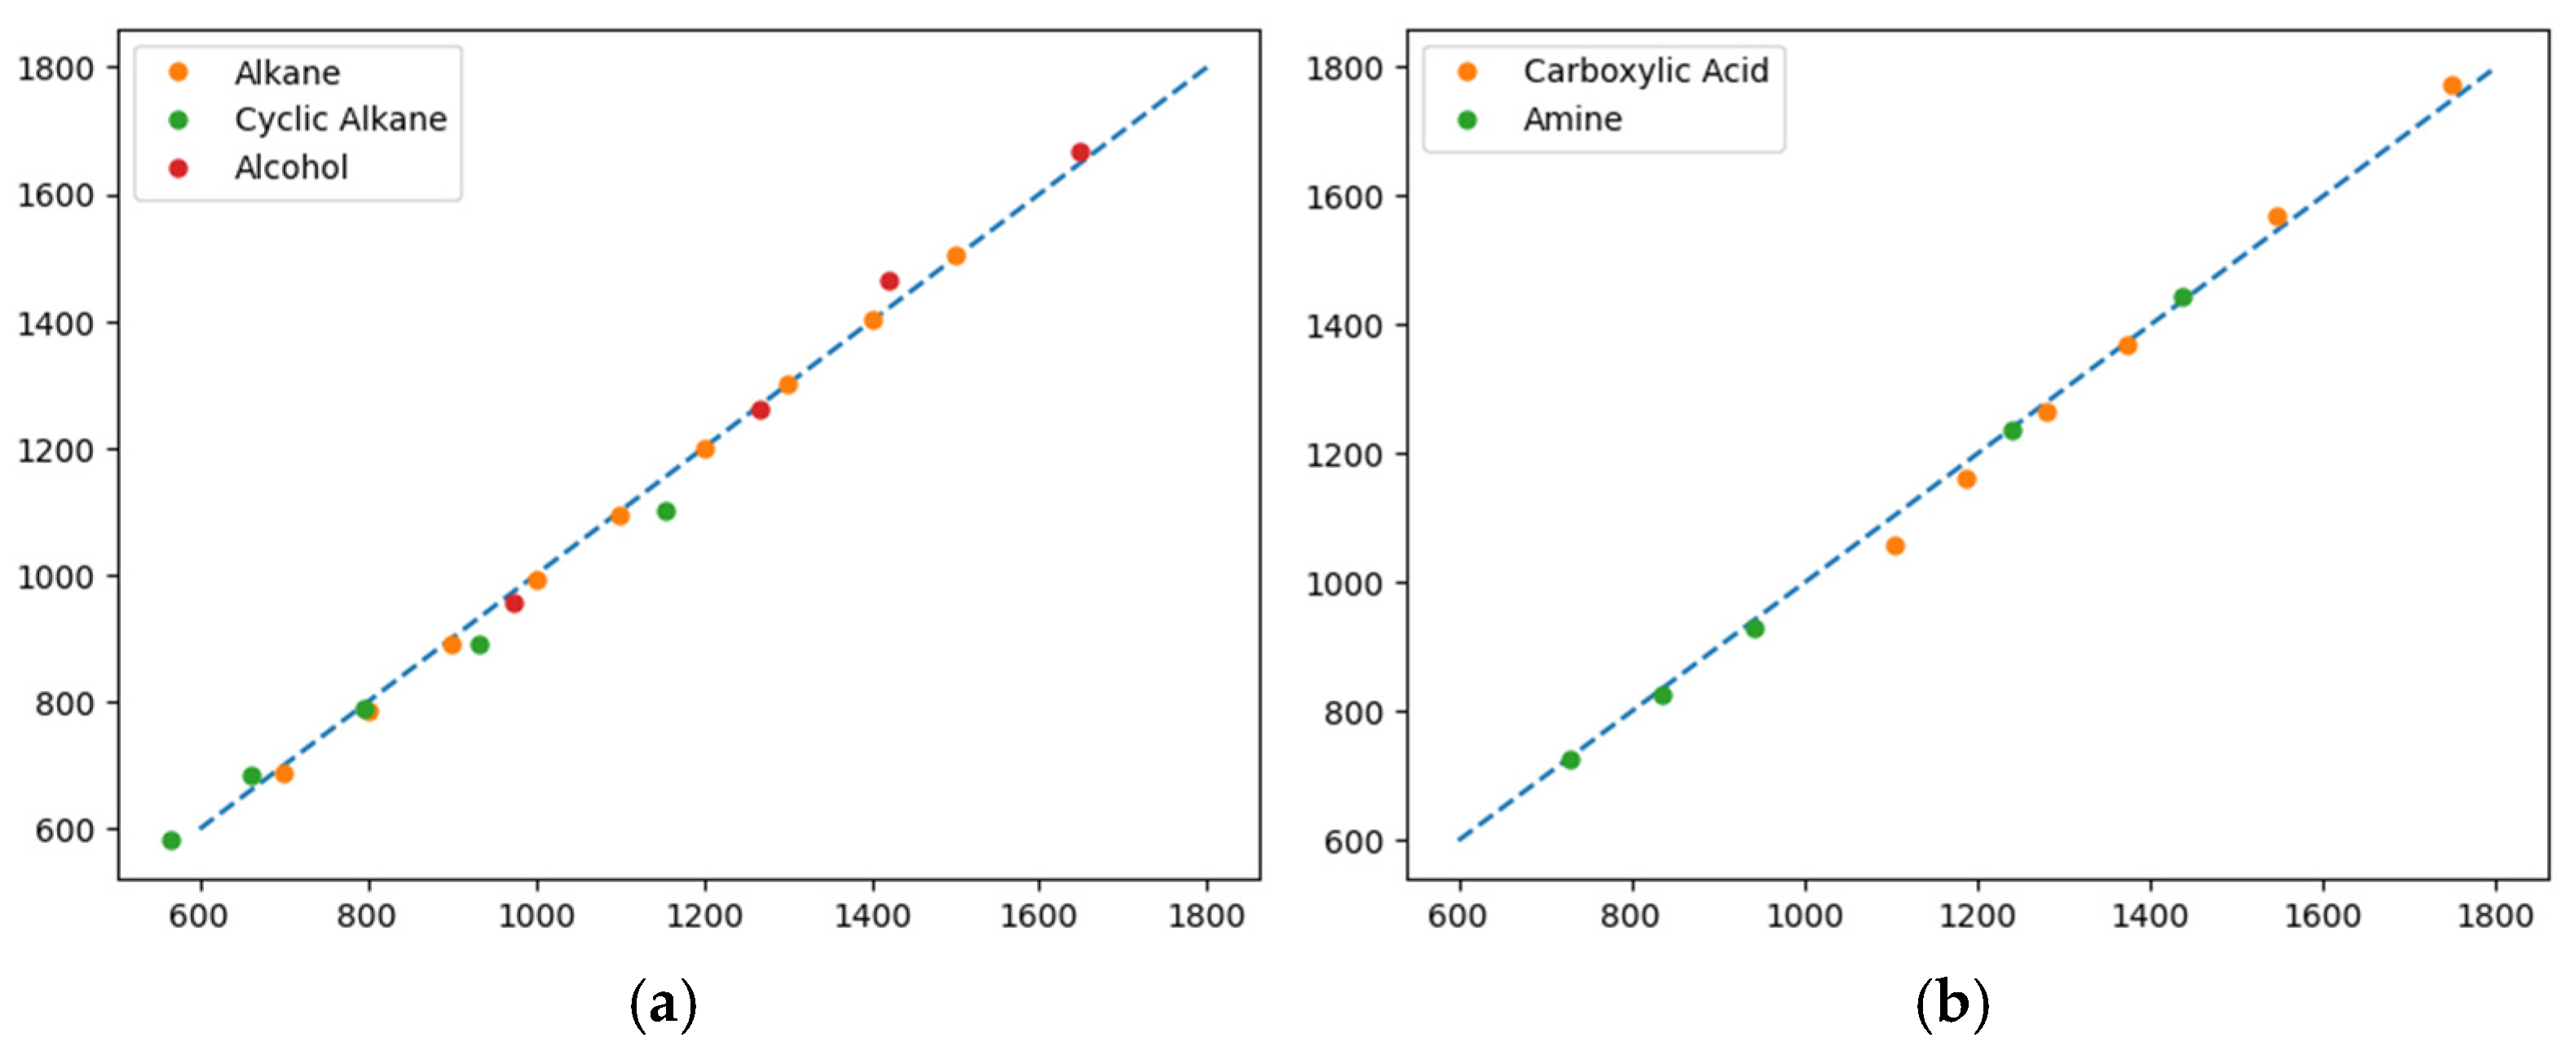
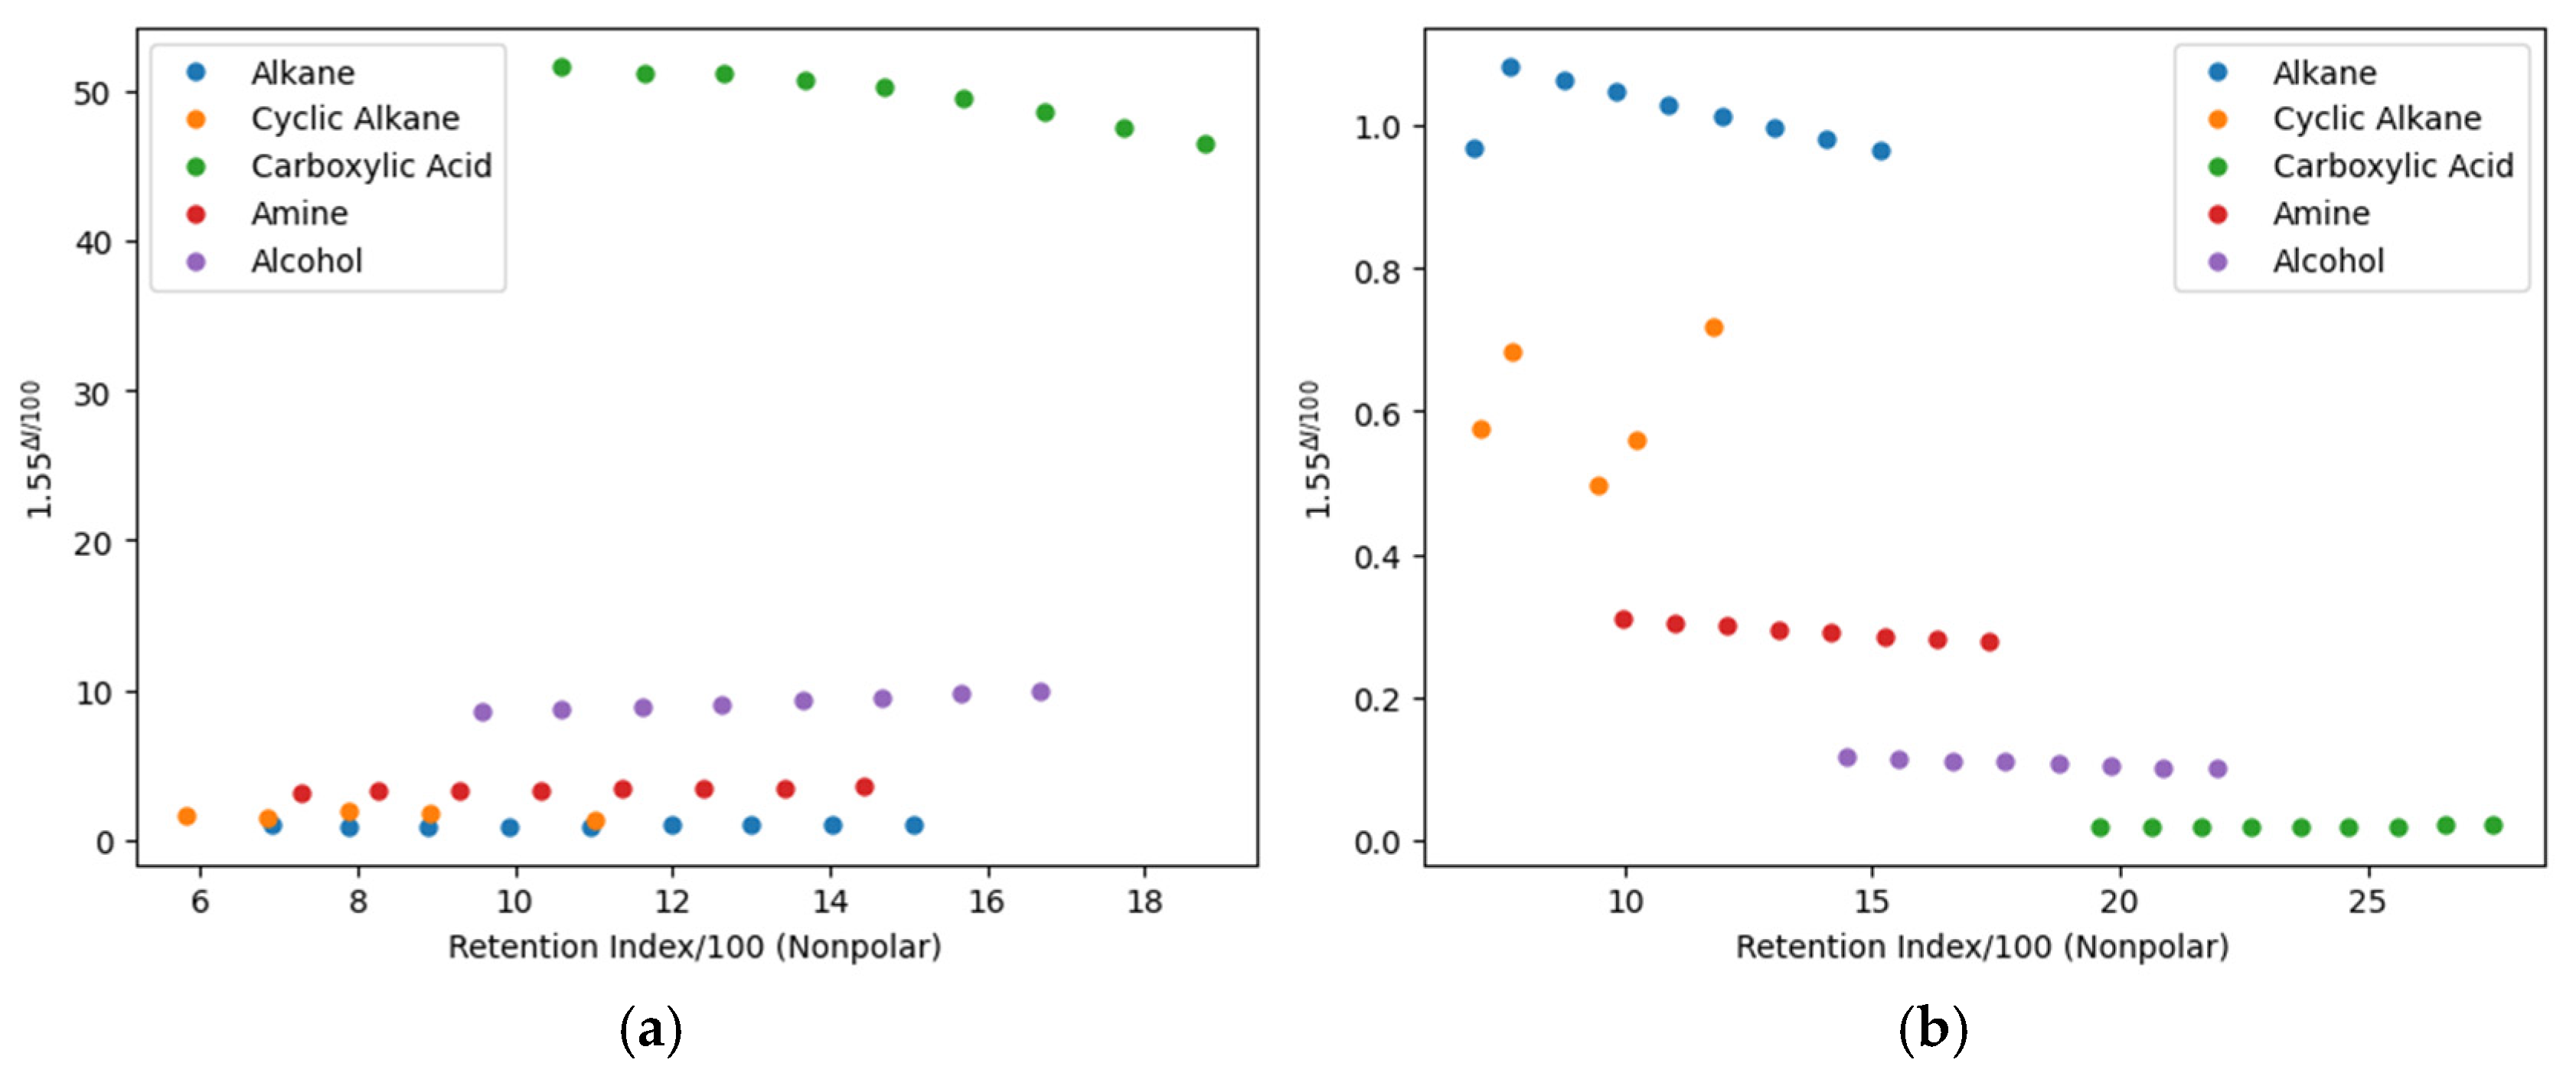
To investigate systematic error dependent on groups, a parity plot of several common groups in the primary position on various alkanes, or monocycloalkanes in the case of the cycloalkanes, was made, as shown in Figure 3a,b, using the experimental data from [28]. For these figures, these compounds were explicitly excluded from the training set, and then the model was used to predict their values. From this figure, of the five groups, the cycloalkanes appear to deviate furthest. These errors are further illustrated in Figure 4a,b with simulated 2-D chromatograms that coincidentally show which column ordering could produce a better separation but also the lack of reproduced structure for the cycloalkanes in Figure 4b. This could be due to limitations in how far the model can properly interpret the connectivity, which is partially substantiated by cyclodecane having the highest error.
Figure 5 shows the mean absolute error as a function of the number of compounds used for training. There is a general decrease in error as more compounds are used to train the model, with the test set having slightly higher error.
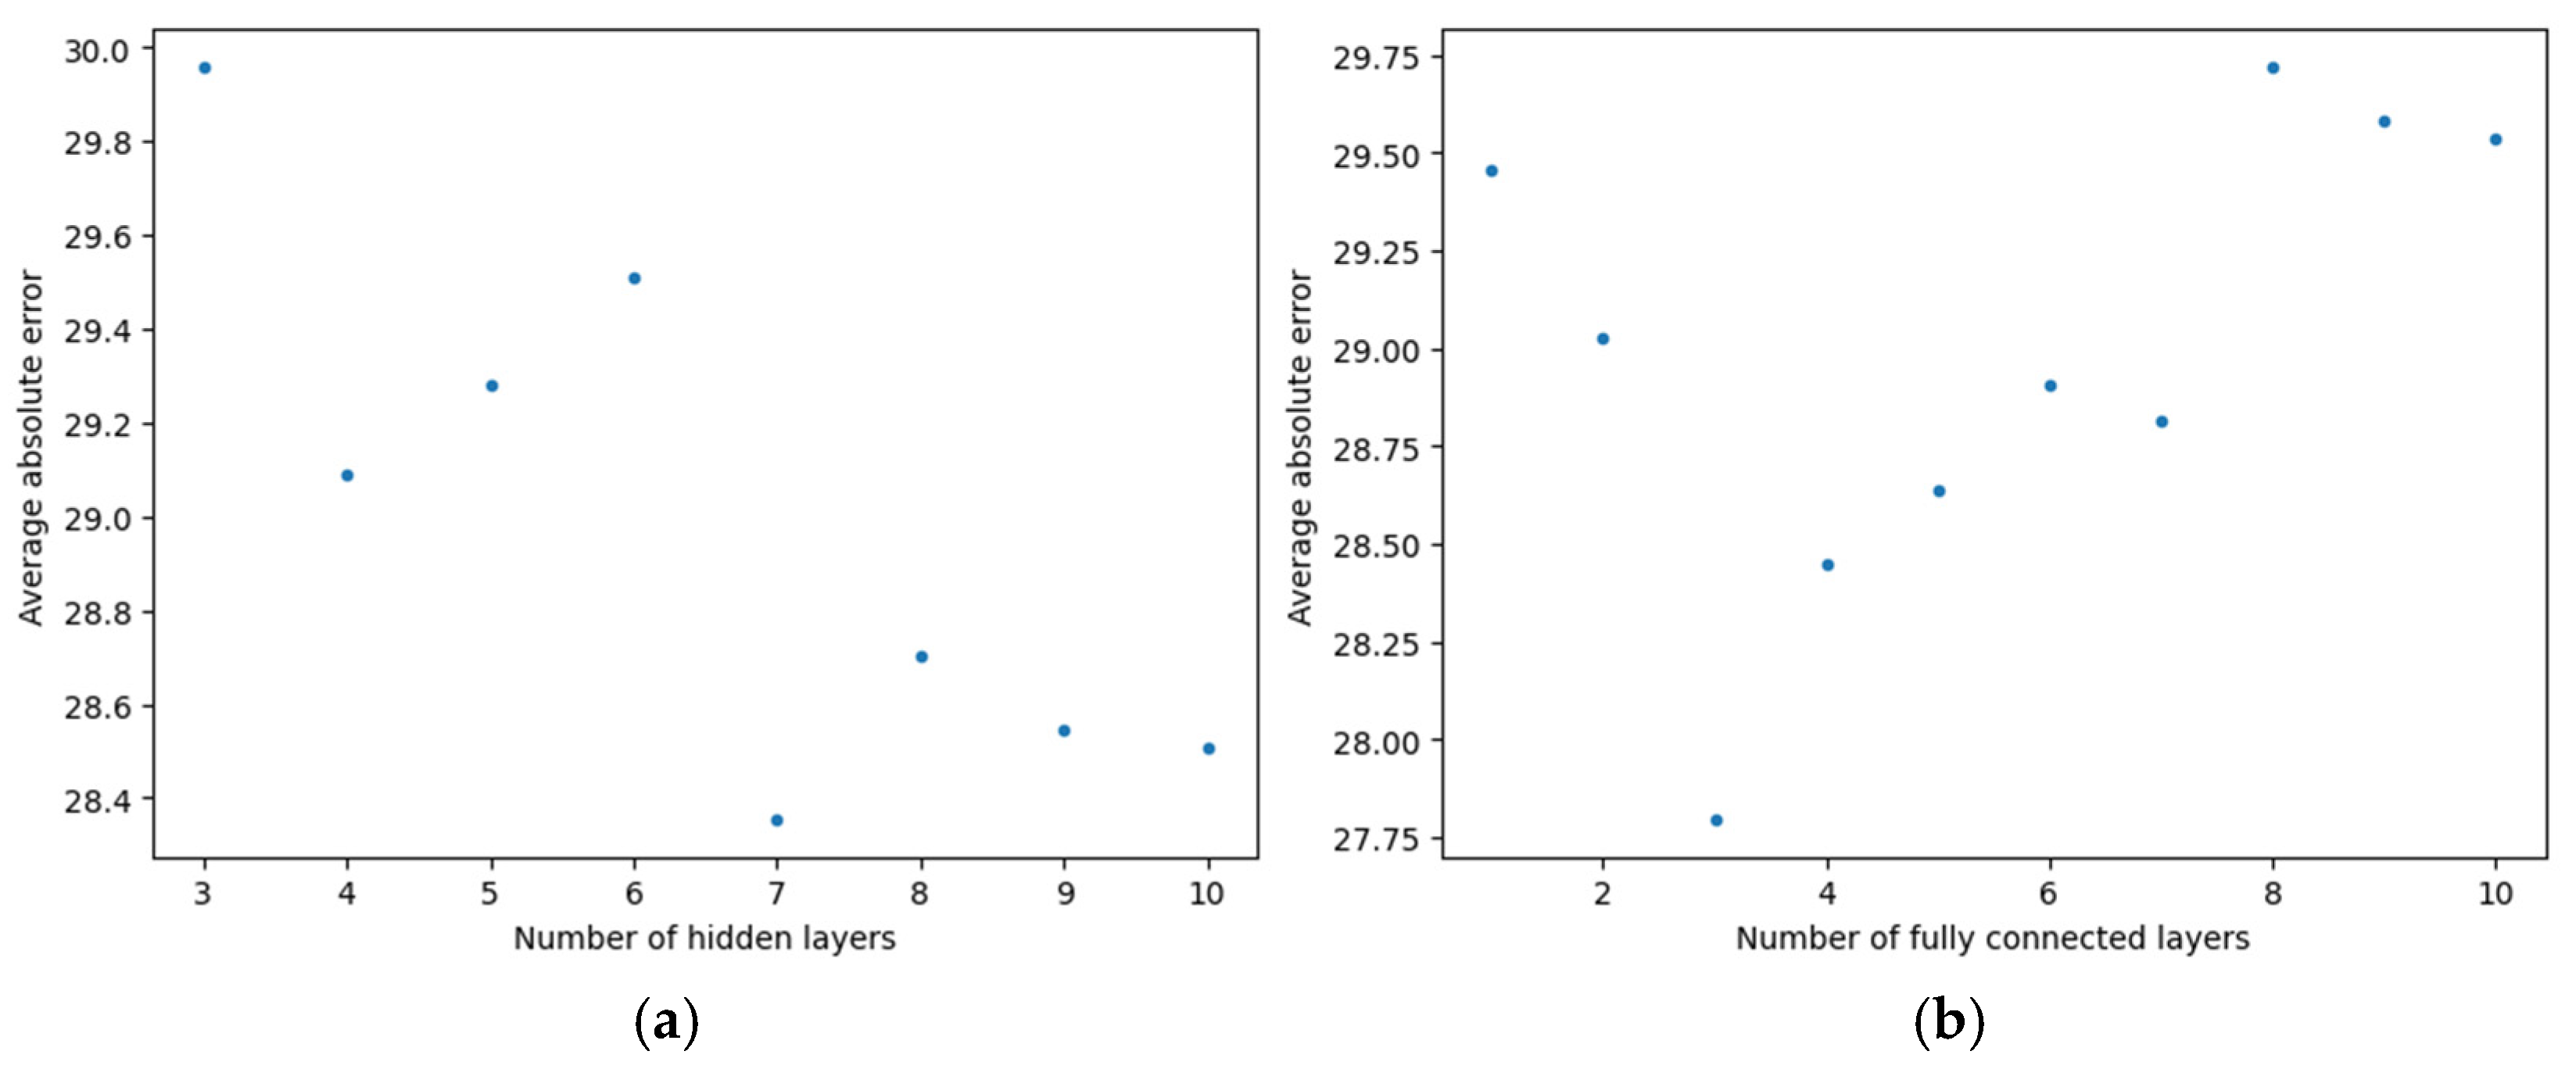
Figure 6a,b show the effect of changing the number of layers on the mean absolute error of the test data. Each datapoint in Figure 6a was calculated by letting the number of fully connected layers vary from 1 to 10 and then averaging the data, and this was repeated for each number of hidden messaging layers. An analogous procedure was carried out for Figure 6b, averaging over the changing hidden message layers for each number of fully connected layers. Increasing either number of layers had negligible effects on the accuracy while increasing the time necessary to train the model.

4. Discussion

From the histogram in Figure 1, the error seems approximately Gaussian, and by fitting it, the standard deviation can be calculated to be 86. The highest error points belonged to compounds that themselves had high standard deviations in their retention index data. Whether these points are truly outliers or erroneous values can only be determined through experimentation. Regardless, the difference in accuracy between the models trained on the full datasets and filtered datasets shows the importance of careful data curation. For both nonpolar and polar models, the filtering of the datasets caused a marked increase in the accuracy by both absolute and relative metrics despite the huge reduction in the number of compounds, illustrating that high-quality, curated data is of utmost importance. This can be explicitly shown by training a model on the unfiltered datasets with the test data from the filtered models removed and then testing it on the same test data as the filtered model. Applying this procedure for the nonpolar and polar datasets yields mean absolute errors of 37.28 and 64.33, respectively, both of which are higher than their filtered counterparts. Furthermore, the model trained on the intersection of the filtered nonpolar and polar datasets has an accuracy between the two, as one would expect, despite the more limited dataset size.
The measure of the error as a function of training data size is useful if one were to make a model to be used to take the place of a retention index database, such as for an unrepresented column (i.e., ionic liquid phases such as SLB-IL60 or even mid-polarity phases such as trifluoropropylmethyl polysiloxane-based Rtx-200 columns or phenyl-methylpolysiloxane Rxi-17 columns). At 1000 compounds, the mean error is within approximately 55 units, and depending on the chemical space of interest, 1000 compounds could consist of quite a few common compounds. As such, creating a workable model for any column could be accomplished by a countable number of labs covering distinct chemical spaces.
Furthermore, there is some relationship between the nonpolar and polar retention indices, even if it is difficult to explicitly define. Thus, having a multitarget model would most likely be beneficial, but this is limited by the disparity in size between the two datasets as well as the small number of compounds in common between the two datasets.

5. Conclusions

Several deep learning models for various gas chromatography quantities, including retention time, thermodynamic parameters for simulation, and retention indices, have been developed. Using a large and accurate database allowed the model to calculate retention indices within less than two percent. Recording the error as a function of training size as well as the performance of the models trained on a small number of retention times and thermodynamic parameters reiterates the need for large amounts of data to train a model with reasonable accuracy.
The prediction of retention times and thermodynamic parameters shows some promise but is hindered by the lack of referenceable databases, and given the large number of possible gas chromatography run conditions, such a database would be difficult to create. Even more desirable would be a model that would take in both compound and stationary phase as input, but the chemical formulation of many stationary phases is proprietary information. With only a retention index model for the columns of interest, many of these things can still be reasonably estimated, however, with experimental alkane elution times.
In contrast, the prediction of retention indices is much more approachable, and there is already a decently sized library to test any methodology (the nonpolar retention index library) as well as a significantly smaller library that acts as an obvious use case for retention index prediction (the polar retention index library). It took approximately 4700 retention index entries to create a model allowing prediction within an error of 30 retention index points; thus, the polar library could be predictively filled in to aid in retention-index-based identification but with a worse error of approximately 40 retention index units. If such a number could be replicated for more than just standard polar and nonpolar columns, it would allow for significantly easier identification and optimization of those columns as well in both one-dimensional and two-dimensional modes. Identification can be assisted by cross-checking retention indices of candidate compounds nominated by a mass spectrometer, and column choice can be optimized by either picking the column with the widest distribution of indices or, in the case of two-dimensional gc, creating a qualitative chromatogram.

Supplementary Materials

The following supporting information can be downloaded at: https://www.mdpi.com/article/10.3390/separations12080200/s1, weights of trained models.

Author Contributions

Conceptualization, software, data curation, and writing—original draft preparation, D.S.; methodology, D.S. and R.I.; writing—review and editing, R.I., J.-M.D.D. and P.J.H.; visualization, D.S. and R.I.; supervision, J.-M.D.D. and P.J.H.; project administration, J.-M.D.D. and P.J.H. All authors have read and agreed to the published version of the manuscript.

Funding

This research received no external funding.

Data Availability Statement

Data is contained within the article or Supplementary Material.

Acknowledgments

The authors would like to thank Christopher Heist of the Georgia Tech Research Institute for his help in using the MS Search software v.2.3.

Conflicts of Interest

The authors declare no conflicts of interest.

References

  1. Artrith, N.; Butler, K.T.; Coudert, F.X.; Han, S.; Isayev, O.; Jain, A.; Walsh, A. Best practices in machine learning for chemistry. Nat. Chem. 2021, 13, 505–508. [Google Scholar] [CrossRef] [PubMed]
  2. Debus, B.; Parastar, H.; Harrington, P.; Kirsanov, D. Deep learning in analytical chemistry. TrAC Trends Anal. Chem. 2021, 145, 116459. [Google Scholar] [CrossRef]
  3. Meuwly, M. Machine learning for chemical reactions. Chem. Rev. 2021, 121, 10218–10239. [Google Scholar] [CrossRef] [PubMed]
  4. Petritis, K.; Kangas, L.J.; Ferguson, P.L.; Anderson, G.A.; Paša-Tolić, L.; Lipton, M.S.; Smith, R.D. Use of artificial neural networks for the accurate prediction of peptide liquid chromatography elution times in proteome analyses. Anal. Chem. 2003, 75, 1039–1048. [Google Scholar] [CrossRef]
  5. Munro, K.; Miller, T.H.; Martins, C.P.; Edge, A.M.; Cowan, D.A.; Barron, L.P. Artificial neural network modelling of pharmaceutical residue retention times in wastewater extracts using gradient liquid chromatography-high resolution mass spectrometry data. J. Chromatogr. A 2015, 1396, 34–44. [Google Scholar] [CrossRef]
  6. Yang, J.; Xu, G.; Kong, H.; Zheng, Y.; Pang, T.; Yang, Q. Artificial neural network classification based on high-performance liquid chromatography of urinary and serum nucleosides for the clinical diagnosis of cancer. J. Chromatogr. B 2002, 780, 27–33. [Google Scholar] [CrossRef]
  7. Srečnik, G.; Debeljak, Ž.; Cerjan-Stefanović, Š.; Novič, M.; Bolanča, T. Optimization of artificial neural networks used for retention modelling in ion chromatography. J. Chromatogr. A 2002, 973, 47–59. [Google Scholar] [CrossRef]
  8. Madden, J.E.; Avdalovic, N.; Haddad, P.R.; Havel, J. Prediction of retention times for anions in linear gradient elution ion chromatography with hydroxide eluents using artificial neural networks. J. Chromatogr. A 2001, 910, 173–179. [Google Scholar] [CrossRef] [PubMed]
  9. Nicholson, J.D. Derivative formation in the quantitative gas-chromatographic analysis of pharmaceuticals. Part II. A review. Analyst 1978, 103, 193–222. [Google Scholar] [CrossRef]
  10. König, W.A.; Ernst, K. Application of enantioselective capillary gas chromatography to the analysis of chiral pharmaceuticals. J. Chromatogr. A 1983, 280, 135–141. [Google Scholar] [CrossRef]
  11. Fang, G.; Min, G.; He, J.; Zhang, C.; Qian, K.; Wang, S. Multiwalled carbon nanotubes as matrix solid-phase dispersion extraction absorbents to determine 31 pesticides in agriculture samples by gas chromatography—Mass spectrometry. J. Agric. Food Chem. 2009, 57, 3040–3045. [Google Scholar] [CrossRef] [PubMed]
  12. Fernandez-Alvarez, M.; Llompart, M.; Lamas, J.P.; Lores, M.; Garcia-Jares, C.; Cela, R.; Dagnac, T. Simultaneous determination of traces of pyrethroids, organochlorines and other main plant protection agents in agricultural soils by headspace solid-phase microextraction—Gas chromatography. J. Chromatogr. A 2008, 1188, 154–163. [Google Scholar] [CrossRef] [PubMed]
  13. Furton, K.G.; Wang, J.; Hsu, Y.L.; Walton, J.; Almirall, J.R. The use of solid-phase microextraction—Gas chromatography in forensic analysis. J. Chromatogr. Sci. 2000, 38, 297–306. [Google Scholar] [CrossRef] [PubMed]
  14. Frysinger, G.S.; Gaines, R.B. Forensic analysis of ignitable liquids in fire debris by comprehensive two-dimensional gas chromatography. J. Forensic Sci. 2002, 47, 471–482. [Google Scholar] [CrossRef]
  15. Hou, S.; Stevenson, K.A.; Harynuk, J.J. A simple, fast, and accurate thermodynamic-based approach for transfer and prediction of gas chromatography retention times between columns and instruments Part I: Estimation of reference column geometry and thermodynamic parameters. J. Sep. Sci. 2018, 41, 2544–2552. [Google Scholar] [CrossRef]
  16. Hou, S.; Stevenson, K.A.; Harynuk, J.J. A simple, fast, and accurate thermodynamic-based approach for transfer and prediction of GC retention times between columns and instruments Part II: Estimation of target column geometry. J. Sep. Sci. 2018, 41, 2553–2558. [Google Scholar] [CrossRef]
  17. Brehmer, T.; Duong, B.; Marquart, M.; Friedemann, L.; Faust, P.J.; Boeker, P.; Wüst, M.; Leppert, J. Retention database for prediction, simulation, and optimization of GC separations. ACS Omega 2023, 8, 19708–19718. [Google Scholar] [CrossRef]
  18. Van Den Dool, H.A.N.D.; Kratz, P.D. A generalization of the retention index system including linear temperature programmed gas-liquid partition chromatography. J. Chromatogr. 1963, 11, 463–471. [Google Scholar] [CrossRef]
  19. Kovats, V.E. Gas-chromatographische charakterisierung organischer verbindungen. Teil 1: Retentionsindices aliphatischer halogenide, alkohole, aldehyde und ketone. Helv. Chim. Acta 1958, 41, 1915–1932. [Google Scholar] [CrossRef]
  20. Lee, M.L.; Vassilaros, D.L.; White, C.M. Retention indices for programmed-temperature capillary-column gas chromatography of polycyclic aromatic hydrocarbons. Anal. Chem. 1979, 51, 768–773. [Google Scholar] [CrossRef]
  21. NIST Mass Spectrometry Data Center; Wallace, W.E. Retention Indices. In NIST Chemistry WebBook, NIST Standard Reference Database Number 69; Linstrom, P.J., Mallard, W.G., Eds.; National Institute of Standards and Technology: Gaithersburg, MD, USA, 2025; p. 20899. [Google Scholar] [CrossRef]
  22. Struk, D.R.; Ilhamsyah, R.; Heist, C.A.; Dimandja, J.M.D.; Hesketh, P.J. A Semi-Automated Pipeline for Nontargeted Compound Analysis via GC×GC-MS. J. Chromatogr. Open 2024, 5, 100118. [Google Scholar] [CrossRef]
  23. Babushok, V.I. Chromatographic retention indices in identification of chemical compounds. TrAC Trends Anal. Chem. 2015, 69, 98–104. [Google Scholar] [CrossRef]
  24. Koo, I.; Shi, X.; Kim, S.; Zhang, X. iMatch2: Compound identification using retention index for analysis of gas chromatography–mass spectrometry data. J. Chromatogr. A 2014, 1337, 202–210. [Google Scholar] [CrossRef]
  25. Wei, X.; Koo, I.; Kim, S.; Zhang, X. Compound identification in GC-MS by simultaneously evaluating the mass spectrum and retention index. Analyst 2014, 139, 2507–2514. [Google Scholar] [CrossRef]
  26. Seeley, J.V.; Seeley, S.K. Model for predicting comprehensive two-dimensional gas chromatography retention times. J. Chromatogr. A 2007, 1172, 72–83. [Google Scholar] [CrossRef]
  27. Seeley, J.V.; Libby, E.M.; Edwards, K.A.H.; Seeley, S.K. Solvation parameter model of comprehensive two-dimensional gas chromatography separations. J. Chromatogr. A 2009, 1216, 1650–1657. [Google Scholar] [CrossRef]
  28. Peng, C.T.; Ding, S.F.; Hua, R.L.; Yang, Z.C. Prediction of retention indexes: I. Structure—Retention index relationship on apolar columns. J. Chromatogr. A 1988, 436, 137–172. [Google Scholar] [CrossRef] [PubMed]
  29. Peng, C.T.; Yang, Z.C.; Ding, S.F. Prediction of retention indexes: II. Structure-retention index relationship on polar columns. J. Chromatogr. A 1991, 586, 85–112. [Google Scholar] [CrossRef]
  30. Matyushin, D.D.; Buryak, A.K. Gas chromatographic retention index prediction using multimodal machine learning. IEEE Access 2020, 8, 223140–223155. [Google Scholar] [CrossRef]
  31. Matyushin, D.D.; Sholokhova, A.Y.; Buryak, A.K. Deep learning based prediction of gas chromatographic retention indices for a wide variety of polar and mid-polar liquid stationary phases. Int. J. Mol. Sci. 2021, 22, 9194. [Google Scholar] [CrossRef] [PubMed]
  32. Larsson, T.; Vermeire, F.; Verhelst, S. Machine Learning for Fuel Property Predictions: A Multi-Task and Transfer Learning Approach (No. 2023-01-0337). SAE Technical Paper, 2023. Available online: https://www.sae.org/publications/technical-papers/content/2023-01-0337/ (accessed on 28 April 2025).
  33. McNaughton, A.D.; Joshi, R.P.; Knutson, C.R.; Fnu, A.; Luebke, K.J.; Malerich, J.P.; Madrid, P.B.; Kumar, N. Machine learning models for predicting molecular UV–Vis spectra with quantum mechanical properties. J. Chem. Inf. Model. 2023, 63, 1462–1471. [Google Scholar] [CrossRef] [PubMed]
  34. Koscher, B.A.; Canty, R.B.; McDonald, M.A.; Greenman, K.P.; McGill, C.J.; Bilodeau, C.L.; Jin, W.; Wu, H.; Vermeire, F.H.; Jin, B.; et al. Autonomous, multiproperty-driven molecular discovery: From predictions to measurements and back. Science 2023, 382, eadi1407. [Google Scholar] [CrossRef] [PubMed]
  35. Heid, E.; Greenman, K.P.; Chung, Y.; Li, S.C.; Graff, D.E.; Vermeire, F.H.; Wu, H.; Green, W.H.; McGill, C.J. Chemprop: A machine learning package for chemical property prediction. J. Chem. Inf. Model. 2023, 64, 9–17. [Google Scholar] [CrossRef] [PubMed]
  36. Kim, S.; Chen, J.; Cheng, T.; Gindulyte, A.; He, J.; He, S.; Li, Q.; Shoemaker, B.A.; Thiessen, P.A.; Yu, B.; et al. PubChem 2025 update. Nucleic Acids Res. 2025, 53, D1516–D1525. [Google Scholar] [CrossRef]
  37. Khrisanfov, M.D.; Matyushin, D.D.; Samokhin, A.S. A general procedure for finding potentially erroneous entries in the database of retention indices. Anal. Chim. Acta 2024, 1297, 342375. [Google Scholar] [CrossRef]
  38. Gholamy, A.; Kreinovich, V.; Kosheleva, O. Why 70/30 or 80/20 relation between training and testing sets: A pedagogical explanation. Int. J. Intell. Technol. Appl. Stat. 2018, 11, 105–111. [Google Scholar]
Figure 1. Histogram of error of initial model.
Separations 12 00200 g001
Figure 2. Reported polar RI vs. error of initial model.
Separations 12 00200 g002
Figure 3. Two parity plots of several common homologous series for the filtered nonpolar model with dashed line as diagonal reference with (a) containing alkanes, cyclic alkanes, and alcohols and (b) containing carboxylic acids and amines.
Separations 12 00200 g003
Figure 4. Simulated two-dimensional gas chromatograms with a nonpolar primary column and polar secondary column (a) and reversed (b).
Separations 12 00200 g004
Figure 5. Mean absolute error as a function of number of compounds used to train model using corroborated nonpolar data.
Separations 12 00200 g005
Figure 6. Mean absolute error as a function of different number of hidden layers (a) and fully connected iterations (b).
Separations 12 00200 g006
Table 1. Summary of datasets used to train models and their associated models and outputs.
DescriptionSizeModel OutputSource
Thermodynamic Parameters Thermodynamic   parameters   for   the   Clarke   and   Glew   model   ln K = A + B T + C l n ( T ) 287A, B, C[17]
Retention TimesUsing the thermodynamic parameters of the prior dataset, the retention times were predicted for temperature ramps of 5, 10, and 15 °C/min287Raw retention times for 5, 10, 15 °C/min ramps[15,17]
Nonpolar Retention Index DataNonpolar retention index data taken from NIST 17 database with different experimental data points averaged together60,104Nonpolar Retention Index[21]
Polar Retention Index DataPolar retention index data taken from NIST 17 database with different experimental data points averaged together5853Polar Retention Index[21]
Filtered Nonpolar Retention Index DataNonpolar retention index data filtered according to whether there were at least two distinct sources reporting the information and if the standard deviation was less than 20 unit7817Nonpolar Retention Index[21]
Filtered Polar Retention Index DataPolar retention index data taken from NIST 17 database filtered according to whether there were at least two distinct sources reporting the information and if the standard deviation was less than 20 unit3192Polar Retention Index[21]
Combined Filtered Retention Index DataBoth nonpolar and polar2463Nonpolar and Polar Retention Indices[21]
Table 2. Summary of model trained on retention times.
5 °C/min (Test Subset)10 °C/min (Test Subset)15 °C/min (Test Subset)5 °C/min (Full Set)10 °C/min (Full Set)15 °C/min (Full Set)
Mean absolute error (s)141.75122.13131.96155.38132.84137.35
Mean absolute percent error15.7814.6017.8120.1016.5919.02
Table 3. Summary of model trained on thermodynamic parameters.
A (Test Subset)B (Test Subset)C (Test Subset)A (Full Set)B (Full Set)C (Full Set)
Mean absolute error16.231292.732.2516.491305.772.30
Mean absolute percent error19.5012.1721.2725.4914.0428.25
Table 4. Summary of models trained on retention indices.
Mean Absolute Error, Test SubsetMean Absolute Error, Full ListMean Absolute Percent Error, Test SubsetMean Absolute Percent Error, Full List
Nonpolar46.05 ± 1.6439.51 ± 3.612.50 ± 0.01%1.92 ± 0.14%
Polar78.37 ± 1.1566.96 ± 1.574.49 ± 0.10%3.90 ± 0.06%
Nonpolar, filtered30.81 ± 3.4324.52 ± 4.862.24 ± 0.16%2.06 ± 0.23%
Polar, filtered55.21 ± 0.4142.43 ± 0.483.50 ± 0.03%2.58 ± 0.02%
Combined, filtered34.97 ± 0.6232.05 ± 0.672.61 ± 0.04%2.30 ± 0.06%
Disclaimer/Publisher’s Note: The statements, opinions and data contained in all publications are solely those of the individual author(s) and contributor(s) and not of MDPI and/or the editor(s). MDPI and/or the editor(s) disclaim responsibility for any injury to people or property resulting from any ideas, methods, instructions or products referred to in the content.