1. Introduction
To contextualize the analytical challenges addressed in this study, it is important to first provide a brief overview of the role of cuscohygrine (CUS) and hygrine (HYG) in forensic toxicology and their relevance in the consumption of coca-based products. CUS and HYG have been proposed as markers for legal coca leaf consumption in several Latin American countries, including Argentina [
1,
2]. These alkaloids play a crucial role for distinguishing legal uses of coca-based products, such as chewing coca leaves and drinking coca tea, from illicit cocaine use. Therefore, studies on the presence of CUS and HYG in urine, oral fluid, and hair are of particular importance in forensic toxicology [
1,
3].
Despite their significance, CUS and HYG are not routinely included in drug screening and/or confirmation panels in forensic laboratories, a fact which agrees with the limited number of published analytical methods for CUS and HYG detection/determination. However, due to their critical forensic relevance, some toxicology laboratories in Latin America have recently started to include these alkaloids into their routine assays. This development addresses scenarios in which individuals, such as those subjected to workplace drug testing or arrested by law enforcement, claim that positive results for cocaine are attributable to coca leaf chewing or coca tea consumption rather than illicit cocaine use.
The legal status of coca leaf consumption varies across countries, and consumption is therefore explicitly legal under certain laws in Argentina [
4], whereas it holds deep cultural and traditional significance in Peru and Bolivia. This context underscores the urgent need for reliable analytical methods for distinguishing legal coca use and illicit cocaine use in forensic settings, such as driving impairment assessments, criminal liability evaluations, and workplace testing.
HYG and CUS share structural chemical similarities and key differences with other tropane alkaloids commonly analyzed in forensic toxicology, such as cocaine (COC); cinnamoylcocaine (CIN), frequently found in seized samples; ecgonine methyl ester (EME), a cocaine metabolite; and tropacocaine (TRO), a minor alkaloid in coca leaves. These distinctions are crucial for understanding the findings presented in the current study.
The amino acid L-ornithine serves as a precursor for two groups of alkaloids: pyrrolidine derivatives, including HYG and CUS, and tropane derivatives, including the most prominent alkaloids in coca leaves, such as COC, CIN, EME, and TRO (
Figure 1). Their different biochemical origins result in substantial differences in their mass spectral behavior. Tropane-derived alkaloids generate characteristic fragments, such as
m/
z 82, which comes from the tropane core (a bicyclic ring), and other more abundant fragments (e.g.,
m/
z 182 and
m/
z 105 in cocaine), derived from several functional groups. In contrast, pyrrolidine-derived alkaloids such as HYG and CUS, due to their monocyclic structure and absence of complex functional groups, tend to produce low-mass fragments with reduced stability. These properties make HYG and CUS detection particularly challenging when gas chromatography–mass spectrometry (GC-MS) is used in Selected Ion Monitoring (SIM) mode, which requires at least three diagnostic ions with enough relative abundance to fit with international identification criteria [
5,
6].
In our laboratory’s experience, CUS and the deuterated analog (CUS-d6) standards are partially degraded into HYG and deuterated hygrine (HYG-d3). This degradation is influenced by factors such as the injector temperature, the injection mode (split versus splitless), and the matrix composition. Additionally, we have observed variations in response patterns over time and across several biological matrices, which directly impact the performance and accuracy of GC-MS analyses. In a previous study [
7], we reported these challenges, and we identified critical gaps in existing methods, which are further explored in this paper.
While LC-MS/MS is the preferred approach in modern forensic toxicology because of its higher sensitivity, selectivity, and ability to handle thermolabile analytes, its cost and limited availability still make GC-MS a common technique in several Latin American laboratories. Previous studies [
3,
8], along with others that will be discussed throughout the manuscript, have demonstrated the feasibility of LC-MS/MS for CUS and HYG detection. However, the current study aims to critically assess the limitations of GC-MS, which remains the most accessible technology in many regional contexts for the reliable detection of pyrrolidine alkaloids (HYG and CUS), particularly in forensic laboratory applications. The objectives of this study are (a) examination of the mass spectral characteristics of HYG and CUS, identifying the challenges and limitations associated with their accurate detection and identification in biological matrices; (b) assessment of the influence of critical instrumental parameters, including the injector temperature and split/splitless injection mode, on the analytical response of CUS and CUS-d6 and their respective degradation products; and (c) study of the potential interactions of CUS and CUS-d6 with active sites within the GC-MS system, investigating matrix effects with several biological samples (plasma, urine, and oral fluid) and evaluating the influence of the surface activity at the injector inlet.
3. Results and Discussion
The results and discussion presented below address the challenges encountered in the analysis of CUS and HYG using GC-MS, a technique widely employed in forensic laboratories. These compounds have been previously analyzed and validated in earlier studies [
1,
3,
9], which is not the focus of the present work.
3.1. Detection Limit and Ion Abundance Mass-to-Charge Ratio (m/z)
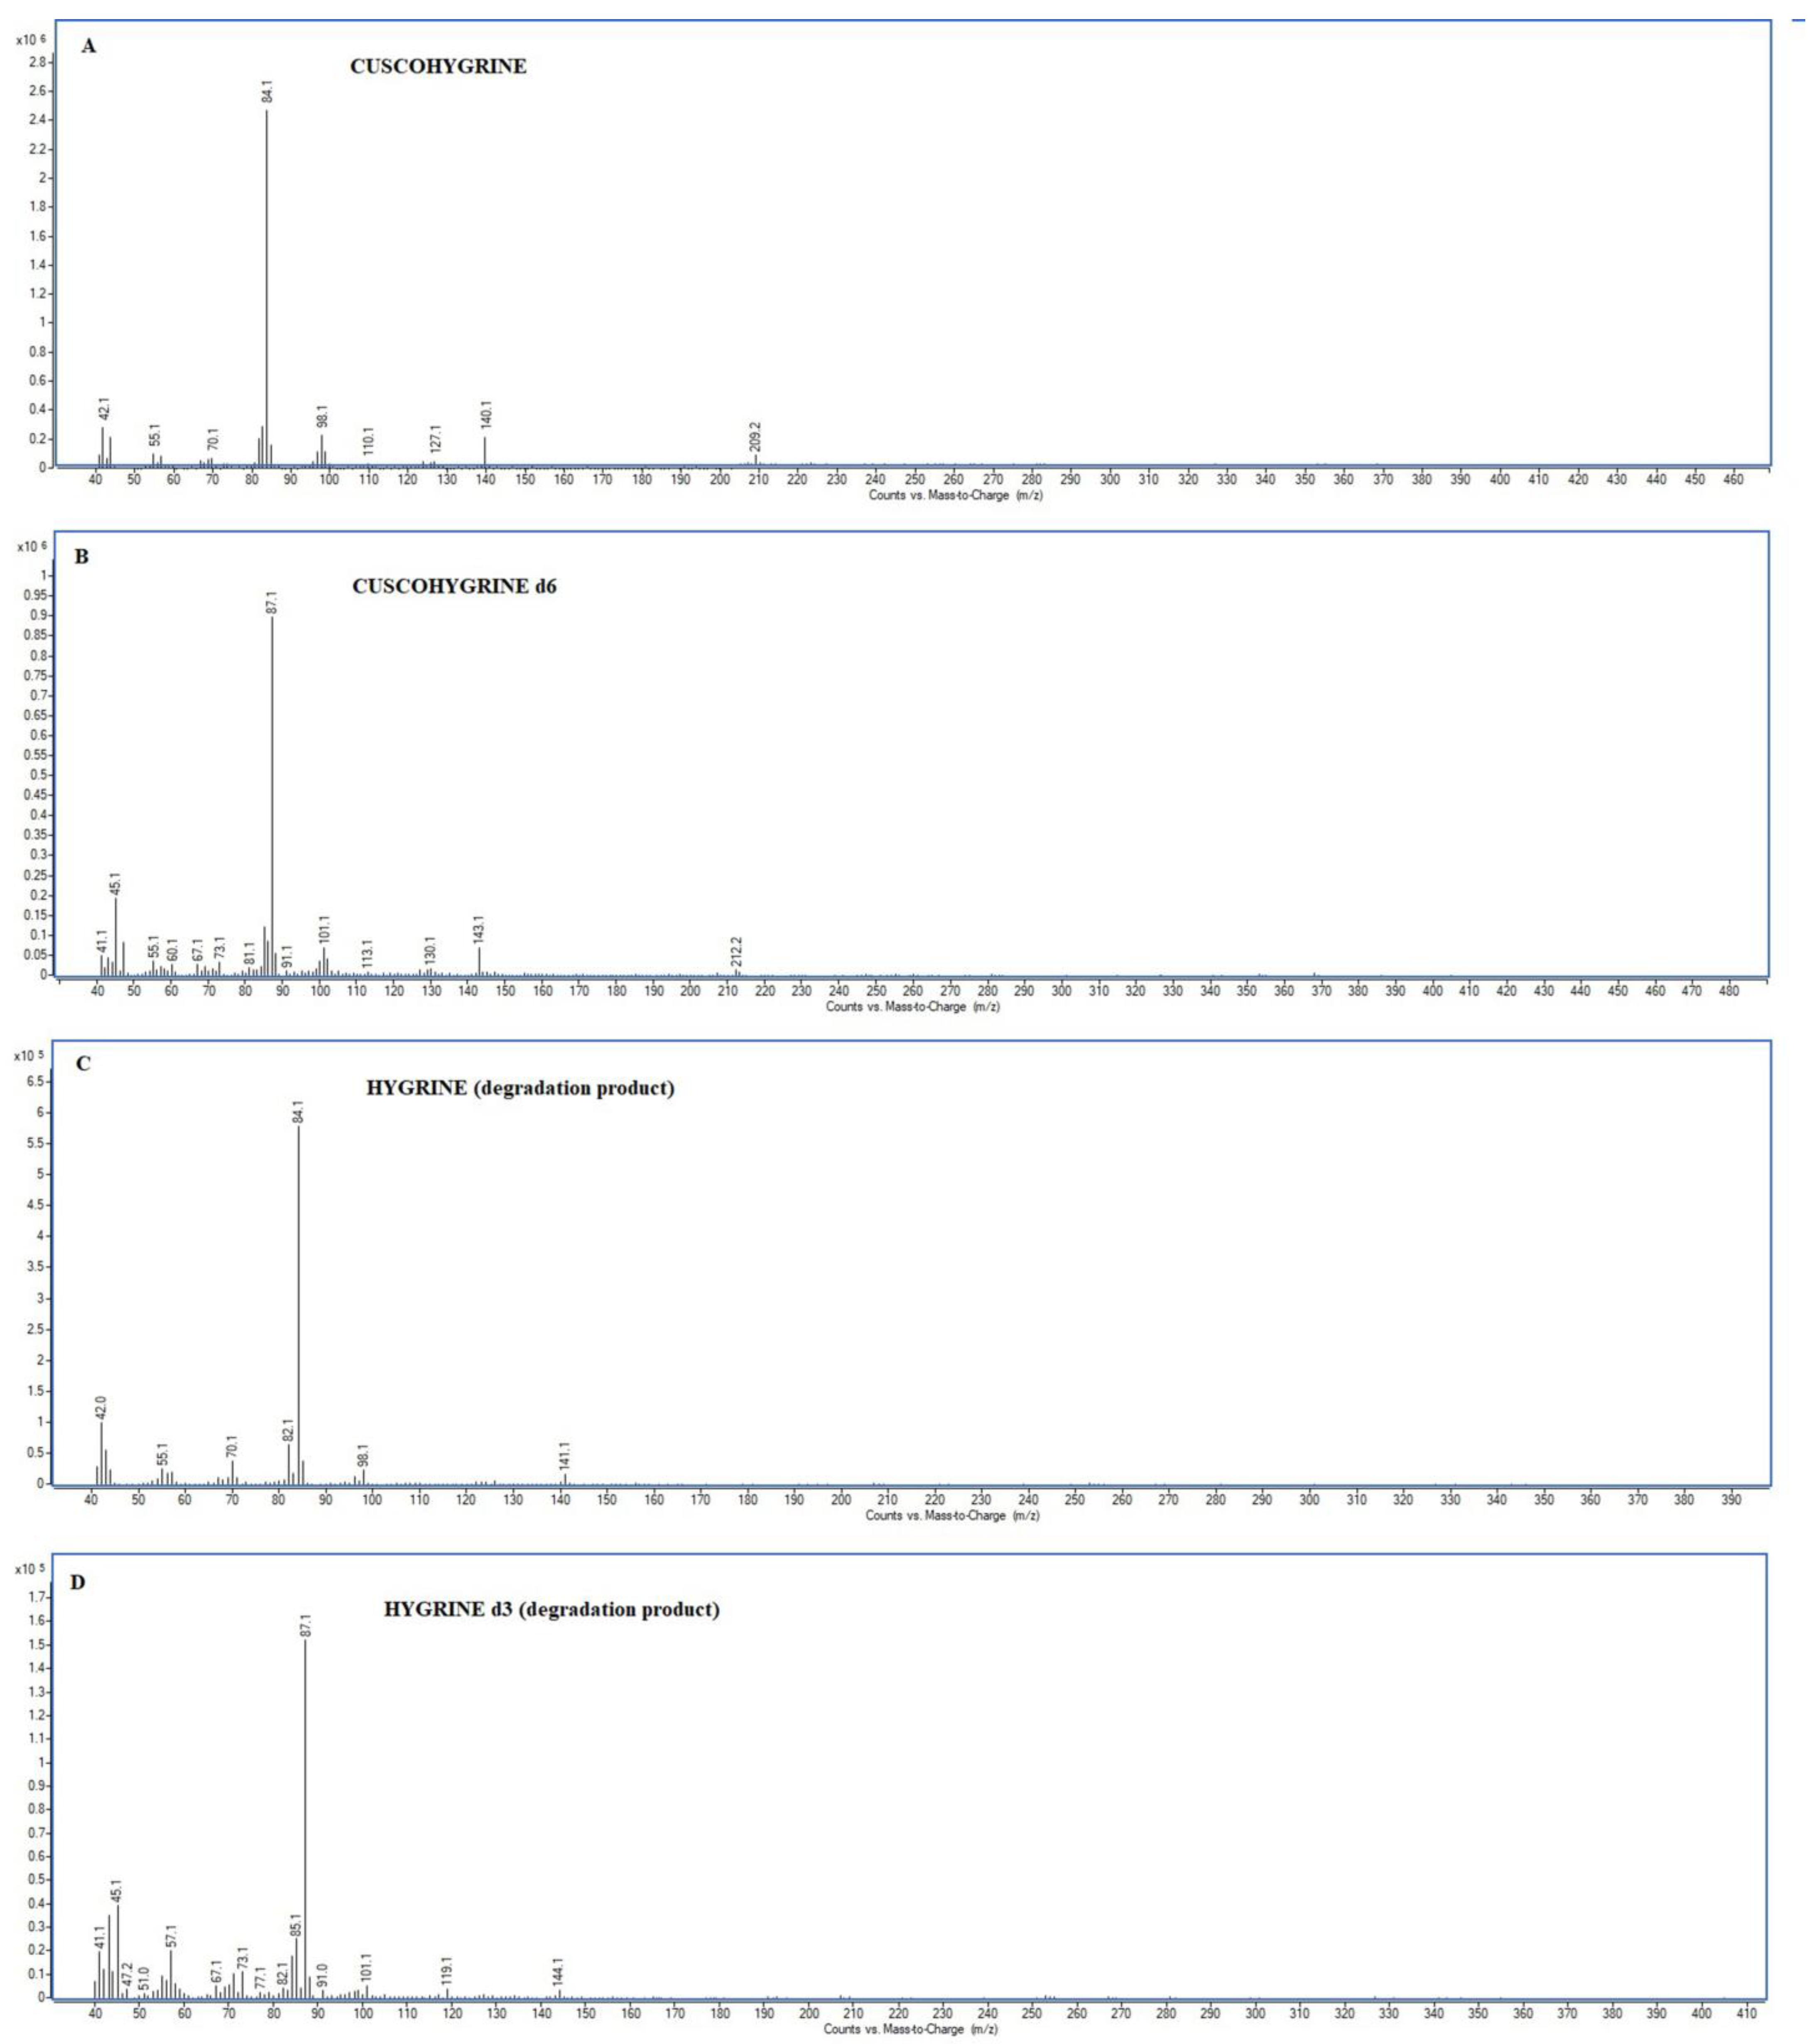
CUS and HYG (also CUS-d6 and HYG-d6) exhibit mass spectra characterized by fragments of low relative intensity (
Figure 2). Regarding CUS, the molecular ion (M
+,
m/
z 224) is typically of very low abundance and it is often undetectable due to its instability. This ion undergoes the loss of a methyl group (–CH
3) to form the ion at
m/
z 209. Additional fragments observed in the CUS mass spectrum include those with
m/
z values of 140, 126, 98, 84, 70, and 42. Similarly, HYG, which is structurally part of the CUS molecule, shares several characteristic ions with it, including
m/
z 141 (molecular ion), as well as
m/
z 126, 98, 84, 70, and 42.
In both cases, the base ion in the mass spectra corresponds to
m/
z 84, which is attributed to the Δ
1-dihydropyrrolium cation. The second most intense fragment,
m/
z 42, is associated with the structure [CH
2=N=CH
2]
+ or [CH
3-N=CH]
+.
Table 1 lists the relative intensities of the
m/
z ions for CUS and HYG.
Both CUS and HYG display mass spectra with low-intensity ions, where the abundances of
m/
z fragments are below or near 10%. For instance, the
m/
z 42 ion (17%), although used as a secondary qualifier ion in SIM mode analysis, is limited in analytical utility due to its low mass, lack of structural specificity, and susceptibility to interference within this range. Furthermore, CUS exhibits
m/
z ions at 98 and 140 with relative abundances of 9% and 8%, respectively (
Table 1).
The mass profiles of both CUS and HYG lack high-intensity or structurally diagnostic
m/
z ions, hindering compliance with international requirements for compound identification.
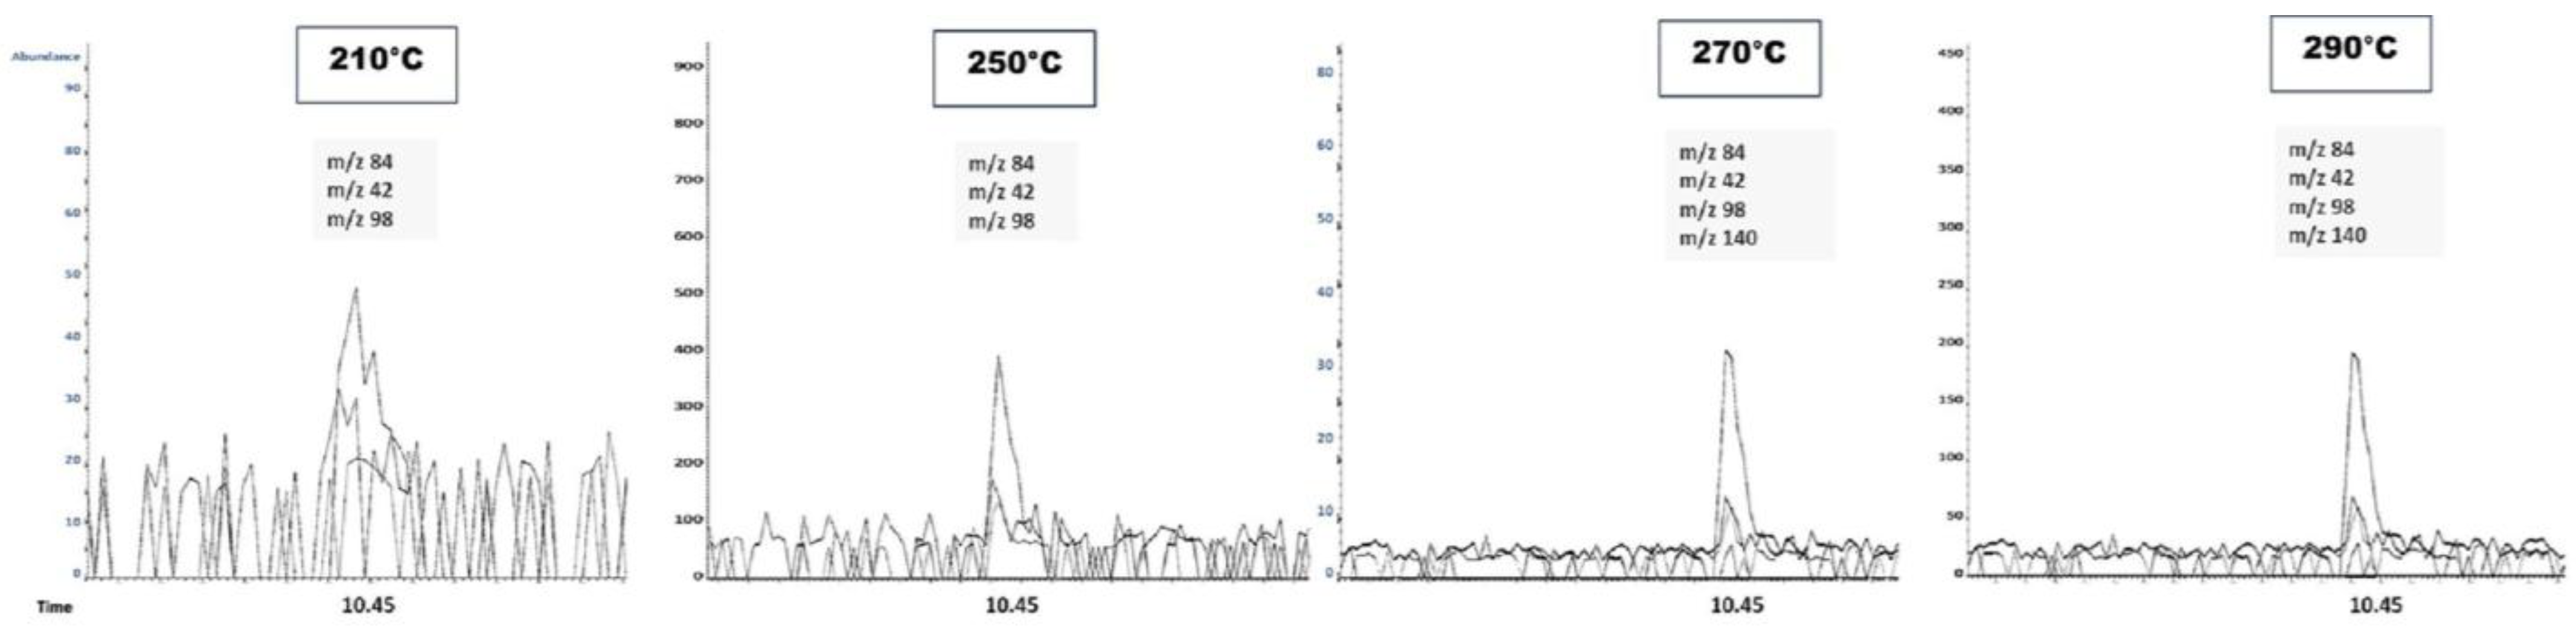
Figure 3 illustrates the challenge of differentiating ions 42, 140, and 98 from baseline noise. At an injector temperature of 250 °C and a concentration of 0.5 µg/mL, only the
m/
z 84 ion achieves the required signal-to-noise (S/N) ratio of >3, whereas other ions remain indistinguishable from the background noise. The effects of the different injector temperatures tested, 210 °C, 250 °C, 270 °C, and 290 °C, will be discussed later.
These findings underscore a limitation in GC-MS determination of CUS: the low mass and abundance of the m/z fragments complicate the differentiation from background noise and the ability to meet diagnostic criteria. Similar limitations can be discussed for HYG, which is both a degradation product of CUS and a marker of coca leaf use.
3.2. Effect of the Injector Temperature and Solvent Nature (Methanol and Ethyl Acetate)
Heating the sample in the injection port to volatilize analytes is a crucial step in GC. However, this process poses challenges for thermolabile compounds, which can degrade during analysis since analyte degradation reduces analytical sensitivity and leads to difficulties when interpreting analyte breakdown patterns.
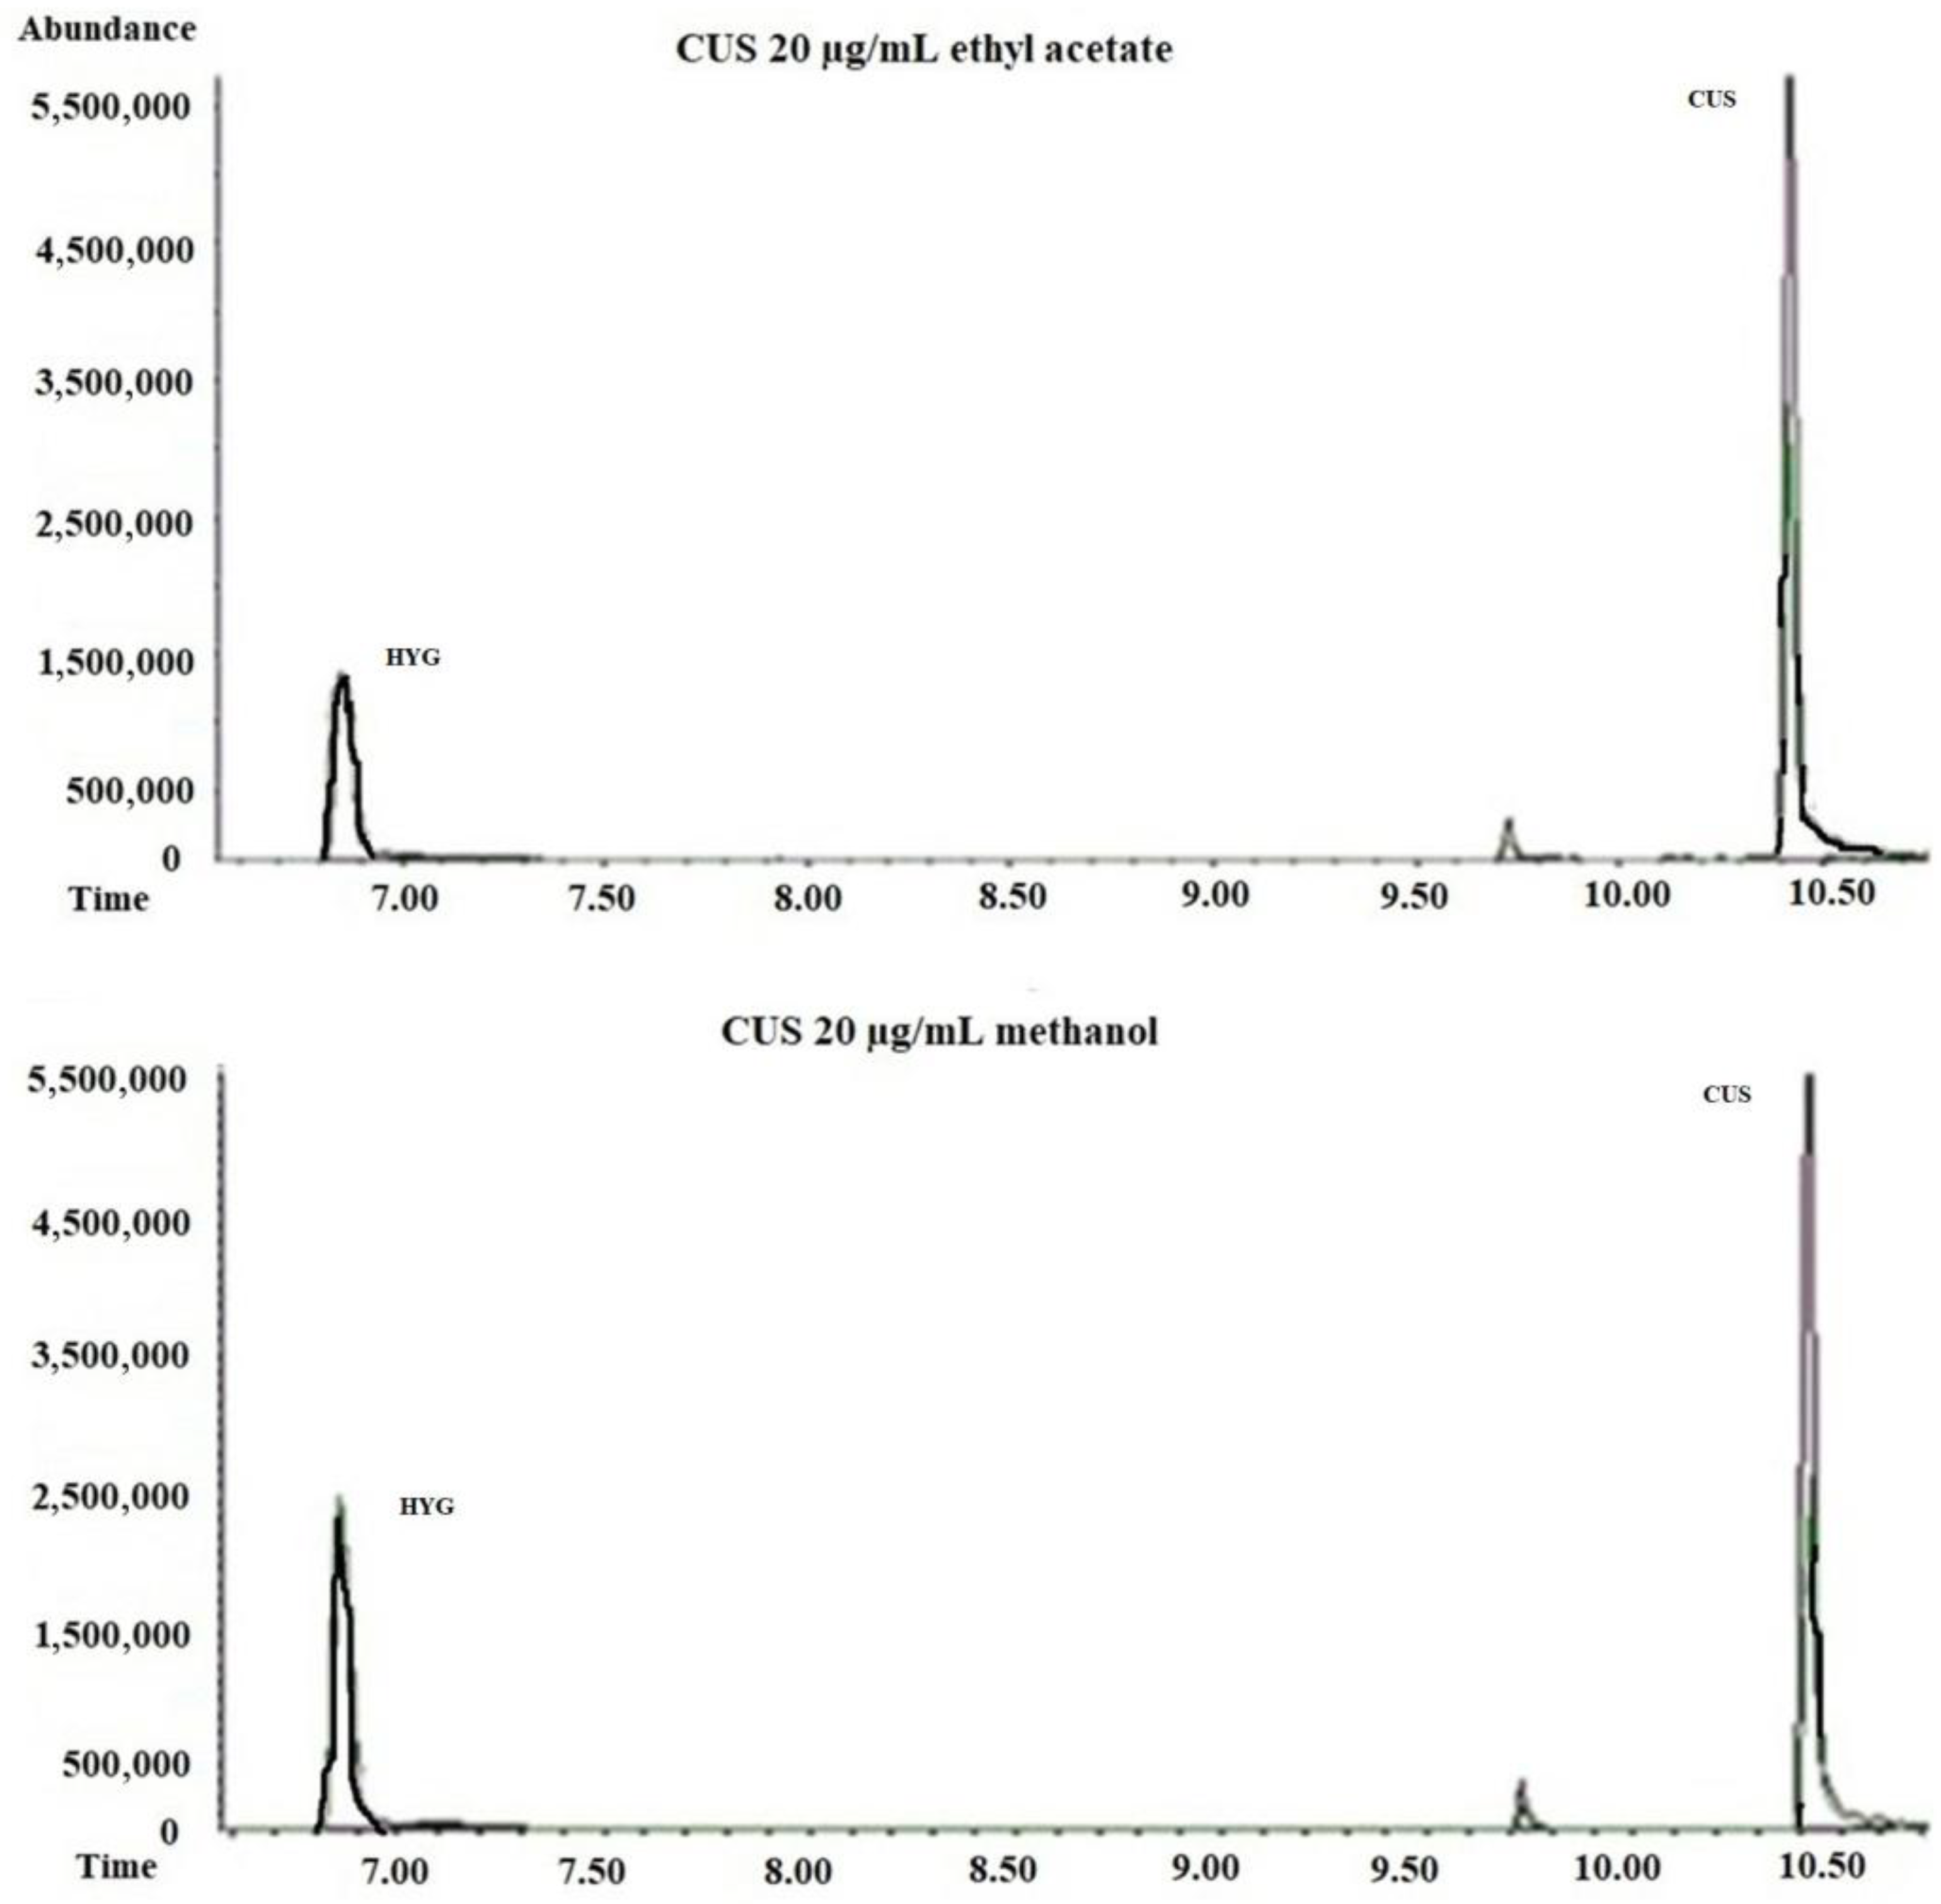
CUS and the deuterated analog (CUS-d6) undergo partial degradation to HYG and HYG-d3, respectively, when analyzed by GC-MS, independently of whether the standards were prepared in methanol or ethyl acetate (
Figure 4).
As depicted in
Figure 5 and detailed in
Table 2A,B, increasing the injector temperature from 180 °C to 290 °C led to an enhanced chromatographic response for both CUS and CUS-d6.
This was reflected in a progressive increase in the percentage of the CUS and CUS-d6 peak areas relative to their respective degradation products, HYG and HYG-d3, whose areas were considered to be 100%. These findings were consistent across different concentrations (1, 10, and 25 μg/mL) and solvent systems (methanol and ethyl acetate). Although a decrease in the CUS signal might be expected due to thermal degradation at higher temperatures, the observed trend likely reflects a competing phenomenon: improved volatilization and reduced analyte adsorption in the liner at elevated temperatures. These factors enhance analyte transfer to the column, particularly under splitless conditions where the residence time is longer. Thus, the increased signal is not indicative of reduced degradation, but rather of enhanced transfer efficiency overriding degradation losses at higher injector temperatures.
As shown in
Table 2A, at a CUS concentration of 10 µg/mL * (new liner), the percentage areas of CUS were higher than those of its degradation product HYG (%177 at 180 °C; %268 at 250 °C; and %302 at 290 °C). This phenomenon will be discussed further.
3.3. Effects of Active Sites Along the GC Flow Path (Liner Surface)
The enhanced response of CUS and CUS-d6 at higher injector temperatures may be attributed to improved volatilization or reduced retention of CUS and CUS-d6 at the active sites in the injector and/or column. Regarding HYG and HYG-d3, these targets could degrade more rapidly than CUS and CUS-d6 at elevated injector temperatures due to their lower thermal stability. In addition, both HYG and HYG-d3 could exhibit greater retention within the column and/or detector. Additionally, since CUS is a dimer of HYG, the remote possibility that an increased injector temperature facilitates dimer formation from degraded HYG should be considered. Further experiments using HYG standards, which were not available during this study, are needed to clarify this behavior.
The experimental data have also revealed that the variations in the CUS and CUS-d6 chromatographic peak areas with injector temperature are more marked than those in the degradation products (HYG and HYG-d3). These findings can be seen in
Table 3, where the relative standard deviation (RSD%) for CUS was within the 30–90% range and significantly higher than the RSD% observed for HYG (from 6 to 60%).
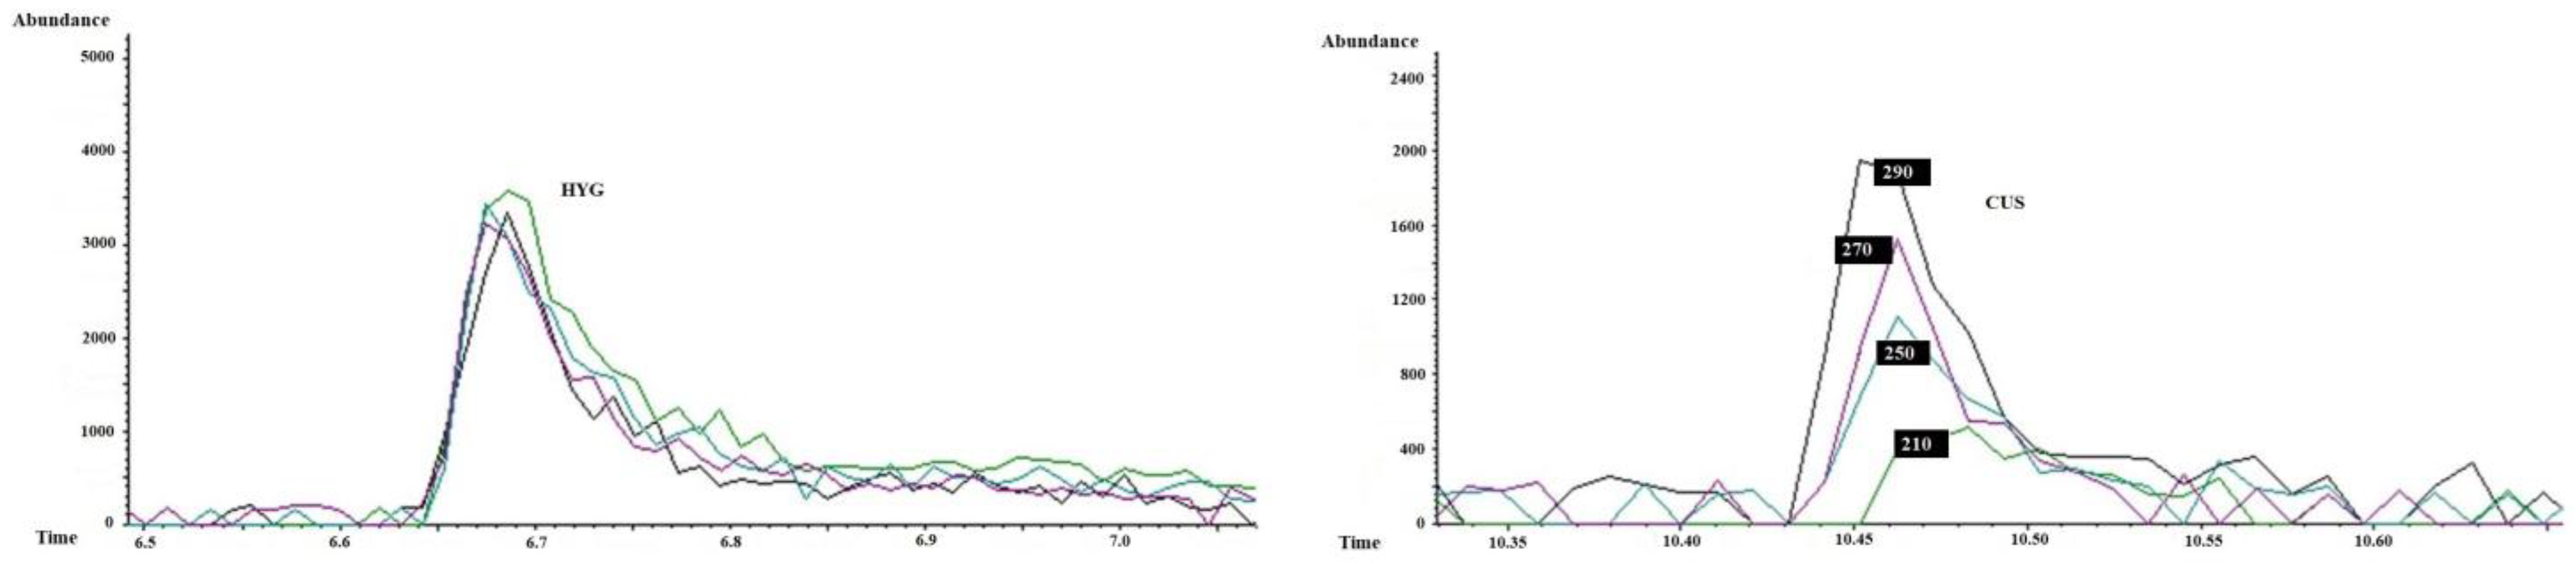
As shown in
Figure 6, increasing the injector temperature (210, 250, 270, and 290 °C) improves the detection of lower-abundance ions from CUS (0.5 µg/mL), including
m/
z 42, 140, and 98. No significant improvement in the chromatogram was observed when the injector temperature increased from 270 to 290 °C. This observation is relevant for optimizing the critical analytical parameters affecting CUS determination by GC-MS. Finally, the normalization of the CUS peak areas with the deuterated analog (CUS/CUS-d6 ratio) effectively compensates for the variations caused by injector temperature changes, as displayed in
Table 2.
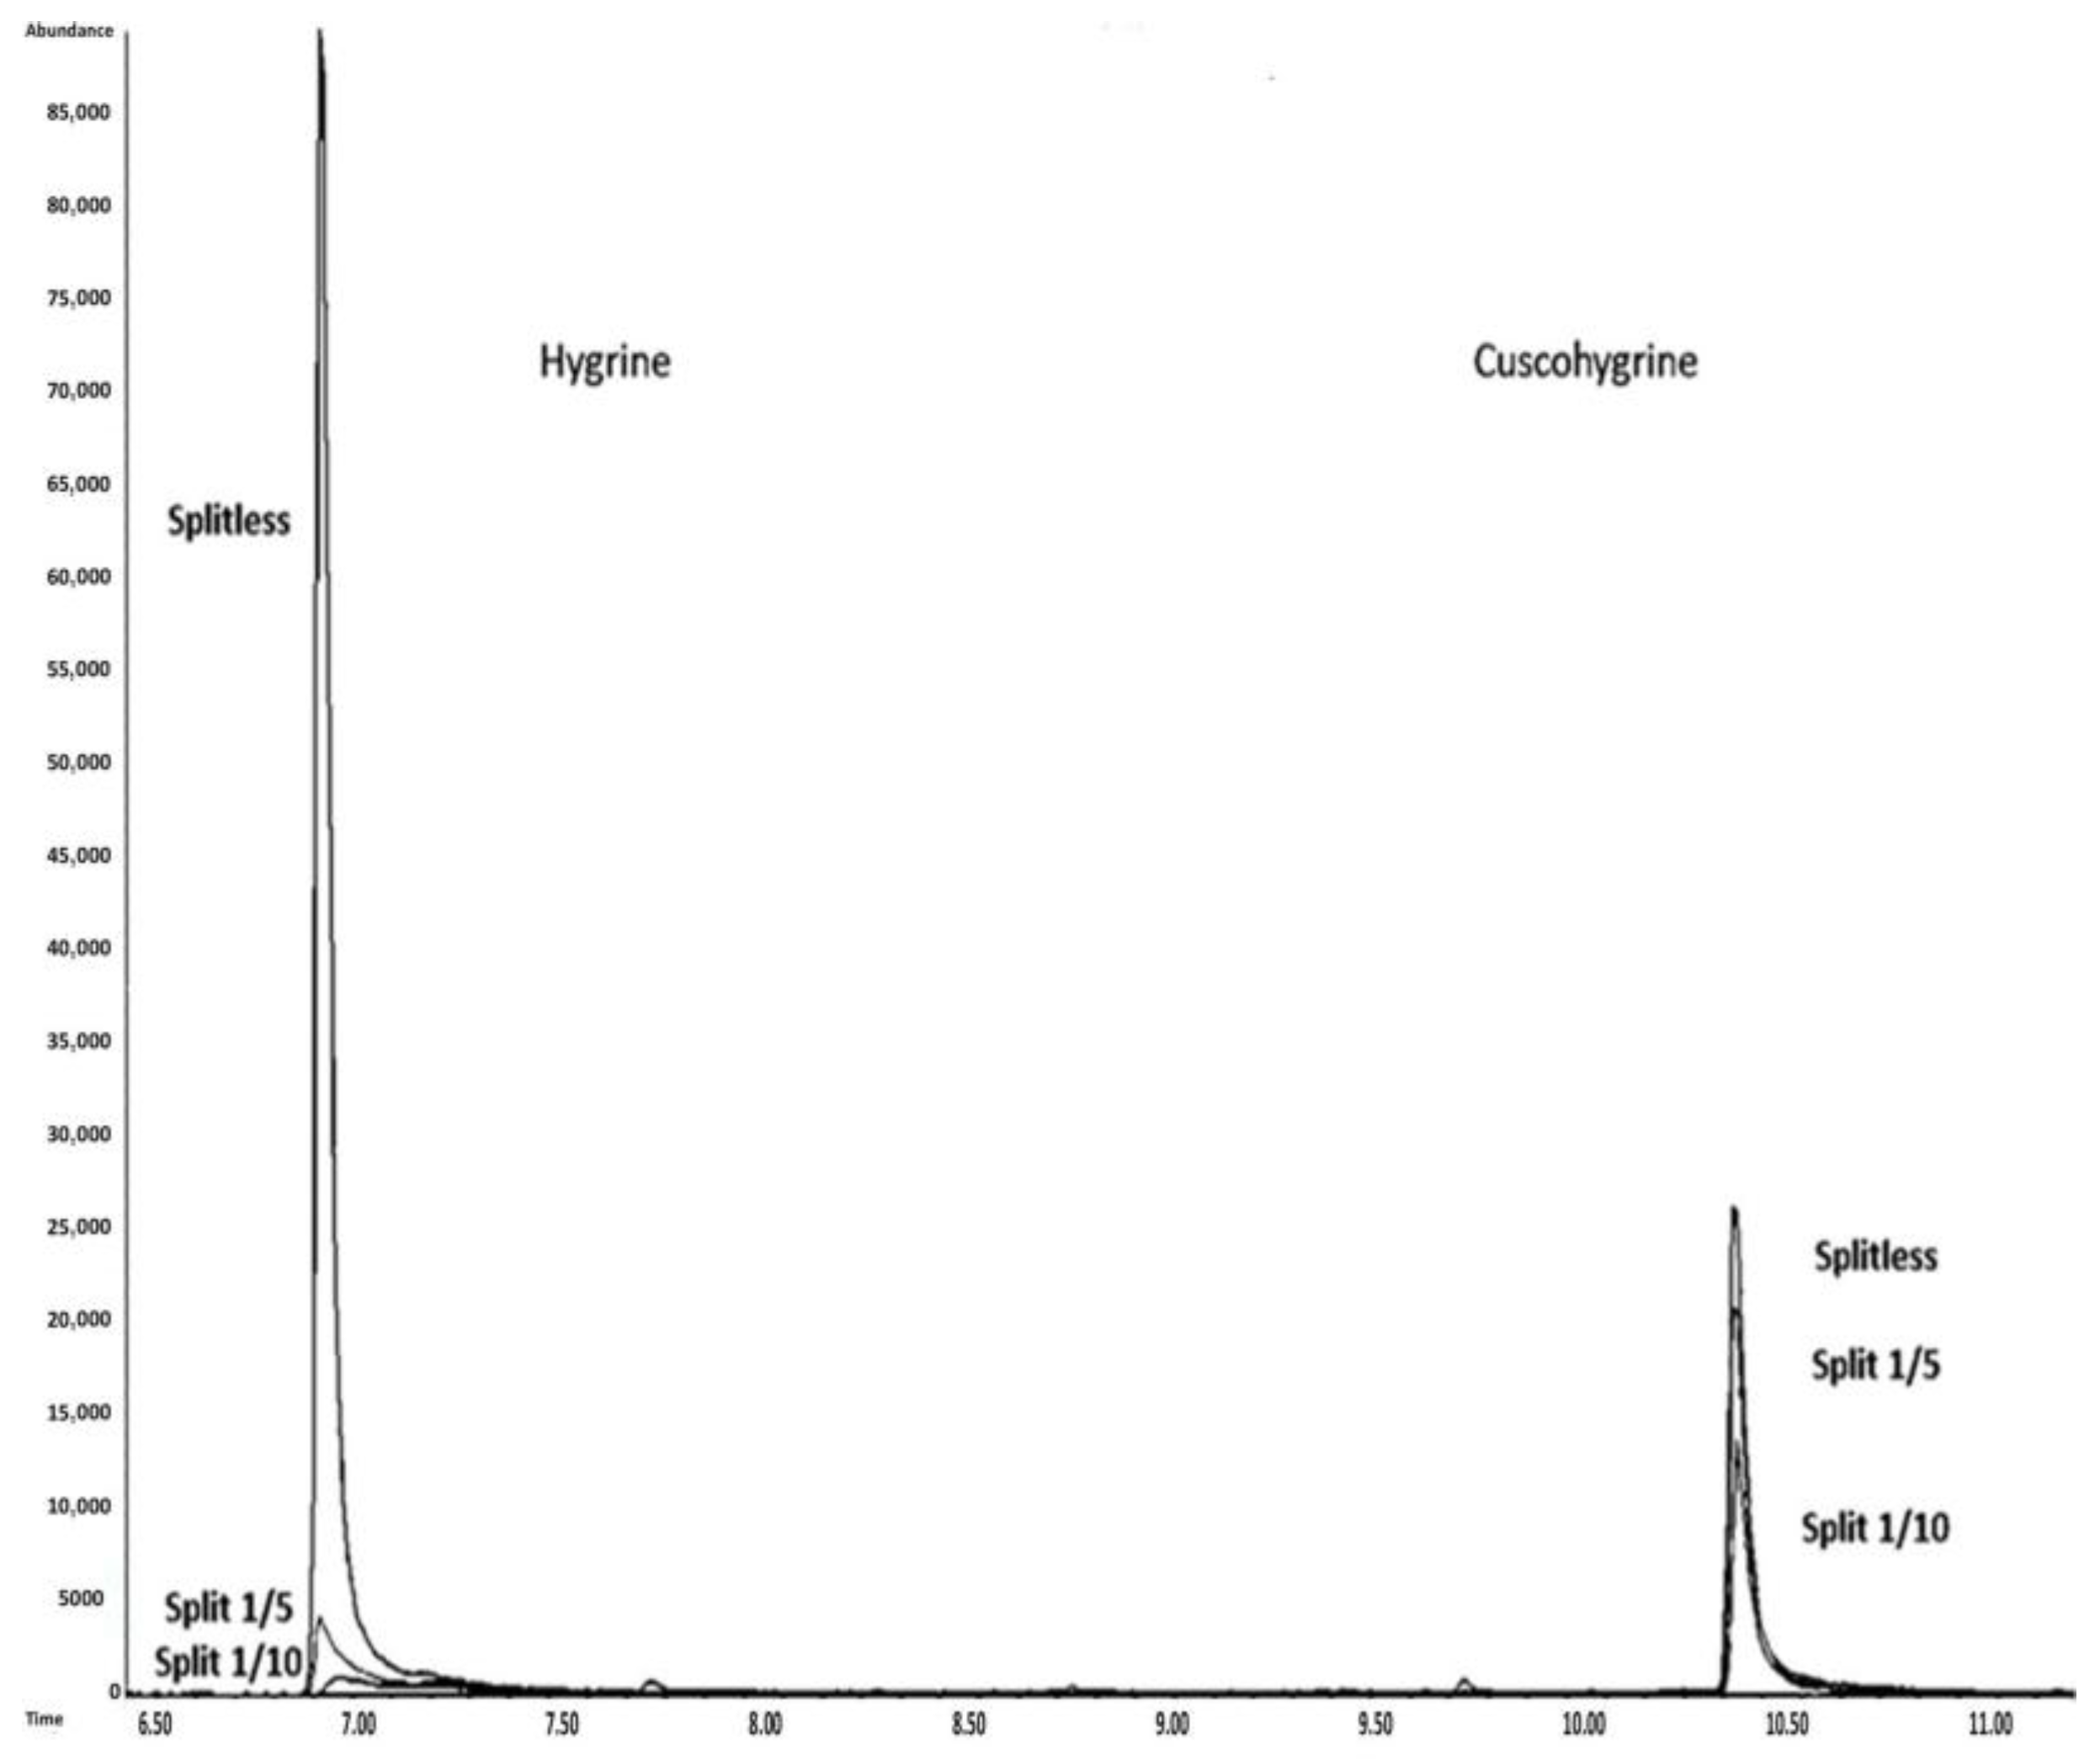
3.4. Effect of the Injection Mode
The impact of the injection mode (split versus splitless) on the formation of degradation products (HYG and HYG-d3) was evaluated.
Table 4 summarizes the degradation percentages of HYG and HYG-d3 when a 10 µg/mL standard of CUS and CUS-d6 was injected using split (1:5 and 1:10) and splitless modes. In this table, degradation is expressed as %HYG (HYG/CUS), in contrast to other sections that use %CUS (CUS/HYG). This inversion was chosen to more clearly illustrate the extent of degradation caused by the different injection modes.
The results demonstrate that the split injection mode significantly reduces the formation of degradation products, with a direct correlation to the split ratio. Specifically, the percentage of HYG decreases from 29% in split mode 1:5 to 10% in split mode 1:10. In contrast, the percentage of HYG increases when the splitless mode is used, reaching a percentage of 285%. The same behavior is observed for HYG-d3. The calculations are as follows:
However, this effect is minimized when normalizing the areas of CUS and HYG to their deuterated analogs since the normalized ratios remain nearly constant (
Figure 7).
These observations can be explained by the differential impacts of split and splitless injection modes on analyte stability. In split mode, rapid removal of the vaporized sample through the split vent minimizes the analyte residence time in the heated inlet, reducing thermal degradation. Conversely, the splitless mode prolongs exposure in the hot zone, enhancing the degradation of thermolabile compounds such as CUS into HYG. This explains the marked increase in HYG formation under splitless conditions. These findings align with previous studies on CUS behavior in GC-MS systems [
11]. However, despite its benefits in reducing degradation, split mode is not commonly used in forensic toxicology because of its lower sensitivity, which is a critical requirement for trace-level analysis.
3.5. Effects of Active Sites Along the GC Flow Path (Liner Surface)
Compounds can interact with active sites along the GC-MS flow path, leading to degradation and/or adsorption. Therefore, the lower the amount of injected analyte is, the greater the probability that the analyte could be lost through the GC flow path [
12].
The liner used in this study was a standard Agilent split/splitless deactivated liner, which contains silanized glass wool in the central position. This configuration allows for improved vaporization efficiency and reproducibility in split and splitless injection modes [
13]. However, even when deactivated, silanized glass wool can still exhibit residual active sites, especially under prolonged use or when exposed to complex biological matrices. This can contribute to the adsorption or partial degradation of polar or thermolabile compounds such as CUS and HYG.
The injected sample can interact with all the GC flow path components such as the column but also the injector and the detector [
14]. The column and the inlet liner account for more than 90% of the total surface area with which the injected sample can interact after injection into the GC system. Interactions between targets and active sites in these regions can lead to degraded peak shapes, reduced signal responses, impaired peak integration, and compromised quantitation accuracy. CUS and HYG detection in oral fluid samples at low concentrations by GC-MS has been reported to be challenging, with evidence of potential adsorption and/or degradation at active sites in the GC-MS system [
7]. This can be explained by the fact that CUS and HYG exhibit structural characteristics typical of active compounds (those capable of interacting strongly with active sites), such as polarity (low Log
p value of 0.72), and the presence of functional groups, such as the keto group (C=O), that are prone to chemical reactions and can undergo degradation at active sites in the GC system. Additionally, the amino group on the pyrrolidine ring promotes weak interactions (van der Waals), which could increase the adsorption on active surfaces [
15]. The results summarized in
Table 5 and
Table 6 show that the percentage of degradation products (%HYG and %HYG-d3) from CUS and CUS-d6 increases when liners are used several times (increased contamination attributed to residue from injected extracts).
The number of active sites along the flow path of a GC-MS system is not constant; it can vary over time and with use. Although the liners are highly deactivated (as specified by the manufacturer), these coatings can degrade because of exposure to high temperatures and reactive compounds. Therefore, liners must be regularly replaced to maintain optimal system performance.
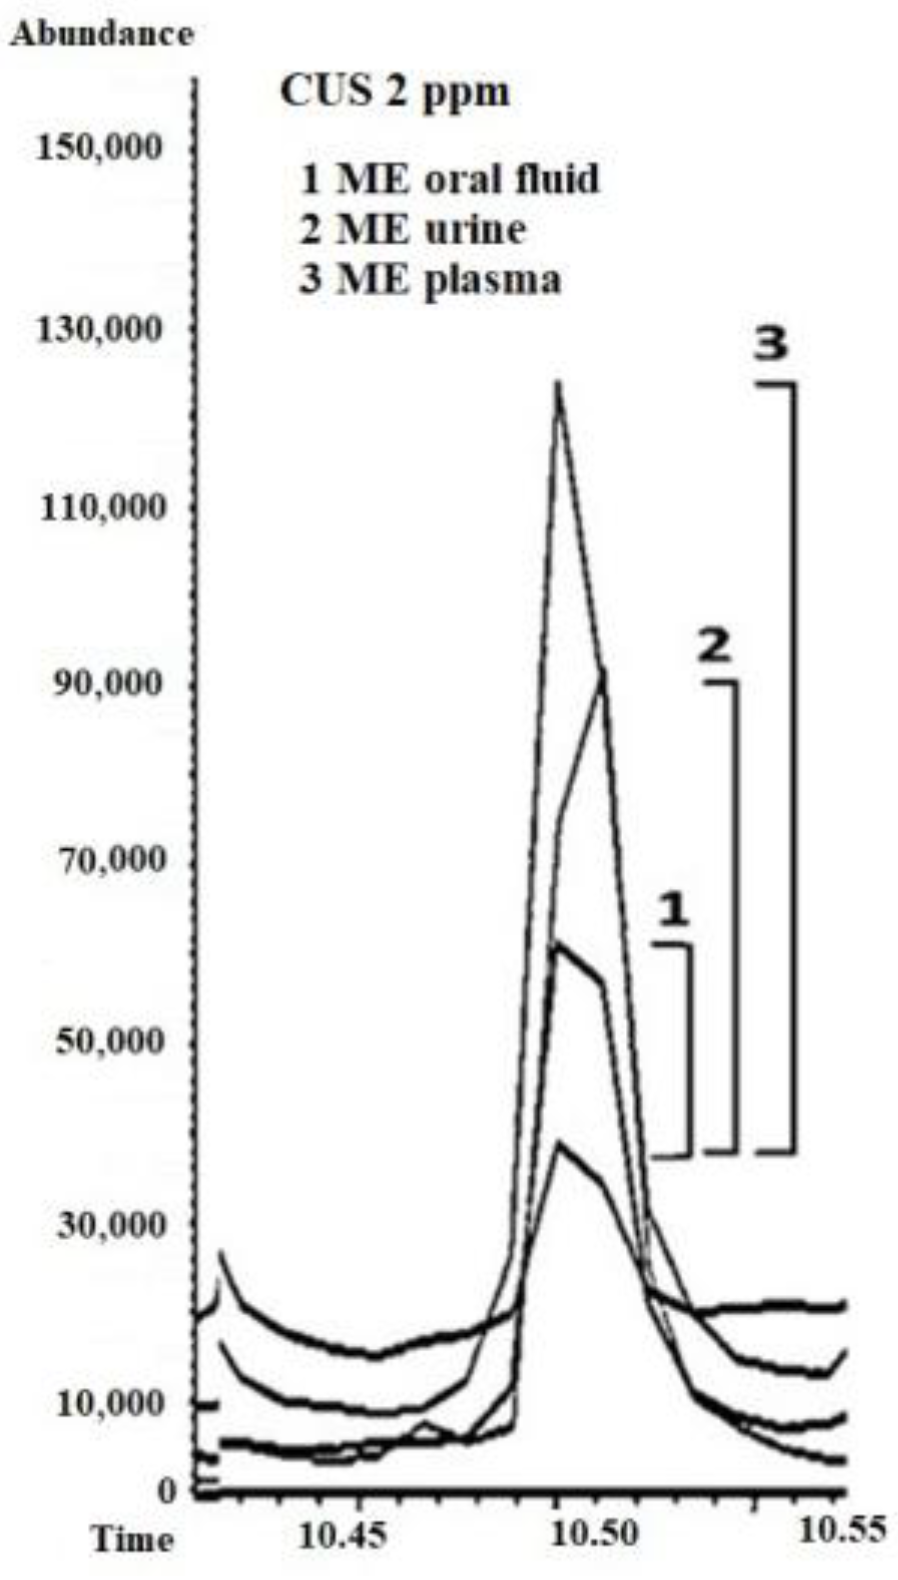
3.6. Effects of Different Biological Matrices (Urine, Plasma, and Oral Fluid)
As shown in
Table 7, ME% was found to be positive for the tested biological matrices, ranging from +64% to +316% for urine, from +95% to +142% for oral fluid, and from +29% to +256% for plasma. Based on these results and previous findings [
7], CUS has a positive and variable matrix effect dependent on the biological matrix, even within the same matrix type (urine, oral fluid, or plasma), depending on the sample donor (
Figure 8).
The calculation of the matrix effect when normalized areas were compared against internal standards (ME (n)%) revealed that the matrix composition was less influential (
Table 7), and, for example, ME% (+95%) was reduced to +14% (ME (n)%) in oral fluid when areas normalized with internal standards (deuterated analogs) were used.
Although less frequently discussed for GC-MS methods, our findings demonstrate that matrix effects can have a significant impact on analyte response [
16,
17].
The matrix effect is a well-recognized analytical phenomenon, particularly in LC-MS/MS using electrospray ionization, and it is addressed in validation guidelines, such as those from SWGTOX [
18] and the GTFCh (German Society of Toxicological and Forensic Chemistry) [
19]. Although matrix effects are more commonly associated with liquid chromatography-based techniques, they can also significantly influence gas chromatography–mass spectrometry (GC-MS) results. In this study, the observed signal enhancement (positive ME%) is attributed to the interaction of the analytes with active sites within the GC-MS system, including the inlet liner, GC column, and electron ionization (EI) source. These active sites—such as unreacted silanol groups or exposed metal surfaces—can adsorb or thermally degrade polar compounds like cuscohygrine. However, when biological matrix components are present, they may compete for or block these sites, reducing analyte loss and resulting in an enhanced signal. Even though silanized glass wool and deactivated liners are used to minimize surface activity, residual sites may still persist, particularly after repeated use or exposure to complex biological matrices. Importantly, this enhancement was not associated with any shift in retention time, which remained consistent across the matrix and solvent conditions in our data. It is worth noting that, unlike LC-MS/MS—where matrix effects primarily affect ionization efficiency—GC-MS matrix effects arise from physicochemical interactions that occur prior to ionization, particularly in the injection port and flow path. This fundamental difference helps explain why matrix effects in GC-MS may result in signal enhancement rather than suppression.
On the other hand, CUS, as previously mentioned, has chemical characteristics that are susceptible to promoting a positive matrix effect like other chemical compounds reported in the literature, such as pesticides [
15].
4. Conclusions
We have advanced our understanding of the behavior of CUS when it is assessed by GC-MS. The determination of CUS and HYG by GC-MS has revealed significant analytical challenges due to the low intensity and structural specificity of the generated m/z fragments, which make the assessment of CUS at low concentrations in biological samples extremely difficult. Unlike other coca leaf alkaloids such as COC, TRO, and CIN, CUS appears to be an active compound with significant interactions at active sites within the liner, underscoring the importance of using ultra-deactivated liners. In addition, CUS undergoes adsorption and thermal degradation, as evidenced by the pronounced matrix effects observed in the tested biological matrices (plasma, oral fluid, and urine) and by the variations in the areas of CUS, CUS-d6, and their degradation products (HYG and HYG-d3) with the injector temperature (from 180 to 290 °C). Some of these effects can be corrected by using an internal standard (normalization of CUS chromatographic peak areas using a deuterated analog such as CUS-d6). The behavior of HYG should be further investigated to determine why its response does not correlate with that of CUS. Further studies using HYG standards are necessary to elucidate these conclusions. Additionally, whether the response of CUS could vary in the presence of other alkaloids from the coca leaf, such as cocaine, ecgonine methyl ester, cinnamoylcocaine, and tropacocaine, which are common alkaloids found in biological samples of individuals who consume coca leaf in its various forms, should be examined. Ultimately, the findings of this study provide a rationale for why GC-MS should not be considered a recommended technique for the analysis of the alkaloids HYG and CUS, which have been proposed as biomarkers of coca leaf use.
Although this study focused on assessing the analytical limitations of GC-MS under standard operating conditions common in forensic toxicology laboratories, particularly in resource-limited settings, we acknowledge that alternative approaches such as derivatization strategies or cold on-column injection may warrant further investigation. However, their applicability to CUS and HYG remains to be validated experimentally. In addition, strategies commonly used in pesticide residue analysis—such as the use of analyte protectants (APs) to block active sites in the GC inlet or column—may offer potential for improving analyte stability and recovery [
15]. These compounds can minimize adsorption and degradation by occupying reactive surfaces within the GC flow path and could be adapted for polar and thermally labile alkaloids like CUS and HYG. Future studies should explore these techniques in depth, particularly if they can be incorporated into routine workflows without compromising feasibility or compliance with forensic standards.
Although the aim of this work was not to carry out analytical validation, it was carried out in a previous study [
7].


 ,
, 


