3.1. Characterization of Adsorbent
The surface morphological features of Spirulina biomass before and after praseodymium (Pr
3+) adsorption were systematically investigated using scanning electron microscopy (SEM), as shown in
Figure 1a,b, respectively. This comparative analysis reveals critical microstructural modifications induced by adsorption, providing insights into the interaction mechanisms between rare earth ions and algal biomass.
As illustrated in
Figure 1a, the untreated Spirulina biomass exhibits typical cyanobacterial morphology, characterized by smooth, uniform surfaces and well-defined oblate spheroid structures arranged in a natural helical pattern. The intact morphology reflects the structural integrity of the native biomass, with individual filaments maintaining consistent diameters (5–10 μm). The surface shows minimal topographical variation, with distinct cellular boundaries and no visible deposits. This smoothness is attributed to the presence of intact extracellular polymeric substances (EPS)—primarily polysaccharides and proteins—that coat the cell surface and enhance structural stability. Following Pr
3+ adsorption, significant morphological changes are evident in
Figure 1b. The treated biomass shows significant surface roughening and increased microtopographical complexity. Post-adsorption analysis reveals distinct structural modifications: (i) deformed spheroidal morphology, (ii) irregular surface topography featuring protrusions and depressions, (iii) partially disrupted helical organization, and (iv) surface-associated microscale aggregates. These alterations result from multiple mechanisms: surface roughening arises from strong coordination bonds between Pr
3+ and functional groups (-COOH, -OH, and -NH
2), chelation with phosphate/carboxylate groups in the cell wall, and potential ion exchange with native cations (Ca
2+, Mg
2+). Mechanical deformations suggest localized stress at Pr
3+ binding sites, disruption of hydrogen bonding in the EPS matrix, and possible partial hydrolysis of surface polysaccharides under acidic adsorption conditions. Aggregate formation may indicate secondary nucleation of Pr
3+-organic complexes, precipitation of insoluble praseodymium hydroxides/carbonates, or co-precipitation with released cellular components [
17].
The changes in elemental composition of Spirulina before and after Pr
3+ adsorption are summarized in
Table 1.
As systematically presented in
Table 1, the elemental composition of pristine Spirulina biomass reveals a characteristic profile dominated by carbon (C, 45–55%), oxygen (O, 25–35%), and nitrogen (N, 10–15%), which collectively constitute approximately 85–95% of the total elemental content. This composition profile directly reflects the fundamental biochemical architecture of cyanobacterial cells, consisting primarily of polysaccharides (including lipopolysaccharides and peptidoglycans), proteins, lipids, and nucleic acids. The inorganic component analysis demonstrates a significant presence of metal cations, with sodium (Na, 2–5%), sulfur (S, 1–3%), potassium (K, 1–3%), and magnesium (Mg, 0.5–1.5%) being the predominant metallic species. The smooth surface morphology observed in
Figure 1 for untreated Spirulina results from the dense, well-organized arrangement of these biomolecules, which creates a relatively homogeneous surface topography at the micrometer scale. This surface presents numerous potential adsorption sites through various functional groups: -COOH, -OH, -NH
2, -PO
43−, and –SH. These functional groups collectively create a polyfunctional surface capable of complex interactions with metal ions through multiple binding mechanisms [
18]. The adsorption of praseodymium ions (Pr
3+) induces significant alterations in both the elemental composition and physical structure of Spirulina biomass, as evidenced by comparative analysis. Energy-dispersive X-ray spectroscopy (EDS) analysis reveals an emergence of distinct Pr peaks (3–8% atomic concentration), a complete disappearance of Na and K signals, a reduction in Mg signal intensity (50–70% decrease), and a relative increase in C and O percentages due to metal displacement. These observations strongly suggest an ion exchange mechanism, as follows: Pr
3 + + 3(Na
+/K
+)-Biomass→Pr-Biomass + 3Na
+/K
+.
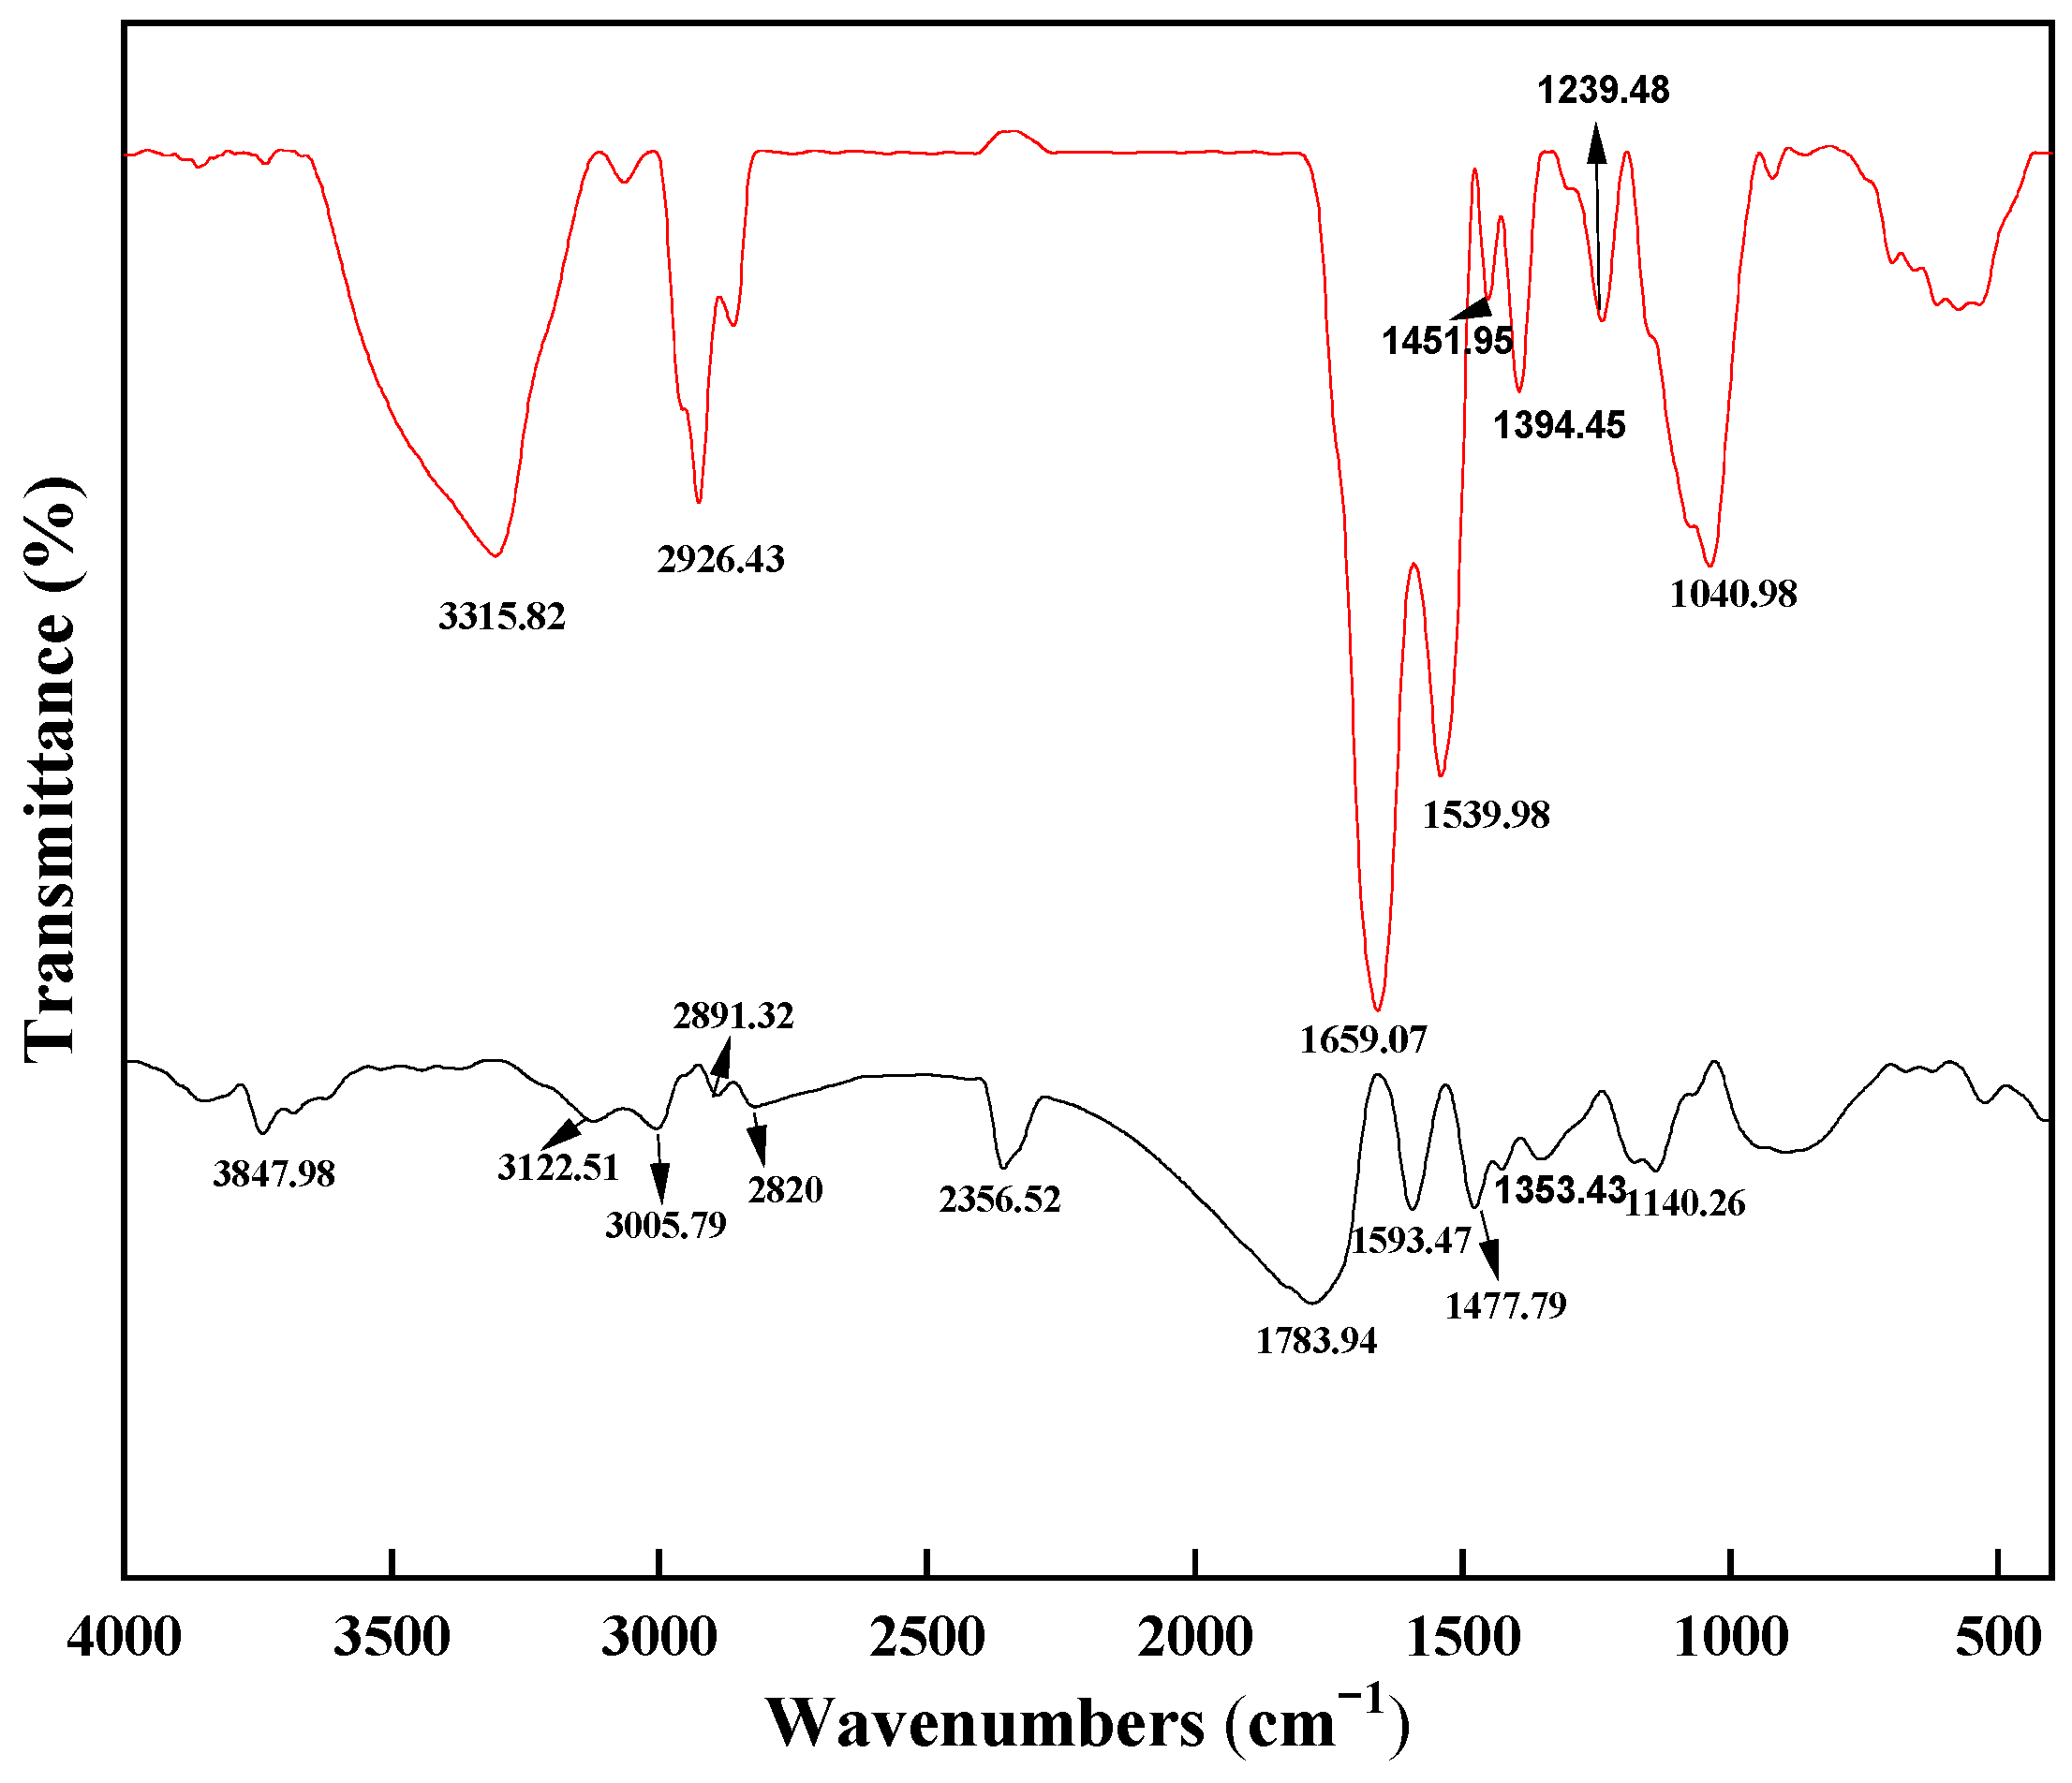
The FT-IR spectra of Spirulina before and after Pr
3+ adsorption (
Figure 2) reveal key functional group interactions.
The Fourier-transform infrared (FTIR) spectrum of Spirulina biomass after Pr
3+ adsorption (
Figure 2) exhibits characteristic vibrational modes that reveal the complex biochemical composition of this cyanobacterial matrix. The observed absorption profile between 4000 and 400 cm
−1 can be systematically categorized into four key regions: the broad, intense peak centered at 3315 cm
−1 represents overlapping stretching vibrations of hydroxyl groups (νO-H) from polysaccharides and bound water molecules, and amino groups (νN-H) primarily from protein amide functionalities and hydrogen-bonded networks in the extracellular polymeric substances [
19]. The distinct peak at 2926 cm
−1 corresponds to asymmetric stretching of aliphatic C-H bonds, which is characteristic of methylene groups in fatty acid chains and amino acid side chains [
20]. The carbonyl/carboxyl region (1800–1500 cm
−1) shows three prominent features: amide I band (νC=O) from peptide backbone conformations (1659 cm
−1); amide II band (δN-H + νC-N) indicating protein secondary structure (1539 cm
−1) [
21]; symmetric carboxylate stretching (νsCOO
−) (1451 cm
−1) [
22]. The complex pattern in the fingerprint region (1500–400 cm
−1) includes the following: C-O-H bending of carboxylic acids (1394 cm
−1); P=O stretching from phospholipids (1239 cm
−1) and C-O-C glycosidic linkages in polysaccharides (1040 cm
−1); characteristic vibrations of phosphate (νP-O) and sulfonate (νS-O) groups (750–900 cm
−1) [
23]. Comparative analysis of pre-adsorption and post-adsorption spectra reveals significant alterations that elucidate the Pr
3+ binding mechanism. The broad hydroxyl peak at 3315 cm
−1 demonstrates a 25% reduction in integrated peak area, a 15 cm
−1 blue shift toward 3300 cm
−1, and a peak width at half-height increase by 18%. These changes indicate direct coordination of Pr
3+ with -OH groups (forming Pr-O bonds), participation of amino groups in metal complexation, and disruption of hydrogen-bonding networks. The amide I region shows the 1659 cm
−1 peak intensity decrease by 30%, emergence of a shoulder at 1635 cm
−1, in addition to observable broadening of the amide II vibrational mode at 1539 cm
−1, evidenced by an increase in full width at half maximum (FWHM) from 45 to 62 cm
−1. The 17 cm
−1 FWHM increase indicates development of multiple conformational substates within protein secondary structures. It suggests transformation from relatively uniform β-sheet domains (narrow peak) to a mixture of distorted β-sheets (1540–1535 cm
−1), partial α-helix conversion (1545–1550 cm
−1), and Pr
3+-coordinated random coils (1525–1535 cm
−1). The carboxylate region exhibits the 1394 cm
−1 peak splitting into a doublet (1394/1375 cm
−1) and a new feature at 1412 cm
−1 (attributed to Pr
3+-carboxylate complexes) [
24]. The 750–900 cm
−1 region develops new resolved peaks at 825 and 875 cm
−1, 35% intensity enhancement at 805 cm
−1, and disappearance of the 780 cm
−1 shoulder. FTIR analysis reveals a multimodal adsorption process involving distinct interactions with functional groups. Carboxyl groups (–COOH): Pr
3+ displaces protons to form stable bidentate complexes. Phosphate groups (–PO
42−): Pr
3+ uptake occurs via ion exchange with associated cations (K
+/Na
+). Hydroxyl groups (–OH): weak coordination through hydrogen-bonded water bridges. Amino groups (–NH
2): limited participation due to proton competition under acidic conditions.
3.2. Effect of Adsorption Conditions
The adsorption system is highly sensitive to pH, which critically determines the surface charge of the adsorbent and the ionic species in solution. Spirulina, rich in amino acids (e.g., glutamic acid and alanine) and peptidoglycans, possesses abundant -COOH and -NH
2 groups, exhibiting weak acidity [
25]. This study investigates the effect of initial pH (2–6) on Pr
3+ removal (
Figure 3). At pH 2, the adsorption efficiency is minimal due to high H
+ concentrations, where Pr
3+ competes with H
+ for adsorption sites. As pH rises to 5, Pr
3+ adsorption peaks because the Spirulina surface gains a negative charge, reducing H
+ competition. The trend shows two distinct regimes: 2 ≤ pH < 5, adsorption increases; pH 5 < pH ≤ 6, adsorption declines. Optimal adsorption occurs at pH 5, where Spirulina achieves maximal Pr
3+ uptake. Solution pH governs both adsorbent surface electronegativity and H
+–metal ion binding [
26]. At a low pH, functional groups on Spirulina cell walls protonate, yielding a net positive surface charge. Electrostatic repulsion between Pr
3+ and the adsorbent increases at lower pH, hindering adsorption. With a rising pH, deprotonation generates negatively charged reactive groups (e.g., -COO
−), creating additional Pr
3+ binding sites. Positively charged Pr
3+ occupies these sites, enhancing adsorption. However, excessively high pH (>6) promotes Pr
3+ hydroxide precipitation (Pr(OH)
3, K
sp = 10
−19·
8), eliminating soluble Pr
3+ and impairing adsorption. At pH 5, an optimal balance is achieved; carboxyl groups are sufficiently deprotonated (pKa ≈ 4.5), phosphate groups maintain their reactivity, and Pr
3+ hydrolysis is minimized.
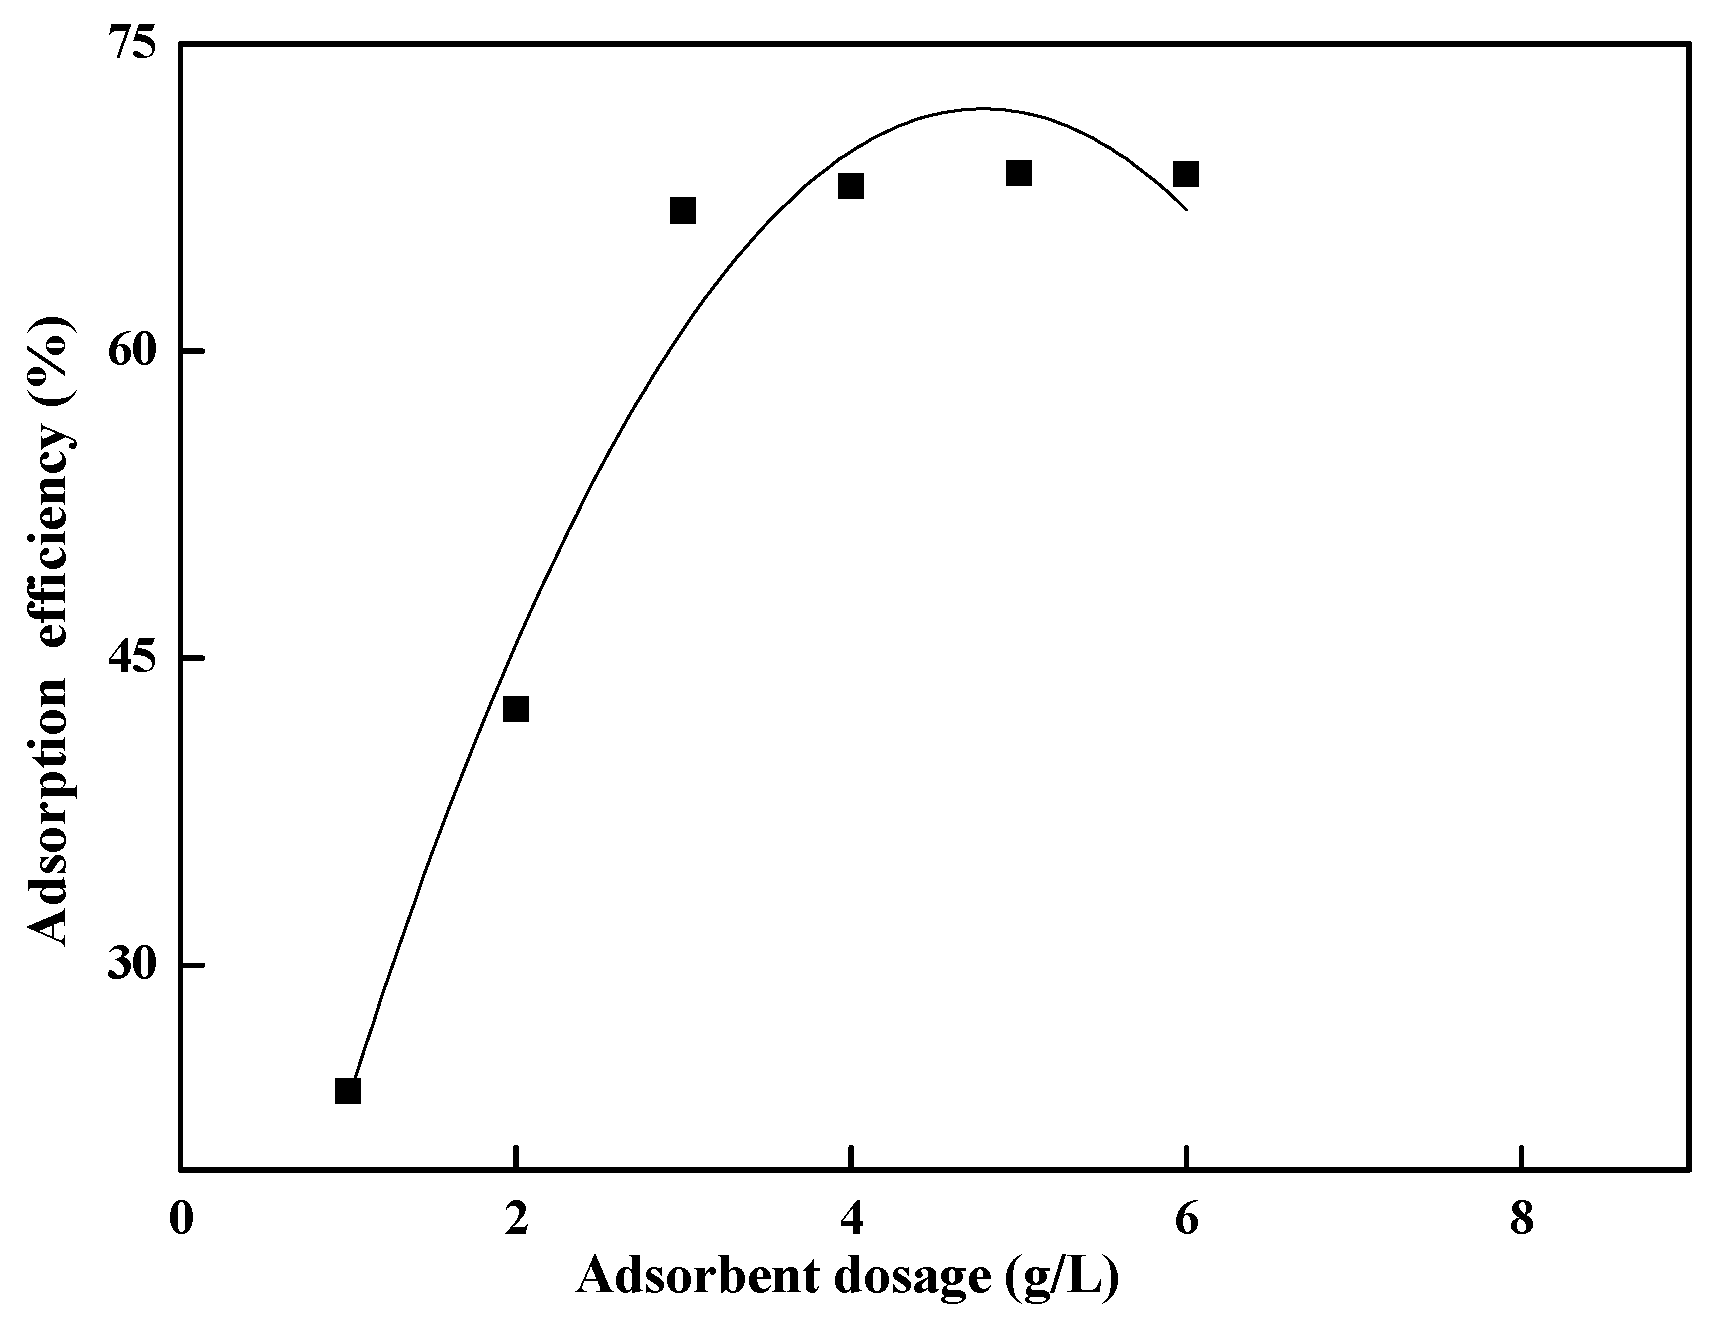
The amount of adsorbent is a crucial parameter in adsorbent production. In this experiment, simulated wastewater containing 100 mg/L of Pr
3+ was placed in a 50 mL conical flask, with the pH adjusted to 5. The adsorbent dosage was varied from 0.4 to 8.0 g/L and shaken for 60 min. The results are shown in
Figure 4. The experimental results indicate that within the adsorbent dosage range of 0.4–8.0 g/L, the removal rate of Pr
3+ (initial concentration: 100 mg/L) initially increases with adsorbent dosage but then stabilizes. The adsorption efficiency reaches its maximum at 2.0 g/L, beyond which further increases in adsorbent dosage do not significantly improve adsorption. Therefore, the optimal dosage is determined to be 2.0 g/L, which ensures both high adsorption efficiency and economical use of Spirulina.
The adsorbent dosage is a critical operational parameter in wastewater treatment processes, directly influencing both process efficiency and economic viability. In this systematic investigation, batch adsorption experiments were conducted using 50 mL aliquots of synthetic wastewater containing 100 mg/L Pr
3+ solutions, with the pH maintained at 5.0 through careful adjustment using 0.1 M CH
3COOH/CH
3COONa. The adsorbent (Spirulina biomass) dosage was systematically varied across eight levels (0.4, 0.8, 1.2, 1.6, 2.0, 4.0, 6.0, and 8.0 g/L) to establish a comprehensive dose–response relationship. All experiments were performed in 50 mL polypropylene conical flasks, agitated at 150 rpm in a temperature-controlled orbital shaker (298 K) for a standardized contact time of 60 min. The experimental results (
Figure 4) reveal three distinct phases in the adsorption profile. Phase I: rapid efficiency enhancement (0.4–1.6 g/L). Pr
3+ removal efficiency increases linearly from 42% to 86%, with each 0.4 g/L increment yielding a 14.7% improvement in removal efficiency. This phase corresponds to abundant available active sites relative to the Pr
3+ concentration. Phase II: performance plateau (1.6–2.0 g/L). Removal efficiency reaches 89–91%, indicating near-equilibrium conditions. Marginal improvements of less than 3% per dosage increment are observed, suggesting that the available binding sites are approaching saturation. Phase III: diminishing Returns (>2.0 g/L). The maximum removal efficiency stabilizes at 92%, with no significant improvement (
p > 0.05) beyond 2.0 g/L. A slight decrease in adsorption capacity (qₑ) is observed due to site overlapping. This phase indicates that excess biomass may shield active sites from metal ions. The observed trends can be explained as follows: Initial increases in dosage provide more binding sites (e.g., –COOH, –PO
4). Higher dosages may cause particle aggregation, reducing the effective surface area. The optimal dosage of 2.0 g/L represents the most efficient operational point because it achieves 91% removal efficiency (near the maximum theoretical value), maintains a high adsorption capacity (45.5 mg/g), minimizes biomass consumption (60% reduction compared to the 8.0 g/L dosage), and reduces subsequent solid–liquid separation costs.
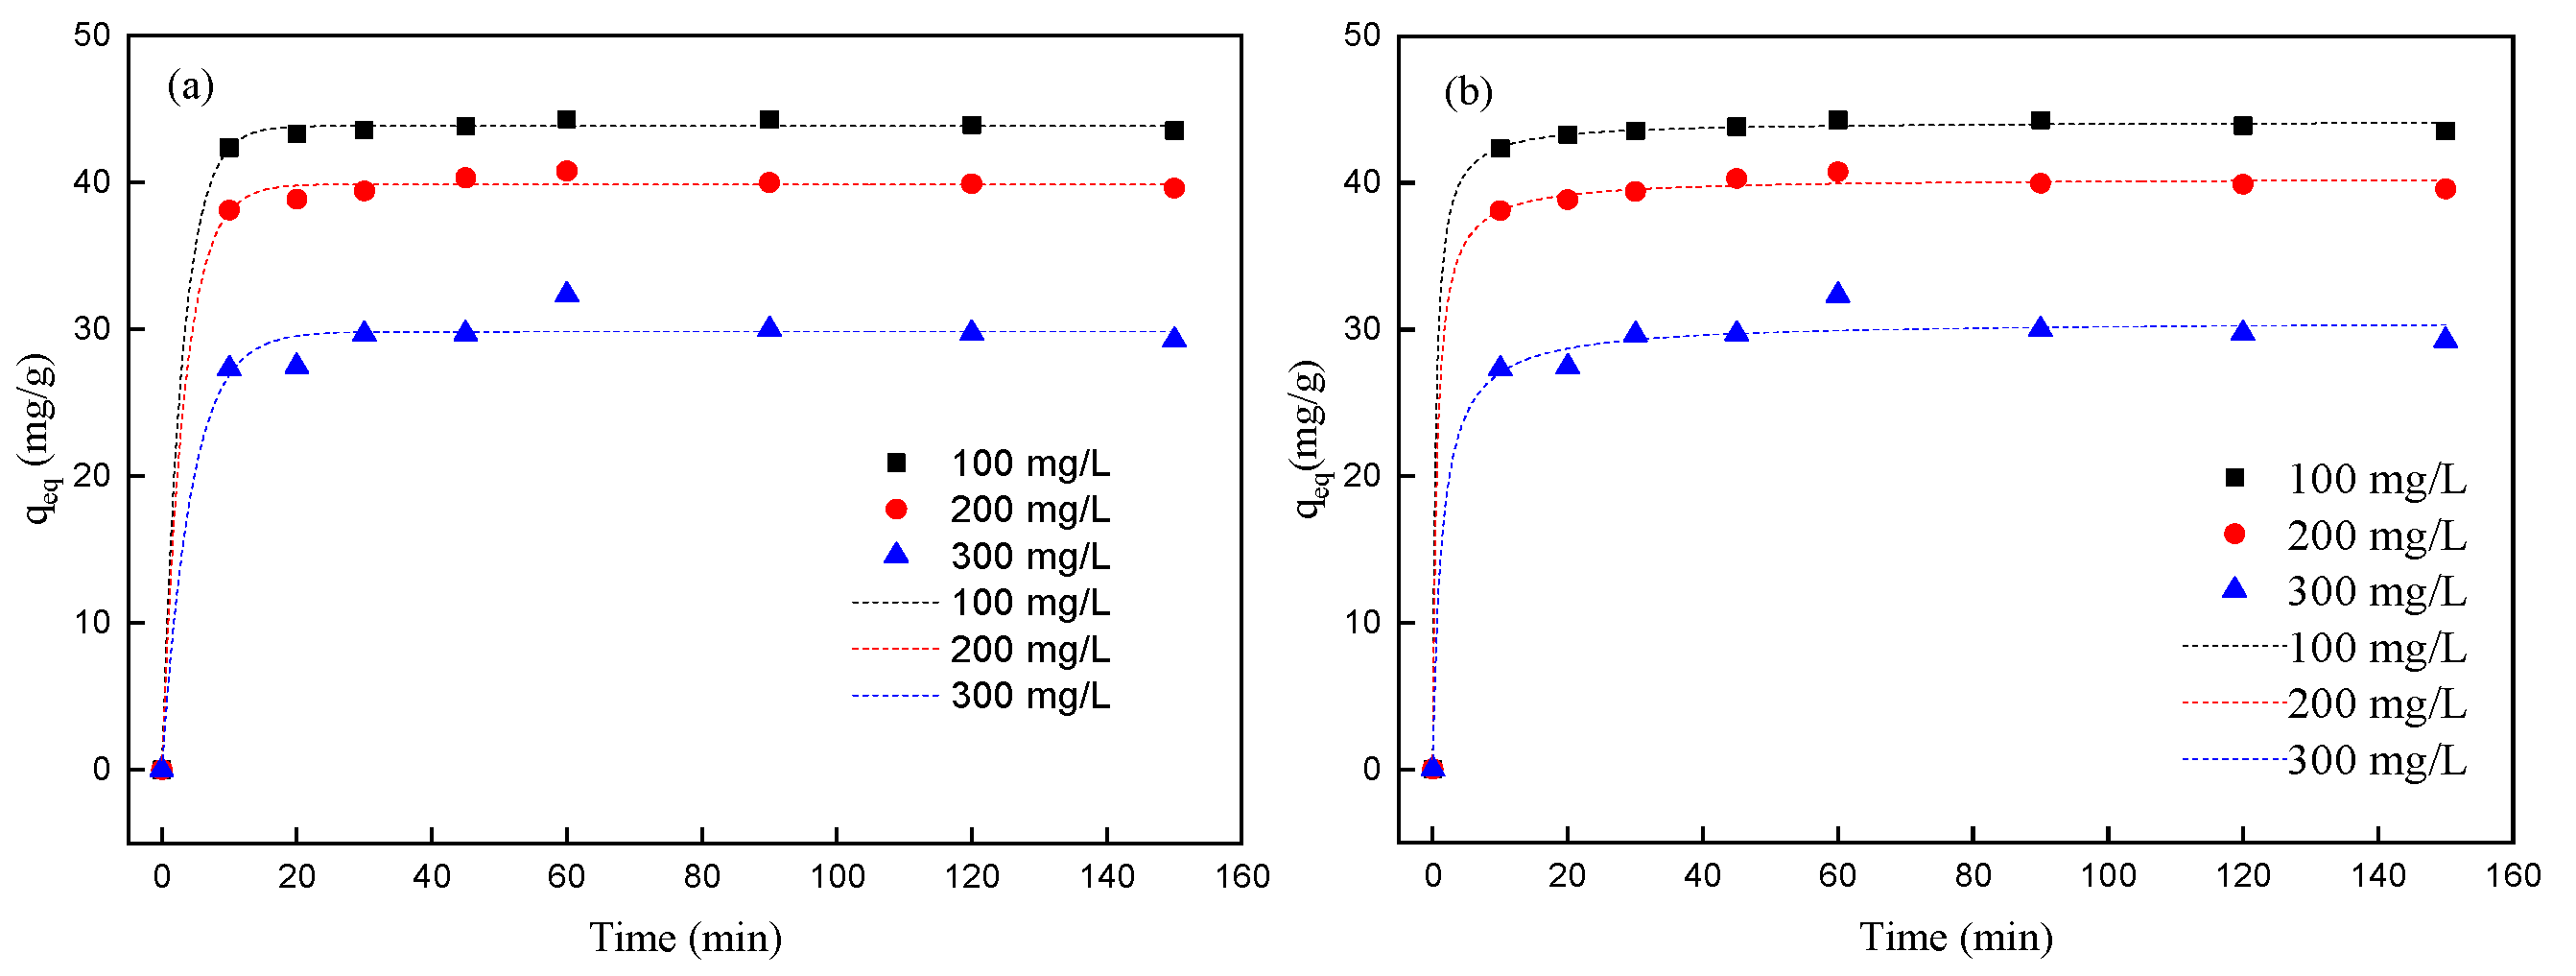
Contact time represents a fundamental parameter in adsorption systems, governing both process efficiency and practical implementation feasibility. This investigation systematically examines the temporal evolution of Pr
3+ removal by Spirulina biomass across an extended timeframe (10–150 min), providing crucial insights into the underlying adsorption mechanisms and operational optimization potential. The study was conducted under controlled conditions: an initial Pr
3+ concentration of 100 mg/L; solution pH, 5.0, maintained with 0.1 M CH
3COOH/CH
3COONa buffers; biomass dosage, 2.0 g/L (optimized from the above studies); temperature, 298 K; agitation, 150 rpm. The time-dependent adsorption profile obtained (
Figure 5) reveals three distinct kinetic phases. The initial phase (0–10 min) with 90–92% of the total adsorption capacity was achieved, with an initial rate of 8.7 mg/(g·min). The observed adsorption behavior can be attributed to multiple synergistic factors: the negatively charged surface of Spirulina biomass creates strong Coulombic attraction with positively charged Pr
3+ cations, facilitating initial contact and surface accumulation (electrostatic interactions); rapid coordination occurs between Pr
3+ ions and exposed oxygen-containing functional groups, particularly carboxyl (-COOH) and phosphate (-PO
4) moieties, forming stable chelate complexes (surface complexation). The significant concentration gradient between the bulk solution and the adsorbent surface provides substantial mass transfer impetus, enhancing adsorption kinetics (thermodynamic driving force). A transition phase (30–60 min) with an additional 5–7% of the capacity was attained, with the rate decreasing to 0.4 mg/(g·min). An equilibrium phase (>60 min) with a marginal capacity increase (<1%) occurs beyond 60 min, with final equilibrium achieved by 150 min, and the qₑ
q was 46.2 mg/g.
The influence of initial Pr
3+ concentration on adsorption behavior was systematically investigated through a series of controlled batch experiments. The study employed standardized conditions: adsorbent mass of 0.1 g of Spirulina biomass; pH was 5.0, maintained with 0.1 M CH
3COOH/CH
3COONa buffer; agitation speed was 185 rpm; temperature was 298 K; contact time was 60 min; Pr
3+ concentration range was 20–500 mg/L. The experimental results (
Table 2) reveal two distinct operational regimes. Low-concentration regime (20–100 mg/L): adsorption efficiency increases from 68% to 92%, and equilibrium capacity grows from 13.6 to 46.0 mg/g. High-concentration regime (100–500 mg/L): efficiency declines from 92% to 58%. Site saturation becomes evident as the theoretical monolayer coverage is reached at 300 mg/L, and additional Pr
3+ leads to multilayer adsorption. The adsorption efficiency of Pr
3+ onto functionalized surfaces (e.g., carboxylate/phosphonate-modified adsorbents) is constrained by three interrelated factors. Finite number of functional groups: surface binding sites (e.g., -COOH, -PO
4−) are limited in quantity. Initial rapid uptake occurs via coordination to these groups, but saturation is reached as Pr
3+ occupies all available sites, following Langmuir-type monolayer adsorption. Steric hindrance at high loading: at elevated Pr
3+ coverage, bulky hydrated ions or multidentate binding modes physically block adjacent sites. This reduces accessibility for further adsorption, deviating from ideal kinetic/isotherm models. Electrostatic repulsion between adsorbed Pr
3+: as Pr
3+ (a trivalent cation) accumulates, positive charges cluster on the surface, creating coulombic repulsion. This repulsion opposes additional Pr
3+ binding, lowering effective affinity. It also may distort the local structure of functional groups, weakening their coordination ability.
3.3. Adsorption Isotherms
Adsorption isotherms are used to describe the relationship between adsorption capacity and equilibrium concentration. By combining different solid surfaces with adsorbates, various adsorption isotherms can be obtained, which reflect the interactions between the adsorbate and adsorbent to some extent. Langmuir, Freundlich, D-R, and R-P adsorption models were introduced to investigate the adsorption process. By analyzing these isotherms, we can gain insights into adsorption interactions. Furthermore, combining the results from SEM, EDX, FT-IR, and XPS analyses with the adsorption isotherm data allows for a comprehensive characterization of the biosorbent Spirulina, laying the foundation for developing an efficient adsorption–desorption process.
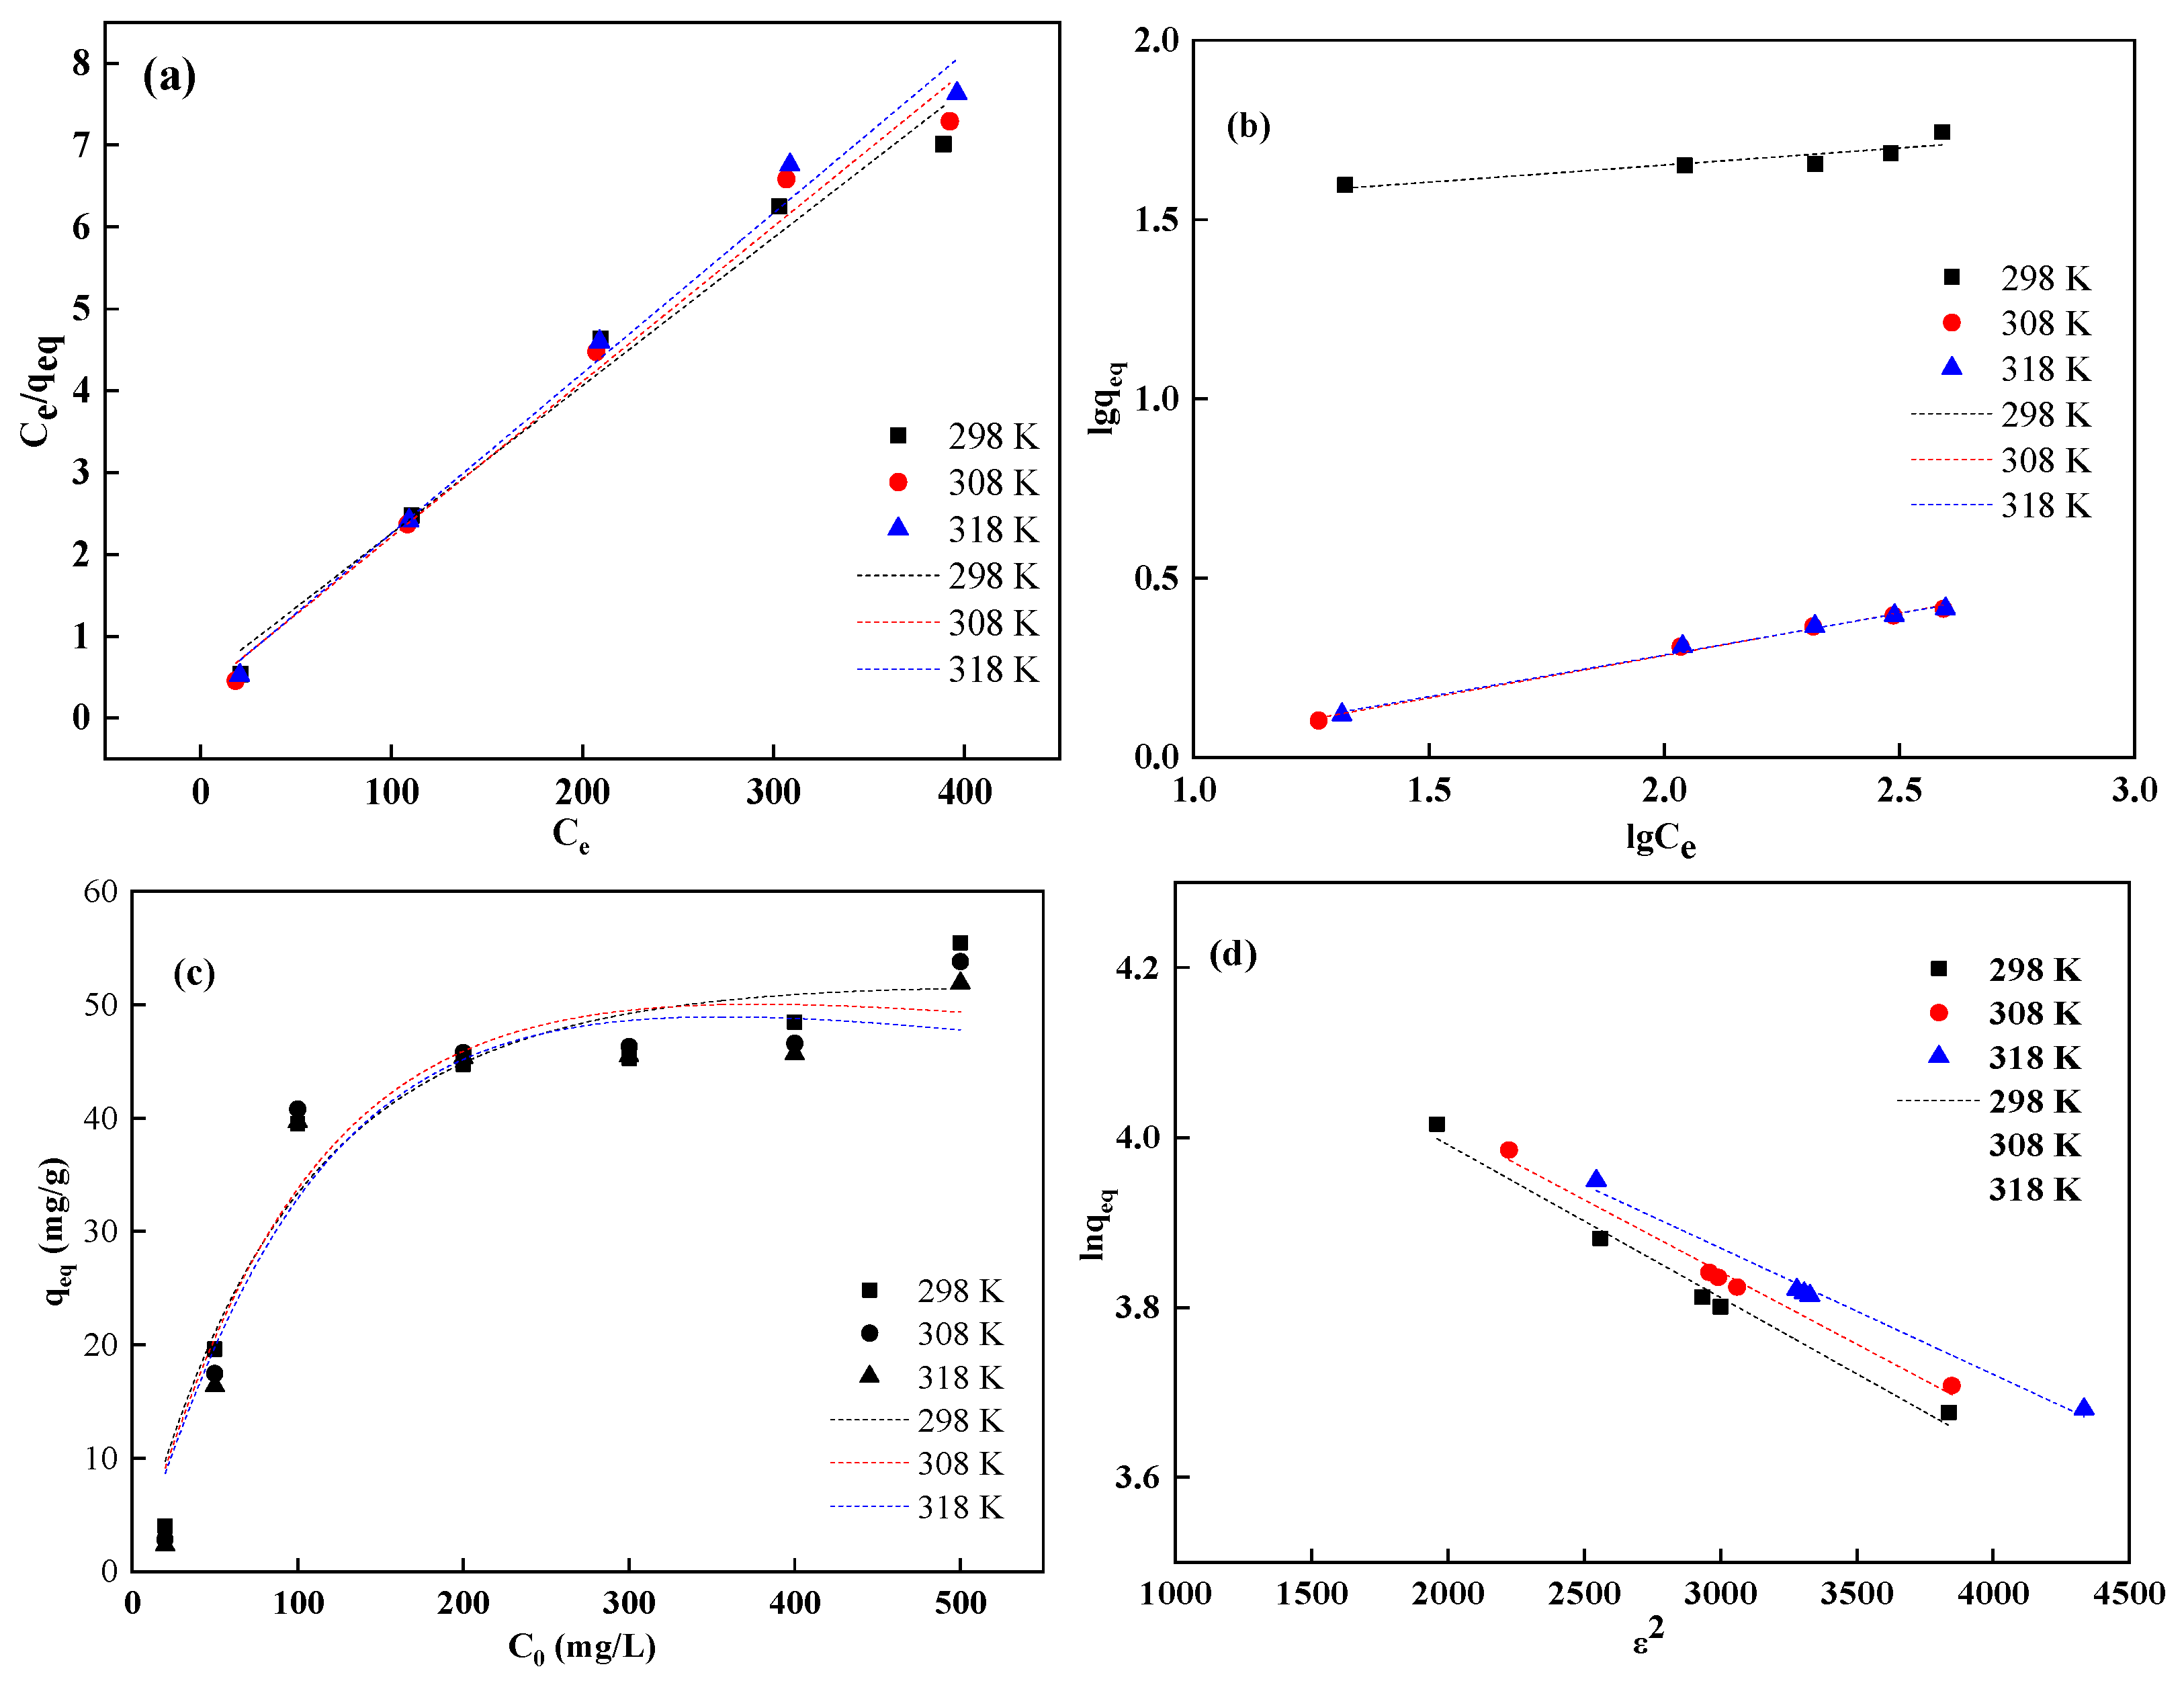
Based on gas–solid adsorption theory, the Langmuir model describes the equilibrium relationship between the adsorbed metal ion quantity and their equilibrium concentration in solution. It is widely applied in solid–liquid adsorption systems [
27]. Equation (3) was used to fit the experimental data for Spirulina adsorption of Pr
3+, with the results shown in
Figure 6a. The Freundlich adsorption model is an empirical equilibrium model based on multilayer adsorption. The Freundlich model describes adsorption on heterogeneous surfaces. Equation (5) was used to fit the experimental data for Spirulina adsorption of Pr
3+, with the results shown in
Figure 6b. R-P adsorption model combines features of both the Langmuir and the Freundlich models, using three parameters to characterize the system [
28]. Equation (7) was used to fit the experimental data for Spirulina adsorption of Pr
3+, with the results shown in
Figure 6c. The D-R adsorption model helps determine whether adsorption is physical or chemical by calculating the adsorption free energy (E) using Equation (10). Equation (8) was used to fit the experimental data for Spirulina adsorption of Pr
3+, with the results shown in
Figure 6d.
At different temperatures, the experimental data for the adsorption of Pr
3+ by Spirulina were fitted using the Freundlich model, Langmuir model, R-P model, and D-R model, respectively. The resulting fitting parameters are presented in
Table 3 and
Table 4.
From
Table 3, it can be observed that in the Langmuir model, the
R2 values ranged from 0.993 to 0.999, while in the Freundlich model, they varied between 0.739 and 0.990. For the R-P (R-P) model (
Table 4), R
2 values were in the range of 0.899–0.917, and for the D-R model (
Table 4),
R2 values were 0.981–0.986. These values indicate that the Langmuir, R-P, and D-R models could effectively describe the biosorption of Pr
3+ by Spirulina at different temperatures. However, when comparing the
R2 values, it can be concluded that the Langmuir model was more appropriate than the Freundlich, R-P, and D-R models.
Within the temperature range of 298–318 K, the monolayer adsorption capacity (
qₘ) calculated from the Langmuir model ranged between 51.10 and 55.31 mg/g. This suggests that qₘ decreased with increasing temperature, indicating the exothermic nature of Pr
3+ adsorption on Spirulina (
Table 3). For initial Pr
3+ concentrations ranging from 100 to 500 mg/L, the calculated
KL values from the Langmuir model were between 0.041 and 0.066. These parameter values (0 <
KL < 1) demonstrate that Spirulina is a suitable adsorbent for Pr
3+ removal from aqueous solutions. From the linear plots of the Freundlich isotherm, the K
F values were calculated to be 0.662–28.935 L/g, with
n values ranging from 4.22 to 4.30. When the 1/
n value falls between 0 and 1, the adsorption process is considered favorable, while 1/
n > 1, 1/
n = 0, or 1 indicates unfavorable, irreversible, or linear adsorption, respectively. Therefore, under the investigated experimental conditions, the adsorption of Pr
3+ on Spirulina was favorable.
The g values calculated from the R-P isotherm model can be used to test the applicability of the Langmuir model for Pr
3+ adsorption on Spirulina. Within the 298–318 K temperature range, these values ranged from 1.219 to 1.442. Thus, it can be stated that Pr
3+ adsorption on Spirulina was well described by the R-P model, and the adsorption process was related to the saturation monolayer of adsorbate molecules on the adsorbent surface [
29]. The D-R isotherm model can distinguish whether Pr
3+ adsorption on Spirulina is a physical or chemical process. The
β constant and monolayer adsorption capacity (
qₘ) were calculated from the slope and intercept of the plot. The
β constant values were found to be 1.49 × 10
−4 to 1.78 × 10
−4 mol
2/J
2, with
qₘ values of 74.87–77.62 mg/g. The adsorption energy E can determine whether the mechanism involves chemical ion exchange or physical adsorption. If
E values fall within 8–16 kJ/mol, the process follows chemical ion exchange, while E < 8 kJ/mol indicates physical adsorption [
11]. As shown in
Table 4, the E values for Pr
3+ adsorption on Spirulina at 298–318 K ranged from 14.76 to 15.32 kJ/mol, confirming that the adsorption occurred through chemical ion exchange.
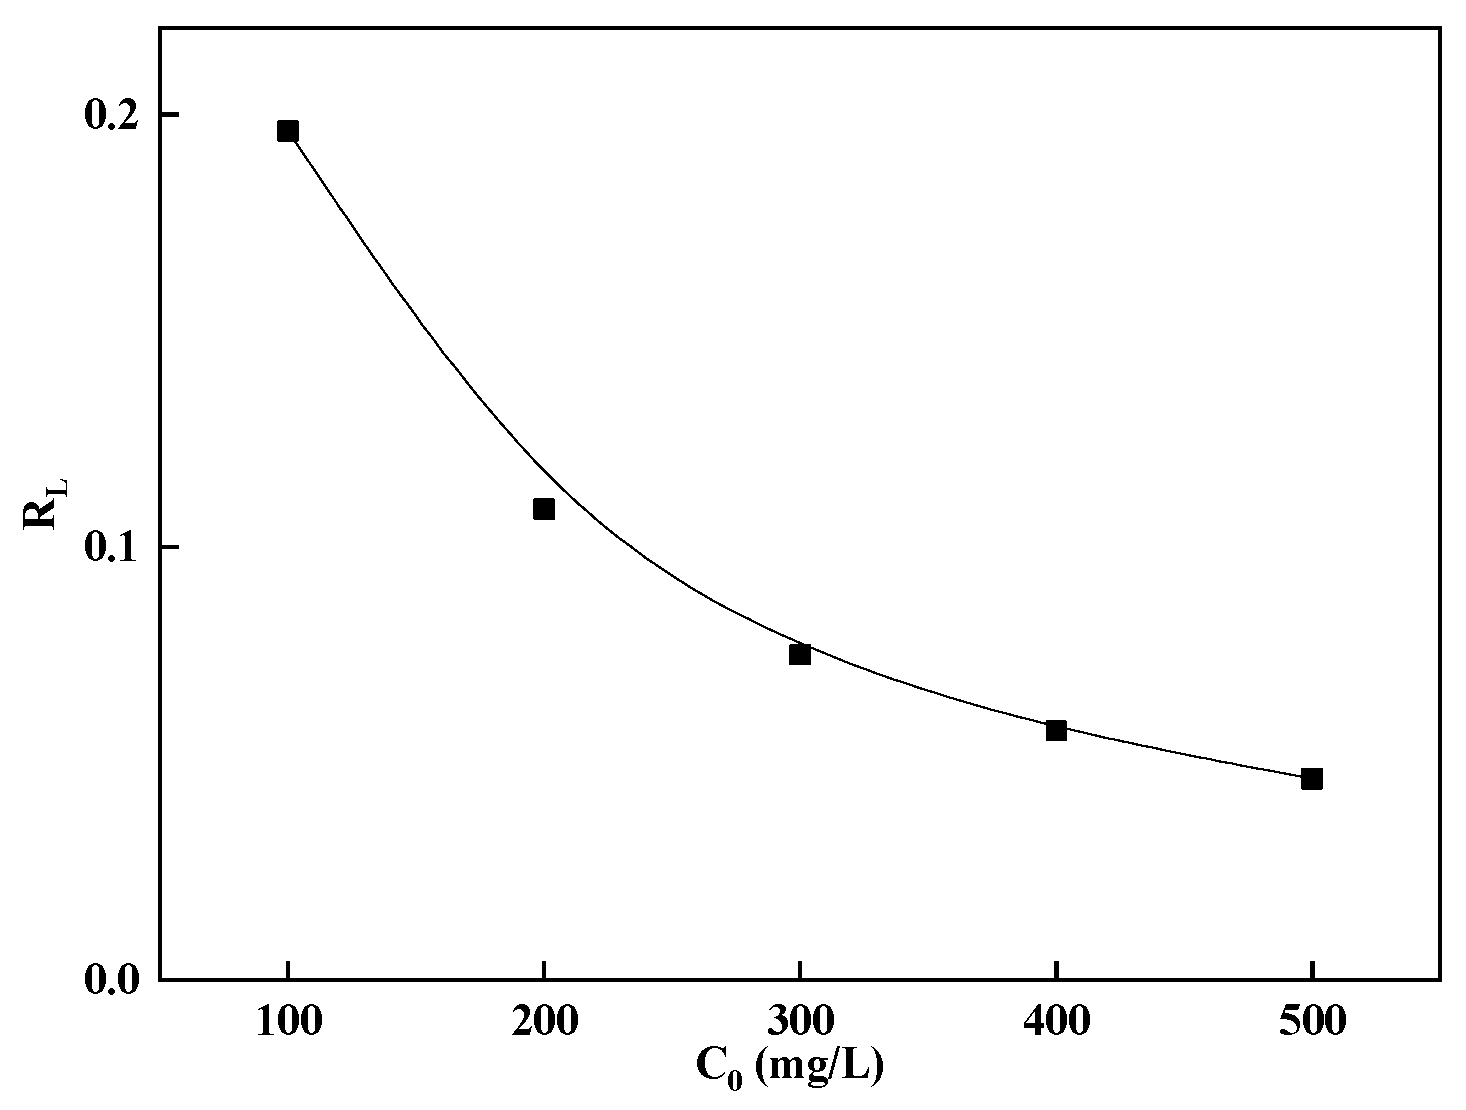
The separation factor
RL was calculated using Equation (4), with results presented in
Figure 7. The plot shows that
RL values decreased with increasing initial rare earth ion concentration, suggesting that higher initial concentrations favored adsorption. Furthermore, 0 <
RL < 1 provides additional evidence that the adsorption process was favorable [
30].
Understanding adsorption mechanisms requires a multi-faceted analytical approach. XPS serves as a powerful tool for surface analysis, providing detailed information on elemental composition, chemical states, and electronic interactions. The XPS spectra of Spirulina before and after Pr
3+ adsorption are presented in
Figure 8, which includes (a) survey scan, (b) Pr 3d, (c) C 1s, (d) N 1s, and (e) O 1s regions.
The Pr 3d spectrum (
Figure 8b) exhibited a distinct peak at 934.58 eV, confirming the presence of Pr
3+ on the Spirulina surface [
31]. This observation provides direct evidence of Pr
3+ adsorption, corroborating the ion exchange mechanism suggested by isotherm modeling. The deconvoluted C 1s spectrum (
Figure 8c) revealed three distinct components. The peak at 284.8 eV represents C-C/C-H bonds characteristic of aliphatic carbon chains, forming the fundamental hydrocarbon framework of the biomatrix. The 285.3 eV component corresponds to C-O single bonds, primarily arising from either hydroxyl groups (-OH) in carbohydrate moieties or ether linkages (C-O-C) within polysaccharide structures. The higher binding energy peak at 286.7 eV is assigned to C=O double bonds, encompassing various carbonyl functionalities, including ketones, aldehydes, and carboxylate groups present in the biological material. The N 1s spectrum (
Figure 8d) before adsorption showed a peak at 399.73 eV, attributed to C-NH
2 (amine groups) [
32]. Following adsorption, this peak shifted to 400.4 eV, indicating nitrogen participation in Pr
3+ coordination. The positive binding energy shift results from electron-withdrawing effects exerted by both Pr
3+ and adjacent C=O groups, which reduce electron density around nitrogen atoms. This decreased shielding effect increases core electron binding energy, leading to the observed high-energy shift. The O 1s spectrum (
Figure 8e) revealed two major peaks before adsorption. The peak at 531.52 eV corresponds to C–O bonds, characteristic of hydroxyl (–OH) or ether (C–O–C) oxygen functionalities, which are commonly found in polysaccharides and other biopolymer structures. The peak at 532.32 eV corresponds to the C=O bond [
33]. These peaks remained largely unchanged after adsorption, suggesting that oxygen-containing functional groups play a stabilizing rather than a primary role in Pr
3+ binding. The XPS results provide direct evidence of chemical adsorption via ion exchange, where Pr
3+ interacts predominantly with carboxyl and amine groups on the Spirulina surface. The binding energy shifts in C 1s and N 1s spectra highlight significant electronic redistribution, reinforcing the role of functional groups in Pr
3+ coordination [
34]. These findings align with previous FT-IR observations, which detected changes in functional group vibrations upon Pr
3+ adsorption, and EDX data, which confirmed elemental composition modifications. The combined evidence supports a chelation-assisted ion exchange mechanism, where Pr
3+ displaces protons or light metal ions (e.g., Na
+, K
+) from biomass binding sites.


