Article

Volatilomic Fingerprint of Tomatoes by HS-SPME/GC-MS as a Suitable Analytical Platform for Authenticity Assessment Purposes

1
CQM—Centro de Química da Madeira, Universidade da Madeira, Campus da Penteada, 9020-105 Funchal, Portugal
2
Departamento de Química, Faculdade de Ciências Exatas e Engenharia, Universidade da Madeira, Campus da Penteada, 9020-105 Funchal, Portugal
*
Author to whom correspondence should be addressed.
Separations 2025, 12(8), 188; https://doi.org/10.3390/separations12080188
Submission received: 25 June 2025 / Revised: 14 July 2025 / Accepted: 17 July 2025 / Published: 22 July 2025

Abstract

Tomatoes are globally esteemed not only for their nutritional value but also for their complex and appealing aroma, a key determinant of consumer preference. The present study aimed to comprehensively characterise the volatilomic fingerprints of three tomato species—Solanum lycopersicum L., S. lycopersicum var. cerasiforme, and S. betaceum—encompassing six distinct varieties, through the application of headspace solid-phase microextraction coupled with gas chromatography–mass spectrometry (HS-SPME/GC-MS). A total of 55 volatile organic compounds (VOCs) spanning multiple chemical classes were identified, of which only 28 were ubiquitously present across all varieties examined. Carbonyl compounds constituted the predominant chemical family, with hexanal and (E)-2-hexenal emerging as putative key contributors to the characteristic green and fresh olfactory notes. Notably, esters were found to dominate the unique volatile fingerprint of cherry tomatoes, particularly methyl 2-hydroxybenzoate, while Kumato and Roma varieties exhibited elevated levels of furanic compounds. Multivariate statistical analyses, including principal component analysis (PCA) and partial least squares discriminant analysis (PLS-DA), demonstrated clear varietal discrimination and identified potential aroma-associated biomarkers such as phenylethyl alcohol, 3-methyl-1-butanol, hexanal, (E)-2-octenal, (E)-2-nonenal, and heptanal. Collectively, these findings underscore the utility of volatilomic fingerprint as a robust tool for varietal identification and quality control within the food industry.

Graphical Abstract

1. Introduction

The tomato (Solanum spp.) is one of the most widely cultivated horticultural crops globally, ranking as the second most economically significant commodity in the world. In 2023, global tomato production reached an estimated 192 million tons, with Asia accounting for the largest share (62.7%), followed by the Americas (13.9%), Africa (12%), Europe (11.2%), and Oceania (0.2%) [1]. This extensive cultivation underscores the tomato’s pivotal role in global food systems and its substantial economic value to the agricultural and food industries. In addition to its economic significance, the tomato is highly regarded for its nutritional profile, which is characterised by a diverse array of bioactive compounds, including dietary fibre, vitamins, minerals, amino acids, volatile organic compounds (VOCs), polyphenols, anthocyanins, and carotenoids. These constituents have been linked to a broad spectrum of health-promoting effects, such as antioxidant, anti-inflammatory, antidiabetic, anticancer, antimicrobial, and anti-aging activities [2,3].
Flavour and aroma are among the primary determining factors influencing consumer preference and fruit selection [4,5,6]. The main VOCs identified in tomato belong to different chemical families, such as ketones, alcohols, aldehydes, phenols, esters, heterocyclic compounds, and nitrogen-, oxygen-, and sulphur-containing compounds. Among these, alcohols contribute to the perception of fruit sweetness, aldehydes are largely responsible for the green and fresh aroma, ketones often impart fruity and floral notes, and esters, though present in lower concentrations, can also contribute pleasantly with fruity aromas [7,8,9].
Numerous extraction techniques have been applied to establish the volatile fingerprint of tomatoes, including solvent assisted flavour evaporation (SAFE) [10,11], purge and trap [11], liquid–liquid extraction (LLE), supercritical fluid extraction (SFE) [12], and stir bar sorptive extraction (SBSE) [11]. However, these traditional extraction methods have several limitations, such as requiring larger solvent volumes or sample amounts and being time and labour-intensive. Among these, solid-phase microextraction (SPME) has become the state-of-the-art sample preparation standard to extract and concentrate VOCs due to its simplicity, sensitivity, ease of use and clean-up, automation, rapidity, and elimination of organic solvent usage [13]. Li et al. [11] compared the efficiency of five extraction techniques to extract the flavour compounds from tomato fruits and observed that SPME and SAFE were the most suitable. SPME coupled with gas chromatography and mass spectroscopy (GC-MS) became a robust and efficient tool for the qualitative and quantitative analysis of aroma-related VOCs from various fruits, vegetables and by-products [13,14,15]. Several studies have demonstrated the effectiveness of the HS-SPME/GC-MS system by comparing the volatile fingerprint of different tomato varieties [16,17], assessing the impact of varying growing conditions [18,19], evaluating the effects of pre-storage temperature treatments [20], and investigating how cooking or the addition of specific ingredients alters the VOC composition [21].
This study aims to comprehensively establish the volatilomic fingerprint of six Solanum tomato varieties, including Roma, Kumato, Globe, and Vine tomatoes (S. lycopersicum L.), Cherry tomato (S. lycopersicum var. cerasiforme), and Tamarillo tomato (S. betaceum), using HS-SPME/GC-MS, with the innovative goal of identifying aroma-related biomarkers for varietal differentiation and demonstrating the potential of volatilomics as a suitable tool for food authenticity, quality control, and traceability.

2. Materials and Methods

2.1. Chemicals and Reagents

All chemicals and reagents used were of analytical grade. Sodium chloride (NaCl, 99.5%) and 3-octanol (internal standard (IS), 99%) were purchased from Sigma-Aldrich (St. Louis, MO, USA), whereas the alkane series (C8 to C20, 40 mg/L in n-hexane) was supplied by Fluka (Buchs, Switzerland). The SPME fibre coated with divinylbenzene/carboxen/polydimethylsiloxane (DVB/CAR/PDMS) (50/30 µm), SPME holder for manual sampling, and glass vials were purchased from Supelco (Bellefonte, PA, USA). Ultrapure water (18 MΩ cm) was provided by the Milli-Q water purification system (Millipore, Milford, MA, USA).

2.2. Tomato Samples

Six Solanum tomato varieties, including Roma, Kumato, Globe, and Vine tomatoes (S. lycopersicum L.), Cherry tomato (S. lycopersicum var. cerasiforme), and Tamarillo tomato (S. betaceum) were purchased from a commercial local in Madeira Island. For each variety, 10 biological replicates (individual tomatoes) were used to obtain a representative sample, considering the full physiological maturity, corresponding to the fully red-ripe stage, to reflect typical consumption conditions. Prior to processing, all pedicels and sepals (green parts) were carefully removed. Then, all tomatoes were washed with deionised water, manually cut, and homogenised together to produce one composite sample per variety, representative of the corresponding tomato type. This composite homogenate was then used for the subsequent extraction and analysis VOCs by HS-SPME/GC-MS.

2.3. Headspace Solid-Phase Microextraction

The SPME method used in this study was based on protocols previously developed in our laboratory [22]. For HS-SPME extraction, 1 g of fresh tomato was weighed, homogenised, and transferred to a 20 mL headspace vial. To the vial, 0.3 g of NaCl, 5 mL of H2O, 10 µL of 3-octanol (concentration of 16.4 µg/L in a 50:50% V/V water/ethanol solution) and a magnetic stirring bar (2 × 0.5 mm, 650 rpm) were added. The vials were then sealed with a PTFE-faced silicone septum, placed in a thermostatic bath, and the DVB/CAR/PDMS fibre was manually inserted into the vial’s headspace. The vials were incubated for 45 min at 50 °C with constant stirring. Then, the fibre was retracted and inserted into the GC injector port for 6 min at 250 °C. Each sample was analysed in triplicate (n = 3 technical replicates), ensuring reproducibility and reliability of the data. The results are expressed as the mean relative concentration (µg/kg) ± standard deviation of these measurements. Before each use, the SPME fibre was thermally conditioned at 270 °C for 30 min, following the manufacturer’s instructions, to ensure the absence of carryover analytes.

2.4. Gas Chromatography-Mass Spectrometry Conditions

The VOCs were separated by an Agilent Technologies 6890N gas chromatograph (Palo Alto, CA, USA), equipped with a SUPELCOWAX® 10 fused silica capillary column (60 m × 0.25 mm i.d. × 0.25 μm film thickness) provided by Supelco (Bellefonte, PA, USA). Helium (Helium N60, Air Liquid, Sines, Portugal) was used as the carrier gas at a flow rate of 1 mL/min. Under constant flow conditions, the column-head pressure dynamically adjusts with the oven temperature program, and the average initial pressure was approximately 13 psi. The injector temperature was set to 250 °C. The GC oven program was as follows: the initial temperature was set to 40 °C and held for 2 min, followed by an increase to 220 °C at a rate of 2.70 °C/min, and held for 5 min, resulting in a total GC run time of 73.67 min. Mass spectrometry analysis was performed using an Agilent Technologies 5973N quadrupole mass selective detector (Palo Alto, CA, USA), operating with electron impact (EI) ionisation at 70 eV. The source, quadrupole, and transfer line temperatures were set to 230 °C, 250 °C, and 250 °C, respectively. The electron multiplier was calibrated via the auto-tune procedure, and mass spectra were acquired within the scanning range of 30–400 m/z at a rate of 1.9 spectra/s. The VOCs were tentatively identified by their retention times (RTs), linear retention indices (LRIs), and mass spectra with those of reference standards, as well as with data from the NIST MS 05 spectral library (Gaithersburg, MD, USA). LRI values were calculated using the van Den Dool and Kratz Equation [23]:
LRI   =   100   ×   [   n + t r x t r ( n ) t r n + 1 t r ( n ) ]
where tr(x) is the retention time of the VOC of interest, tr(n) and tr(n + 1) are the retention times of the n-alkanes eluting immediately before and after the VOC. The LRI values were also cross-referenced with those reported in the literature for similar stationary phases and validated through online databases such as The Pherobase and Flavornet [24,25]. Only VOCs with a match factor equal to or greater than 80% in the NIST library were considered for identification.
The concentration of each VOC was calculated by determining the ratio of its peak area to that of the 3-octanol (IS), multiplying this ratio by the known quantity of 3-octanol added to the sample. The results are expressed as micrograms per kilogram (µg/kg) of 3-octanol equivalents.

2.5. Statistical Analysis

Statistical analysis was performed using the MetaboAnalyst 6.0 web-based platform [26]. Raw GC-qMS data were pre-processed by removing VOCs with missing values, defined as VOCs not detected in a substantial number of samples, to improve data quality and ensure the robustness of multivariate analysis. Only VOCs present in most of the samples were retained for further analysis. Data normalisation was performed using cubic root transformation and autoscaling. The processed dataset was subjected to one-way analysis of variance (ANOVA), and significant differences among the tomato varieties were identified at p < 0.05 using Tukey’s post hoc test. Multivariate analyses, including Principal Component Analysis (PCA) and Partial Least Squares Discriminant Analysis (PLS-DA), were employed to explore group separations and detect discriminant VOCs. VOCs with a variable importance in projection (VIP) score ≥ 1, and those significantly different in univariate analysis, were considered potential biomarkers for differentiating tomato varieties. Model validation was performed using 10-fold cross-validation to assess classification performance, and the robustness of the PLS-DA model was further evaluated through permutation testing (n = 1000). Hierarchical Cluster Analysis (HCA) was conducted using the 15 most significant VOCs (as determined by ANOVA), applying Ward’s linkage method and Euclidean distance to reveal clustering patterns and relationships among the tomatoes.

3. Results

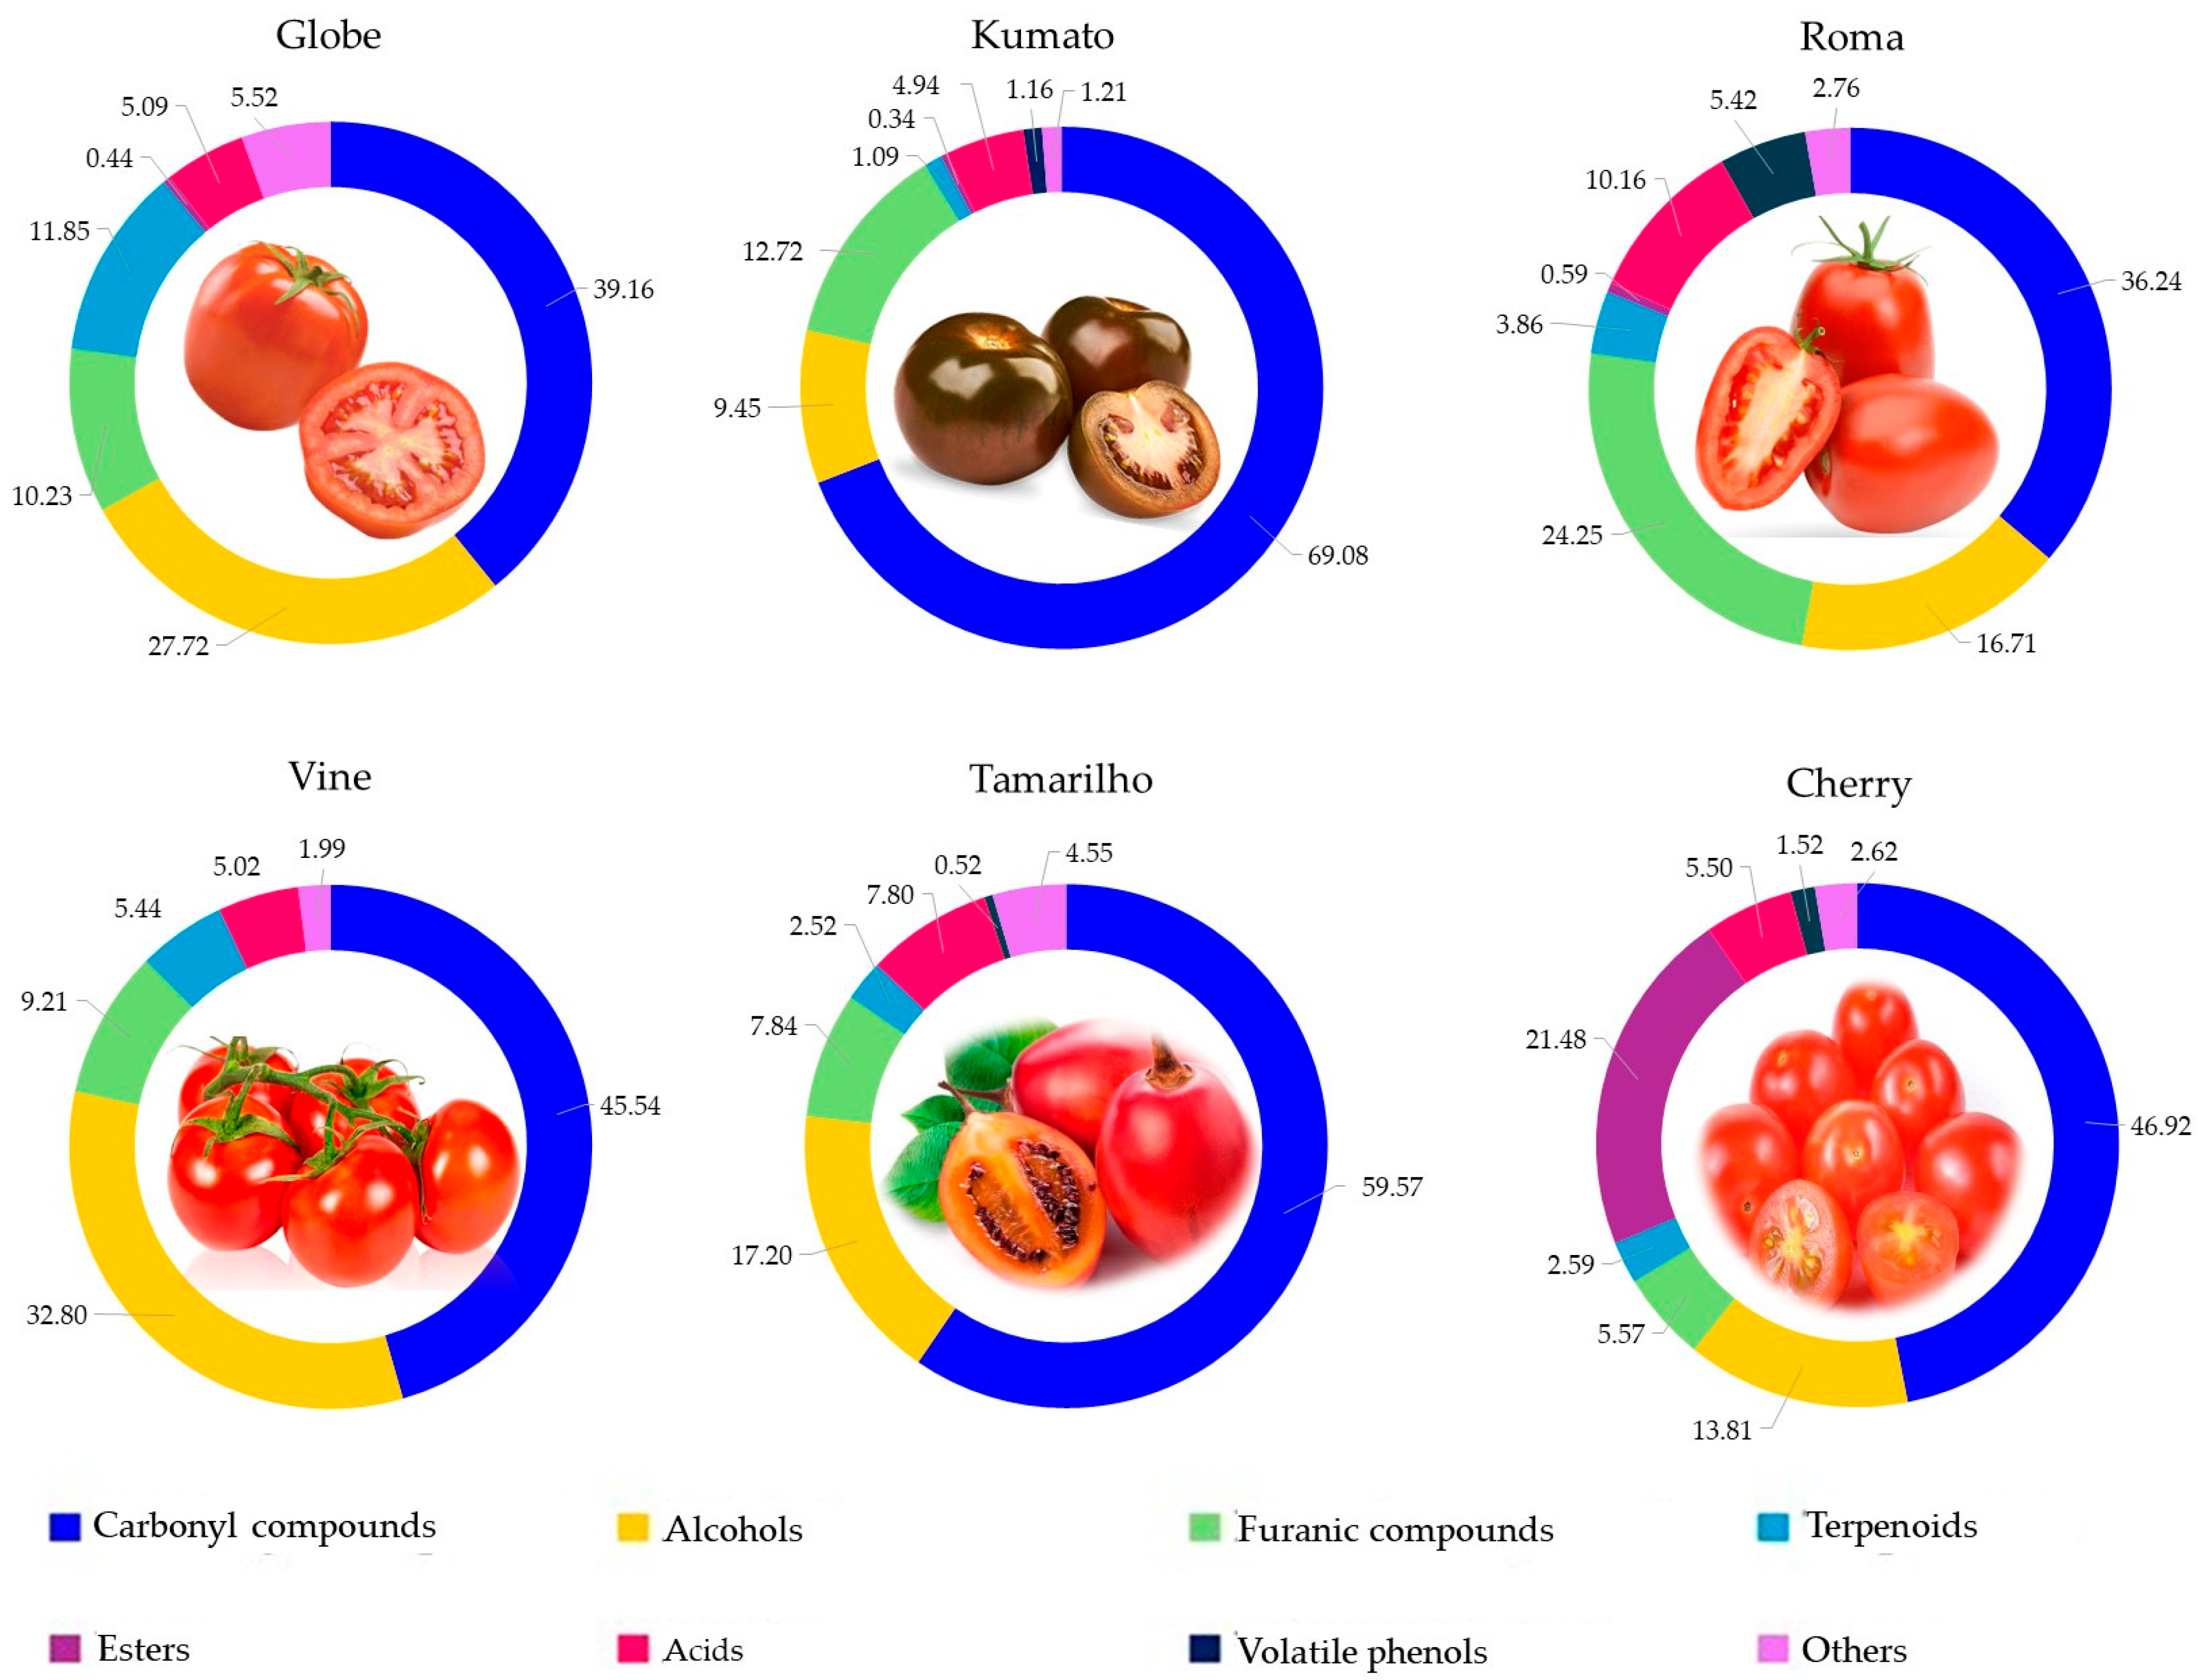
3.1. Volatilomic Fingerprint of the Tomato Varieties

A total of 55 VOCs were identified in the tomatoes using HS-SPME/GC-MS methodology, including 19 carbonyl compounds, 10 alcohols, 7 furanic compounds, 6 terpenoids, 4 acids, 3 esters, 2 volatile phenols, and 4 others (1 lactone, 2 hydrocarbons, 1 hydroxyketone) (Table 1, Figure S1). Of these 55 VOCs, only 28 were common to all tomato varieties, and other VOCs were exclusive to a specific tomato variety, such as 2-methyl-2-butenal in Kumato, nonanal in Tamarilho and ethyl 2-hydroxybenzoate in Cherry. Table 1 displays a detailed list of all VOCs found in the tomato varieties under analysis, along with the corresponding data, such as RTs, LRIs, and relative concentration (µg/kg).
Figure 1 displays each chemical family’s contribution to each tomato variety’s total volatilomic fingerprint. Carbonyl compounds were the main chemical family of VOCs, contributing on average 47.5% for S. lycopersicum L., 46.9% for S. lycopersicum var. cerasiforme (Cherry), and 59.6% for S. betaceum (Tamarilho). The second most representative chemical family for the total volatilomic fingerprint of each tomato variety was alcohols for Vine (33%), Tamarilho (17%) and Globe (28%), esters for Cherry (21%) and furanic compounds for Kumato (13%) and Roma (24%).
Kumata tomatoes seem to be the richest in carbonyl compounds, displaying 69% of total volatile fingerprint, followed by Tamarilho (60%), Cherry (47%), Vine (46%), Globe (39%) and Roma (36%). Within tomatoes, hexanal (representing 21% of the total carbonyl fraction) and (E)-2-hexenal (27.5%) were the most predominant carbonyl compounds identified. The C6 aldehydes are lipid-derived VOCs formed through the lipoxygenase pathway and are primarily responsible for the characteristic green and fresh-cut grass odour descriptors of tomatoes [27]. The highest relative concentration of hexanal was verified in Tamarilho (594 µg/kg), but its content was not significantly different to that observed in Cherry (526 µg/kg) and Kumato (531 µg/kg) tomatoes (p > 0.05). On the other hand, Kumato showed the highest relative concentration for (E)-2-hexenal (1419 µg/kg), and its content was significantly different (p < 0.05) from the other tomatoes investigated. No significant difference was observed between Tamarilho and Cherry tomatoes (p > 0.05), as well as Globe, Roma and Vine. According to Ramírez et al. [28], hexanal and (E)-2-hexenal are VOCs that are potentially correlated with the ripening stages of the tomatoes, therefore increasing their abundance with the increase in the maturity of the tomato. This finding is more evident within hexanal and (E)-2-hexenal quantities (in our results) and is further supported by the fact that the samples were all analysed in the ripe state. 6-Methyl-5-hepten-2-one, a ketone derived from carotenoid degradation, was also broadly distributed across samples, with the highest relative concentration in Vine tomatoes (474 µg/kg), being its relative concentration significantly different from the remaining tomatoes investigated (p < 0.05). Its presence reflects the interplay between ripening and carotenoid metabolism, conferring citrusy and floral nuances that enhance the sensory complexity of the fruit. In addition, unsaturated aldehydes such as (E)-2-octenal, and (E)-2-nonenal, known for their fatty and green, were VOCs present among the varieties, suggesting differences in oxidative processes or in ripeness levels. Other carbonyl compounds with minor relative concentration may contribute to the overall flavour due to their lower odour threshold, like benzaldehyde (sweet, almond-like), octanal (soapy, citrus), and 2,4-decadienal (seaweed) [9,29]. These carbonyl compounds could also be used as an indicator of varietal or post-harvest biochemical pathways.
Regarding the alcohols, 1-hexanol, (E)-2-hexen-1-ol and (Z)-3-hexen-1-ol were the most abundant, contributing on average 9.0%, 3.2% and 2.7% to the total volatile fingerprint, consistent with their recognised role in contributing to the characteristic green and fresh aroma of tomatoes. Vine showed the highest relative concentration of 1-hexanol (556 µg/kg), being significantly different from the remaining tomatoes investigated. Globe stood out for its high relative concentration of (E)-2-hexen-1-ol (270 µg/kg), which is linked to green and leaf sensory attributes. Phenylethyl alcohol detected only in Tamarilho and Cherry tomatoes, albeit in low relative concentration (contributing 0.3% to the total volatile fingerprint), can also contribute to floral odour notes, aligning with the exotic sensory character of Tamarilho. These findings agree with previous studies that highlight the predominance of C6 alcohols in tomato aroma and underscore the varietal influence on volatile fingerprint and potential sensory perception [9,29]. (Z)-3-Hexen-1-ol is also correlated with the ripening stages of the tomatoes in a previous study [28].
Roma and Kumato exhibited the highest total relative concentration of furanic compounds, 473 and 451 µg/kg, respectively, with no significant difference in furanic composition between these tomato varieties (p > 0.05). 5-Hydroxymethyl-2-furfural contributes 55% to the total furanic compounds fraction for these tomato varieties, showing significantly higher relative concentration in Roma (261 µg/kg) and Kumato (249 µg/kg) when compared to Globe (27 µg/kg) and Tamarilho (36 µg/kg), Table 1. In addition, this VOC was not detected in Vine and Cherry tomatoes, its absence may reflect varietal differences in sugar composition, enzymatic activity, or post-harvest handling conditions that influence the Maillard reaction. Roma showing a particularly elevated relative concentration of 2-furfural (75 µg/kg), a VOC with sweet and almond-like notes typically formed via thermal degradation pathways. Its content was not significantly different from Tamarilho (66 µg/kg, p > 0.05).
The ester contribution to the total volatile fingerprint among the six tomato varieties was limited in diversity but showed striking varietal specificity, particularly for Cherry tomatoes. Globe, Kumato, and Roma exhibited a low total relative concentration of esters (<12.2 µg/kg), with methyl 2-hydroxybenzoate being on average the most prominent ester in these tomato varieties without significant differences among them (p > 0.05). On the other hand, the Cherry tomato showed a significant impact in total ester relative concentration (1001 µg/kg), which represents ≈21% of the total volatile fingerprint. The highest relative concentration of esters in Cherry was associated with the presence of methyl 2-hydroxybenzoate (950 µg/kg), which displays 94.9% of the total esters fraction. Additionally, ethyl 2-hydroxybenzoate, a VOC with sweet and floral odours was only detected in Cherry tomatoes, which may be linked to a variety-specific metabolic pathways involving salicylic acid derivatives, often associated with stress responses and ripening. In contrast, Vine and Tamarilho showed no detectable ester content, reinforcing their simpler volatile fingerprint. As reported by Guan et al. [30], ester levels proved to be minimal when the tomatoes are mature, which acts accordingly to our findings as most tomato varieties have negligible ester content, except for Cherry. This does not disapprove the fact that Cherry was ripe when it was analysed, but rather it was in an earlier ripening stage compared to other samples, therefore having a higher ester quantity.
Acids were prevalent across all tomatoes but showed the highest contribution to total volatile fingerprint in Roma (10%), driven by acetic and hexanoic acids, which can contribute with a sour, pungent, and fatty odours. 2-Ethylhexanoic acid was only detected in Kumato and Roma tomatoes, yet their relative concentration was significantly different between each other, 42 and 6.7 µg/Kg, respectively.
Terpenoids were most abundant in Globe tomatoes, with a high relative concentration of geranyl acetone (230 µg/kg), representing 8.8% of the total volatile fingerprint, contributing with a fresh, floral, and citrus-like notes. On the other hand, Kumato exhibited very low terpenoid content, with geranyl acetone (39 µg/kg) being the only terpenoid detected in this tomato variety.
Volatile phenols, particularly 2-methoxyphenol and eugenol, were dominant in Roma, depicting 5.4% of the total fingerprint and conferring smoky and spicy notes. This chemical family was completely absent from Vine and Globe tomatoes.

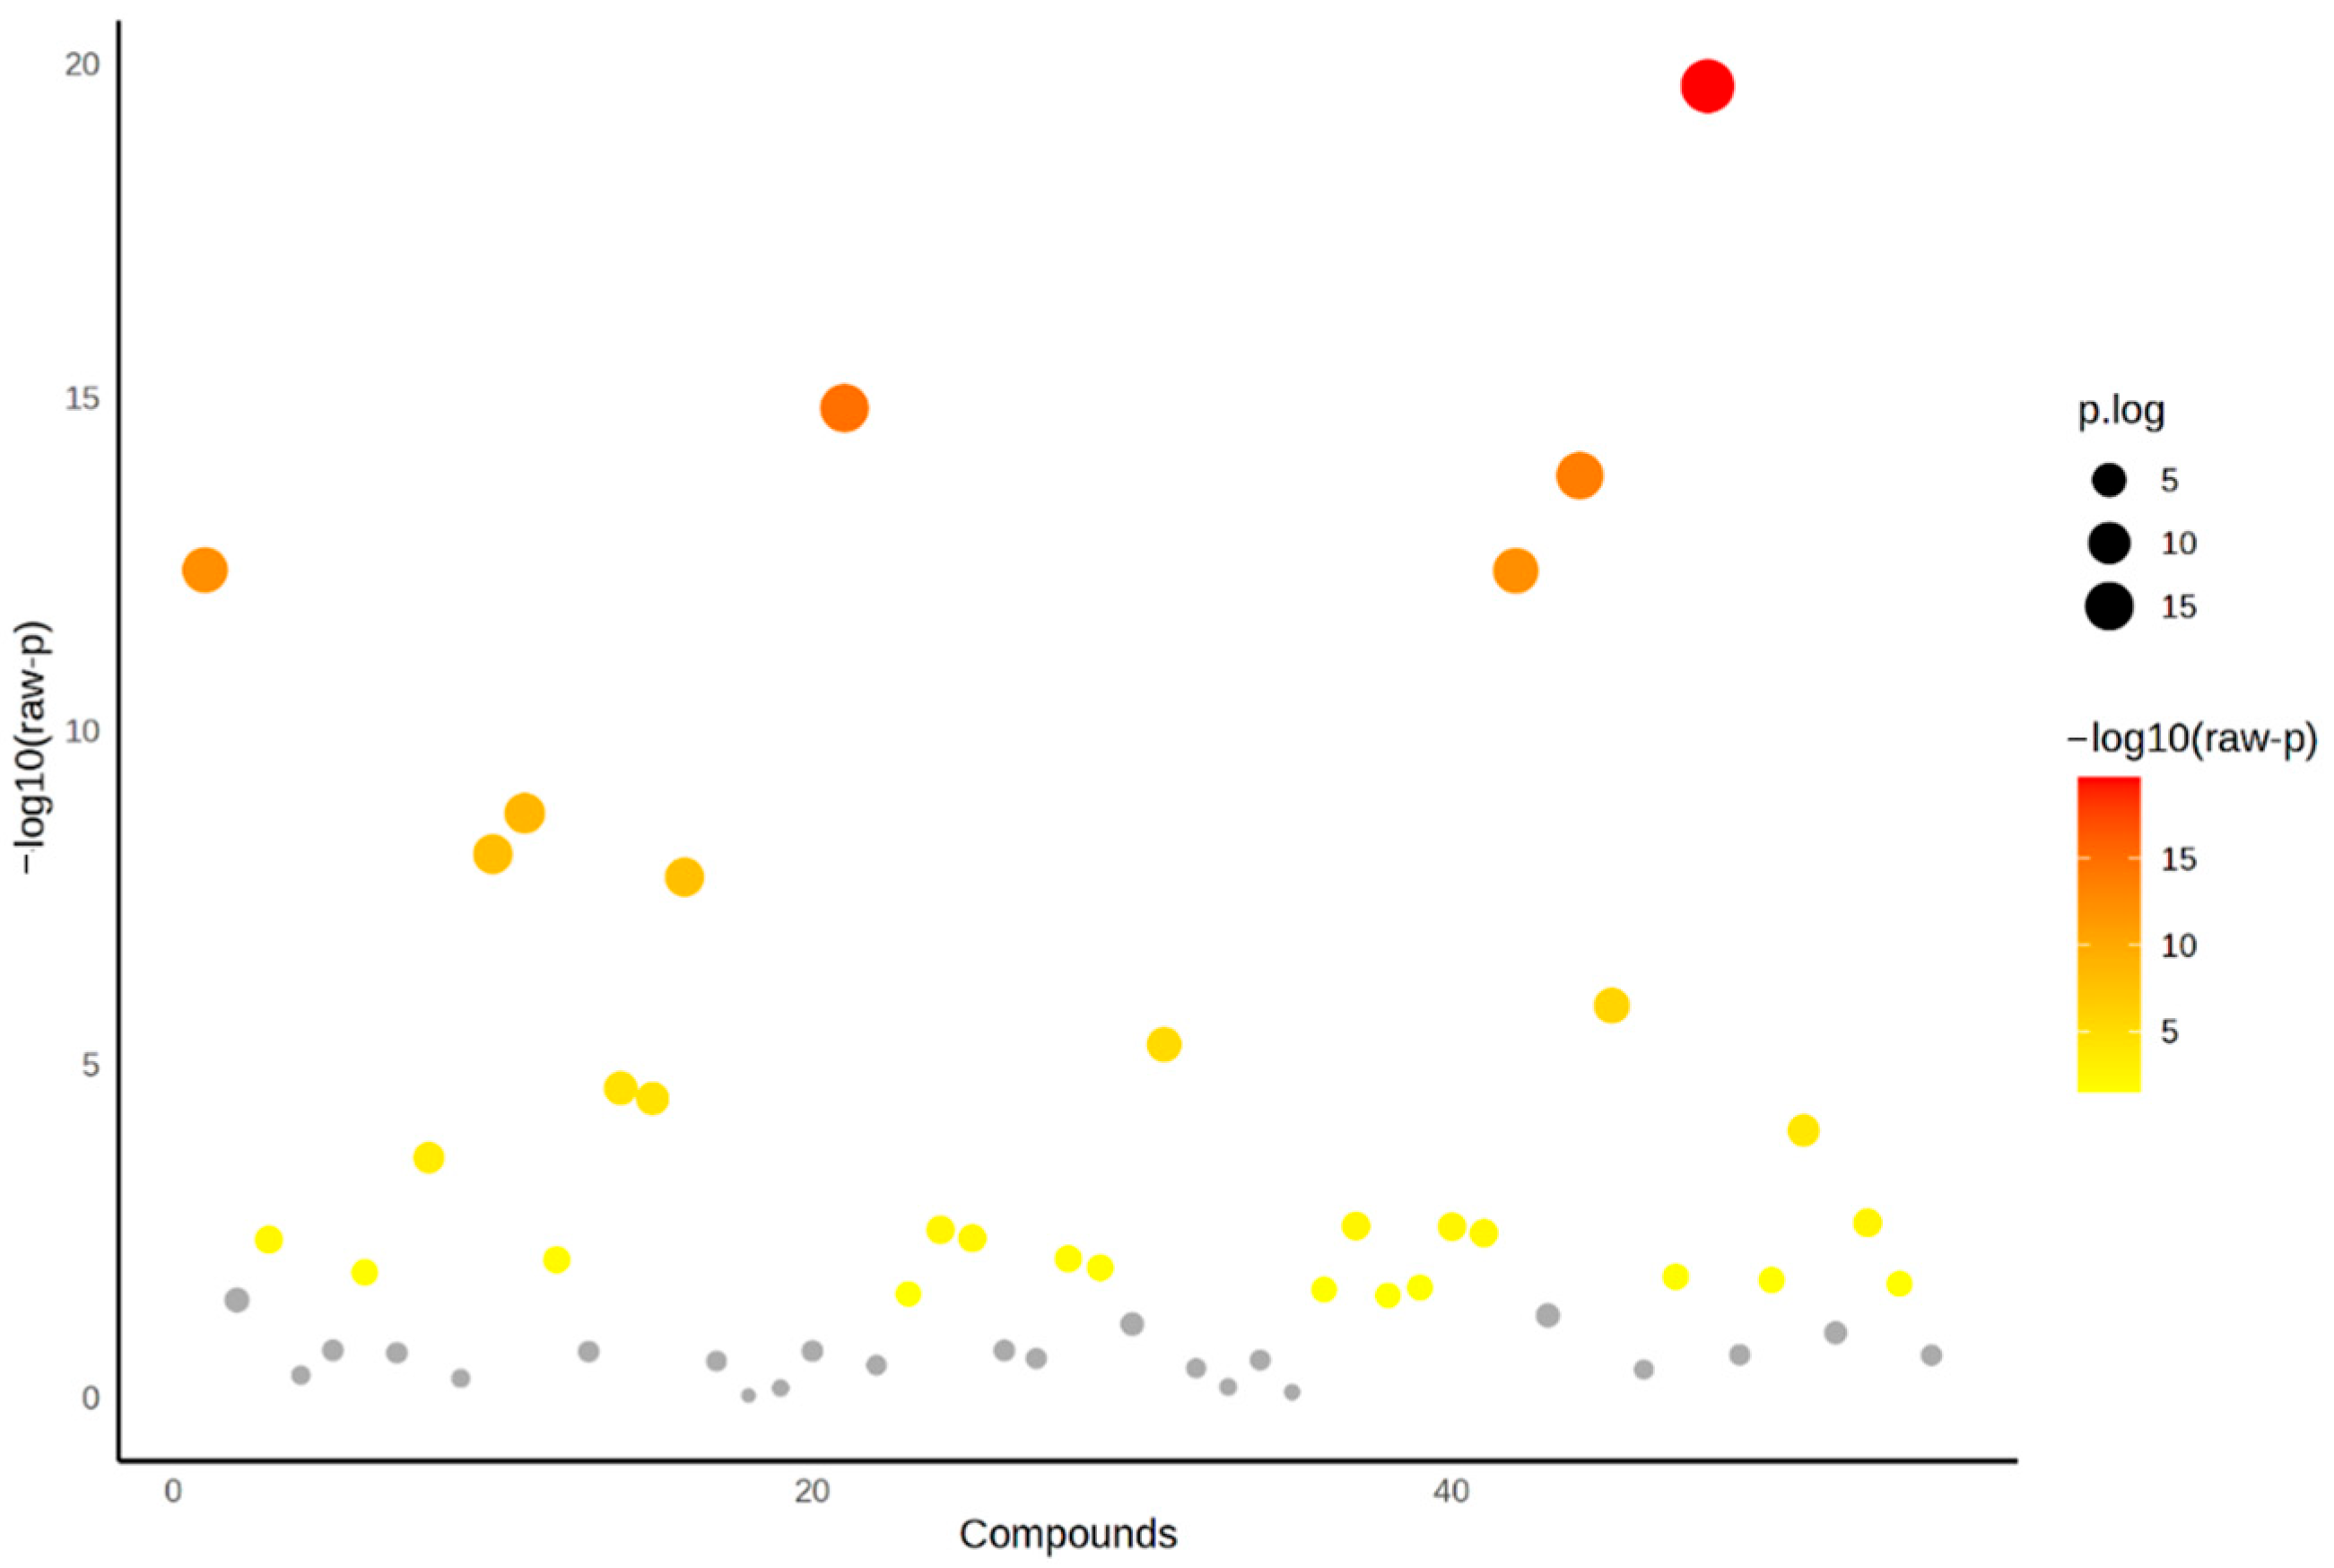
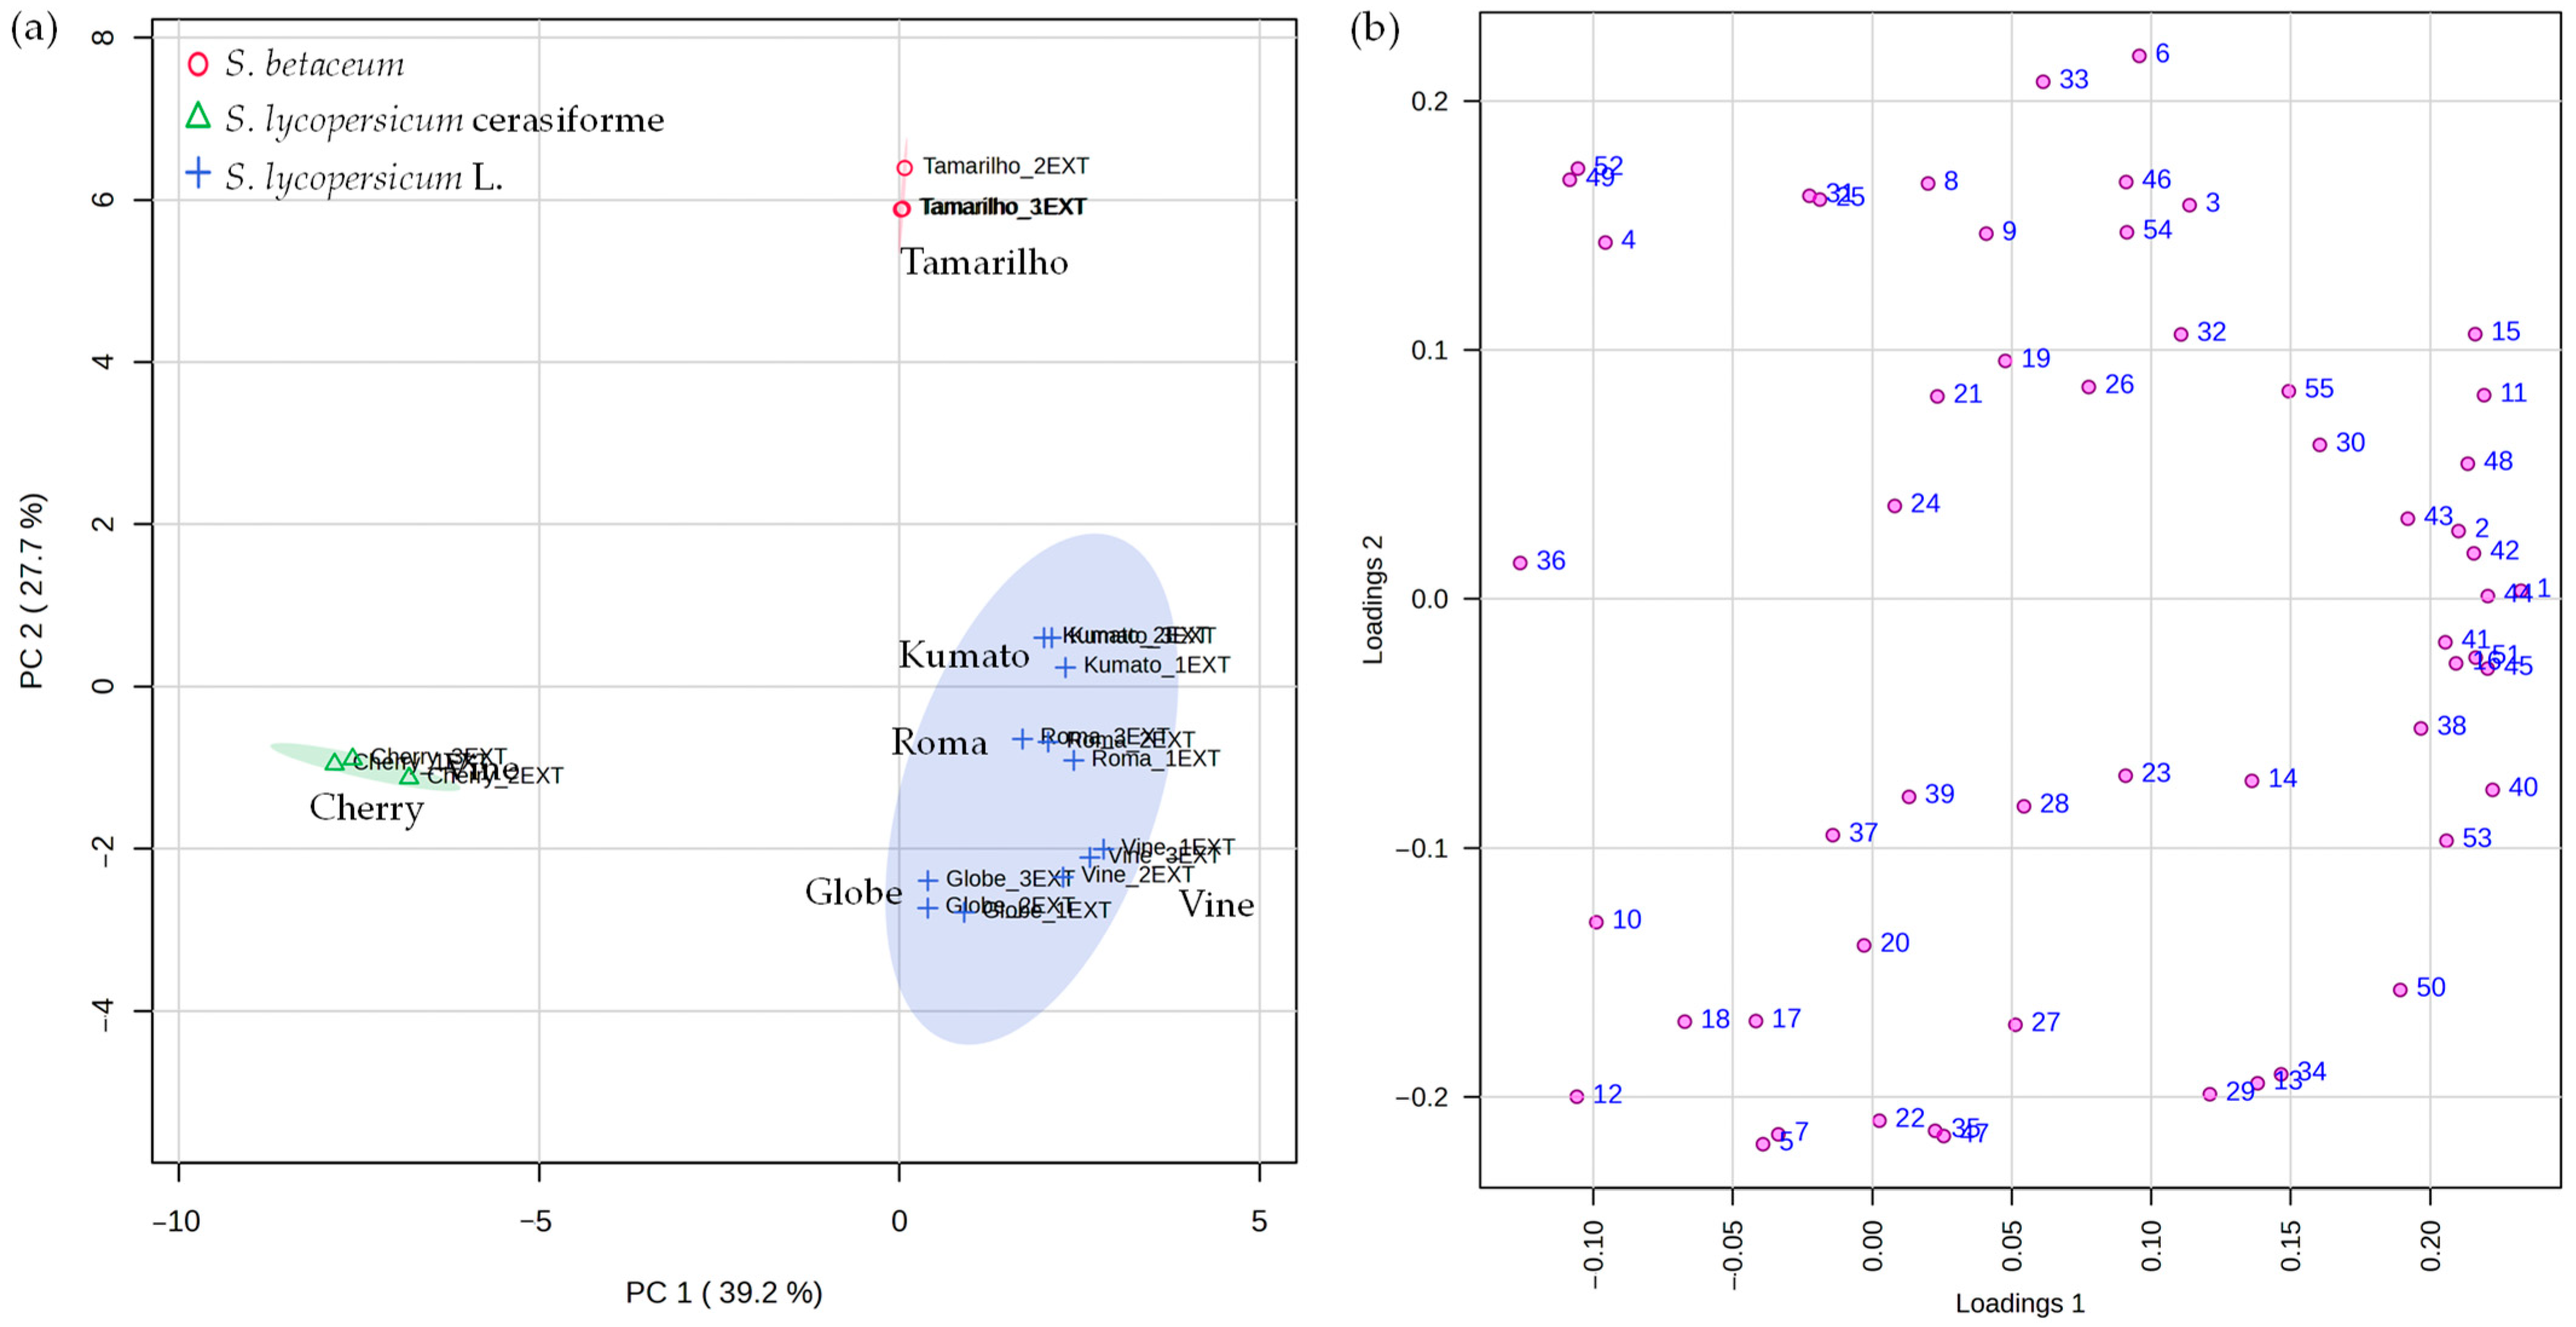
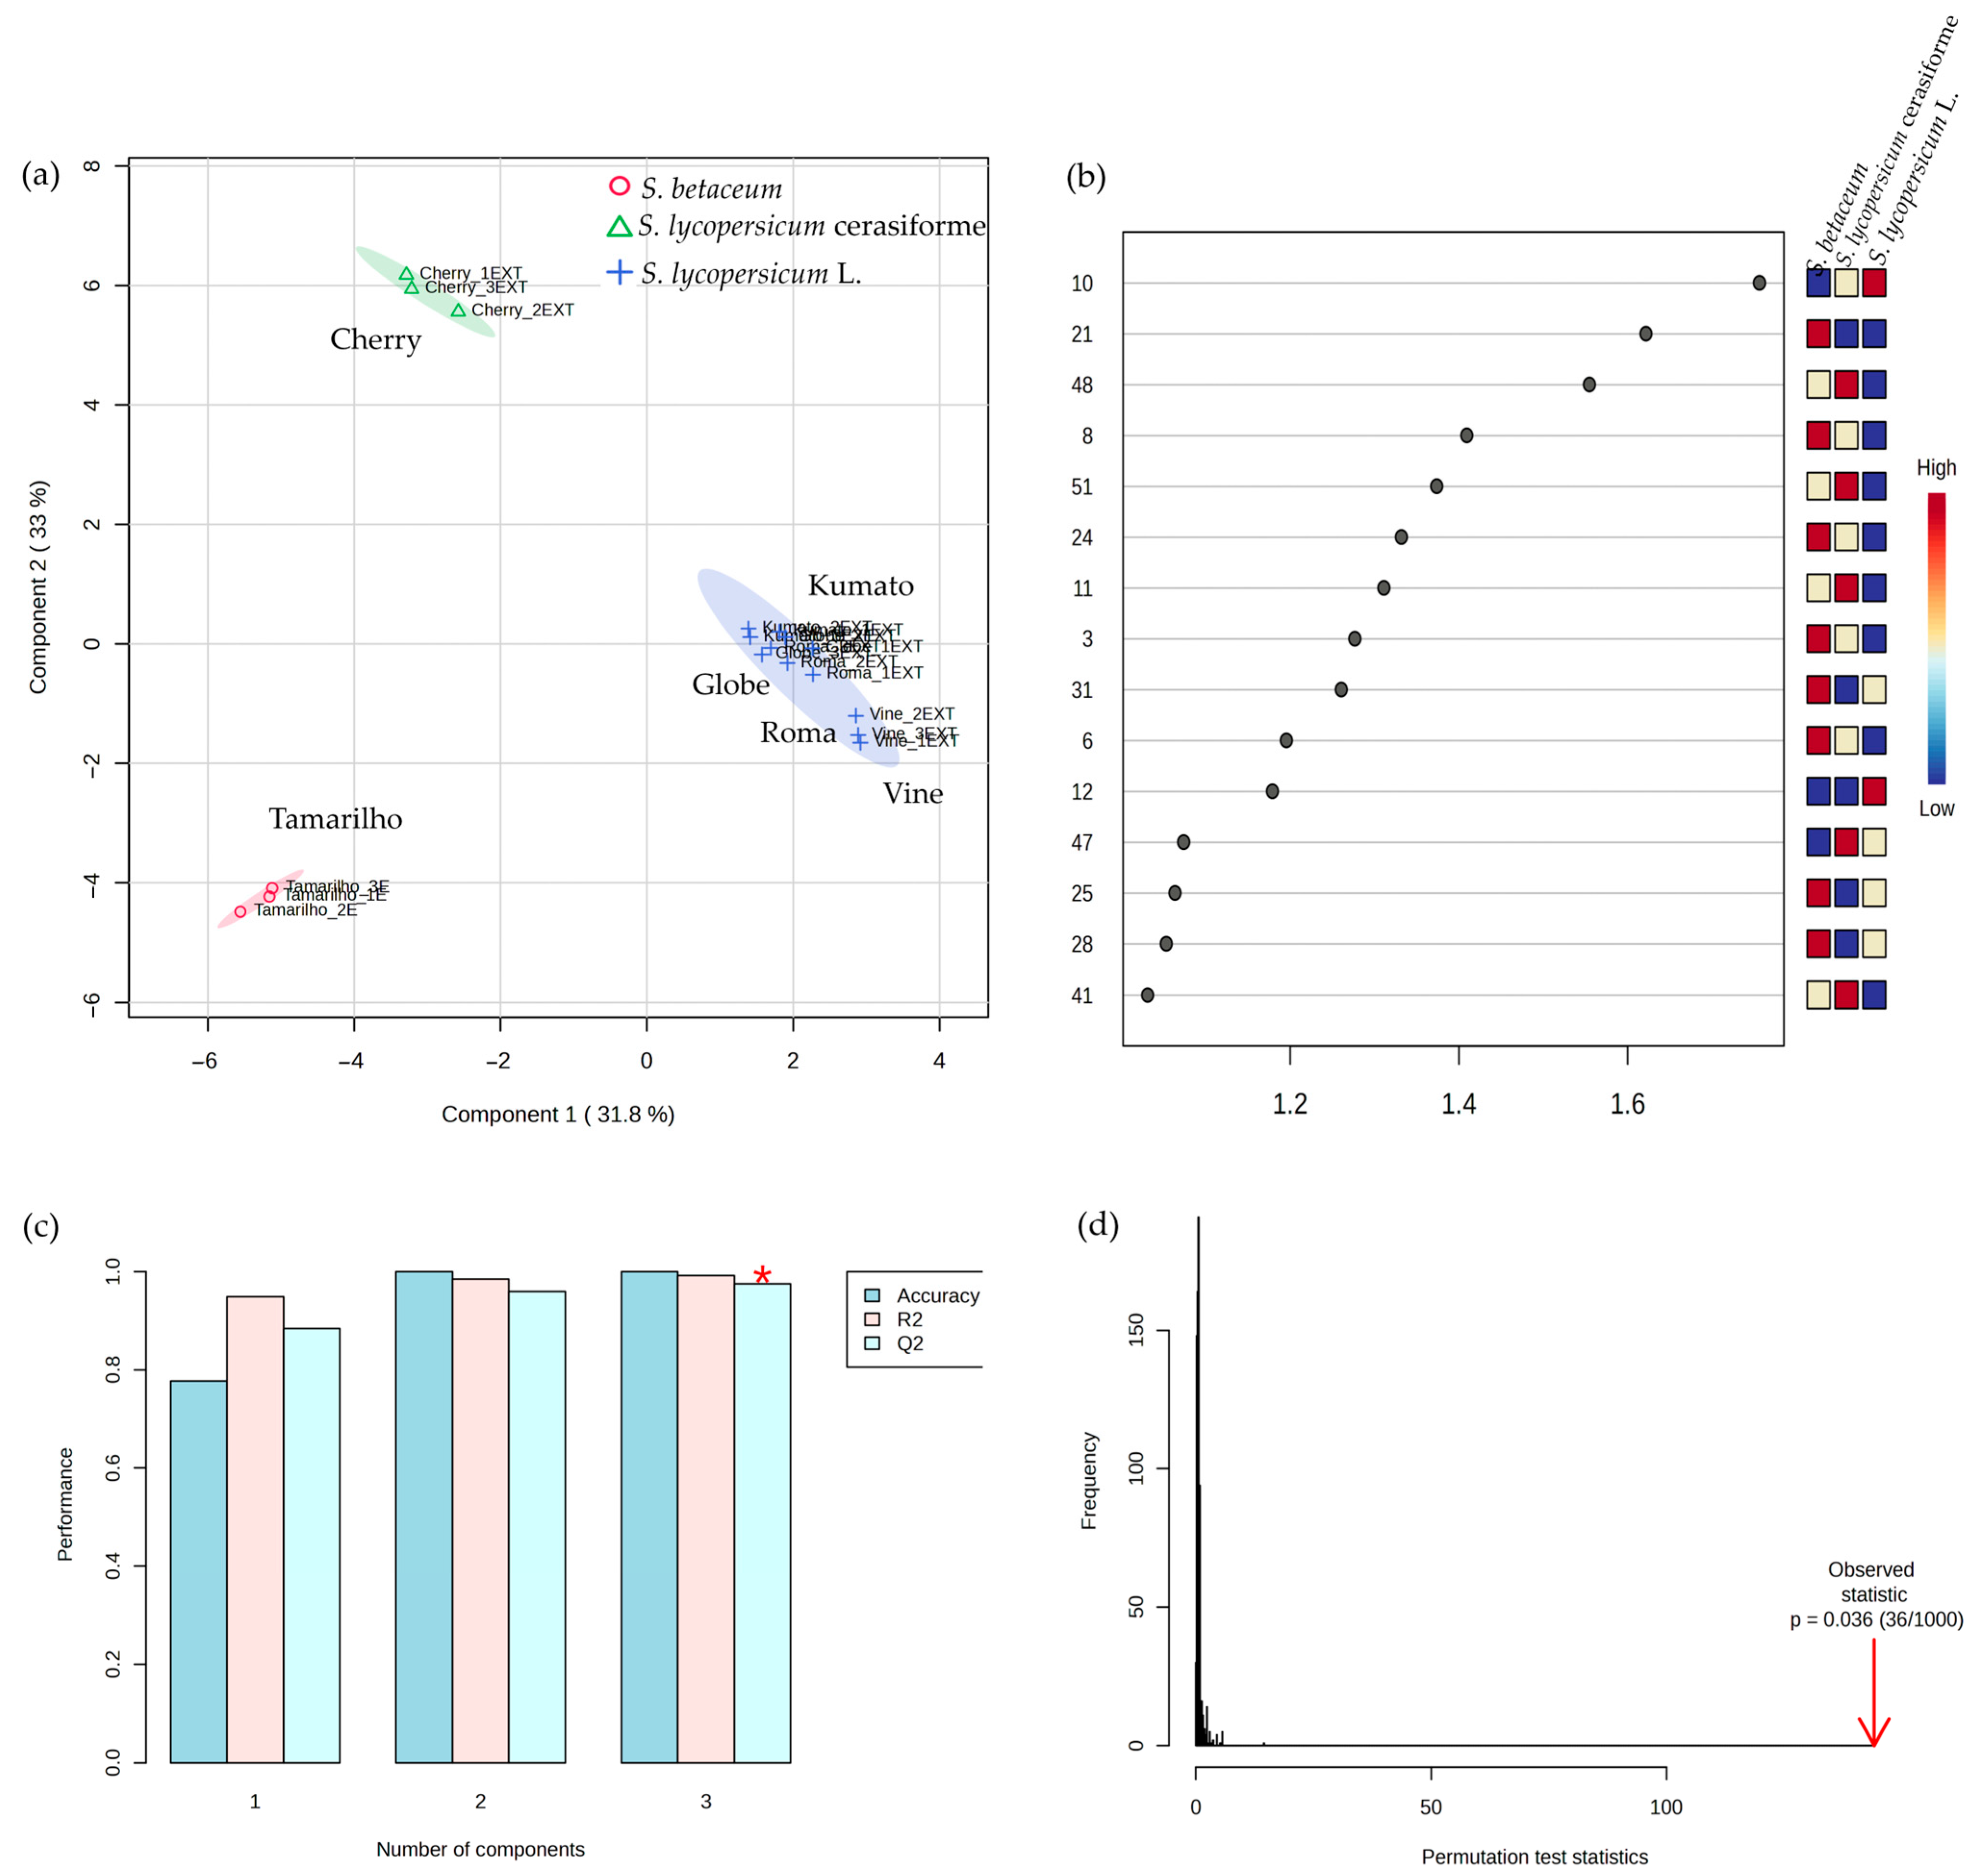
3.2. Statistical Multivariate Analysis

A total of 55 VOCs were identified in the tomatoes investigated and their GC peak area (GC-MS data set) was normalised using cubic root transformation and autoscaling. After that the one-way ANOVA, followed by post hoc Tukey’s test at p < 0.05 that was performed to select the VOCs that have statistically significant differences. As can be observed in Figure 2, 23 VOCs do not show significant differences among tomato varieties, hence why they were eliminated for subsequent statistical analysis.
Figure 3 shows the PCA score plot (a) and PCA loading plot (b), which visually displays the differences and similarities between the volatilomic fingerprint of the tomato varieties, as well as the distribution of VOCs in the four quadrants of the graph. The variance of the first principal component (PC1) was 39.2%, while the second (PC2) was 27.7%, so the two components account 66.9% of total data variability, suggesting differentiation among the samples investigated. From the tomatoes analysed, aside from Cherry, were projected in PC1 positively, being mainly characterised by hexanal (#3), 1-hydroxy-2-propanone (#14), (E,Z)-2,4-decadienal (#41), 2-methoxyphenol (#46), β-damascenone (#50), octanoic acid (#53) and eugenol (#54). On the other hand, Cherry was projected in PC1’s negative quadrant and was characterised by 2-pentyl furan (#10), 3-octanone (#12) and 1-hexanol (#18). For PC2, Kumato and Tamarilho were projected in the positive quadrant, while the remaining tomatoes were projected in the negative quadrant.
The PLS-DA scatter plot data indicates that the samples were distributed on the first two principal components (PC1 and PC2), reflecting on a 64.8% total variance (PC1: 31.8%, PC2: 33%) (Figure 4a), effectively separating the tomato varieties. As can be observed in Figure 4b, 15 differently expressed VOCs presented VIP scores ≥ 1, namely 2-pentylfuran (#10), nonanal (#21), phenylethyl alcohol (#48), 3-methyl-1-butanol (#8), 2,5-furandicarboxaldehyde (#51), (E)-2-octenal (#24), 1-pentanol (#11), hexanal (#3), (E)-2-nonenal (#31), and heptanal (#6). These VOCs are considered to be the most relevant that discriminate and differentiate the tomato varieties, highlighting them as potential characteristic molecular biomarkers. The permutation test confirms the statistical significance of the model (p = 0.036), validating that the separation observed is not due to random chance. The observed statistic (red arrow) lies well outside the distribution of permuted values, supporting the model’s robustness (Figure 4d).
HCA was also performed using the 15 most significant VOCs identified in the tomato varieties obtained by ANOVA. The dendrogram resulted from the heat map’s Euclidean distance calculation using Ward’s clustering method (Figure 5) offering a clear visual representation of the data set, that when combined with the previously conducted statistical analyses, enables a more thorough identification of the innate clustering patterns among tomato varieties. Tamarilho was the tomato variety with a more distinct volatilomic fingerprint since it does not cluster with the other varieties as seen in the dendrogram.

4. Conclusions

This study establishes the efficacy of headspace solid-phase microextraction coupled with gas chromatography–mass spectrometry (HS-SPME/GC-MS), in conjunction with multivariate statistical analyses, as a robust platform for comprehensive characterisation of the volatile profiles of tomato varieties. Across six Solanum varieties, a total of 55 volatile organic metabolites (VOCs) were identified, revealing pronounced inter-varietal differences in volatilomic signatures. While carbonyl compounds predominated across all varieties, varietal discrimination was principally driven by the presence and relative concentration of esters, furanic compounds, terpenoids, and volatile phenols. Specifically, cherry tomatoes exhibited a distinctive ester-rich profile, Roma and Kumato varieties were characterised by elevated levels of furanic compounds, and Globe tomatoes were distinguished by a predominance of geranyl acetone among terpenoids. Principal component analysis (PCA), partial least squares discriminant analysis (PLS-DA), and hierarchical cluster analysis (HCA) enabled clear varietal differentiation and identified key aroma-associated biomarkers, including hexanal, (E)-2-hexenal, 2-pentylfuran, phenylethyl alcohol, 3-methyl-1-butanol, (E)-2-octenal, (E)-2-nonenal, and heptanal. Collectively, these findings demonstrate that volatilomic profiling not only facilitates varietal identification but also holds significant potential for guiding cultivar development, optimising post-harvest handling, and enhancing quality control throughout the tomato value chain.

Supplementary Materials

The following supporting information can be downloaded at https://www.mdpi.com/article/10.3390/separations12080188/s1, Figure S1: Typical GC-MS profile of tomatoes investigated.

Author Contributions

G.J. formal analysis, investigation and the preparation of the original draft; T.A. formal analysis, investigation and preparation of the original draft; J.S.C.: formal analysis, investigation and writing, including re-viewing and editing; R.P.: contributed to conceptualisation, formal analysis, supervision, and writing, including both original draft preparation and reviewing and editing. All authors have read and agreed to the published version of the manuscript.

Funding

This research was supported by the Fundação para a Ciência e a Tecnologia (FCT) with Portuguese Government funds through the CQM Base Fund—UIDB/00674/2020 (DOI: 10.54499/UIDB/00674/2020) and Programmatic Fund—UIDP/00674/2020 (DOI: 10.54499/UIDP/00674/2020) and by ARDITI-Agência Regional para o Desenvolvimento da Inves-tigação Tecnologia e Inovação through funds from Região Autónoma da Madeira-Governo Regional.

Data Availability Statement

The original contributions presented in the study are included in the article and further inquiries can be directed to the corresponding author.

Conflicts of Interest

The authors declare no conflicts of interest.

Abbreviations

The following abbreviations are used in this manuscript:
ANOVAOne-way analysis of variance
GC-MSGas chromatography-mass spectrometry
HCAHierarchical cluster analysis
HS-SPMEHeadspace solid phase microextraction
LRILinear retention index
PCAPrincipal component analysis
PLS-DAPartial least squares discriminant analysis
RTRetention time
VIPVariable importance in projection
VOCsVolatile organic compounds

References

  1. Food and Agriculture Organization of the United Nations (FAO). The State of Food Security and Nutrition in the World 2023. Available online: https://www.fao.org/3/cc3017en/cc3017en.pdf (accessed on 5 June 2025).
  2. Ali, M.Y.; Sina, A.A.I.; Khandker, S.S.; Neesa, L.; Tanvir, E.M.; Kabir, A.; Khalil, M.I.; Gan, S.H. Nutritional Composition and Bioactive Compounds in Tomatoes and Their Impact on Human Health and Disease: A Review. Foods 2020, 10, 45. [Google Scholar] [CrossRef] [PubMed]
  3. Izzo, L.; Castaldo, L.; Lombardi, S.; Gaspari, A.; Grosso, M.; Ritieni, A. Bioaccessibility and Antioxidant Capacity of Bioactive Compounds From Various Typologies of Canned Tomatoes. Front. Nutr. 2022, 9, 849163. [Google Scholar] [CrossRef] [PubMed]
  4. Lu, Y.; Zhu, H. The Regulation of Nutrient and Flavor Metabolism in Tomato Fruit. Veg. Res. 2022, 2, 1–14. [Google Scholar] [CrossRef]
  5. Pott, D.M.; Osorio, S.; Vallarino, J.G. From Central to Specialized Metabolism: An Overview of Some Secondary Compounds Derived From the Primary Metabolism for Their Role in Conferring Nutritional and Organoleptic Characteristics to Fruit. Front. Plant Sci. 2019, 10, 835. [Google Scholar] [CrossRef] [PubMed]
  6. Cortina, P.R.; Santiago, A.N.; Sance, M.M.; Peralta, I.E.; Carrari, F.; Asis, R. Neuronal Network Analyses Reveal Novel Associations between Volatile Organic Compounds and Sensory Properties of Tomato Fruits. Metabolomics 2018, 14, 57. [Google Scholar] [CrossRef] [PubMed]
  7. Engelberth, J.; Engelberth, M. Variability in the Capacity to Produce Damage-Induced Aldehyde Green Leaf Volatiles among Different Plant Species Provides Novel Insights into Biosynthetic Diversity. Plants 2020, 9, 213. [Google Scholar] [CrossRef] [PubMed]
  8. Guan, S.; Liu, C.; Yao, Z.; Wan, H.; Ruan, M.; Wang, R.; Ye, Q.; Li, Z.; Zhou, G.; Cheng, Y. Detection and Analysis of VOCs in Cherry Tomato Based on GC-MS and GC×GC-TOF MS Techniques. Foods 2024, 13, 1279. [Google Scholar] [CrossRef] [PubMed]
  9. Zhang, J.; Liu, S.; Zhu, X.; Chang, Y.; Wang, C.; Ma, N.; Wang, J.; Zhang, X.; Lyu, J.; Xie, J. A Comprehensive Evaluation of Tomato Fruit Quality and Identification of Volatile Compounds. Plants 2023, 12, 2947. [Google Scholar] [CrossRef] [PubMed]
  10. Li, X.; Zeng, X.; Song, H.; Xi, Y.; Li, Y.; Hui, B.; Li, H.; Li, J. Characterization of the Aroma Profiles of Cold and Hot Break Tomato Pastes by GC-O-MS, GC × GC-O-TOF-MS, and GC-IMS. Food Chem. 2023, 405, 134823. [Google Scholar] [CrossRef] [PubMed]
  11. Li, J.; Fu, Y.; Bao, X.; Li, H.; Zuo, J.; Zhang, M.; Wang, J. Comparison and Analysis of Tomato Flavor Compounds Using Different Extraction Methods. J. Food Meas. Charact. 2020, 14, 465–475. [Google Scholar] [CrossRef]
  12. Aniceto, J.P.S.; Rodrigues, V.H.; Portugal, I.; Silva, C.M. Valorization of Tomato Residues by Supercritical Fluid Extraction. Processes 2021, 10, 28. [Google Scholar] [CrossRef]
  13. Pateraki, A.; Psillakis, E. Vacuum-Assisted Headspace Solid Phase Microextraction for Monitoring Ripening-Induced Changes in Tomato Volatile Profile. J. Chromatogr. A 2025, 1740, 465556. [Google Scholar] [CrossRef] [PubMed]
  14. Ballard, R.K.; Benyo, A.; Ren, R.; Nguyen, J.; Nguyen, J.; Zieber, E.; Gullickson, G.; Kim, H.J. Assessing Tomato Flavors Chemically: Identification of Aroma Volatiles from Heirloom and Commercial Tomatoes Using Solid-Phase Microextraction and GC-MS. J. Chem. Educ. 2023, 100, 1263–1269. [Google Scholar] [CrossRef]
  15. Song, X.; Dai, F.; Yao, J.; Li, Z.; Huang, Z.; Liu, H.; Zhu, Z. Characterization of the Volatile Profile of Feijoa (Acca Sellowiana) Fruit at Different Ripening Stages by HS-SPME-GC/MS. LWT 2023, 184, 115011. [Google Scholar] [CrossRef]
  16. Figueira, J.; Câmara, H.; Pereira, J.; Câmara, J.S. Evaluation of Volatile Metabolites as Markers in Lycopersicon Esculentum L. Cultivars Discrimination by Multivariate Analysis of Headspace Solid Phase Microextraction and Mass Spectrometry Data. Food Chem. 2014, 145, 653–663. [Google Scholar] [CrossRef] [PubMed]
  17. Li, J.; Di, T.; Bai, J. Distribution of Volatile Compounds in Different Fruit Structures in Four Tomato Cultivars. Molecules 2019, 24, 2594. [Google Scholar] [CrossRef] [PubMed]
  18. Lee, J.H.J.; Jayaprakasha, G.K.; Avila, C.A.; Crosby, K.M.; Patil, B.S. Metabolomic Studies of Volatiles from Tomatoes Grown in Net-House and Open-Field Conditions. Food Chem. 2019, 275, 282–291. [Google Scholar] [CrossRef] [PubMed]
  19. Lee, J.H.J.; Jayaprakasha, G.K.; Rush, C.M.; Crosby, K.M.; Patil, B.S. Production System Influences Volatile Biomarkers in Tomato. Metabolomics 2018, 14, 99. [Google Scholar] [CrossRef] [PubMed]
  20. Wang, L.; Baldwin, E.; Luo, W.; Zhao, W.; Brecht, J.; Bai, J. Key Tomato Volatile Compounds during Postharvest Ripening in Response to Chilling and Pre-Chilling Heat Treatments. Postharvest Biol. Technol. 2019, 154, 11–20. [Google Scholar] [CrossRef]
  21. Sanahuja, A.B.; Gallego, S.L.D.P.; Pérez, S.E.M.; García, A.V.; Moya, M.S.P. Influence of Cooking and Ingredients on the Antioxidant Activity, Phenolic Content and Volatile Profile of Different Variants of the Mediterranean Typical Tomato Sofrito. Antioxidants 2019, 8, 551. [Google Scholar] [CrossRef] [PubMed]
  22. Abreu, T.; Jasmins, G.; Bettencourt, C.; Teixeira, J.; Câmara, J.S.; Perestrelo, R. Tracing the Volatilomic Fingerprint of Grape Pomace as a Powerful Approach for Its Valorization. Curr. Res. Food Sci. 2023, 7, 100608. [Google Scholar] [CrossRef] [PubMed]
  23. van Den Dool, H.; Kratz, P.D. A Generalization of the Retention Index System Including Linear Temperature Programmed Gas—Liquid Partition Chromatography. J. Chromatogr. A 1963, 11, 463–471. [Google Scholar] [CrossRef] [PubMed]
  24. El-Sayed, A.M. The Pherobase: Database of Insect Pheromones and Semiochemicals. Available online: http://www.pherobase.com (accessed on 30 May 2025).
  25. Acree, T.E.; Arn, H. Flavornet. Available online: https://www.flavornet.org/d_kovats_db5.html (accessed on 15 June 2025).
  26. Pang, Z.; Chong, J.; Zhou, G.; de Lima Morais, D.A.; Chang, L.; Barrette, M.; Gauthier, C.; Jacques, P.É.; Li, S.; Xia, J. MetaboAnalyst 5.0: Narrowing the Gap between Raw Spectra and Functional Insights. Nucleic Acids Res. 2021, 49, W388–W396. [Google Scholar] [CrossRef] [PubMed]
  27. Kaur, G.; Abugu, M.; Tieman, D. The Dissection of Tomato Flavor: Biochemistry, Genetics, and Omics. Front. Plant Sci. 2023, 14, 1144113. [Google Scholar] [CrossRef] [PubMed]
  28. Ramírez, M.Q.; Valdez, E.A.; Aguirre, N.C.; Duno, D.; Ocampo, G.T. Volatilomic Profile of the Tree Tomato (Solanum Betaceum Cav.) Pulp during Ripening and Senescence Using HS–SPME with GC–MS. LWT 2023, 186, 115213. [Google Scholar] [CrossRef]
  29. Cheng, G.; Chang, P.; Shen, Y.; Wu, L.; El-Sappah, A.H.; Zhang, F.; Liang, Y. Comparing the Flavor Characteristics of 71 Tomato (Solanum Lycopersicum) Accessions in Central Shaanxi. Front. Plant Sci. 2020, 11, 586834. [Google Scholar] [CrossRef] [PubMed]
  30. Guan, S.; Liu, C.; Ruan, M.; Wang, R.; Ye, Q.; Wan, H.; Zhou, G.; Guo, S.; Cheng, Y.; Yao, Z. Detection and Comparative Analysis of VOCs between Tomato and Pepper Based on GC×GC-TOFMS. Sci. Rep. 2025, 15, 6140. [Google Scholar] [CrossRef] [PubMed]
Figure 1. Contribution of each chemical family to the total volatilomic fingerprint of tomatoes investigated.
Separations 12 00188 g001
Figure 2. One-way analysis of variance (ANOVA) followed by post hoc Tukey’s test at p < 0.05. Grey—VOCs are not statistically significant among tomatoes investigated.
Separations 12 00188 g002
Figure 3. PCA of the volatilomic fingerprint of the tomato varieties (n = 3 for each data point): (a) score scatter plot and (b) loading weight plot. Consult Table 1 to see the numbers that correspond to the VOCs.
Separations 12 00188 g003
Figure 4. PLS-DA of the volatilomic fingerprint of the tomato varieties (n = 3 for each data point): (a) score scatter plot and (b) VIP scores of key features identified by PLS-DA, with coloured boxes indicating relative VOCs content across groups. (c) 10-fold cross-validation of PLS-DA performance using varying component numbers (* denotes best Q2 value). (d) PLS-DA model validated by 1000-permutation tests of GC-MS-derived VOCs from the tomato samples investigated. Consult Table 1 to see the numbers that correspond to the VOCs.
Separations 12 00188 g004
Figure 5. HCA and heatmap of the putative characteristic molecular biomarkers identified in tomato varieties. Consult Table 1 to see the numbers that correspond to the VOCs.
Separations 12 00188 g005
Table 1. Relative concentration (µg/kg) ± standard deviation of volatile organic metabolites identified in tomatoes by HS-SPME/GC-MS.
Peak nºRT (min) aLRIcal bLRIlit cVOCsChemical
Family
GlobeKumatoRomaVineTamarilhoCherry
114.969599563-PentanoneCarbonyl15 ± 2 a13 ± 1 a14.5 ± 0.1 a13 ± 1 a17.1 ± 0.3 a72 ± 8 b
216.71100110001-Penten-3-oneCarbonyl24 ± 3 a14.1 ± 0.4 b23 ± 2 a,c8 ± 1 b19 ± 1 b,c33 ± 5 a
319.3110581059HexanalCarbonyl171 ± 32 a531 ± 20 b138 ± 20 a134 ± 13 a594 ± 10 b526 ± 46 b
419.91107010762-Methyl-2-butenalCarbonyl-55 ± 4----
524.0811511155LimoneneTerpenoid13 ± 2 a--3.0 ± 0.3 b--
624.4611591160HeptanalCarbonyl-10 ± 1 a3.0 ± 0.3 b 11 ± 1 a9 ± 1 a
724.5511601177β-TerpineneTerpenoid11 ± 1 a--2.0 ± 0.2 b--
825.96118611843-Methyl-1-butanolAlcohol-29 ± 3 a--81 ± 1 b7 ± 1 c
926.4311941198(E)-2-HexenalCarbonyl284 ± 2 a1419 ± 141 b98 ± 16 a104 ± 5 a558 ± 65 c552 ± 45 c
1026.81120012032-Pentyl furanFuranic74 ± 8 a58 ± 3 b56 ± 8 b86 ± 10 a-37 ± 3 c
1127.74121912131-PentanolAlcohol16 ± 3 a23 ± 2 a16 ± 1 a12 ± 1 a45 ± 5 b89 ± 7 c
1228.19122812243-OctanoneCarbonyl23 ± 3 a-13 ± 1 b20 ± 1 a--
1329.7812581268OctanalCarbonyl28 ± 3 a6 ± 1 b11 ± 2 b,c13 ± 1 c10 ± 2 b,c21 ± 4 a
1430.75127612771-Hydroxy-2-propanoneCarbonyl39 ± 3 a40 ± 4 a11 ± 1 b35 ± 6 a10 ± 1 b106 ± 12 c
1531.4412881295(E)-2-Penten-1-olAlcohol7 ± 1 a17 ± 1 b23 ± 3 b-16 ± 2 b105 ± 8 c
1631.5712901287(Z)-2-HeptenalCarbonyl42 ± 8 a37 ± 3 a27 ± 5 a60 ± 5 a60 ± 11 a252 ± 34 b
1732.23130113186-Methyl-5-hepten-2-oneCarbonyl141 ± 7 a91 ± 9 b105 ± 16 a474 ± 58 c82 ± 13 b190 ± 16 a
1833.16132113261-HexanolAlcohol236 ± 20 a153 ± 18 a,b109 ± 19 b556 ± 43 c215 ± 22 a,b197 ± 17 a,b
1934.7513521357(Z)-3-Hexen-1-olAlcohol65 ± 12 a,b54 ± 8 a,b123 ± 17 c43 ± 5 a,b81 ± 4 a64 ± 6 a,b
2035.2213591355Methyl octanoateEster6.1 ± 0.4 a-1.3 ± 0.1b---
2135.2313611375NonanalCarbonyl----11 ± 1-
2235.6113691363(E)-2-Hexen-1-olAlcohol270 ± 3 a50 ± 9 b29 ± 3 b,c88 ± 14 d35 ± 2 b,c63 ± 12 d
2335.76137113782-IsobutylthiazoleFuranic32 ± 4 a44 ± 4 a6.7 ± 0.2 b78 ± 10 c35 ± 1 a105 ± 7 d
2436.8913921377(E)-2-OctenalCarbonyl49 ± 9 a83 ± 15 b54 ± 4 a,b148 ± 7 c205 ± 8 d106 ± 5 c
2537.9914151418Acetic acidAcid60 ± 10 a103 ± 20 a,b148 ± 20 b,c91 ± 7 a,b203 ± 31 c85 ± 15 a,b
2638.68143014262-FurfuralFuranic46 ± 4 a27 ± 2 a,b75 ± 13c14 ± 1 b66 ± 7 c36 ± 4 a,b
2739.55144914532-Ethyl-1-hexanolAlcohol28 ± 2 a-3.7 ± 0.3 b9 ± 1 c19 ± 1 d5.9 ± 0.2 b,c
2840.38146614561,2,3,5-Tetramethyl benzeneHydrocarbon50 ± 2 a-10 ± 1 b9.1 ± 0.3 b71 ± 11 c9 ± 1 b
2940.9314771504(E)-2-Hepten-1-olAlcohol33 ± 1 a--26 ± 4 b-42 ± 2 c
3041.6114911493BenzaldehydeCarbonyl39 ± 7 a43 ± 5 a,b14 ± 1 c7 ± 1 c25 ± 3 a,c54 ± 6 b
3142.2115131532(E)-2-NonenalCarbonyl-12 ± 1 a20 ± 2 a-93 ± 13 b-
3243.89154015395-Methyl-2-furfuralFuranic33 ± 5 a25 ± 3 a,b51 ± 3 c11 ± 0.5 b43 ± 6 a,c34 ± 6 a,b
3344.48155215482-Cyclopentene-1,4-dioneCarbonyl21 ± 2 a37 ± 4 b42 ± 2 b,c12 ± 1 a33 ± 3 b,c30 ± 4 a,b
3445.1615671587(E)-2-Octen-1-olAlcohol69 ± 13 a9 ± 1 b22.9 ± 0.2 b32 ± 3 c30 ± 2 b,c54 ± 9 a
3546.7115981604ButyrolactoneLactone32 ± 1 a8 ± 1 b14 ± 2 b,c30 ± 4 a23 ± 4 a,c18 ± 2 c
3647.32161316142-FuranmethanolFuranic34 ± 3 a44 ± 4 b7.8 ± 0.2 c16 ± 1 c28 ± 5 a6 ± 1 c
3748.6716441633(Z)-CitralTerpenoid14 ± 2 a--4 ± 0.3 b20 ± 1 c-
3848.941650 2-Hydroxy benzaldehydeCarbonyl23 ± 4 a-21 ± 3 a-3.4 ± 0.2 b39 ± 4 c
3950.8216931714(E)-CitralTerpenoid22 ± 4 a-18 ± 1 a11 ± 1 b35 ± 3 c5 ± 1 b
4051.5217101709NaphthaleneHydrocarbon27 ± 3 a-15 ± 2 a,b7 ± 1 b24 ± 1 a55 ± 9 c
4152.1917161696(E,Z)-2,4-DecadienalCarbonyl77 ± 5 a41 ± 7 b25 ± 2 c22 ± 2 c70 ± 3 a102 ± 8 d
4253.2317521753Methyl 2-hydroxybenzoateEster5.4 ± 0.4 a12 ± 1 a10± 1 a--950 ± 140 b
4354.3417781770(E,E)-2,4-DecadienalCarbonyl46 ± 4 a16 ± 2 b88 ± 2 c12 ± 1 b46 ± 3 a94 ± 15 c
4454.5517841791Ethyl 2-hydroxybenzoateEster-----50 ± 7
4555.1317971810Hexanoic acidAcid46 ± 5 a23 ± 1b38 ± 6 a,b17 ± 2 b17.4 ± 0.4 b133 ± 14 c
4655.78181218152-Methoxy phenolPhenol-18 ± 3a82 ± 11 b-16 ± 1 a41 ± 5 c
4755.9018151816Geranyl acetoneTerpenoid230 ± 20 a39 ± 1 b50 ± 6 b97 ± 2 c14 ± 1 b86 ± 8 c
4857.9318611862Phenylethyl alcoholAlcohol----10.7 ± 0.3 a17 ± 1 b
4959.12188719102-Ethylhexanoic acidAcid-42 ± 5 a6.7 ± 0.1 b---
5059.4918951891β-DamascenoneTerpenoid20 ± 2 a-8 ± 1 b10 ± 1 b9 ± 1 b30 ± 3 c
5160.61201820062,5-FurandicarboxaldehydeFuranic21 ± 2 a5 ± 1 b15 ± 3 a9 ± 1 b35 ± 5 c42 ± 3 c
5261.872051 5HMFFuranic27 ± 5 a249 ± 18 b261 ± 11 b-36 ± 2 a-
5363.2720872070Octanoic acidAcid26 ± 1 a6.0 ± 0.1 b4.9 ± 0.5 b10 ± 2 b22 ± 1 a39 ± 6 c
5467.2921372135EugenolPhenol-23 ± 4 a23 ± 4 a--29 ± 4 b
5570.62171-HydroxydihydromaltolCarbonyl35 ± 4 a35 ± 4 a16 ± 2 b-23 ± 2 c40 ± 2 a
a RT: Retention time; b Linear retention index relative n-alkanes (C8 to C20) on a SUPELCOWAX® 10 capillary column; c Linear retention index relative reported in the literature for equivalent capillary column [24,25]; Different letters within each line indicate statistically significant differences between groups (p < 0.05), as determined by one-way ANOVA followed by Tukey’s HSD post hoc test; -: not detected.
Disclaimer/Publisher’s Note: The statements, opinions and data contained in all publications are solely those of the individual author(s) and contributor(s) and not of MDPI and/or the editor(s). MDPI and/or the editor(s) disclaim responsibility for any injury to people or property resulting from any ideas, methods, instructions or products referred to in the content.

