Abstract
Background: Method quantification limits are typically determined by measuring variability at blank level only, without accounting for the uncertainties associated with the parameters of the calibration function applied. Methods: A method for the determination of artificial sweeteners and caffeine in soft drinks was validated. The effect of chosen regression function on quantification limits was assessed, considering both trueness and precision. Results: The validated method exhibited heteroscedasticity for all analytes, which is common in experimental methods. A linear response was observed within the working range for sweeteners, while a quadratic regression was required for caffeine. Due to the heteroscedasticity nature of the responses, weighted regressions were necessary to obtain the lowest method quantification limits, allowing for accurate (i.e., unbiased and precise) estimates at the lower end of the calibration range. Under weighted conditions, the regression equations obtained, with an upper range set at 600 mg·L−1, were as follows: y = 3.9 + 58.9x for acesulfame K; y = 0.8 + 185.1x for saccharin; y = 3.5 + 43.3x for aspartame, and y = −7 + 159x − 0.242x2 for caffeine. The method quantification limits determined using weighted regressions were 2 mg·L−1 for each analyte, whereas these limits increased to 20 mg·L−1 when non-weighted regressions were applied. Conclusions: The choice of regression function for transforming instrumental signals into analyte concentrations significantly affects the determination of quantification limits, owing to the inherent heteroscedasticity of analytical and bioanalytical calibrations. Weighted regressions are essential for producing accurate estimates at lower concentration levels. Applying weighted regression in the context of heteroscedastic calibrations can lead to quantification limits that are more than 10 times lower than unweighted approaches.
1. Introduction
Validation of assay methods is a fundamental requirement for laboratories performing quantitative analyses. It is defined as “the process of defining an analytical requirement, and confirming that the method under consideration has capabilities consistent with what the application requires” [1]. Validation involves demonstrating that the method can produce results that are both consistent and reproducible. Several parameters must be assessed during method validation, including accuracy (i.e., trueness and precision [2]), specificity, linearity, regression model, working range, method detection limit (MDL), method quantification limit (MQL), and method uncertainty.
Among these, the selection of the regression model and the calculation of method limits often exhibit the greatest discrepancies and variability in how they are determined. Furthermore, the measurement of uncertainty is frequently overlooked by research laboratories, despite being a mandatory requirement for laboratories seeking ISO/IEC 17025 accreditation [3].
In the case of the regression model, linear functions are the most commonly used, as many instrumental analytical techniques exhibit a linear response across a wide range. However, validation requires assessing whether the response is genuinely linear within the working range defined for the method. Once linearity is demonstrated, a linear regression function must be selected. Most laboratories apply ordinary least squares (OLS) regression without evaluating whether the response of the dependent variable is homoscedastic (i.e., constant variability across the calibration range) or heteroscedastic (i.e., non-equivalent variability).
It is important to note that OLS regression assumes that the absolute errors of the dependent variable (i.e., standard deviation, SD) are constant across the calibration range, an assumption of homoscedasticity. However, in analytical and bioanalytical calibrations, this assumption is rarely valid. More commonly, the absolute errors vary while the relative standard deviation (RSD) remains constant [4,5], indicating that these calibrations are typically heteroscedastic rather than homoscedastic.
Studies have shown that the use of OLS regression under heteroscedastic conditions leads to problems, particularly at low calibration levels. Under such conditions, OLS produces biased estimates of the intercept [6] and tends to overestimate variability at low concentrations by factors greater than 10 [7]. As a result, OLS fails to provide unbiased estimates at the lower end of the concentration range [5,8]. Therefore, when heteroscedasticity is confirmed, OLS is not appropriate for estimating low-level concentrations. Instead, weighted least squares (WLS) regression should be applied [8], as it does not assume equal variability of the dependent variable.
WLS regression has been shown to produce slope estimates equivalent to those obtained with OLS, but with more accurate and reliable estimates of the intercept and its associated uncertainty [4,9]. Consequently, while OLS may be suitable for obtaining unbiased estimates at intermediate and high concentration levels, it is inadequate at low levels. WLS regression, by contrast, yields unbiased estimates across the entire calibration range. This extends the usable working range of the validated method, particularly when trueness and precision are considered, and results in a lower MQL. Indeed, several studies have demonstrated that when both trueness and precision are taken into account, the choice of regression model may significantly affect the accurate estimation of MQL values [8,10,11,12].
Various approaches have been proposed for the determination of the MDL and MQL of analytical methods. For chromatographic methods, many laboratories rely on the signal-to-noise (S/N) ratio, as it offers a fast and simple procedure that does not require replicate analyses of blank samples. However, the S/N ratio is only appropriate for determining instrumental limits, not method limits, as it does not account for the variability of blank samples analyzed using the full method.
A more robust approach involves performing replicate measurements of blank samples using the validated method or fortified blank samples at levels near the expected limits when true blank samples do not produce a measurable signal. The SD of these measurements is then used as an estimate of the variability at blank level, denoted as SDblank [13,14,15]. The MDL and MQL are then defined as the concentration that produces signals k times the SDblank (typically, k = 3.3 for MDL and k = 10 for MQL). While this approach appropriately accounts for precision at limit levels, it has a critical limitation for estimating the MQL: it does not account for bias (i.e., trueness) [16]. As a result, there is a risk of either accepting a method with insufficient accuracy or rejecting a suitable one [12,17].
To address this issue, new approaches have been proposed that incorporate both precision and trueness into the estimation of the MQL, aligning with its definition as the lowest amount of an analyte that can be determined with acceptable accuracy [16,18,19]. Furthermore, the IUPAC recommends that variability at the quantification limit should not be based solely on blank-level variability. Instead, uncertainty propagation through the parameters of the regression function must also be considered [16,19,20].
In this study, we developed a new method using liquid chromatography for the quantification of caffeine and four of the most commonly used artificial sweeteners (acesulfame K, saccharin, aspartame, and cyclamate) in non-alcoholic beverages. There is significant interest in the determination of artificial sweeteners in foods and beverages due to their increasing use as low-calorie additives. However, their safety remains controversial. Some laboratory studies on animals suggest that artificial sweeteners may disrupt the balance of the gut microbiome, although findings in humans remain inconsistent [21,22].
Moreover, aspartame, one of the most widely used sweeteners, was classified in July 2023 as possible carcinogenic to humans (Group 2B) by the World Health Organization, the International Agency for Research on Cancer, and the Food and Agriculture Organization [23]. Although maximum permitted levels of these additives are regulated [24], manufacturers are currently only required to disclose the type of sweeteners used on product labels, not their actual concentrations.
The method developed in this study was validated, and the influence of the selected regression function was assessed in terms of (i) its impact on the trueness and precision of quantitative estimates in samples and (ii) its effect on the determination of the MQL. Concentrations of analytes in selected beverage samples were determined using different regression models, and the results were compared to demonstrate the significant effect of the regression function on the analytical outcomes.
2. Materials and Methods
2.1. Chemicals and Reagents
Acesulfame K (potassium 6-methyl-2,2-dioxo-2H-1,2,3-oxathiazin-4-olate), aspartame (methyl L-α-aspartyl-L-phenylalaninate, Asp-Phe methyl ester), saccharin (1J-1λ,2-benzothiazole-1,1,3(2H)-trione), cyclamate (sodium N-cyclohexylsulfamate), and caffeine (1,3,7-trimethylxanthine) were obtained from Sigma-Aldrich (Steinheim, Germany), each with a purity of ≥99%. Phosphoric acid (85%), potassium dihydrogen phosphate, and HPLC-grade acetonitrile (gradient grade, ≥99.9%) were also purchased from Sigma-Aldrich.
2.2. Standard Solutions
Individual stock standard solutions (c.a. 1000 mg·L−1, with a measured standard uncertainty u = 0.6%) were prepared in ultrapure milli·Q water (Millipore Ibérica, Barcelona, Spain; resistivity: 18.2 MΩ·cm−1) and stored at 4 °C. Working and intermediate solutions were prepared by appropriate dilution and mixing of stock solutions with Milli·Q water. The dilution procedures resulted in uncertainties (u) of <0.5%. Considering the uncertainties of the stock solutions and the subsequent dilutions, the measured uncertainty for all calibration standards was <0.8%, ensuring that the variability in the independent variable (concentration) remained smaller than that of the dependent variable (signal), which was consistently ≥1%.
2.3. HPLC Mobile Phase
The HPLC mobile phase consisted of a binary mixture of acetonitrile and a 10 mM phosphate buffer (pH = 2.4). The mobile phase was degassed and filtered with 0.45 µm filters before use.
2.4. Sample Preparation
Beverage samples were degassed using an ultrasonic bath to remove carbon dioxide, followed by dilution with Milli·Q water (1:2 dilution, u = 0.25%). All solutions, including samples and standards, were filtered through 0.45 µm cellulose acetate syringe filters prior to HPLC analysis.
2.5. Instrumentation
Chromatographic determinations were carried out using an Agilent 1260 Infinity II HPLC system (Agilent Technologies, Santa Clara, CA, USA) equipped with a UV diode array detector (1260 DAD HS, Agilent Technologies, Santa Clara, CA, USA) and a fluorescence detector (1260 FLD, Agilent Technologies, Santa Clara, CA, USA). A 20 µL injection volume was delivered via an autosampler (1260 Vialsampler, Agilent Technologies, Santa Clara, CA, USA).
Separations were performed using a binary gradient elution (Table 1) on a 20 cm × 0.46 cm i.d. column packed with 5 µm Kromasil 100-5-C18 silica (Teknokroma, Barcelona, Spain). This column has good recommended stability and performance within the pH range of 1.5 to 10. The mobile phase flow rate was set at 1.0 mL·min−1, and all chromatographic runs were conducted at 25 ± 0.5 °C.

Table 1.
HPLC binary gradient applied.
Additionally, saccharin was also detected using fluorescence (FL) detection with an excitation wavelength of 250 nm and an emission wavelength of 440 nm.
2.6. Regresion and Statistical Analyses
Statistical analyses were performed using SPSS for Windows, version 29.0.1.0 (SPSS Inc., Chicago, IL, USA). A significance level of p < 0.05 was considered statistically significant. Excel software was not used for regression analysis as it does not provide weighted regression calculations.
3. Results and Discussion
3.1. Chromatographic Separation Development
Previous studies have shown that reversed-phase HPLC with UV detection using a phosphate buffer as the mobile phase is suitable for the determination of aspartame and acesulfame K in soft drinks [25,26,27,28,29,30,31,32]. Many of these studies employed a mobile phase pH between 3.5 and 4.5, as aspartame decomposition in aqueous solutions is strongly pH dependent, especially at pH > 4.5, and occurs rapidly at pH ≥ 7 [25,28,33].
However, our preliminary experiments at pH = 3.5 revealed peak overlap when saccharin, cyclamate, and caffeine were included in the analyte mixture. This is consistent with findings by Jankulovsja et al. [32], who reported that using a phosphate buffer at a pH around 3.5 did not provide adequate resolution between acesulfame K and saccharin.
In our study, baseline separation of all target analytes—including common interferents—was achieved only by lowering the mobile phase pH to 2.4. These findings agree with Croitoru et al. [30], who found that saccharin and cyclamate eluted very closely and could only be baseline separated at pH < 2.5. Moreover, significant shifts in retention times were noted when the pH was decreased from 3.5 to 2.4, highlighting the importance of a buffered mobile phase to ensure retention time reproducibility. A 10 mM phosphate buffer at pH 2.4 was selected, as phosphate (pKa1 = 2.14) provides adequate buffering capacity at this pH. The column oven temperature was maintained at 25 ± 0.5 °C to ensure consistent chromatographic performance regardless of environmental conditions.
The gradient elution program (Table 1) enabled baseline separation of all target analytes and resolved several interferents observed during the analysis of preliminary soda samples (Figure 1). The capacity factor for the earliest eluting analyte, acesulfame K, was 1.6, sufficient to separate it from non-retained impurities commonly detected in samples.
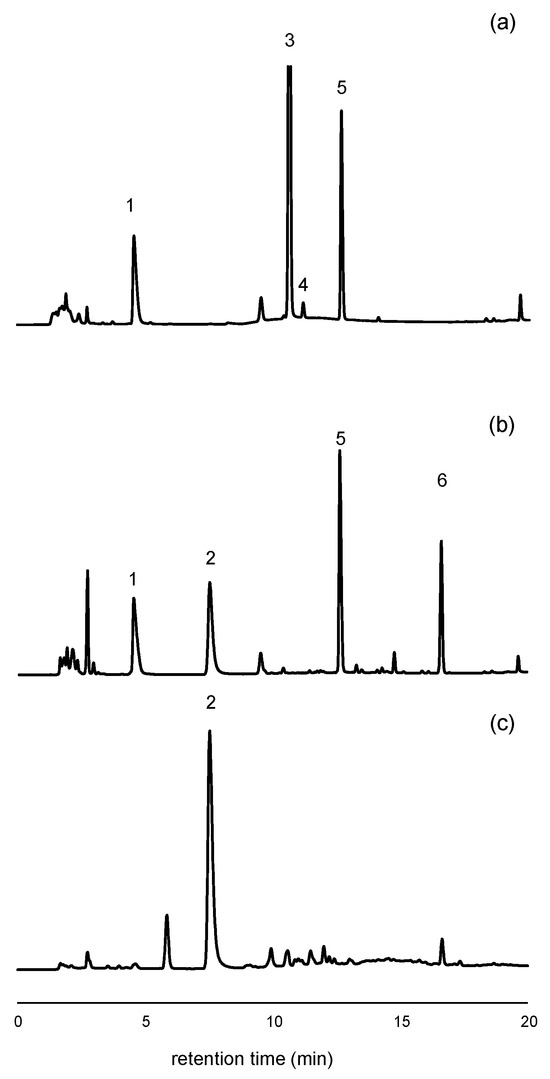
Figure 1.
Chromatograms obtained from the analysis of two soda samples with different sweetener compositions, as indicated on their product labels. (a) HPLC-UV chromatogram at 205 nm of a cola sample containing acesulfame K, aspartame, cyclamate, and caffeine; (b) HPLC-UV chromatogram at 205 nm of a flavored soda containing acesulfame K, aspartame, saccharin, and sorbate; (c) HPLC-FL chromatogram (excitation 250 nm, emission 440 nm) of the same sample as in (b). Peak assignments: #1: Acesulfame K, #2: Saccharin, #3: Caffeine, #4: Cyclamate, #5: Aspartame, #6: Sorbate.
A post-run conditioning time of 4 min was required between injections to ensure chromatographic reproducibility. As a result, the total run time for each chromatographic analysis was 37 min. Under these conditions, blank control samples injected at the beginning and end of each session, as well as between each of the six injections, consistently yielded clean chromatograms, confirming the absence of carryover.
After evaluating the UV spectra of the analytes in 10 mM phosphate at pH = 2.4, a wavelength of 227 nm was selected for acesulfame K, while 205 nm was chosen for saccharin, aspartame, and caffeine. Sorbate, a common preservative in flavored sodas, was not a target compound in this study, but the method enabled its qualitative detection at 205 nm (Figure 1b, peak #6 at 16.6 min). For saccharin, fluorescence detection was also employed to enhance selectivity, taking advantage of its intrinsic fluorescence. An excitation wavelength of 250 nm and an emission wavelength of 440 nm were used [34].
Cyclamate and sucralose are two other sweeteners commonly added to soft drinks in the European Union (EU). However, these compounds lack chromophores and exhibit poor sensitivity under both UV and FL detection. For cyclamate, UV detection below 210 nm is required to obtain measurable signals. In this study, quantification was feasible at 195 nm, although the sensitivity was low (slope = 0.276, with a standard error, SE = 0.008). Preliminary calibration experiments at 195 nm yielded a MQL of approximately 150 mg·L−1, which is insufficient for quantification of cyclamate in many samples. Nevertheless, given that the EU maximum permissible level for cyclamate is 250 mg·L−1 [24], it was still possible to detect its presence in certain samples (Figure 1a, peak #4). For more sensitive determination of cyclamate and sucralose, alternative detection techniques such as evaporative light scattering or mass spectrometry are recommended.
3.2. Validation of the Method
3.2.1. Assessment of Matrix Effects
To determine whether external calibration could be applied for the analysis of commercial sodas (i.e., to confirm the absence of matrix effects), a commercial soda sample that did not list sweeteners on its label was fortified with each sweetener at concentrations equivalent to their respective maximum regulated levels [24]. The fortified sample was then diluted to volume with water at three different ratios (1:2, 1:5, and 1:10). No matrix effects were observed at any of the dilution ratios tested. Recoveries for all analytes ranged from 98% to 101%, and statistical analysis (ANOVA, p > 0.05) confirmed that the final calculated concentrations were not significantly affected by the dilution ratio. However, the 1:10 dilution resulted in a saccharin concentration close to the MQL, suggesting that this level of dilution may hinder its detection in some samples. To confirm this, commercial soda samples known to contain saccharin were analyzed at both 1:2 and 1:10 dilutions. In many of these samples, the 1:10 dilution yielded significantly different results (p < 0.05), with saccharin falling below the MQL and not being detected.
Based on these findings, a 1:2 dilution with water was selected as the most appropriate, as it provided the minimum sample dilution while avoiding matrix effects and ensuring reliable detection of all target analytes.
3.2.2. Method Precision
The precision of the proposed method was evaluated as relative standard deviation (% RSD) at two levels: low (10 mg·L−1) and high (400 mg·L−1). As the validation was conducted in a single laboratory, only repeatability (RSDr, intra-day precision) and intermediate precision (inter-day precision) were assessed.
Two commercial beverage samples were selected for the study: a cola soda containing caffeine but no sweeteners and a flavored soda containing sweeteners but no caffeine. Each sample was fortified with the appropriate analytes (sweeteners for the cola soda and caffeine for the flavored soda). For each sample, six independent replicates were prepared, with three spiked at the low concentration level and three at the high level.
Each replicate was analyzed once per day over three consecutive days. A nested ANOVA was performed to evaluate both intra-day and inter-day variability [13,35]. The results (Table 2) showed repeatability values below 3% and intermediate precision values ≤5%. These values are considered acceptable, as they fall within the criteria defined by the Horwitz function and the AOAC Peer-Verified Methods Program, which permit intermediate precision values up to 5.3% at high concentration levels [36].
Table 2.
Precision figures (% RSD) for repeatability (RSDr, intra-day precision) and intermediate (inter-day precision) at two concentration levels (10 mg·L−1 and 10 mg·L−1). Results obtained from a nested ANOVA for fortified soda samples.
To further verify the method’s precision, independent replicates of four commercial soda samples (each replicate from a different store and production lot) were analyzed, one per day. The precision results (% RSD) obtained for these real samples ranged from 0.6% to 4.6%, falling within the confidence intervals established for intermediate precision in the validation study. These findings confirm the method’s robustness and applicability across various production batches and brands.
3.2.3. Linearity Assessment
Linear regression models are the most commonly applied models in UV-based analytical methods. However, they are often used without a thorough evaluation of linearity across the intended working range. It is important to note that in some cases, the analytical response may be non-linear or exhibit a limited linear range. Such behavior is well-documented in techniques like atomic absorption spectrometry [37] and immunoassays [38]. Therefore, a rigorous assessment of linearity over the entire working range is essential for reliable method validation.
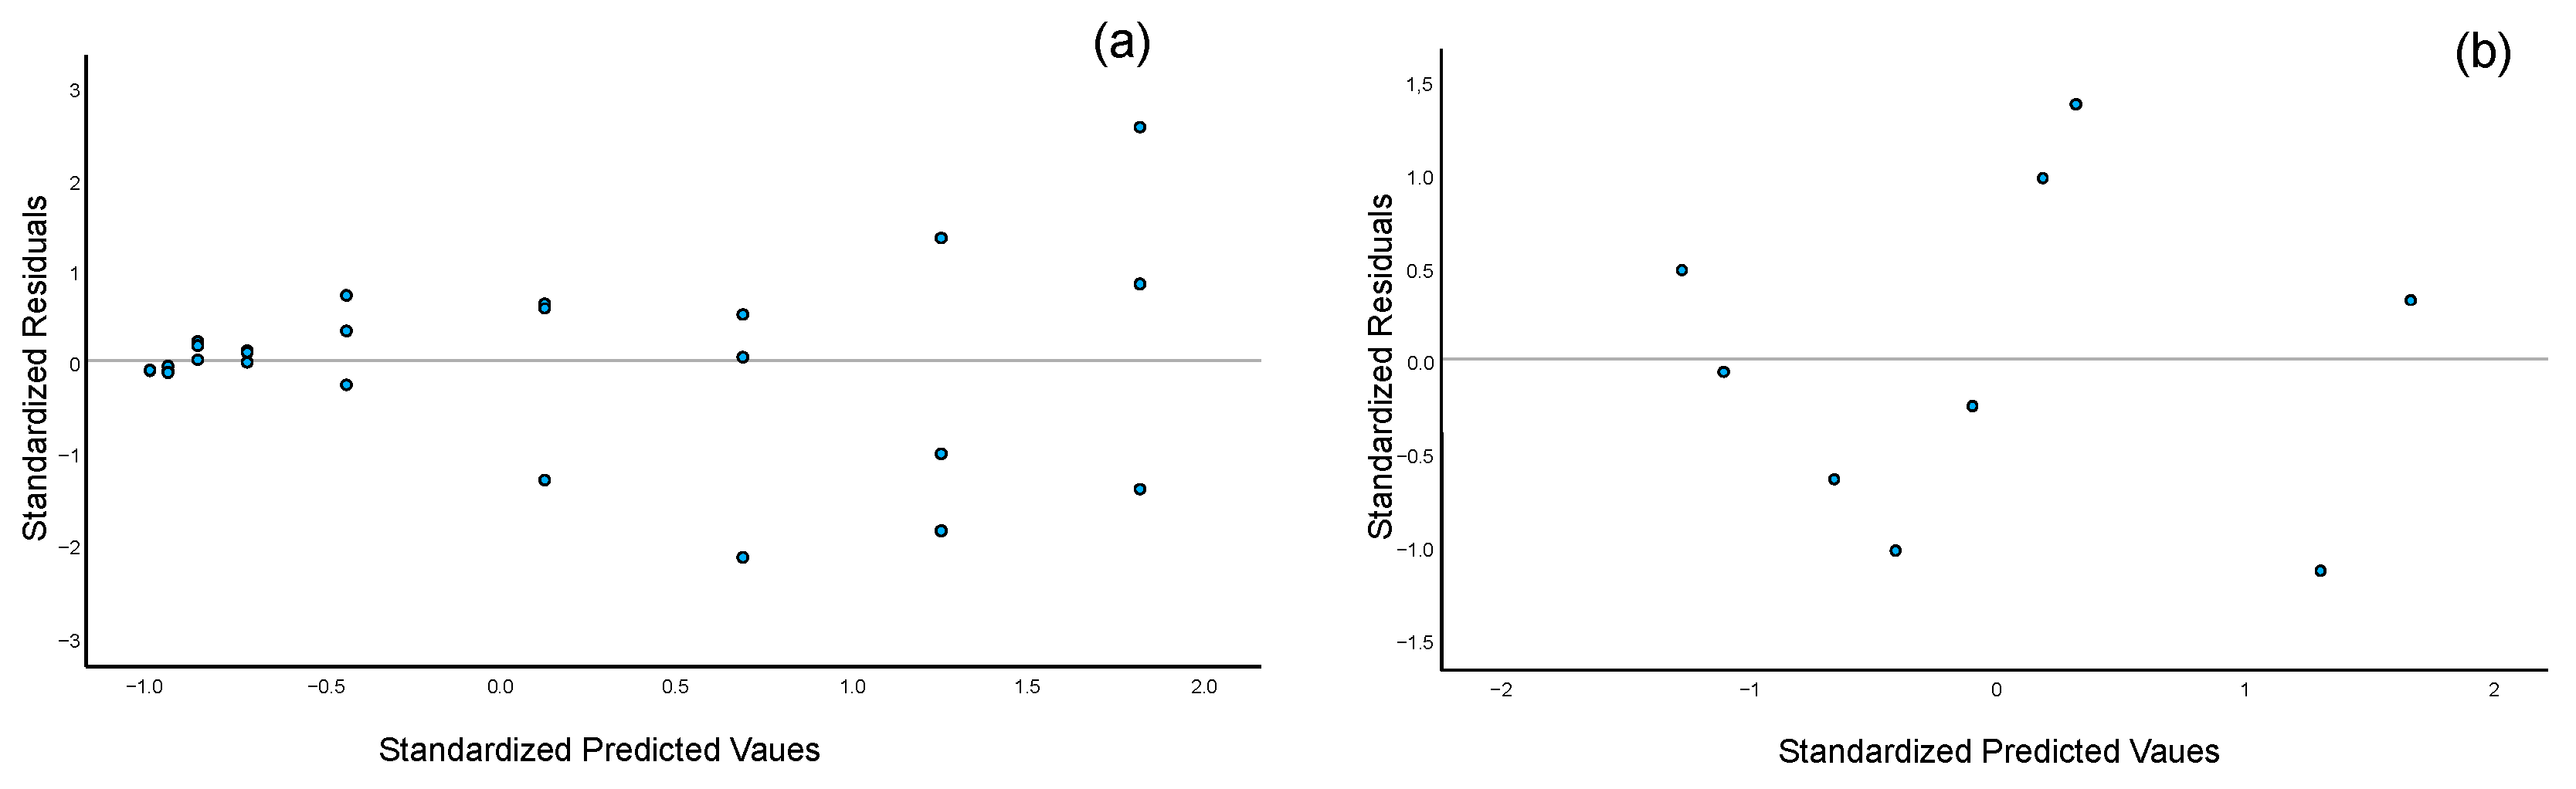
To evaluate whether the instrumental response was linear for each analyte, nine calibration levels were prepared, evenly distributed across a concentration range of 0.5 to 500 mg·L−1. For each level, three independent calibration standards were prepared. Linearity of the analytical responses was assessed both statistically and graphically. The lack-of-fit (LOF) test [8,39] was applied to determine the statistical significance of any deviations from linearity (Table 3), while residual plots were examined to visually inspect the distribution of residuals (Figure 2a). The results confirmed linear behavior for all sweeteners (p > 0.05), indicating no statistically significant deviation from linearity. In contrast, caffeine exhibited significant lack of fit (p < 0.001), confirming non-linear response over the full range tested. For caffeine, linearity was maintained only up to 80 mg·L−1.
Table 3.
Statistical evaluation of calibration models applied for the quantification of target analytes. The table includes p-values form the lack-of-fit (LOF) test to assess linearity, p-values form Levene’s test to evaluate homoscedasticity, and the relative standard error (RSE, %) as an indicator of goodness-of-fit (GOF). The instrumental working range assessed was 0.5–500 mg·L−1.
Figure 2.
Residual plots for selected analytes under the evaluated regression models: (a) Residual distribution for acesulfame K using linear regression across the 0.5–500 mg·L−1 range (three replicates per calibration level). The inclusion of replicates highlights the heteroscedasticity nature of the data; (b) Residual distribution for caffeine using quadratic regression within the 0.5–300 mg·L−1 range (one replicate per calibration level).
According to EU regulations, the maximum permitted concentration for sweeteners in flavored beverages is set for aspartame at 600 mg·L−1 [24]. Given that the proposed method involves a 1:2 dilution of the beverage samples, the resulting concentration of any sweetener during HPLC analysis is not expected to exceed 300 mg·L−1. In contrast, caffeine levels in some commercial beverages, particularly energy drinks, may reach up to 400 mg·L−1, resulting in concentrations of up to 200 mg·L−1 in the diluted samples. Based on these considerations, the upper limit of the instrumental working range was set to 300 mg·L−1 for all analytes, corresponding to a method-level range of up to 600 mg·L−1.
Within this range, a linear response was confirmed for all sweeteners. However, caffeine did not exhibit linear behavior across the full working range. Consequently, a quadratic regression model (y = b0 + b1x + b2x2) was evaluated and found to be appropriate for caffeine quantification, providing accurate results throughout the tested range. This is supported by the residual plot (Figure 2b), which shows a random distribution of residuals when applying the quadratic model, confirming its suitability.
3.2.4. Heteroscedasticity Assessment and Selection of the Regression Model
To evaluate the presence of heteroscedasticity in the calibration data, Levene’s test was applied [8,39]. The results indicated that all analytes exhibited heteroscedastic behavior (Table 3, p < 0.001), which was further supported by the inspection of residuals from replicate measurements at each calibration level (Figure 2a). As discussed in the Introduction, the use of OLS regression in the presence of heteroscedasticity can lead to biased and imprecise estimates, particularly at the lower end of the calibration range [5,8].
While heteroscedasticity does not preclude the use of linear regression models, it necessitates careful consideration in the determination of the MQL, since OLS fail to provide accurate results in this region. Therefore, to ensure both trueness and precision across the entire working range, especially at low concentrations, weighted regression models are recommended. Under the experimental conditions evaluated, weighted regressions were found to be the most appropriate approach for all analytes.
Table 4 presents the regression parameters obtained for all target analytes using both unweighted and weighted regressions, along with their associated standard errors (SE). For analytes that exhibited linear responses, statistical comparison of the slopes (b1) using a t-test revealed no significant differences between the OLS and WLS models (p > 0.23). However, a marked difference was observed in the variability of the intercepts (b0). The SE values for b0 obtained with OLS were significantly higher than those obtained with WLS (p < 0.001), with increases reaching up to 170-fold in some cases. A similar trend was observed for caffeine, where a quadratic regression model was applied; the SE of the intercept under the non-weighted regression was over 25 times higher than that obtained with the weighted model. These findings clearly demonstrate the improved precision at low levels provided by weighted models. Consequently, weighted regression models were selected as the most appropriate approach for all analytes.
Table 4.
Regression statistics determined for linear regression (sweeteners) and quadratic regression (caffeine). SE: Standard Error; R2: Determination Coefficient; RSE: Relative Standard Error (%). Instrumental working range: 0.5–300 mg·L−1 (corresponding to 1–600 mg·L−1 for the method). Linear regression model: y = b0 + b1x (used for sweeteners); Quadratic regression model: y = b0 + b1x + b2x2 (used for caffeine).
3.2.5. Goodness-of-Fit
During method validation, it is essential to assess the goodness-of-fit (GOF) of the chosen regression model to ensure method trueness across the entire selected working range. While the determination coefficient (R2) is commonly used to evaluate GOF, particularly in linear regressions, it has been demonstrated that R2 is not suitable for this purpose in cases of heteroscedastic calibrations. This is because R2 is based solely on the absolute errors of the dependent variable and does not account for the trueness of the data. Instead, statistical measures based on the differences between nominal and calculated values (i.e., bias) are preferred when trueness is a critical criterion [5].
The relative standard error (RSE, %) has been proposed as a more appropriate statistic for assessing GOF [5,40,41,42], with values below 10–15% typically considered acceptable. RSE is calculated as:
where xi,calc is the experimental measured concentration (back-calculated) with the assessed regression, xi,true is the nominal value of the calibration point, n is the number of calibration points, and p is the number of parameters in the regression model (e.g., two for linear, three for quadratic).
The results obtained during the validation procedure showed that R2 values were greater than 0.996 for all analytes using both unweighted and weighted regression models (Table 4) across the assessed concentration range. Based solely on R2 values, both models appeared to perform adequately starting at 1 mg·L−1, except for cyclamate, which was not detected in calibrators prepared below 40 mg·L−1.
However, when the RSE was calculated, only the weighted regression models produced satisfactory results beginning at 1 mg·L−1 (RSE < 10%,). For unweighted regressions, it was necessary to start the calibration range at 20 mg·L−1 to achieve acceptable RSE values. In the case of caffeine, which was modeled using a quadratic regression, the RSE obtained from the unweighted regression model was unacceptably high (29%), whereas the weighted model yielded a valid RSE of 4.8%. These findings further support the use of weighted regression for caffeine and highlight its overall suitability for improving trueness at lower concentration levels.
A limitation of using simple statistics such as RSE for assessing goodness-of-fit is that they account only for trueness (i.e., bias) and do not consider precision. To address this, the Société Française des Sciences et Techniques Pharmaceutiques (SFSTP) proposed a more comprehensive validation approach based on accuracy profiles [43]. This method involves calculating tolerance intervals (TIs) for each calibration level (intervals within which a predetermined proportion of future results, β-expectation, is expected to fall [44]). Under this approach, both the bias and the tolerance interval for each calibrator must lie within predefined limits to be considered valid. This ensures that both trueness and precision are evaluated across the entire calibration range, not just at the MQL.
Although more labor-intensive, this methodology provides a more robust and accurate determination of the MQL. The full set of equations and procedural details can be found in the literature [12,43,45], which is based on the following:
To construct the accuracy profile plot, the relative error (%) of the back-calculated concentration at each calibration level is plotted against the corresponding nominal (true) standard concentration. This plot also includes the upper and lower tolerance intervals (TIs) calculated for each point. When the entire accuracy profile, including the TIs, falls within the predetermined acceptance limits (commonly set at ±20% at MQL level [16,46]), the calibration model is considered capable of delivering accurate results for its intended use. Conversely, if any point or portion of its TI falls outside the acceptance limits, the method is not deemed valid at that concentration level.
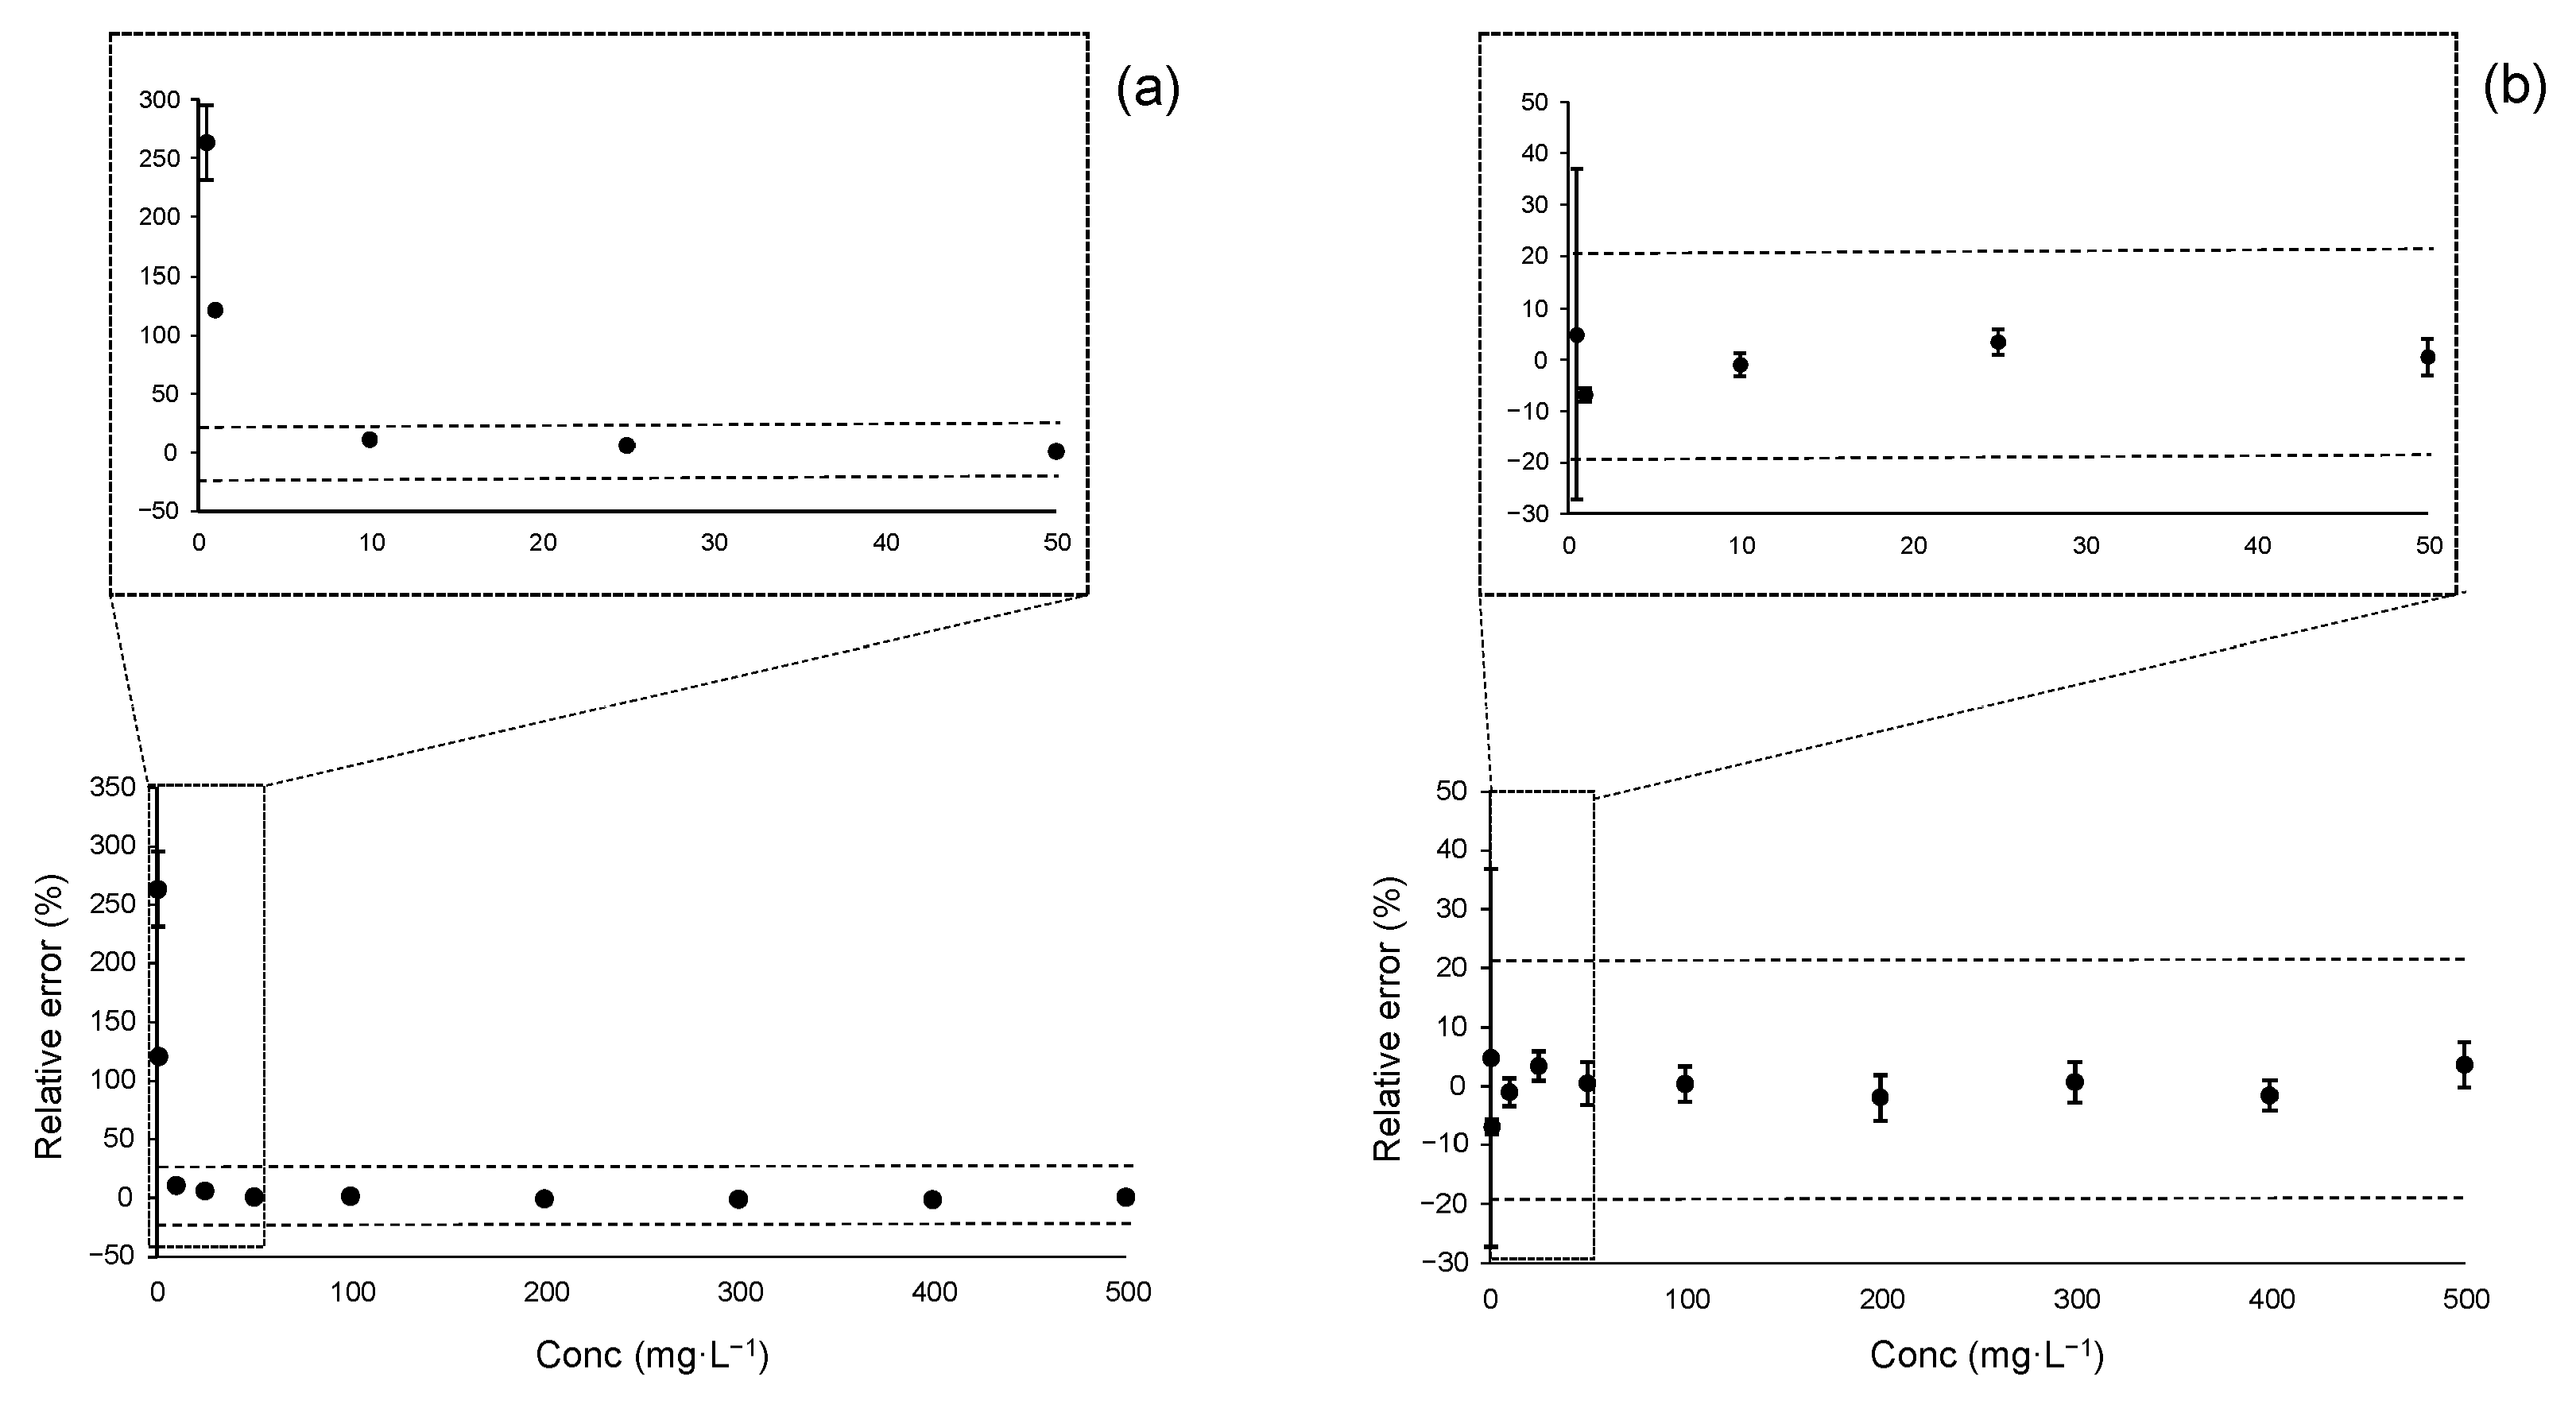
Figure 3 presents the accuracy profile plots for acesulfame K using both linear regression models: OLS in panel (a) and WLS in panel (b). As illustrated, the OLS regression yielded valid results only in the range 10–300 mg·L−1. Calibration levels below 10 mg·L−1 fall outside the acceptance limits, indicating that estimates at these concentrations, when derived using OLS, may be biased and imprecise.
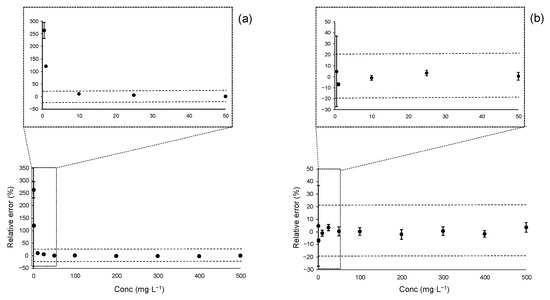
Figure 3.
Accuracy profile plots for acesulfame K over the instrumental linear range of 0.5–500 mg·L−1: (a) Accuracy profile plots using OLS regression; (b) Accuracy profile plots using WLS regression. Vertical bars represent the tolerance intervals (TIj) calculated for each calibration level. Horizontal dashed lines indicate the acceptance limits set at ±20%, as typically required at the MQL level.
In contrast, the WLS regression produced an accuracy plot that was fully within the acceptance limits starting at 1 mg·L−1. Although the first calibration point at 0.5 mg·L−1 yielded an unbiased estimate (bias < 10%), its associated uncertainty was excessive, with a TI of ±32%. This finding aligns with the earlier RSE-based analysis, reinforcing the conclusion that WLS provides more reliable estimates at lower concentrations.
Similar results were observed for the other analytes exhibiting linear responses, such as aspartame and saccharin, further supporting the use of weighted regression for achieving both precision and trueness across the full calibration range.
3.2.6. Method Quantification Limits (MQLs)
The MQL is arguably the validation parameter that exhibits the greatest discrepancy and variability in its determination. During method validation, it is recommended to analyze replicates of blank samples (or fortified blank samples at concentrations close to the expected limit), performing all steps of the proposed method. The standard deviation of the results obtained, referred to as SDblank, is typically considered a suitable estimate of the variability at blank level [13,14,15]. In most cases, the method detection limit (MDL) and MQL are then calculated based on this variability, using a multiplier of the SDblank: commonly, k = 3.3 for MDL and k = 10 for MQL. For linear regressions, limits are calculated as
This procedure may be appropriate for estimating the MDL, as it represents the minimum quantity that produces a signal significantly different from background noise. At this level, obtaining unbiased results is not required. However, it presents two major limitations when estimating the MQL when unbiased results are required: (i) it does not assess the method’s uncertainty at the calculated level, and (ii) it yields equivalent estimates for both weighted and unweighted linear regressions, since the slopes (b1) of OLS and WLS regressions are equivalents [4,9], which has been confirmed for the method assessed in this study (see Heteroscedasticity section).
Recent approaches suggest that the determination of SDblank should not rely solely on estimating the SD at blank level. Instead, uncertainty propagation in the parameters of the applied regression function should also be considered [16,19,20]. As shown in Table 4, the variability of the intercept consistently leads to significant differences between weighted and unweighted regressions, with higher variability observed in OLS models. This implies that, when combined uncertainty is taken into account, higher MQL values are expected when using OLS.
In this study, MQLs for the assessed method were estimated using three different approaches: (i) the conventional method based solely on SDblank, (ii) a combined uncertainty-based approach (following the Guide to the Expression of Uncertainty in Measurement (GUM) for uncertainty propagation [47]), and (iii) values derived from RSE calculations and accuracy profile plots (Table 5).
Table 5.
MDL and MQL (mg·L−1) estimates for the weighted (W) and non-weighted (NW) regressions obtained using different calculation approaches. The variability observed for intermediate precision at a low level, 10 mg·L−1, was used as SDblank.
As shown in Table 5, all approaches that considered both precision and trueness yielded different MQL values for weighted and non-weighted regressions. The MQL calculated using the most conventional method (10·SDblank) was only confirmed when weighted regressions were applied. In contrast, substantially higher MQL values, up to 20 times greater, were obtained using non-weighted regressions. This discrepancy is attributed to the heteroscedasticity observed in all assessed calibrations, where the uncertainty of the intercept in unweighted regressions became the dominant contributor to the combined uncertainty. In the case of weighted regressions, however, the SDblank remained the most significant contributor to combined uncertainty.
Based on the results for the assessed method, working ranges for unweighted regressions should begin at 20 mg·L−1, whereas weighted regressions can achieve unbiased and precise results starting at concentrations as low as 2–5 mg·L−1.
To confirm the significant impact of the regression model on the results, independent replicates of a cola sample (free of sweeteners) were fortified at two concentration levels: one between the MQLs determined by the two regression models (i.e., 10 mg·L−1) and another well above both limits (100 mg·L−1). At the higher level, equivalent concentrations and recoveries were observed (p > 0.2). However, at the lower level, significant differences (p < 0.01) were found for all sweeteners. Furthermore, the recovery values obtained at the low level obtained using OLS regression were significantly biased, confirming a systematic error when using this regression model at low concentrations.
In the analysis of commercial beverages, it was also observed that, for samples with sweetener concentrations below 30 mg·L−1, results from OLS consistently differed from those obtained using WLS, with discrepancies ranging from +8% to +13%. When concentrations exceeded 30 mg·L−1, results from both regression models were statistically equivalent. Since a substantial number of commercial samples contained some sweeteners at levels below 30 mg·L−1, it became evident that weighted regression must be applied to ensure accurate quantification of target analytes across all sample types.
These findings further confirm the critical influence of the chosen regression model on the accuracy of low-level determinations. They underscore the necessity of establishing distinct MQL values depending on the regression function used, to ensure both unbiased and precise results.
3.2.7. Trueness
As with the precision assessment, trueness was evaluated at two concentration levels (10 mg·L−1 and 400 mg·L−1). For sweeteners, replicates of a cola sample with no sweeteners listed on its label were fortified, and recoveries were determined. For caffeine, replicates of two commercial samples (one cola and one energy drink) were analyzed using the proposed method and an alternative validated method routinely used in our laboratory for the analysis of methylxanthines. This second method also employs HPLC but uses a different instrument and column, ensuring independence.
The recoveries results for sweeteners (Table 6) show that unbiased results were obtained at both concentration levels only when using WLS regression. In contrast, OLS regression produced unbiased results at the high level but significantly biased results at the low level.
Table 6.
Recoveries obtained from the analysis of independent replicates of a cola sample fortified at low (10 mg·L−1) and high (400 mg·L−1) concentration levels (n = 3 at each level). Results are reported as mean ± confidence interval (α = 0.05).
For caffeine, the results obtained from replicate measurements of each sample were equivalent between the two methods, regardless of the regression function used (cola: method 1–95.4 mg·L−1, SD = 1.8 mg·L−1; method 2–96.7 mg·L−1, SD = 1.9 mg·L−1; p = 0.36; energy drink: method 1–332.7 mg·L−1, SD = 2.4 mg·L−1; method 2–335.7 mg·L−1, SD = 1.8 mg·L−1; p = 0.09). This consistency is attributed to the fact that the caffeine concentrations in all cases were at intermediate or high levels.
3.2.8. Uncertainty
When validating a method, it is essential to understand the variability expected in measurement results with that method. Measurement uncertainty (MU) provides “a comprehensive view by quantifying the range within which the true value of a measured parameter is likely to fall” [48]. Thus, MU informs users about the tolerance limits associated with the results produced by the proposed method. Although MU is a crucial component of method validation, and a requirement for obtaining ISO accreditation [3], it is often not determined by research laboratories, primarily because it requires extensive experimental data collected over long periods.
The most widely recognized approach for estimating and expressing MU is the GUM approach [47]. Originally developed for physical measurements, it is also applicable to biological and chemical analyses. However, the GUM approach is methodologically complex, as it requires the identification and quantification of all potential sources of uncertainty, an especially challenging task in experimental analytical methods.
For experimental laboratory methods, the Nordtest approach [49] has proven to be more practical. It utilizes quality control and/or validation data to estimate MU. Intermediate precision is used as an estimate of the uncertainty due to random effects (u(Rw)). Additionally, bias uncertainty (u(bias)) must be accounted for, as systematic errors can be minimized but not entirely eliminated in experimental measurements. The combined uncertainty (uc) can be then calculated as
where u(bias) is obtained from recovery experiments and u(Rw) from intermediate precision data. Finally, the expanded uncertainty (U) is calculated by multiplying uc by a coverage factor k (usually k = 2 to reflect a probability of 95%).
The Nordtest approach was applied to evaluate MU for the proposed method. In our laboratory, the target expanded uncertainty is set at ±10%, except at the MQL level, where ±15% is accepted. The MU results obtained (Table 7) confirm that non-weighted OLS regression fails to achieve acceptable uncertainties at low concentration levels. Only WLS regression produces acceptable uncertainties across the entire working range assessed for the method (2–600 mg·L−1). These results further underscore the significant impact of the regression model on overall method capability.
Table 7.
Calculated expanded uncertainty (U, %) for the assessed method in the determination of sweeteners using two linear regression models. U = k·u, with k = 2 for a 95% confidence level.
4. Conclusions
An analytical method for the quantification of artificial sweeteners and caffeine has been developed and validated. The results confirm that analytical and bioanalytical methods often exhibit heteroscedasticity in their response, meaning that the variance of the response increases with concentration. Consequently, weighted regression must be applied to obtain accurate estimates, particularly at low concentration levels.
As demonstrated with the assessed method, the choice of regression model significantly affects the determination of the MQL when both trueness and precision are considered. For heteroscedastic calibrations, conventional unweighted regression functions, such as OLS for linear regression, are capable of providing accurate results (i.e., unbiased and precise) only at intermediate or high concentration levels. In contrast, only weighted regression models provide reliable estimates at low concentrations with heteroscedastic conditions.
The most commonly used procedure for determining method limits involves estimating the standard deviation at blank level (SDblank) by analyzing blank or fortified blank samples. While this approach accounts for variability at blank level, it fails to consider other significant sources of uncertainty that influence the combined uncertainty, particularly at the MQL level. These additional sources include uncertainties associated with the regression parameters.
In the case of weighted regressions, the simplified approach remains valid because the uncertainty of the intercept is generally comparable to SDblank. As a result, the combined uncertainty can be approximated by . Consequently, only minor differences are observed between MQL values obtained using the conventional method and those calculated with full uncertainty propagation.
However, for unweighted regressions such as OLS, the uncertainty of the intercept is typically much larger and becomes the dominant contributor to combined uncertainty. In heteroscedastic contexts, uc calculated using unweighted regression is often more than 10 times greater than that obtained with weighted regression, resulting in similarly inflated MQL values, sometimes more than an order of magnitude higher.
Measurement uncertainty was also evaluated for the proposed method. Because bias (systematic error) must be included in uncertainty assessments, it became evident that the lower limit of the working range is significantly improved when weighted regression is used in the presence of heteroscedasticity.
The necessity of using weighted regression functions is especially relevant for accurate estimation of the MQL, and therefore for measurements conducted near the lower end of the calibration range, a common requirement in environmental trace analysis. For measurements at intermediate or high concentration levels, however, the choice between weighted and unweighted regression has a negligible impact on result accuracy.
Author Contributions
Conceptualization, J.M.S.; methodology, N.H. and J.M.S.; software, N.H. and J.M.S.; validation, N.H. and J.M.S.; formal analysis, J.M.S.; investigation, N.H. and J.M.S.; resources, J.M.S.; data curation, J.M.S.; writing—original draft preparation, J.M.S.; writing—review and editing, N.H. and J.M.S.; visualization, N.H. and J.M.S.; supervision, J.M.S.; project administration, J.M.S.; funding acquisition, J.M.S. This work was conducted as part of the Final Degree Experimental Project of N.H. All authors have read and agreed to the published version of the manuscript.
Funding
This research received no external funding.
Data Availability Statement
Data is unavailable due to privacy.
Conflicts of Interest
The authors declare no conflicts of interest.
Abbreviations
The following abbreviations are used in this manuscript:
| ANOVA | Analysis of Variance |
| AOAC | Association of Analytical Communities |
| EU | European Union |
| FL | Fluorescence |
| GOF | Goodness-of-Fit |
| GUM | Guide to the Expression of Uncertainty in Measurement |
| HPLC | High-Performance Liquid Chromatography |
| IUPAC | International Union of Pure and Applied Chemistry |
| LOF | Lack-of-Fit |
| MDL | Method Detection Limit |
| MQL | Method Quantification Limit |
| MU | Measurement Uncertainty |
| OLS | Ordinary Least Squares |
| R2 | Determination Coefficient |
| RSD | Relative Standard Deviation |
| RSE | Relative Standard Error |
| SD | Standard Deviation |
| SE | Standard Error |
| S/N | Signal-to-Noise Ratio |
| TI | Tolerance Interval |
| u | Uncertainty |
| U | Expanded Uncertainty |
| UV | Ultraviolet |
| WLS | Weighted Least Squares |
References
- Cantwell, H. (Ed.) Eurachem Guide: The Fitness for Purpose of Analytical Methods—A Laboratory Guide to Method Validation and Related Topics, 3rd ed.; Eurachem: Teddington, UK, 2025; Available online: https://www.eurachem.org/index.php/publications/guides/mv (accessed on 19 May 2025).
- ISO 5725-1:2023; Accuracy (Trueness and Precision) of Measurement Methods and Results: Part 1: General Principles and Definitions. ISO: Geneva, Switzerland, 2023.
- ISO/IEC 17025:2017; General Requirements for the Competence of Testing and Calibration Laboratories. ISO: Geneva, Switzerland, 2017.
- Sanchez, J.M. Estimating detection limits in chromatography from calibration data: Ordinary least squares regression vs. weighted least squares. Separations 2018, 5, 49. [Google Scholar] [CrossRef]
- Sanchez, J.M. The inadequate use of the determination coefficient in analytical calibrations: How other parameters can assess the goodness-of-fit more adequately. J. Sep. Sci. 2021, 44, 4431–4441. [Google Scholar] [CrossRef]
- Meites, L.; Smit, H.C.; Kateman, G. The effects of errors in measuring the independent variable in least-squares regression analyisis. Anal. Chim. Acta 1984, 164, 287–291. [Google Scholar] [CrossRef]
- Tellinghuisen, J. Weigthed least squares in calibration: What difference does it make? Analyst 2007, 132, 536–543. [Google Scholar] [CrossRef] [PubMed]
- Sanchez, J.M. Linear calibrations in chromatography: The incorrect use of ordinary least squares for determinations at low levels, and the need to redefine the limit of quantification with this regression model. J. Sep. Sci. 2020, 43, 2708–2717. [Google Scholar] [CrossRef]
- Zorn, M.E.; Gibbons, R.D.; Sonzogni, W.C. Weighted least-squares approach to calculating limit of detection and quantification by modeling variability as a function concentration. Anal. Chem. 1997, 69, 3069–3075. [Google Scholar] [CrossRef]
- Ceccato, A.; Klinkenberg, R.; Hubert, P.; Streel, B. Sensitive determination of buprenorphine and its N-dealkylated metabolite norbuprenorphine in human plasma by liquid chromatography couple to tandem mass spectrometry. J. Pharm. Biomed. Anal. 2003, 32, 619–631. [Google Scholar] [CrossRef]
- Streel, B.; Ceccato, A.; Klinkenberg, R.; Hubert, P. Validations of a liquid chromatographic-tandem mass spectrometric method for the determination of loperamide in human plasma. J. Chromatogr. B 2005, 814, 263–273. [Google Scholar] [CrossRef]
- Hubert, P.; Nguyen-Huu, J.J.; Boulanger, B.; Chapuzet, E.; Chiap, P.; Cohen, N.; Compagnon, P.A.; Dewé, W.; Feinberg, M.; Lallier, M.; et al. Harmonization of strategies for the validation of quantitative analytical procedures: A SFSTP proposal—Part II. J. Pharm. Biomed. Anal. 2007, 45, 70–81. [Google Scholar] [CrossRef]
- Magnusson, B.; Ömemark, U. (Eds.) Eurachem Guide: The Fitness for Purpose of Analytical Methods—A Laboratory Guide to Method Validation and Related Topics, 2nd ed.; Eurachem: Teddington, UK, 2014. [Google Scholar]
- Currie, L.A. Limit for qualitative detection and quantitative determination: Application to radiochemistry. Anal. Chem. 1968, 40, 586–593. [Google Scholar] [CrossRef]
- Currie, L.A. Nomenclature in the evaluation of analytical methods including detection and quantification capabilities (IUPAC recommendations 1995). Pure Appl. Chem. 1995, 67, 1699–1723. [Google Scholar] [CrossRef]
- US Food and Drug Administration (US-FDA). Bioanalytical Method Validation: Guidance for Industry; US-FDA: Silver Spring, MD, USA, 2018. Available online: https://www.fda.gov/regulatory-information/search-fda-guidance-documents/bioanalytical-method-validation-guidance-industry (accessed on 7 May 2025).
- Feinberg, M. Validation of analytical methods based on accuracy profiles. J. Chromatogr. A 2007, 1158, 174–183. [Google Scholar] [CrossRef]
- Armbruster, D.A.; Pry, T. Limit of blank, limit of detection and limit of quantification. Clin. Biochem. Rev. 2008, 29 (Suppl. 1), S49–S52. [Google Scholar] [PubMed]
- International Conference on Harmonisation (ICH). ICH Harmonised Tripartite Guideline—Validation of Analytical Procedures Q2(R2). 2023. Available online: https://www.ich.org/page/quality-guidelines (accessed on 11 May 2025).
- Currie, L.A. Nomenclature in the evaluation of analytical methods including detection and quantification capabilities (IUPAC recommendations 1995). Anal. Chim. Acta 1999, 391, 105–126. [Google Scholar] [CrossRef]
- Suez, J.; Korem, T.; Zilberman-Schapira, G.; Segal, E.; Elinav, E. Non-caloric artificial sweeteners and the microbiome: Findings and challenges. Gut Microbes 2015, 6, 149–155. [Google Scholar] [CrossRef]
- Hetta, H.F.; Sirag, N.; Elfadil, H.; Salama, A.; Aljadrawi, S.F.; Alfaifi, A.J.; Alwabisi, A.N.; AbuAlhasan, M.; Alanazi, L.S.; Aljohani, Y.A.; et al. Artificial sweeteners: A double-edged sword for gut microbiome. Diseases 2025, 13, 115. [Google Scholar] [CrossRef] [PubMed]
- World Health Organization (WHO). Aspartame Hazard and Risk Assessment Results Released. WHO. 14 July 2023. Available online: https://www.who.int/news/item/14-07-2023-aspartame-hazard-and-risk-assessment-results-released (accessed on 20 May 2025).
- European Parliament; Council of the European Union. Regulation (EC) No 1333/2008 of The European Parliament and of the Council of 16 December 2008 on Food Additives; Annex II, Part E; European Community: Luxembourg, 2008. [Google Scholar]
- Bell, L.N.; Wetzel, C.R. Aspartame degradation in solution as impacted by buffer type and concentration. J. Agric. Food Chem. 1996, 43, 2608–2612. [Google Scholar] [CrossRef]
- Wróbel, K.; Wróbel, K. Determination of aspartame and phenylalanine in diet soft drinks by high-performance liquid chromatography with direct spectrofluorimetric detection. J. Chromatogr. A 1997, 773, 163–168. [Google Scholar] [CrossRef]
- Abreu, M.B. Intense Sweeteners and Synthetic Colorants. In Food Analysis by HPLCK, 2nd ed.; Nollet, L.M.L., Ed.; Marcel Dekker Inc.: New York, NY, USA, 2000; pp. 523–573. [Google Scholar]
- Pattanaargson, S.; Chuapradit, C.; Srisukphonraruk, S. Aspartame degradation in solutions at various pH condicions. J. Food Sci. 2001, 66, 808–809. [Google Scholar] [CrossRef]
- Dossi, N.; Toniolo, R.; Susmel, S.; Pizzariello, A.; Butempelli, G. Simultaneous RP-LC determination of additives in soft drinks. Chromatographia 2006, 63, 557–562. [Google Scholar] [CrossRef]
- Croitoru, M.D.; Fulop, I.; Kinces Ajtay, M.; Balogh, C.; Dogaru, M.T. Direct HPLC-UV determination of cyclamate, saccharine and aspartame from soft drinks. Acta Aliment. 2011, 40, 459–465. [Google Scholar] [CrossRef]
- Ustün-Ozgür, M.; Kasapoglu, M. Development and validation of a simple ultrafast liquid chromatographic method for the simultaneous determination of aspartame, acesulfame-K, caffeine and sodium benzoate in diet soft drinks. J. Anal. Chem. 2019, 74, 555–564. [Google Scholar] [CrossRef]
- Jankulovska, M.S.; Josimovska, T.; Velkoska-Markoskova, L. Development and validation of RP-HPLC method with UV-DAD detection for simultaneous determination of acesulfame K, sodium saccharin and aspartame in beverages. Acta Chromatogr. 2024; online first. [Google Scholar] [CrossRef]
- Trawinski, J.; Skibinski, R. Stability of aspartame in soft drinks: Identification of the novel phototransformation products and their toxicity evaluation. Food Res. Int. 2023, 173, 11365. [Google Scholar] [CrossRef]
- Bruno, S.N.F.; Cardoso, C.R.; Maciel, M.M.A.; Vokac, L.; da Silva Junior, A.I. Selective identification and quantification of saccharin by liquid chromatography and fluorescence detection. Food Chem. 2014, 159, 309–315. [Google Scholar] [CrossRef]
- ISO 5725-3:2023; Accuracy (Trueness and Precision) of Measurement Methods and Results, Part 3: Intermediate Precision and Alternative Designs for Collaborative Studies. ISO: Geneva, Switzerland, 2023.
- AOAC. AOAC Peer-Verified Methods Program: Manual on Policies and Procedures; AOAC: Arlington, VA, USA, 1993. [Google Scholar]
- Welz, B.; Sperling, M. Atomic Absorption Spectrometry, 3rd ed.; Wiley-VCH: Weinheim, Germany, 2005. [Google Scholar]
- Jarantow, W.J.; Pisors, E.D.; Chiu, M.L. Introduction to the use of linear and nonlinear regression analysis in quantitative biological assays. Curr. Protoc. 2023, 3, e801. [Google Scholar] [CrossRef]
- Massart, D.L.; Vandeginste, B.G.M.; Buydens, L.M.C.; De Jong, S.; Lewi, P.H.; Smeyers-Verbeke, J. Handbook of Chemometrics and Qualimetrics: Part A; Elsevier: Amsterdam, The Netherlands, 1997. [Google Scholar]
- The NELAC Institute. TNI Standard: EL-VIM4 Sections 1.7.1 and 1.7.2. 2015. Available online: https://nelac-institute.org/docs/standards/2015/chemistry/TNI_Standard_ELV1M4_1.7.1_and_1.7.2_0415.pdf (accessed on 6 May 2025).
- US-EPA. SW-846 Test Method 8000D: Determinative Chromatographic Separations. 2018. Available online: https://www.epa.gov/hw-sw846/sw-846-test-method-8000d-determinative-chromatographic-separations (accessed on 6 May 2025).
- Burrows, R.; Parr, J. Evaluating the goodness of instrument calibrations for chromatographic procedures. LC·GC N. Am. 2020, 38, 35–38. [Google Scholar]
- Hubert, P.; Chiap, P.; Crommen, J.; Boulanger, B.; Chapuzet, E.; Mercier, N.; Bervoas-Martin, S.; Chevalier, P.; Grandjean, D.; Lagorce, P.; et al. The SFSTP guide on the validation of chromatographic methods for drug bioanalysis: From the Washington Conference to the latoratory. Anal. Chim. Acta 1999, 391, 135–148. [Google Scholar] [CrossRef]
- Hubert, P.; Nguyen-Huu, J.J.; Boulanger, B.; Chapuzet, E.; Chiap, P.; Cohen, N.; Compagnon, P.A.; Dewé, W.; Feinberg, M.; Lallier, M.; et al. Harmonization of strategies for the validation of quantitative analytical procedures: A SFSTP proposal—Part I. J. Pharm. Biomed. Anal. 2004, 36, 579–586. [Google Scholar] [CrossRef]
- González, O.; Blanco, M.E.; Iriarte, G.; Bartolomé, L.; Maguregui, M.I.; Alonso, R.M. Bioanalytical chromatographic method validation according to current regulations, with a special focus on the non-well defined parameters limit of quantification, robustness and matrix effects. J. Chromatogr. A 2014, 1353, 10–27. [Google Scholar] [CrossRef]
- Bouabidi, A.; Rozet, E.; Fillet, M.; Siemons, E.; Chapuzet, E.; Mertens, B.; Klinkenberg, R.; Ceccato, A.; Talbi, M.; Streel, B.; et al. Critical analysis of several analytical validation strategies in the framework of the fit for purpose concept. J. Chromatogr. A 2010, 1217, 3180–3192. [Google Scholar] [CrossRef]
- JCGM 100:2008; Evaluation of Measurement Data—Guide to the Expression of Uncertainty in Measurement. JCGN, 2008. Available online: https://www.bipm.org/en/committees/jc/jcgm/publications (accessed on 21 May 2025).
- Natalia, K. Understanding Measurement Uncertainty in the Laboratory. SmartQMS. 2024. Available online: https://smartqms.com.au/quality-management-systems/understanding-measurement-uncertainty-in-the-laboratory/ (accessed on 26 May 2025).
- Magnusson, B.; Näykki, T.; Hovind, H.; Sahlin, E. Handbook for Calculation of Measurement Uncertainty in Environmental Laboratories, Nordtest Report TR 537, 4th ed.; 2017; Available online: https://www.nordtest.info/wp/calculation-of-measurement-uncertainty-4/ (accessed on 14 May 2025).

Disclaimer/Publisher’s Note: The statements, opinions and data contained in all publications are solely those of the individual author(s) and contributor(s) and not of MDPI and/or the editor(s). MDPI and/or the editor(s) disclaim responsibility for any injury to people or property resulting from any ideas, methods, instructions or products referred to in the content. |
© 2025 by the authors. Licensee MDPI, Basel, Switzerland. This article is an open access article distributed under the terms and conditions of the Creative Commons Attribution (CC BY) license (https://creativecommons.org/licenses/by/4.0/).