Article

Content Determination and Impurity Profiling of Compound Glycyrrhizin Tablets by Ion-Pair High-Performance Liquid Chromatography, Coupled with Corona-Charged Aerosol Detector

1
Analysis and Testing Center, Institute of Medicinal Biotechnology, Chinese Academy of Medical Sciences & Peking Union Medical College, Beijing 100050, China
2
Xinjiang Key Laboratory of Uygur Medical Research, Xinjiang Institute of Materia Medica, Urumqi 830004, China
3
College of Pharmacy, Xinjiang Medical University, Urumqi 830017, China
*
Author to whom correspondence should be addressed.
Separations 2025, 12(7), 168; https://doi.org/10.3390/separations12070168
Submission received: 23 May 2025 / Revised: 20 June 2025 / Accepted: 23 June 2025 / Published: 25 June 2025

Abstract

Compound Glycyrrhizin tablets (CGTs) are a combination of glycyrrhizin, glycine and methionine. Glycine and methionine have relatively high polarity and lack chromophore; therefore, it is difficult to simultaneously determine the various components using traditional reversed-phase chromatography and ultraviolet detectors. In addition, it is even more challenging to obtain a comprehensive and systematic impurity profiling for the CGTs. In this study, an ion-pair high-performance liquid chromatography (HPLC)–charged aerosol detection (CAD) method was established to determine the content of glycyrrhizin, glycine and methionine. The impurities of CGTs were also identified using mass spectrometry. By optimizing the content of trifluoroacetic acid (TFA) in the mobile phase and optimizing the CAD parameter settings, the developed method was verified in accordance with the guidelines outlined in ICH Q2 (R2). The results indicated that the method demonstrated high accuracy and sensitivity. Glycine, methionine and glycyrrhizin all showed a good linear relationship within the labeled range of 50–200%, and the average recoveries of the three components were 97.62–100.6%. The impurity detection was quantified via the principal component control method. The limit of detection (LOD) method showed an equivalent to 0.05% of the glycyrrhizin in CGTs, approximately 12.5 ng. The ion-pair HPLC–CAD method developed in this study simultaneously determined the content of the main component and the impurities of CGTs, without necessitating derivatization. This has provided a research basis for further improving the quality standards of CGTs.

1. Introduction

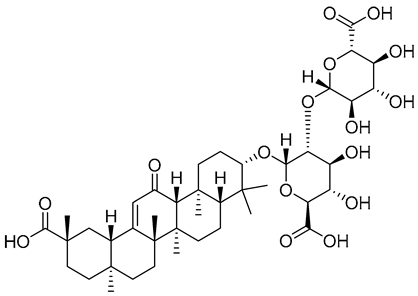
Compound glycyrrhizin tablets (CGTs) are a combination of glycyrrhizin (GR), glycine (Gly) and methionine (Met). They are mainly used to prevent and treat liver injury, eczema and dermatitis, and they have antiviral, anti-inflammatory and adrenal cortical hormone-like effects [1,2,3,4]. Among them, glycyrrhizin (GR) is a triterpene saponin that is mainly derived from the roots and stems of licorice plants, and it is the main active ingredient in licorice [5,6]. In recent years, great progress has been made in the use of glycyrrhizic acid to treat hepatitis B, rheumatoid diseases and AIDS, etc. [7,8,9], and it has received significant attention from scholars [10,11]. Given its extensive application in clinical practice, it is imperative to conduct rigorous quality studies on CGTs, encompassing both their active pharmaceutical ingredients (APIs) and impurities, to ensure the safety and efficacy of the drug. Currently, CGTs are not included in the pharmacopoeias. Due to the different position of H at C18 in the molecular structure of glycyrrhetinic acid, there are two different isomers, namely 18α-glycyrrhetinic acid (18α-glycyrhizin) and 18β-glycyrrhetinic acid (18β-glycyrhizin). Among them, 18β-glycyrrhetinic acid is considered the main component structure [12,13]. Regarding the research on related substances, in addition to specifying the content of 18β-glycyrrhetinic acid, EP11.0 and USP-NF2024 only included monoammonium glycyrrhizin impurity glycyrrhizin G2(24-hydroxyglycyrrhizin) as the potential impurity in GR [14,15].
Due to the presence of glycine and methionine, both have a relatively high polarity and lack chromophore structures, making it difficult to simultaneously detect the components and impurities in CGTs using traditional reversed-phase high-performance liquid chromatography (HPLC) and ultraviolet detectors [16]. At present, derivatization methods such as ninhydrin hydrate, o-phthalaldehyde (OPA) and 9-fluorenylmethoxycarbonyl chloride (FMOC-Cl), before or after the column, are mainly adopted for the analysis of amino acids [17,18]. However, these derivation methods have certain drawbacks. Firstly, the operations of these derivatization methods are complex, and the derivative products are unstable in some cases. In addition, the precision, accuracy and reliability of the measurements need to be further improved.
There is an urgent need to develop corresponding universal, accurate and reliable detection methods for the simultaneous analysis of GR, Gly and Met, as well as the impurity profiling. Ion-pair HPLC provides a solution for the simultaneous analysis of polar and non-polar compounds. It is among the most established separation techniques for polar ionizable compounds, using ion-pairing reagents of opposite charge under RP conditions [19,20,21]. As a new type of universal detector, the charged aerosol detection (CAD) has been increasingly widely applied in the analysis of substances lacking chromophores in their structures [22,23,24,25,26]. Based on its universality, CAD is capable of achieving the simultaneous detection of compounds with and without ultraviolet absorption [27,28,29].
In this study, through the optimization of chromatographic conditions and detector parameters, the APIs and related substances in CGTs were separated by the ion-pair HPLC–CAD method. Combined with HRMS, multiple unknown impurities in CGTs were identified. This method can determine the content of the main component and detect related impurities without conducting derivatization reactions on the sample [30,31]. Combined with HRMS, multiple unknown impurities in CGTs were identified. The developed method was validated according to the ICH Q2 (R2). Using the developed method, the APIs and impurities in CGTs were determined, providing a research basis for improving the quality of CGTs.

2. Materials and Methods

2.1. Materials and Reagents

The reference substances of glycine (100.0%), methionine (99.9%) and ammonium glycyrrhizinate (94.4%) were all purchased from the National Institutes for Food and Drug Control (Beijing, China). Acetonitrile (ACN) and trifluoroacetic acid (TFA) were purchased from J&K Scientific Co., Ltd. (Beijing, China). Pure water (18.2 MΏ) was obtained from a Millipore Milli-Q water purification system. Three different batches of CGTs were obtained from Tefeng Pharmaceutical Co., Ltd. (Urumqi, China).

2.2. Apparatus and Software

The chromatographic system was equipped with a quaternary pump, an autosampler, a column oven and a Corona Veo CAD detector (Thermo Fisher Scientific, Waltham, MA, USA). Chromeleon 7.2 SR5 software was utilized for system control and data acquisition. Mass spectrometry data were collected using a Thermo LTQ Orbitrap XL high-resolution mass spectrometer, equipped with Xcalibur 3.0 software. The Shim-pack GIST C18 AQ column was obtained from Shimadzu (Tokyo, Japan).

2.3. Experimental Conditions

2.3.1. Chromatographic Conditions

The separations were conducted on a C18 AQ column (3 μm, 4.6 mm × 150 mm), with a flow rate of 0.8 mL min−1. The column temperature was maintained at 30 °C, and the mobile phase was composed of water (0.5% trifluoroacetic acid) (A) and acetonitrile (B). A linear gradient elution program was as follows: 2% B (v/v) in 0–3 min; 2–80% B in 3–15 min; 80%–2% B in 15–16 min; and 2% B in 16 min–20 min. The injected volume was 10 μL. The detection conditions for the CAD evaporation temperature were set at 35 °C, with a filter constant of 3.6 s, and a PFV of 1.1.

2.3.2. Mass Spectrometry Conditions

The ion source was an electrospray ion source (ESI). High-purity nitrogen (N2) was used as a sheath gas (30 arb) and auxiliary gas (10 arb). High-purity helium (He) was used as a collision gas. In positive-ion mode, the conditions were as follows: source temperature, 375 °C; source voltage, 4.5 kV; capillary voltage, 50 V; and tube lens, 100 V. Full scan data acquisition (mass range: m/z 100–2000) and a data-dependent MS2 scan were performed. The collision energy was adjusted to 35% of the maximum and the isolation width of the precursor ions was set at 1.0.

2.4. Preparation of the Sample and Reference Solutions

2.4.1. Sample Preparations

During the optimization and method validation processes, 20 compound glycyrrhizin tablets were accurately weighed and ground into fine powder. An appropriate amount (equivalent to 25 mg of glycine, 25 mg of methionine and 25 mg of glycyrrhizic acid) was accurately weighed and placed in a 100 mL volumetric flask. Thirty milliliters of 50% ethanol solution was added, shaken well for more than 5 min and further diluted with 50% ethanol solution. The sample solutions were shocked, mixed well and then filtered through 0.22 μm membrane filters before the analysis.
The sample stock solution was exposed to a 1 M hydrochloric acid solution for 2 h; a 1 M sodium hydroxide solution for 2 h; a 3% hydrogen peroxide solution for 2 h; an 80 °C water bath for 48 h; and a UV wavelength of 365 nm for 7 days in the experiment to investigate sample degradation. The prepared sample needed to be neutralized before being analyzed, and the corresponding blank solution was obtained via the same method.

2.4.2. Mixed Standard Solutions and Reference Solution

The accurately weighed glycine, methionine and monoammonium glycyrrhizinate reference substances were dissolved in 50% ethanol solution and quantitatively diluted to obtain a mixed standard solution, with a concentration of approximately 250 μg mL−1.
The desired reference solution was prepared by diluting 1.0 mL of the sample solution in a 50 mL volumetric flask with the diluent.

3. Results and Discussion

3.1. Method Development and Optimization

The glycine and methionine contained in CGTs are hydrophilic compounds with relatively high polarity. In reversed-phase high-performance liquid chromatography, it is often necessary to use a high proportion of aqueous phase, or even 100% of aqueous phase, as the initial condition for analysis to better improve the retention of polar substances. In this study, an AQ chromatographic columncolumn that can withstand 100% water as the mobile phase was first selected for condition optimization. Furthermore, the ion-pair reagents were added to the mobile phase to enhance the retention of amino acids on the chromatographic column, thereby improving the separation effect. According to the references, trifluoroacetic acid (TFA) and heptafluorobutyric acid (HFBA) at different concentrations were investigated [32,33]. TFA was set at 0.1%, 0.2%, 0.3% and 0.5%, and HFBA was set at 0 mM, 1 mM, 3 mM and 5 mM. The results showed that as the amount of TFA gradually increased, the retention of glycine enhanced, and its separation from adjacent impurities became better. Additionally, the peak shapes of each component gradually became sharp and symmetrical, as shown in Figure 1. However, as the amount of HFBA increased, there was no significant increase in the components. However, the baseline noise did increase, which might have been due to the higher boiling point of HFBA. Finally, 0.5% TFA was added into the mobile phase as the main component and each impurity were baseline separated.
The evaporation temperature affects the detection performance of CAD by influencing the nebulization efficiency of the eluent [34]. This study examined the relationships among the evaporation temperature, the analyte response and the background noise. Overall, a higher evaporation temperature was found to be beneficial to the response of the impurities because the attenuation of background noise was more significant than that of the response. Nebulization temperatures of 30 °C, 35 °C, 40 °C, 45 °C and 50 °C were each investigated. The results showed that at the nebulization temperature of 35 °C, the response values of various components were optimal. Therefore, the nebulization temperature of 35 °C was selected.

3.2. Identification of Impurity Structure

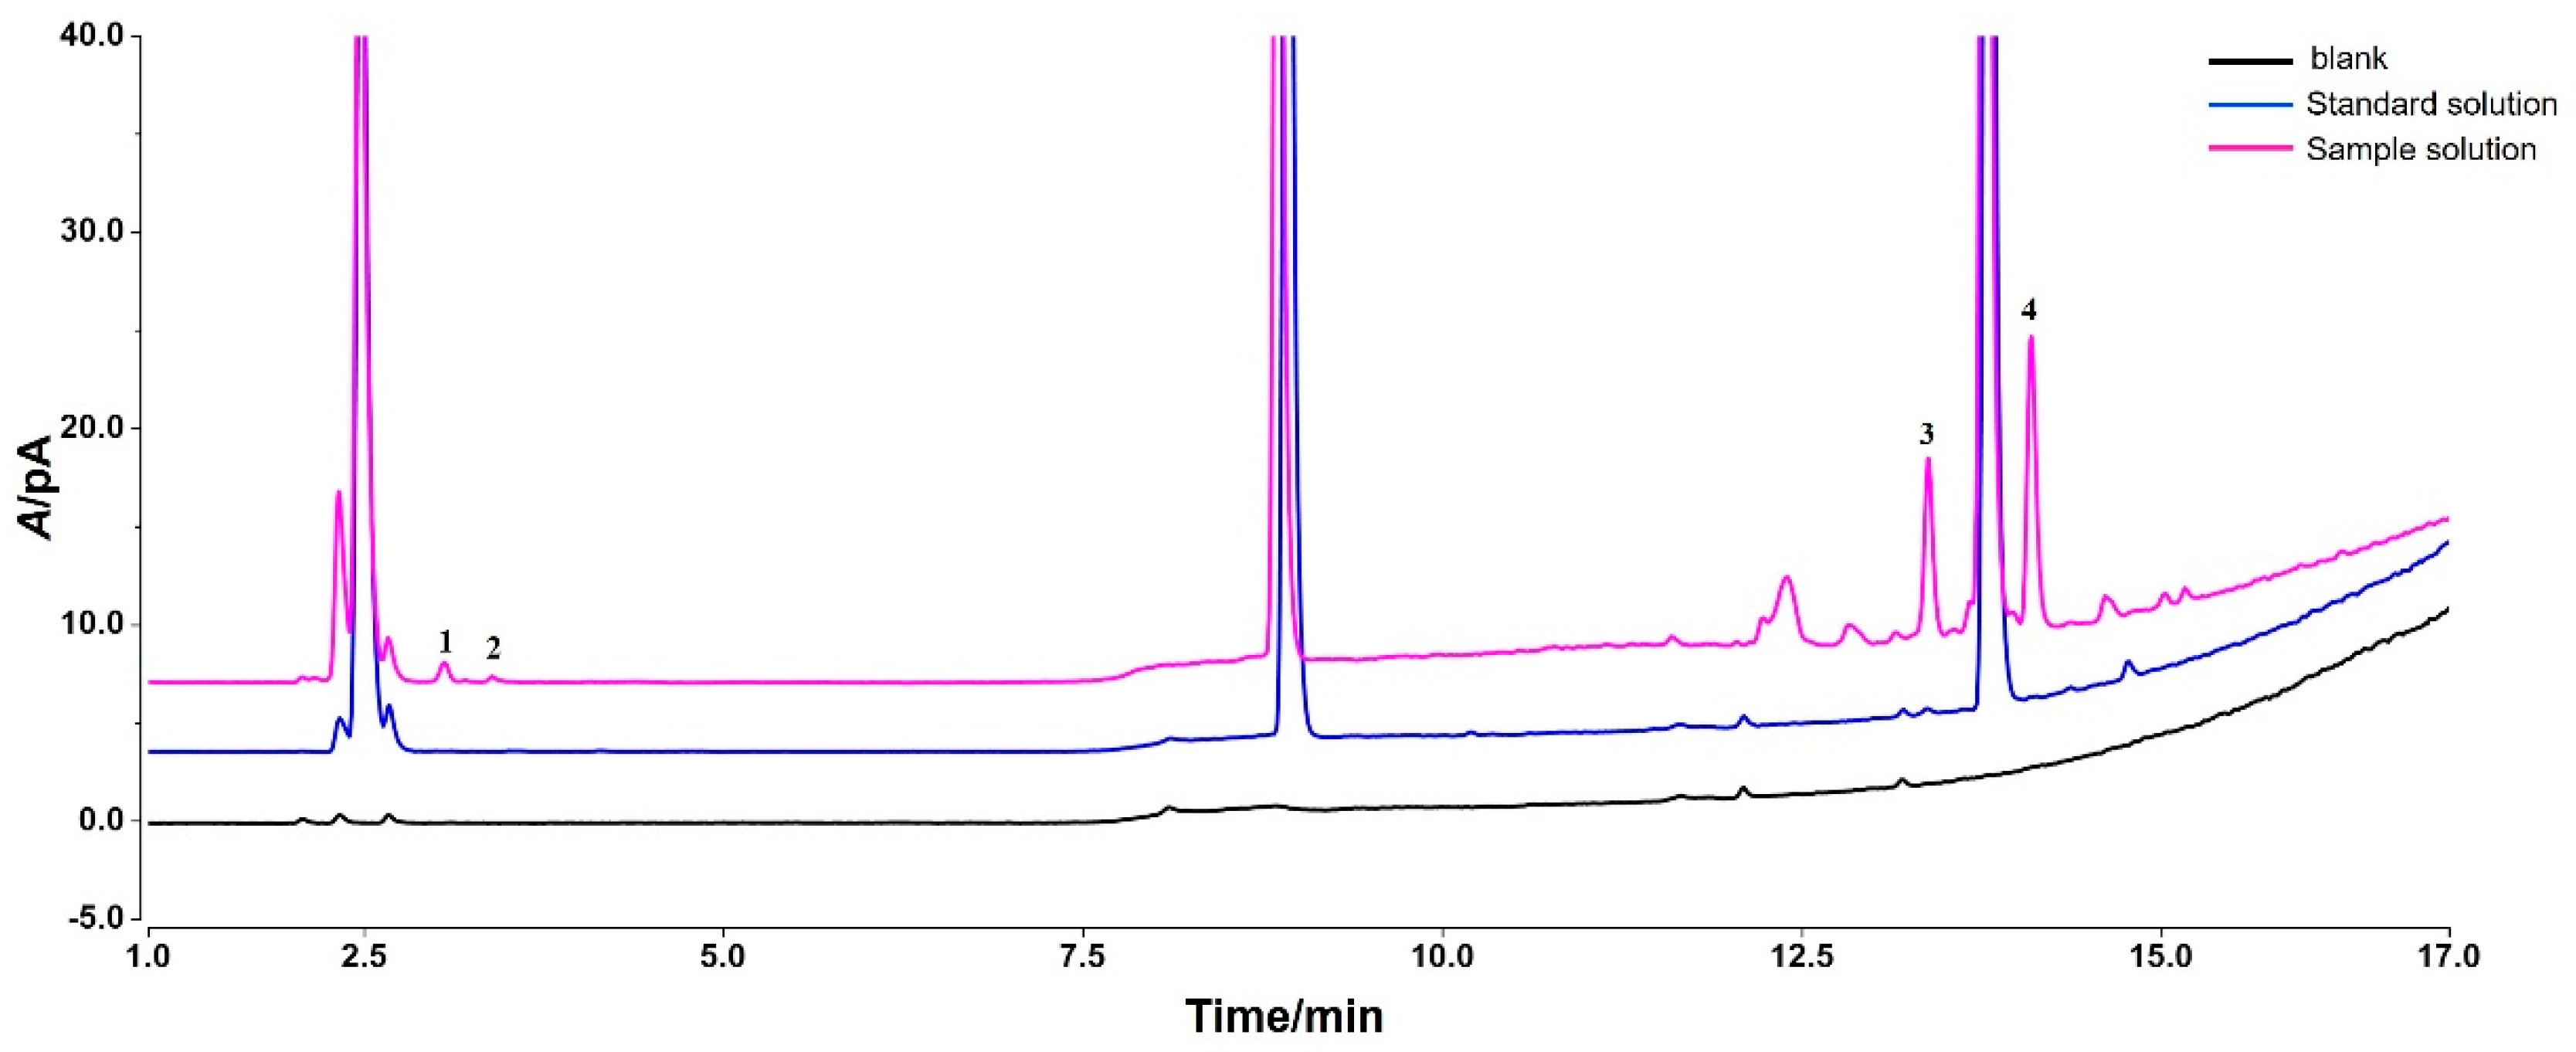
Impurities have a huge impact on the quality, safety and efficacy of drugs [35]. A forced degradation test was conducted to explore the potential impurities of CGTs. The goal of the study was to achieve 10–20% total degradation of the APIs. The results showed that the sample solution was relatively stable under the degradation conditions of acid, alkali, light and heat, and no obvious degradation products were produced. After oxidative degradation, the methionine showed instability. The impurities with retention times of 3.1 min (Impurity 1) and 3.4 min (Impurity 2) were generated after a reaction with 3% hydrogen peroxide for 2 h. Under each degradation condition, mass balance was basically achieved. The unstable amino acid methionine and glycyrrhizic acid component impurities therein were identified. The [M + H]+ values of each impurity were obtained through the first-level data generated by the mass spectrometry. Next, the MS/MS experiment was conducted to obtain more structural information about the impurities.
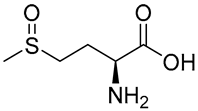
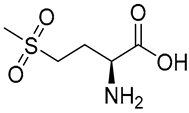
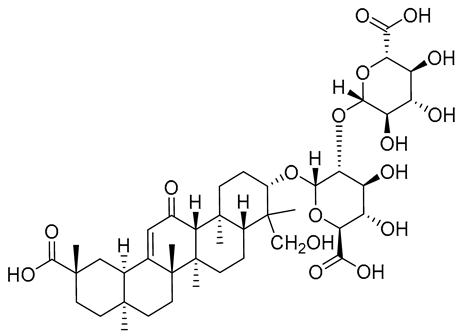
Impurity 1 exhibited a [M + H]+ value at m/z 166.05316 and fragment ion peaks at m/z 148.95 [M-NH3 + H]+ and m/z 131.00 [M-NH3-H2O + H]+. According to these mass data and the literature [36], Impurity 1 was deduced to be methionine sulfoxide. Correspondingly, Impurity 2 was identified as methionine sulfone by a combination of HRMS and MS/MS in a previous study [37]. Impurities 3 and 4 belonged to the process-related impurities of glycyrrhizin. The structures of these two kinds of impurities were chemically similar to glycyrrhizin. In the MS/MS spectrum, they all produced a base peak at [Aglycone + H-H2O]+, by successive losses of characteristic sugar moieties, such as 176 Da (glucuronide). Based on the analysis of the relative retention time of the impurities in the glycyrrhizin raw materials, according to European Pharmacopeia standards, their structures were characterized as glycyrrhizin G2 (Impurity 3) and 18α-glycyrhizin (impurity 4), according to a comparative analysis of the mass data and the literature [38,39,40,41]. Finally, the single standard solutions with possible impurities in the candidate list were analyzed to confirm the identification results. The relevant chromatograms are shown in Figure 2 and the impurity information is presented in Table 1.

3.3. Validation of the Developed Method

The developed method was thoroughly validated, as per the ICH Q2(R1) guidelines [42]. It targeted the principal components and impurities of CGTs to ensure its reliability and accuracy. The principal components were detected using the external standard method, and the impurities of the CGTs were quantified via the principal component control method. Due to the fact that most impurities in CGTs come from glycyrrhizin, this part was characterized by glycyrrhizin-related impurities (Impurities 3 and 4).

3.3.1. Specificity

The mixed standard solution and the sample solution were analyzed using the ion-pair HPLC–CAD method, and the corresponding chromatograms were recorded. Under these chromatographic conditions, the retention times of glycine, methionine and glycyrrhizin were 2.40 min, 8.78 min and 13.71 min, respectively.
Combined with the forced degradation test, the results showed that the blank solution did not interfere with the determination of the components to be tested. The test solutions were unstable under oxidation conditions and obvious impurities were generated. The impurities and the APIs achieved baseline separation under the optimal condition.

3.3.2. Precision and Repeatability

Good precision and repeatability are essential for the accuracy of the method. According to the validation requirements of ICH guideline Q2(R1), the precision RSDs of multi-component drug content determination should be less than 2.0% and the acceptance criteria for impurity inspection can be moderately relaxed. The mixed standard solutions and the reference solution were continuously analyzed six times. The determination results showed that the RSDs of glycine, methionine and glycyrrhizin were 1.95%, 0.86% and 1.30%, respectively. The RSD of 2% glycyrrhizin (approximately 5 μg mL−1) in the reference solution was 0.99%. For the repeatability, it was evaluated by analyzing six freshly prepared samples. The results showed that the RSDs of glycine, methionine and glycyrrhizin were 0.90%, 1.11% and 1.14%, respectively. The RSDs of glycyrrhizin Impurity 3 and glycyrrhizin Impurity 4 were 2.15% and 1.52%, respectively.

3.3.3. Linearity

An appropriate amount of the mixed standard substances of glycine, methionine and glycyrrhizin were diluted with 50% ethanol solution to obtain different concentrations. Additionally, an appropriate amount of the sample solution was measured and diluted with 50% ethanol solution to obtain a series of reference solutions of 10.0%, 5.0%, 2.0%, 1.0% and 0.5%. A calibration curve was created by plotting the peak area (y) versus the concentration (x) at five points. As shown in Table 2, the linear response curves showed coefficients of determination ranging between 0.9990 and 0.9994.

3.3.4. Sensitivity

The reference solution was diluted with 50% ethanol solution to the required different concentrations. The sample concentration with a signal-to-noise ratio (S/N) of 10:1 was set as the limit of quantification (LOQ), and the sample concentration with a signal-to-noise ratio (S/N) of 3:1 was set as the limit of detection (LOD). The results showed that the LOQ was 0.25 μg mL−1 and the LOD was 0.125 μg mL−1 (corresponding to 0.1% and 0.05% of the glycyrrhizin in CGTs, respectively).

3.3.5. Stability

The mixed standard solutions and the sample solution were placed at room temperature for 0 h, 2 h, 4 h, 6 h, 8 h, 12 h, 18 h and 24 h, and they were then analyzed using the developed method. The results showed that after being placed at room temperature for 24 h, the RSD values of glycine, methionine and glycyrrhizin in the standard solution were 1.77%, 1.95% and 1.28%, respectively. The RSD values of glycine, methionine and glycyrrhizin in the sample solution were 0.82%, 1.39% and 1.74%, respectively.

3.3.6. Accuracy

The accuracy of the determination of the components was evaluated by carrying out recovery experiments for each of the analytes that were spiked into the real samples. The results shown in Table 3 indicate that the average recovery rates of Gly, Met and GR were 100.6%, 99.70% and 97.62%, respectively, and that the RSD values were 2.25%, 2.09% and 2.01%, respectively.

3.3.7. Robustness

The column temperature (30 °C ± 5 °C), flow rate (0.8 mL min−1 ± 0.05 mL min−1) and nebulizer temperature (35 °C ± 5 °C) were slightly changed to evaluate the robustness of the method. The results in Table 4 indicate that minor changes in the column temperature, flow rate and CAD nebulizer temperature did not affect the determination of the glycine, methionine or glycyrrhizin content in CGTs (RSD ≤ 5.0%). Taking Impurities 3 and 4 of glycyrrhizin in the sample as the investigation targets, the results showed that minor changes did not affect the determination of the main impurities in CGTs.

3.4. Content Determination

CGTs from different batch numbers were analyzed using the developed ion-pair HPLC–CAD method. The contents of Gly, Met and GR were calculated by the external standard method. The relevant impurities were determined via the principal component control method. As shown in Table 5, the main component in all three batches met the requirements of the drug standard. In the impurity determination, the methionine sulfone content, a degradation product of methionine, was not detected in the freshly prepared samples. The content of glycyrrhizin Impurity 4 (18α-glycyrhizin) was the highest, and its content exceeded 6.0% in all three batches of CGTs. The content of Impurity 3 (glycyrrhizin G2) ranged from 3.80% to 4.92%.

4. Conclusions

In conclusion, an ion-pair HPLC–CAD method was developed in this study for the detection of APIs and impurities in CGTs. This method is capable of simultaneously achieving the separation and detection of both polar and non-polar compounds, as well as substances with strong and weak UV absorption characteristics. The selectivity, precision, accuracy, sensitivity and robustness of this method were validated in accordance with ICH guidelines. The validation results indicated that the method demonstrated high accuracy and sensitivity. Furthermore, in conjunction with HRMS, five potential impurities were identified and confirmed. Collectively, the method established in this study was characterized by its simplicity and rapid operation. It allowed for the determination of the API content and related impurities, without necessitating derivatization. This research has provided a valuable reference for the simultaneous analysis of polar and non-polar compounds, regardless of their UV absorption properties.

Author Contributions

Writing—original draft preparation, formal analysis and project administration, L.Z.; conceptualization, data curation and supervision, W.S.; validation and data curation, Y.G.; methodology and visualization, T.Z.; investigation and writing—review and editing, X.Q.; writing—review and editing, X.L. and H.L.; resources and formal analysis, Q.J. and R.Z.; supervision, project administration and funding acquisition, G.S. All authors have read and agreed to the published version of the manuscript.

Funding

The work was sponsored by the CAMS Initiative Fund for Innovative Medicine (No. 2021-I2M-1-070); the National Pharmacopoeia Commission’s national drug standards revision research fund (No. 2024H05); and the Young Talent Program of the Health Care Commission of Xinjiang Autonomous Region (No. WJWY-202424).

Data Availability Statement

The data are available on request from the authors.

Conflicts of Interest

The authors declare no conflicts of interest.

References

  1. Song, L.; Xie, X.; Sun, J.; Huang, S.; Li, X.; Peng, G.; Gao, X.; Zheng, Y. Structural identification and comprehensive comparison of saponin-related impurities present in the three different compound glycyrrhizin tablets. J. Pharm. Biomed. Anal. 2023, 229, 115287. [Google Scholar] [CrossRef]
  2. Renda, G.; Gökkaya, I.; Şöhretoğlu, D. Immunomodulatory properties of triterpenes. Phytochem. Rev. 2022, 21, 537–563. [Google Scholar] [CrossRef] [PubMed]
  3. Lin, C.C.; Wang, P.H. Intravenous glycyrrhizin improved serum transaminases rapidly in a chronic hepatitis B patient with acute exacerbation. J. Formos. Med. Assoc. 2015, 114, 188–189. [Google Scholar] [CrossRef]
  4. Baltina, L.A. Chemical modification of glycyrrhizic acid as a route to new bioactive compounds for medicine. Curr. Med. Chem. 2003, 10, 155–171. [Google Scholar] [CrossRef]
  5. Shi, G.F.; Xu, J.; Zhou, B.H.; Deng, L.; Chen, X.F. Study on new process for the production and purification of monoammonium glycyrrhizinate. Sci. Technol. Food Ind. 2011, 32, 324–326. [Google Scholar]
  6. Shi, G.F.; Gong, J.H.; Chen, X.F.; Wang, G.Y.; Wang, H.Y. Orthogonal array design for the optimization of monoammonium glycyrrhizinate purification by activated carbon adsorption-ethanol recrystallization. Food Sci. 2013, 34, 125–128. [Google Scholar]
  7. Shen, H.P. Efficacy observation of compound glycyrrhizin tablets combined with traditional Chinese medicine in the treatment of chronic eczema. China Pharm. 2010, 21, 4560. [Google Scholar]
  8. Mingwei, Z.; Zhaojie, C.; Chunmin, L. Effect of compound glycyrrhizinon vitiligo in middle-aged and elderly patients. Chin. J. Geriatr. 2014, 34, 5715–5717. [Google Scholar]
  9. Huang, F.; Fu, Q.; Zhou, Z.; Tang, L.; Zhao, M.; Huang, M.; Zhou, X. Compound glycyrrhizin tablets combined with the 308 nm excimer laser in the treatment of vitiligo: A systematic review and meta-analysis. J. Cosmet. Dermatol. 2023, 22, 2930–2939. [Google Scholar] [CrossRef]
  10. Feng, X.Y.; Feng, Z.T.; Ma, Y.Z. Clinical trial of compound glycyrrhizin tablets in the treatment of autoimmune hepatitis-primary biliary cirrhosis overlap syndrome. Chin. J. Clin. Pharmacol. 2018, 34, 240–243. [Google Scholar]
  11. Luo, L.P. Clinical effect of ursodeoxycholic acid capsules combined with compound glycyrrhizin tablets in the treatment of steatohepatitis. Chin. J. Clin. Ration. Drug Use 2022, 15, 24–27. [Google Scholar]
  12. Jitrangsri, K.; Kamata, K.; Akiba, M.; Yajiri, Y.; Ishibashi, M.; Tatsuzaki, J. Tsutomu Ishikawa. Is 18α-Glycyrrhizin a real natural product? Improved preparation of 18α-Glycyrrhizin from 18β-Glycyrrhizin as a positive standard for HPLC analysis of licorice extracts. J. Nat. Med. 2022, 76, 367–378. [Google Scholar] [CrossRef]
  13. Ito, Y.; Ishizaki, K.; Sugimoto, N.; Tada, A.; Akiyama, T.; Sato, K.; Akiyama, H.; Goda, Y. Confirmation of the configuration of two glucuronic acid units in glycyrrhizic acid. Jpn. J. Food Chem. Saf. 2015, 22, 32–37. [Google Scholar]
  14. European Directorate for the Quality of Medicines & HealthCare. European Pharmacopoeia 11.0, Ammonium Glycyrrhizate; European Directorate for the Quality of Medicines & HealthCare: Strasbourg, France, 2023; p. 1953. [Google Scholar]
  15. United States Pharmacopoeia, Ammonium Glycyrrhizate. Available online: https://online.uspnf.com/uspnf/document/1_GUID-DB67280F-5E0B-413A-8153-509BC15687DD_2_en-US (accessed on 5 January 2024).
  16. Wahl, O.; Holzgrabe, U. Amino acid analysis for pharmacopoeial purposes. Talanta 2016, 154, 150–163. [Google Scholar] [CrossRef] [PubMed]
  17. Herbert, P.; Barros, P.; Ratola, N.; Alves, A. HPLC determination of amino acids in musts and port wine using OPA/FMOC derivatives. J. Food Sci. 2000, 65, 1130–1133. [Google Scholar] [CrossRef]
  18. Erbersdobler, H.F.; Greulich, H.G.; Trautwein, E. Determination of taurine in foods and feeds using an amino acid analyser. J. Chromatogr. A 1983, 254, 332–334. [Google Scholar] [CrossRef]
  19. Pawellek, R.; Holzgrabe, U. Performance of ion pairing chromatography and hydrophilic interaction liquid chromatography coupled to charged aerosol detection for the analysis of underivatized amino acids. J. Chromatogr. A 2021, 1659, 462613. [Google Scholar] [CrossRef]
  20. Cecchi, T. Ion pairing chromatography. Crit. Rev. Anal. Chem. 2008, 38, 161–213. [Google Scholar] [CrossRef]
  21. Cecchi, T. Theoretical models of ion pair chromatography: A close up of recent literature production. J. Liq. Chromatogr. Relat. Technol. 2015, 38, 404–414. [Google Scholar] [CrossRef]
  22. Ahmad, I.A.H.; Blasko, A.; Tam, J.; Variankaval, N.; Halsey, H.M.; Hartman, R.; Regalado, E.L. Revealing the inner workings of the power function algorithm in Charged Aerosol Detection: A simple and effective approach to optimizing power function value for quantitative analysis. J. Chromatogr. A 2019, 1601, 1–7. [Google Scholar] [CrossRef]
  23. Ahmad, I.A.H.; Blasko, A.; Wang, H.; Lu, T.; Mangion, I.; Regalado, E.L. Charged aerosol detection in early and late-stage pharmaceutical development: Selection of regression models at optimum power function value. J. Chromatogr. A 2021, 1641, 461997. [Google Scholar] [CrossRef]
  24. Schilling, K.; Holzgrabe, U. Recent applications of the Charged Aerosol Detector for liquid chromatography in drug quality control. J. Chromatogr. A 2020, 1619, 460911. [Google Scholar] [CrossRef]
  25. Pawellek, R.; Muellner, T.; Gamache, P.; Holzgrabe, U. Power function setting incharged aerosol detection for the linearization of detector response–optimization strategies and their application. J. Chromatogr. A 2021, 1637, 461844. [Google Scholar] [CrossRef]
  26. Khoomrung, S.; Chumnanpuen, P.; Jansa-Ard, S.; Stahlman, M.; Nookaew, I.; Boren, J.; Nielsen, J. Rapid quantification of yeast lipid using microwave-assisted total lipid extraction and HPLC-CAD. Anal. Chem. 2013, 85, 4912–4919. [Google Scholar] [CrossRef]
  27. Furota, S.; Ogawa, N.O.; Takano, Y.; Yoshimura, T.; Ohkouchi, N. Quantitative analysis of underivatized amino acids in the sub- to several-nanomolar range by ion-pair HPLC using a corona charged aerosol detector (HPLC-CAD). J. Chromatogr. B 2018, 1095, 191–197. [Google Scholar] [CrossRef] [PubMed]
  28. Pawellek, R.; Schilling, K.; Holzgrabe, U. Impurity profiling of L-aspartic acid and glycine using high-performance liquid chromatography coupled with charge daerosol and ultraviolet detection. J. Pharm. Biomed. Anal. 2020, 183, 113149. [Google Scholar] [CrossRef] [PubMed]
  29. Qiu, X.; Zuo, L.; Sun, S.; Zhao, X.; Xu, S.; Zhu, Z.; Zhao, T.; Sun, Z.; Yao, J.; Shan, G. Impurity profiling of Compound Amino Acid Injection (6AA) using ion-pair high performance liquid chromatography coupled with corona-charged aerosol detection and high resolution mass spectrometry. J. Pharm. Biomed. Anal. 2021, 201, 110325. [Google Scholar] [CrossRef] [PubMed]
  30. Hutchinson, J.P.; Li, J.; Farrell, W.; Groeber, E.; Szucs, R.; Dicinoski, G.; Haddad, P.R. Universal response model for a corona charged aerosol detector. J. Chromatogr. A 2010, 1217, 7418–7427. [Google Scholar] [CrossRef]
  31. Dixon, R.W.; Peterson, D.S. Development and testing of a detection method for liquid chromatography based on aerosol charging. Anal. Chem. 2002, 74, 2930–2937. [Google Scholar] [CrossRef]
  32. Petritis, K.N.; Person, M.; Elfakir, C.; Dreux, M. Validation of an ion-interaction chromatography analysis of underivatized amino acids in commercial preparation using evaporative light scattering detection. Chromatographia 2004, 60, 293–298. [Google Scholar] [CrossRef]
  33. McCalley, D.V. Effect of buffer on peak shape of peptides in reversed-phase high performance liquid chromatography. J. Chromatogr. A 2004, 1038, 77–84. [Google Scholar] [CrossRef] [PubMed]
  34. Liu, G.J.; Zhu, B.Q.; Ren, X.J.; Wang, J. Universal response method for the quantitative analysis of multi-components in josamycin and midecamycin using liquid chromatography coupled with charged aerosol detector. J. Pharm. Biomed. Anal. 2021, 192, 113679. [Google Scholar] [CrossRef] [PubMed]
  35. Huo, Y.T.; Xu, K.H.; Lu, Y.T.; Ma, L.M.; Zhou, C.L.; Hang, T.J.; Song, M. Characterization of structurally related peptide impurities using HPLC-QTOF-MS/MS: Application to Cbf-14, a novel antimicrobial peptide. Anal. Bioanal. Chem. 2022, 414, 6485–6495. [Google Scholar] [CrossRef] [PubMed]
  36. Tanaka, R. New polar constituents of the pupae of the silkworm Bombyx mori L. I. Isolation and identification of methionine sulfoxide, methionine sulfone, and gamma-cyclic di-L-glutamate. Biosci. Biotechnol. Biochem. 2007, 71, 3055–3062. [Google Scholar] [CrossRef]
  37. Xu, G.; Chance, M.R. Radiolytic Modification of Sulfur-Containing Amino Acid Residues in Model Peptides: Fundamental Studies for Protein Foot printing. Anal. Chem. 2005, 77, 2437–2449. [Google Scholar] [CrossRef]
  38. Mu, Q.E.; Liu, Y.P.; Li, M.; Wang, Y.; Xin, D. Analysis of related substances of monoammonium glycyrrhizinate by LC-MSn. Chin. J. Pharm. 2009, 40, 844–847. [Google Scholar]
  39. Zhao, Y.Y.; Liu, L.Y.; Han, Y.Y.; Wang, Y.; Shi, M.J. Spectral Characteristics and Structure Identification of Principal Components and Related Substances in Bulk Drug of Ammonium Glycyrrhizate. Chin. J. Pharm. 2014, 45, 663–670. [Google Scholar]
  40. Song, W.; Si, L.L.; Ji, S.; Wang, H.; Fang, X.M.; Yu, L.Y.; Li, R.Y.; Liang, L.N.; Zhou, D.M.; Ye, M. Uralsaponins M–Y, antiviral triterpenoid saponins from the roots of Glycyrrhiza uralensis. J. Nat. Prod. 2014, 77, 1632–1643. [Google Scholar] [CrossRef]
  41. Zheng, Y.F.; Qi, L.W.; Zhou, J.L.; Li, P. Structural characterization and identification of oleanane-type triterpene saponins in Glycyrrhiza uralensis Fischer by rapid resolution liquid chromatography coupled with time-of-flight mass spectrometry. Rapid Commun. Mass. Spectrom. 2010, 24, 3261–3270. [Google Scholar] [CrossRef]
  42. International Council for Harmonisation of Technical Requirements for Pharmaceuticals for Human Use (2022) ICH Harmonized Tripartite Guidelines Q2(R2), Geneva. Available online: https://database.ich.org/sites/default/files/Q2%28R1%29%20Guideline.pdf (accessed on 24 March 2022).
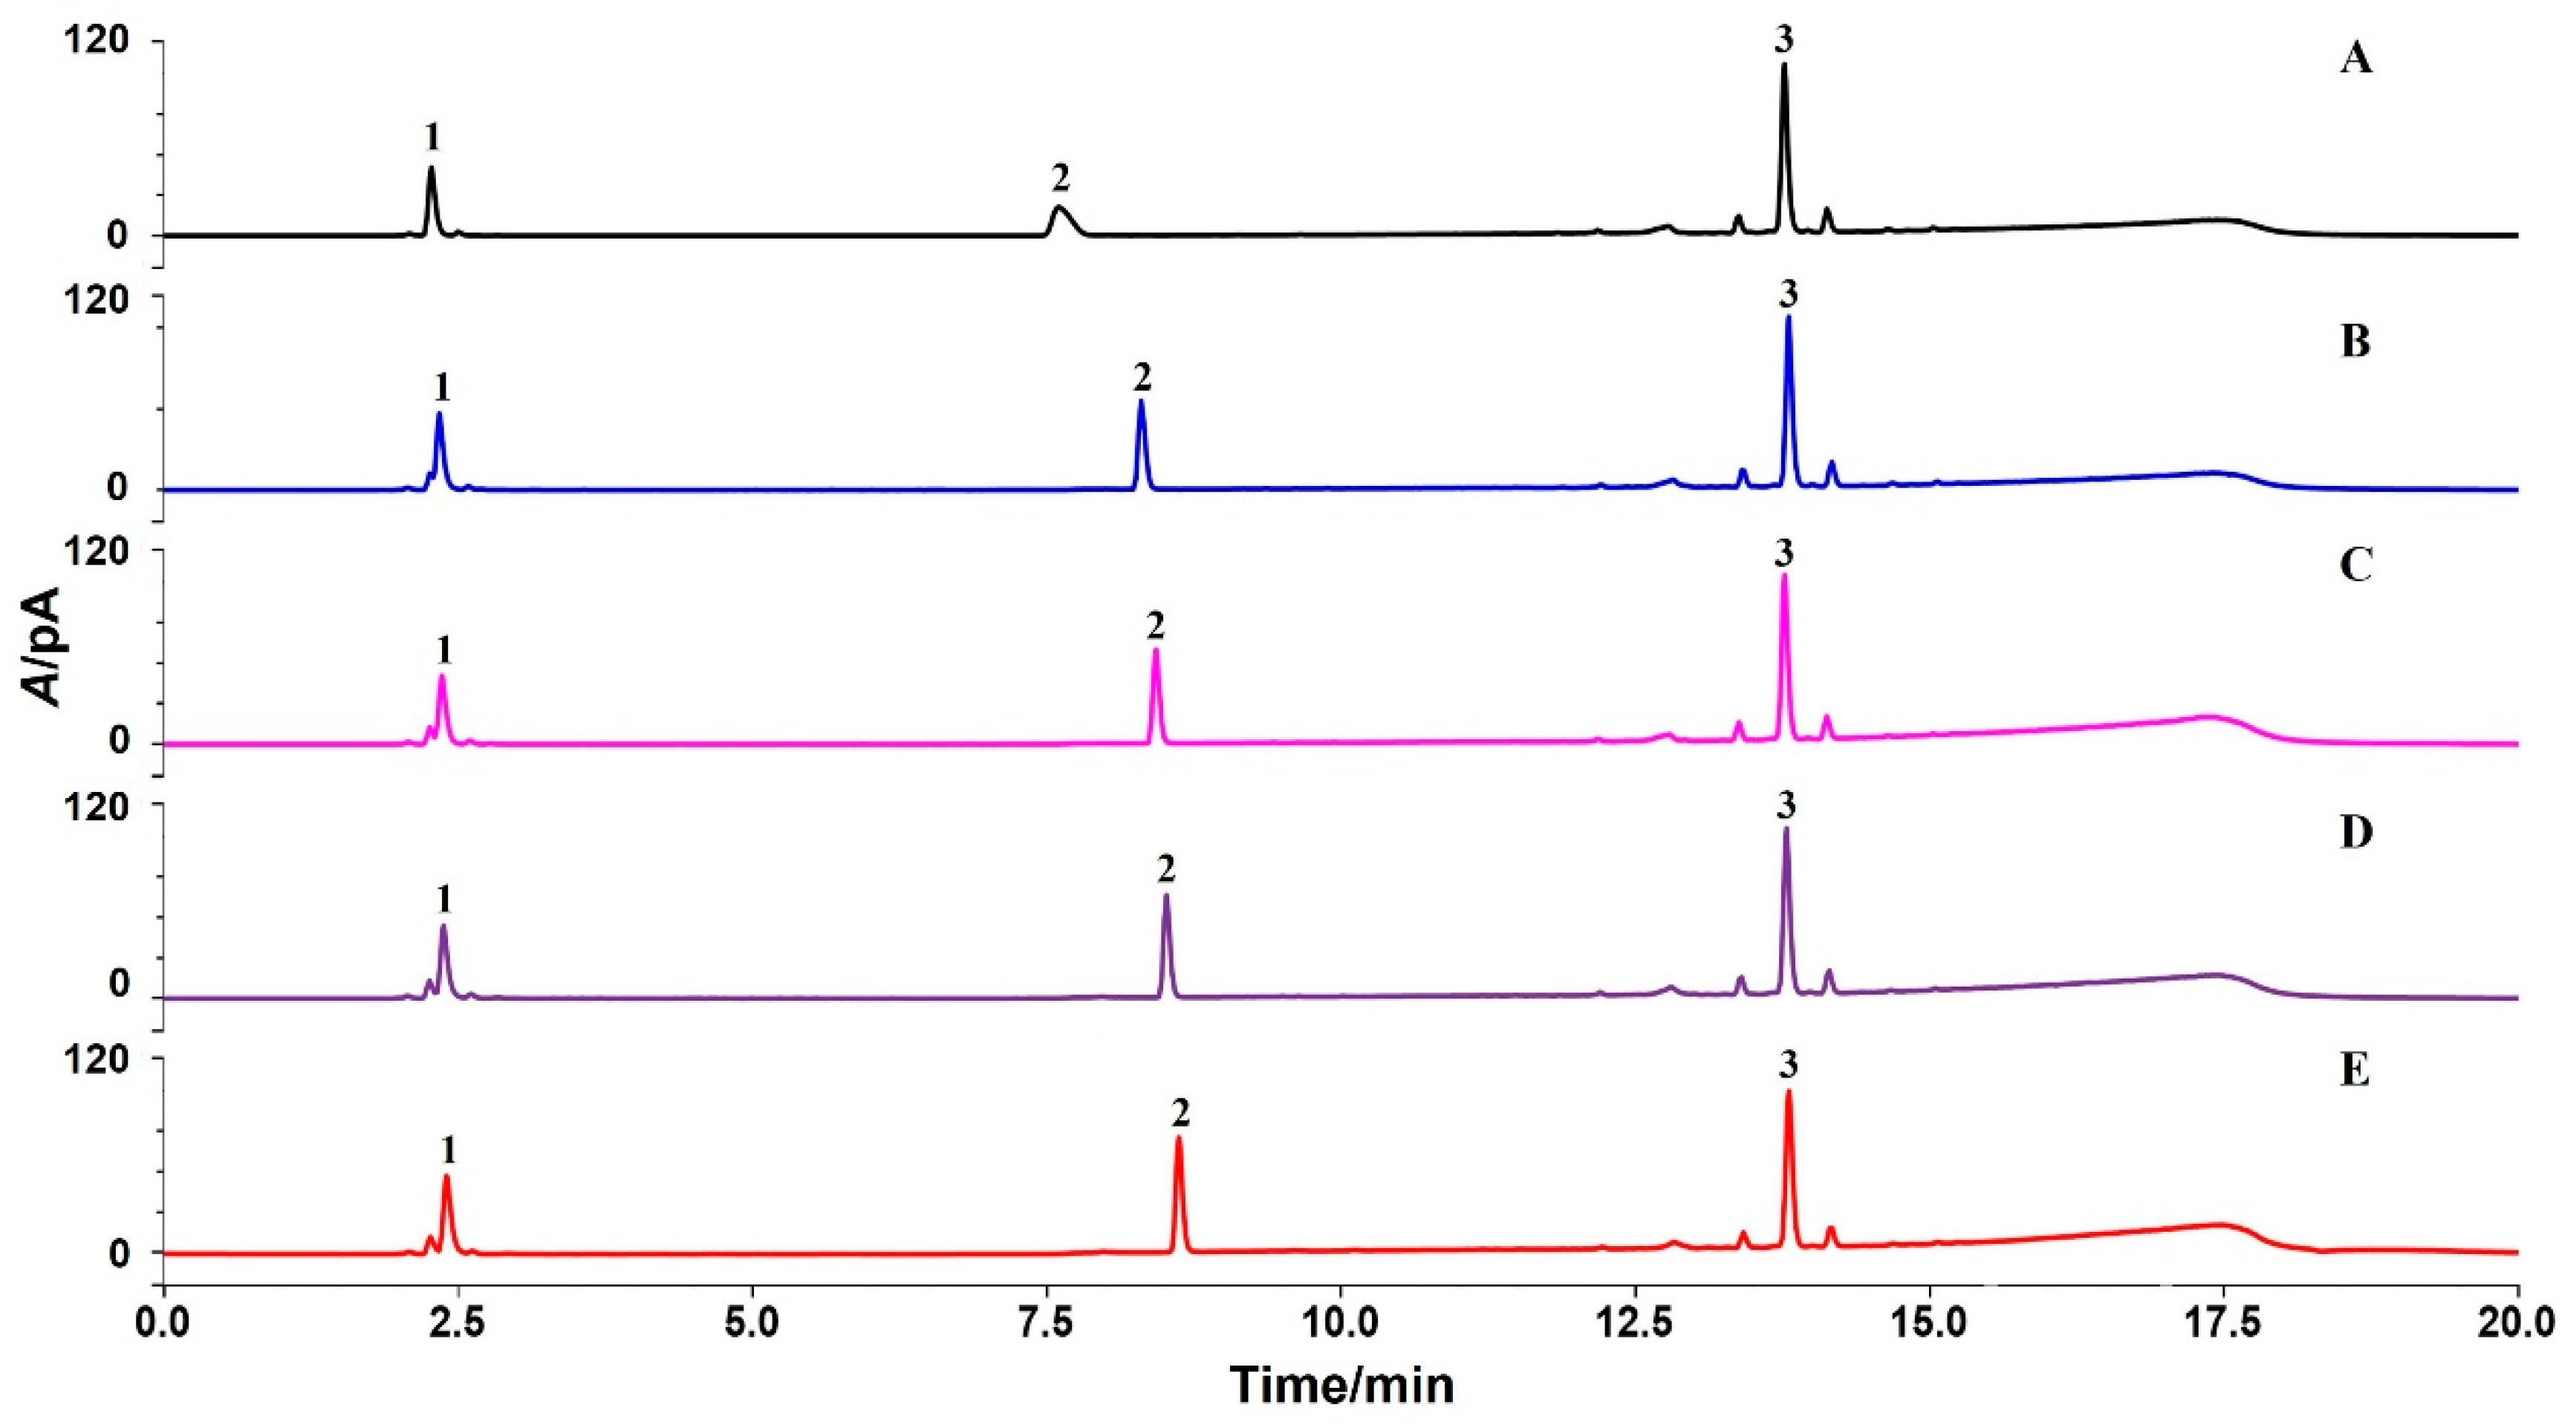
Figure 1. Chromatograms of compound glycyrrhizin tablets under different chromatographic conditions. Mobile phase: water (containing different concentrations of TFA) and acetonitrile; gradient elution; column temperature, 30 °C; and flow rate, 0.8 mL min−1. (A) TFA concentrations of 0.1%; (B) TFA concentrations of 0.2%; (C) TFA concentrations of 0.3%; (D) TFA concentrations of 0.4%; (E) TFA concentrations of 0.5%. Peaks identification: 1. Glycine, 2. Methionine and 3. Glycyrrhizin.
Separations 12 00168 g001
Figure 2. Chromatograms of compound glycyrrhizin tablets under optimal conditions. Mobile phase, water (0.5% TFA) and acetonitrile; gradient elution; column temperature, 30 °C; flow rate, 0.8 mL min−1; and CAD evaporation temperature, 35 °C. Numbers 1–4 represent methionine sulfoxide, methionine sulfone, glycyrrhizin G2 and 18α-glycyrhizin, respectively.
Separations 12 00168 g002
Table 1. The m/z values, formulas and proposed chemical structures of CGTs.
ImpurityRT/min[M + H]+DeviationMS/MS DataFormulasIdentificationStructure
13.06166.05316−0.47148.95, 131.00, 95.85, 74.97C5H11NO3SMethionine sulfoxideSeparations 12 00168 i001
23.39182.04802−0.72165.06, 155.01, 123.04, 104.88C5H11NO4SMethionine sulfoneSeparations 12 00168 i002
313.38839.40598−0.26821.06, 663.45, 627.31, 487.42, 469.32C42H62O17Glycyrrhizin G2Separations 12 00168 i003
414.09823.411991.12777.49, 647.52, 471.62, 453.30, 435.50, 407.08C42H62O1618α-glycyrhizinSeparations 12 00168 i004
Table 2. Calibration curves and corresponding determination coefficient for analytes.
ComponentsStandard Range
(mg mL−1)
Calibration CurveCorrelation Coefficient
(r)
Gly0.1325–0.5300y = 9.1203x + 1.38470.9990
Met0.1249–0.4996y = 13.517x + 1.74080.9991
GR0.1151–0.4604y = 16.659x + 1.42820.9992
Reference solution of GR0.5–10.0%y = 0.1534x + 0.04830.9994
Table 3. The results of recovery rate experiments.
ComponentInitial Amount (mg)Amount Added (mg)Average Amount
Found (mg)
Recovery (%)Average Recovery (%, n = 6)RSD/%
Gly1.1491.3252.535104.6100.62.25
1.1491.3252.46199.04
1.1491.3252.501102.0
1.1491.3252.46599.29
1.1491.3252.46098.93
1.1491.3252.47399.92
Met1.1501.2492.37998.4099.702.09
1.1501.2492.415101.3
1.1501.2492.432102.6
1.1501.2492.39299.45
1.1501.2492.39699.71
1.1501.2492.35896.73
GR1.1091.1512.20094.7697.622.01
1.1091.1512.22596.94
1.1091.1512.22897.24
1.1091.1512.24498.58
1.1091.1512.23397.60
1.1091.1512.268100.6
Table 4. Robustness of the method.
FactorConditionsGly
(μg ml−1)
Met
(μg ml−1)
GR
(μg ml−1)
Impurity 3
(%)
Impurity 4
(%)
Standard conditions/247.7234.4228.54.407.43
Column temperature (°C)25265.1232.7230.84.518.02
35255.0231.1238.93.886.89
Flow rate (mL min−1)0.75250.4233.5222.64.858.47
0.85270.1235.9234.84.748.21
Nebulizer temperature (°C)30257.2233.7231.24.638.04
40254.5239.7242.54.698.27
RSD%3.091.162.957.076.98
Table 5. The content of each component in CGTs and the test results of impurities in each batch.
BatchGlyMetGRImpurity 1
Methionine Sulfoxide
Impurity 2
Methionine Sulfone
Impurity 3
Glycyrrhizin G2
Impurity 4
18α-glycyrhizin
Total
Unknown Impurities
195.8098.2099.900.12%<LOD4.92%6.60%7.03%
298.43100.3102.50.08%<LOD3.80%6.07%4.35%
396.4096.2797.910.06%<LOD4.70%7.54%6.32%
Disclaimer/Publisher’s Note: The statements, opinions and data contained in all publications are solely those of the individual author(s) and contributor(s) and not of MDPI and/or the editor(s). MDPI and/or the editor(s) disclaim responsibility for any injury to people or property resulting from any ideas, methods, instructions or products referred to in the content.