

Green Extraction Combined with Chemometric Approach: Profiling Phytochemicals and Antioxidant Properties of Ten Species of the Lamiaceae Family

 , ,
, ,  , ,
, ,
Abstract
1. Introduction
2. Materials and Methods
2.1. Materials
2.2. Plant Preparation
2.3. Analysis of Total Phenolic Content
2.4. Total Flavonoid Content Estimation
2.5. DPPH Activity
2.6. Cupric Reducing Antioxidant Capacity (CUPRAC) Assay
2.7. Ferric Reducing Antioxidant Power (FRAP) Assay
2.8. ABTS Assay
2.9. High-Performance Liquid Chromatography (HPLC)
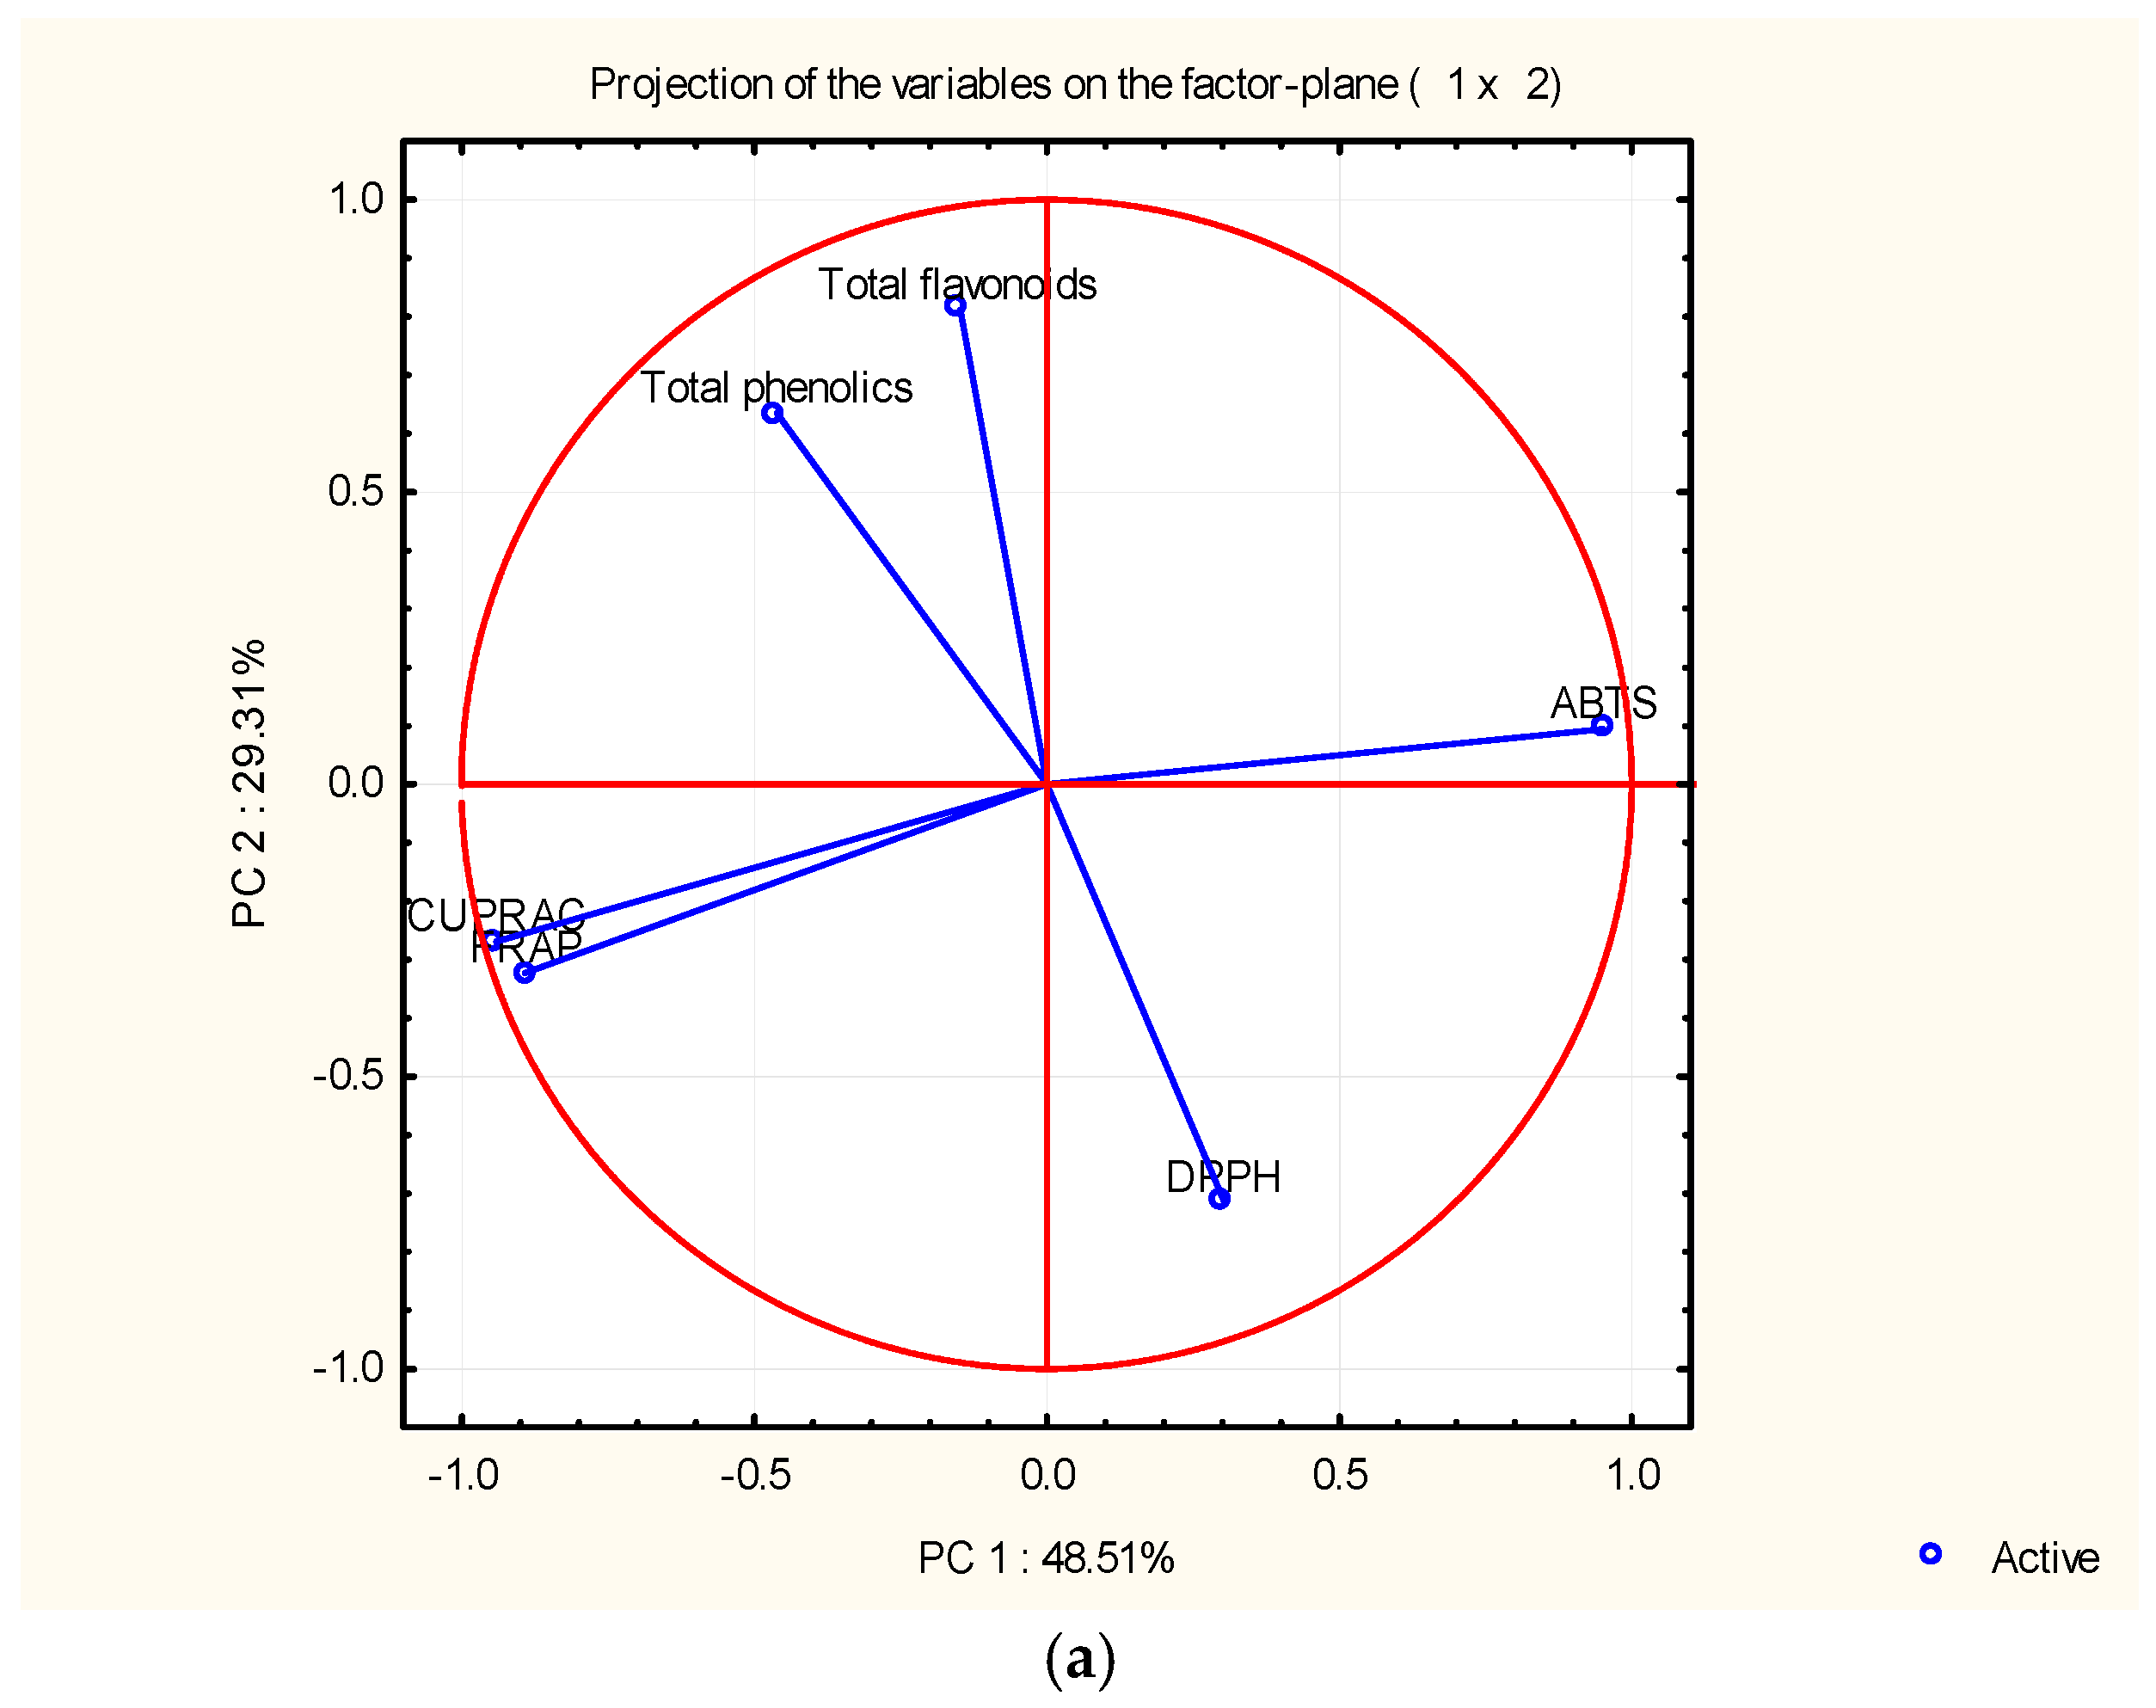
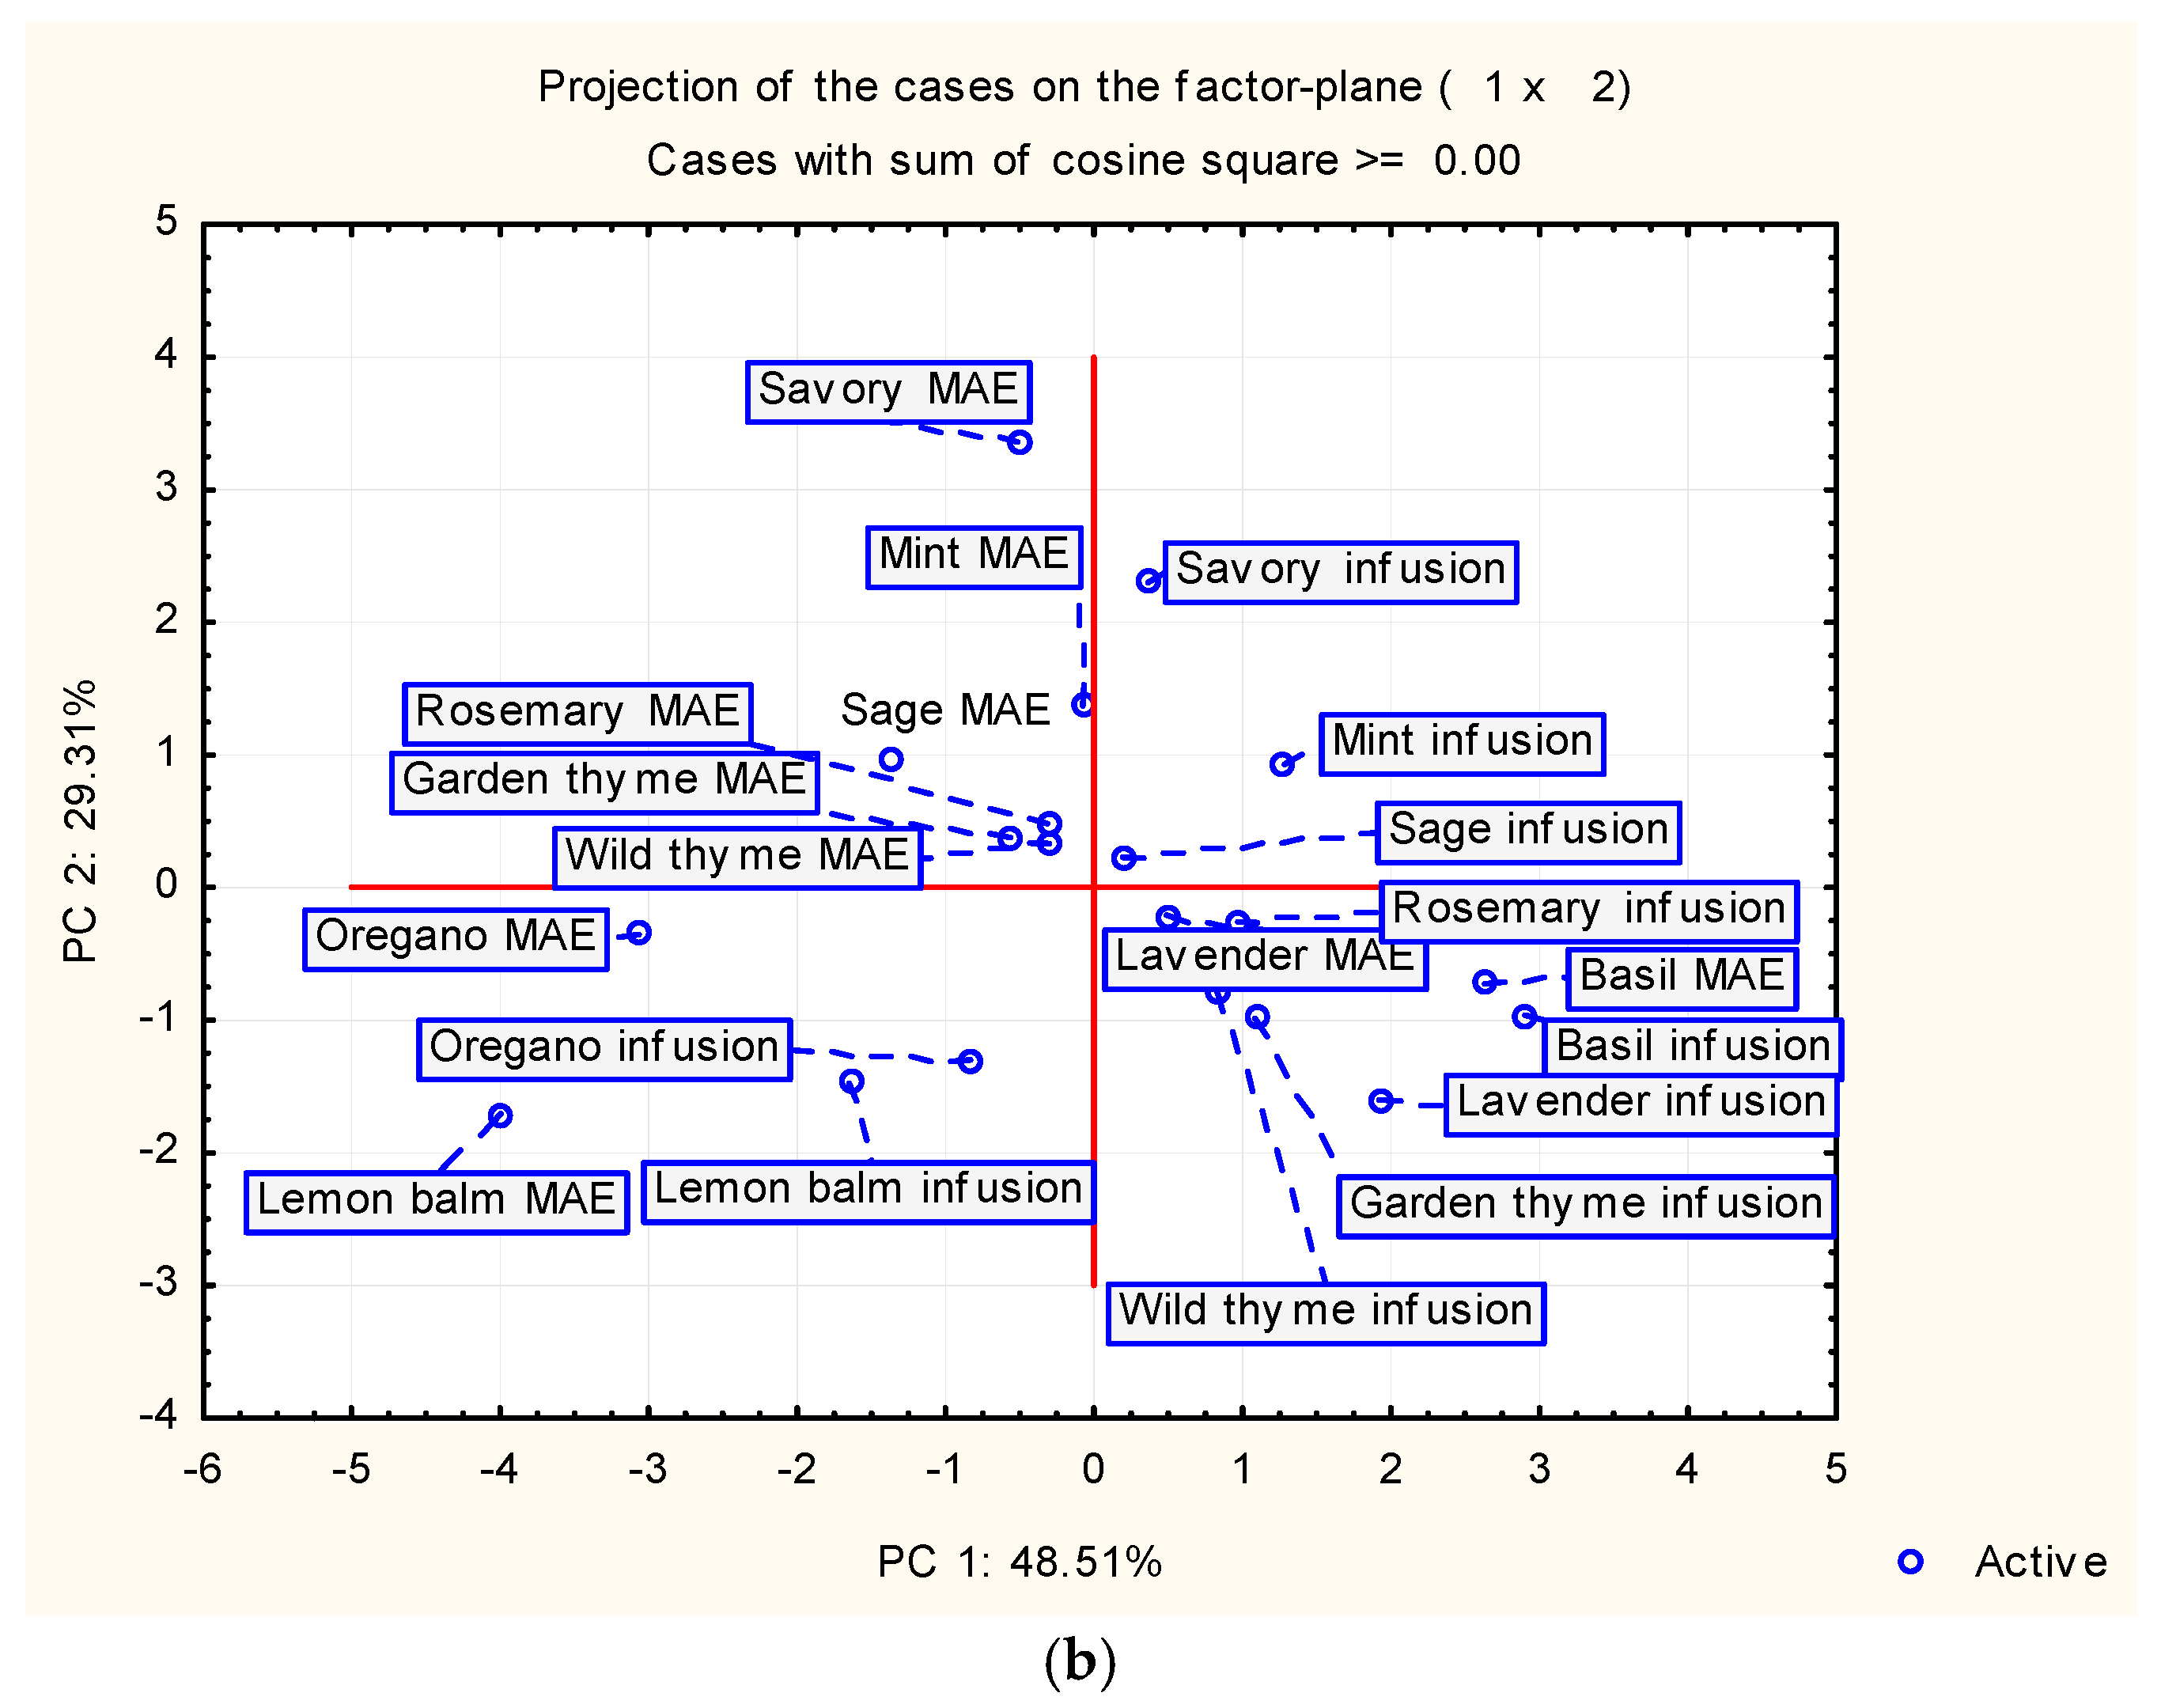
2.10. Chemometric Analysis
3. Results
3.1. Extraction Yield, Total Phenolic Content, and Flavonoid Content
3.2. DPPH and ABTS Test
3.3. FRAP and CUPRAC Assay
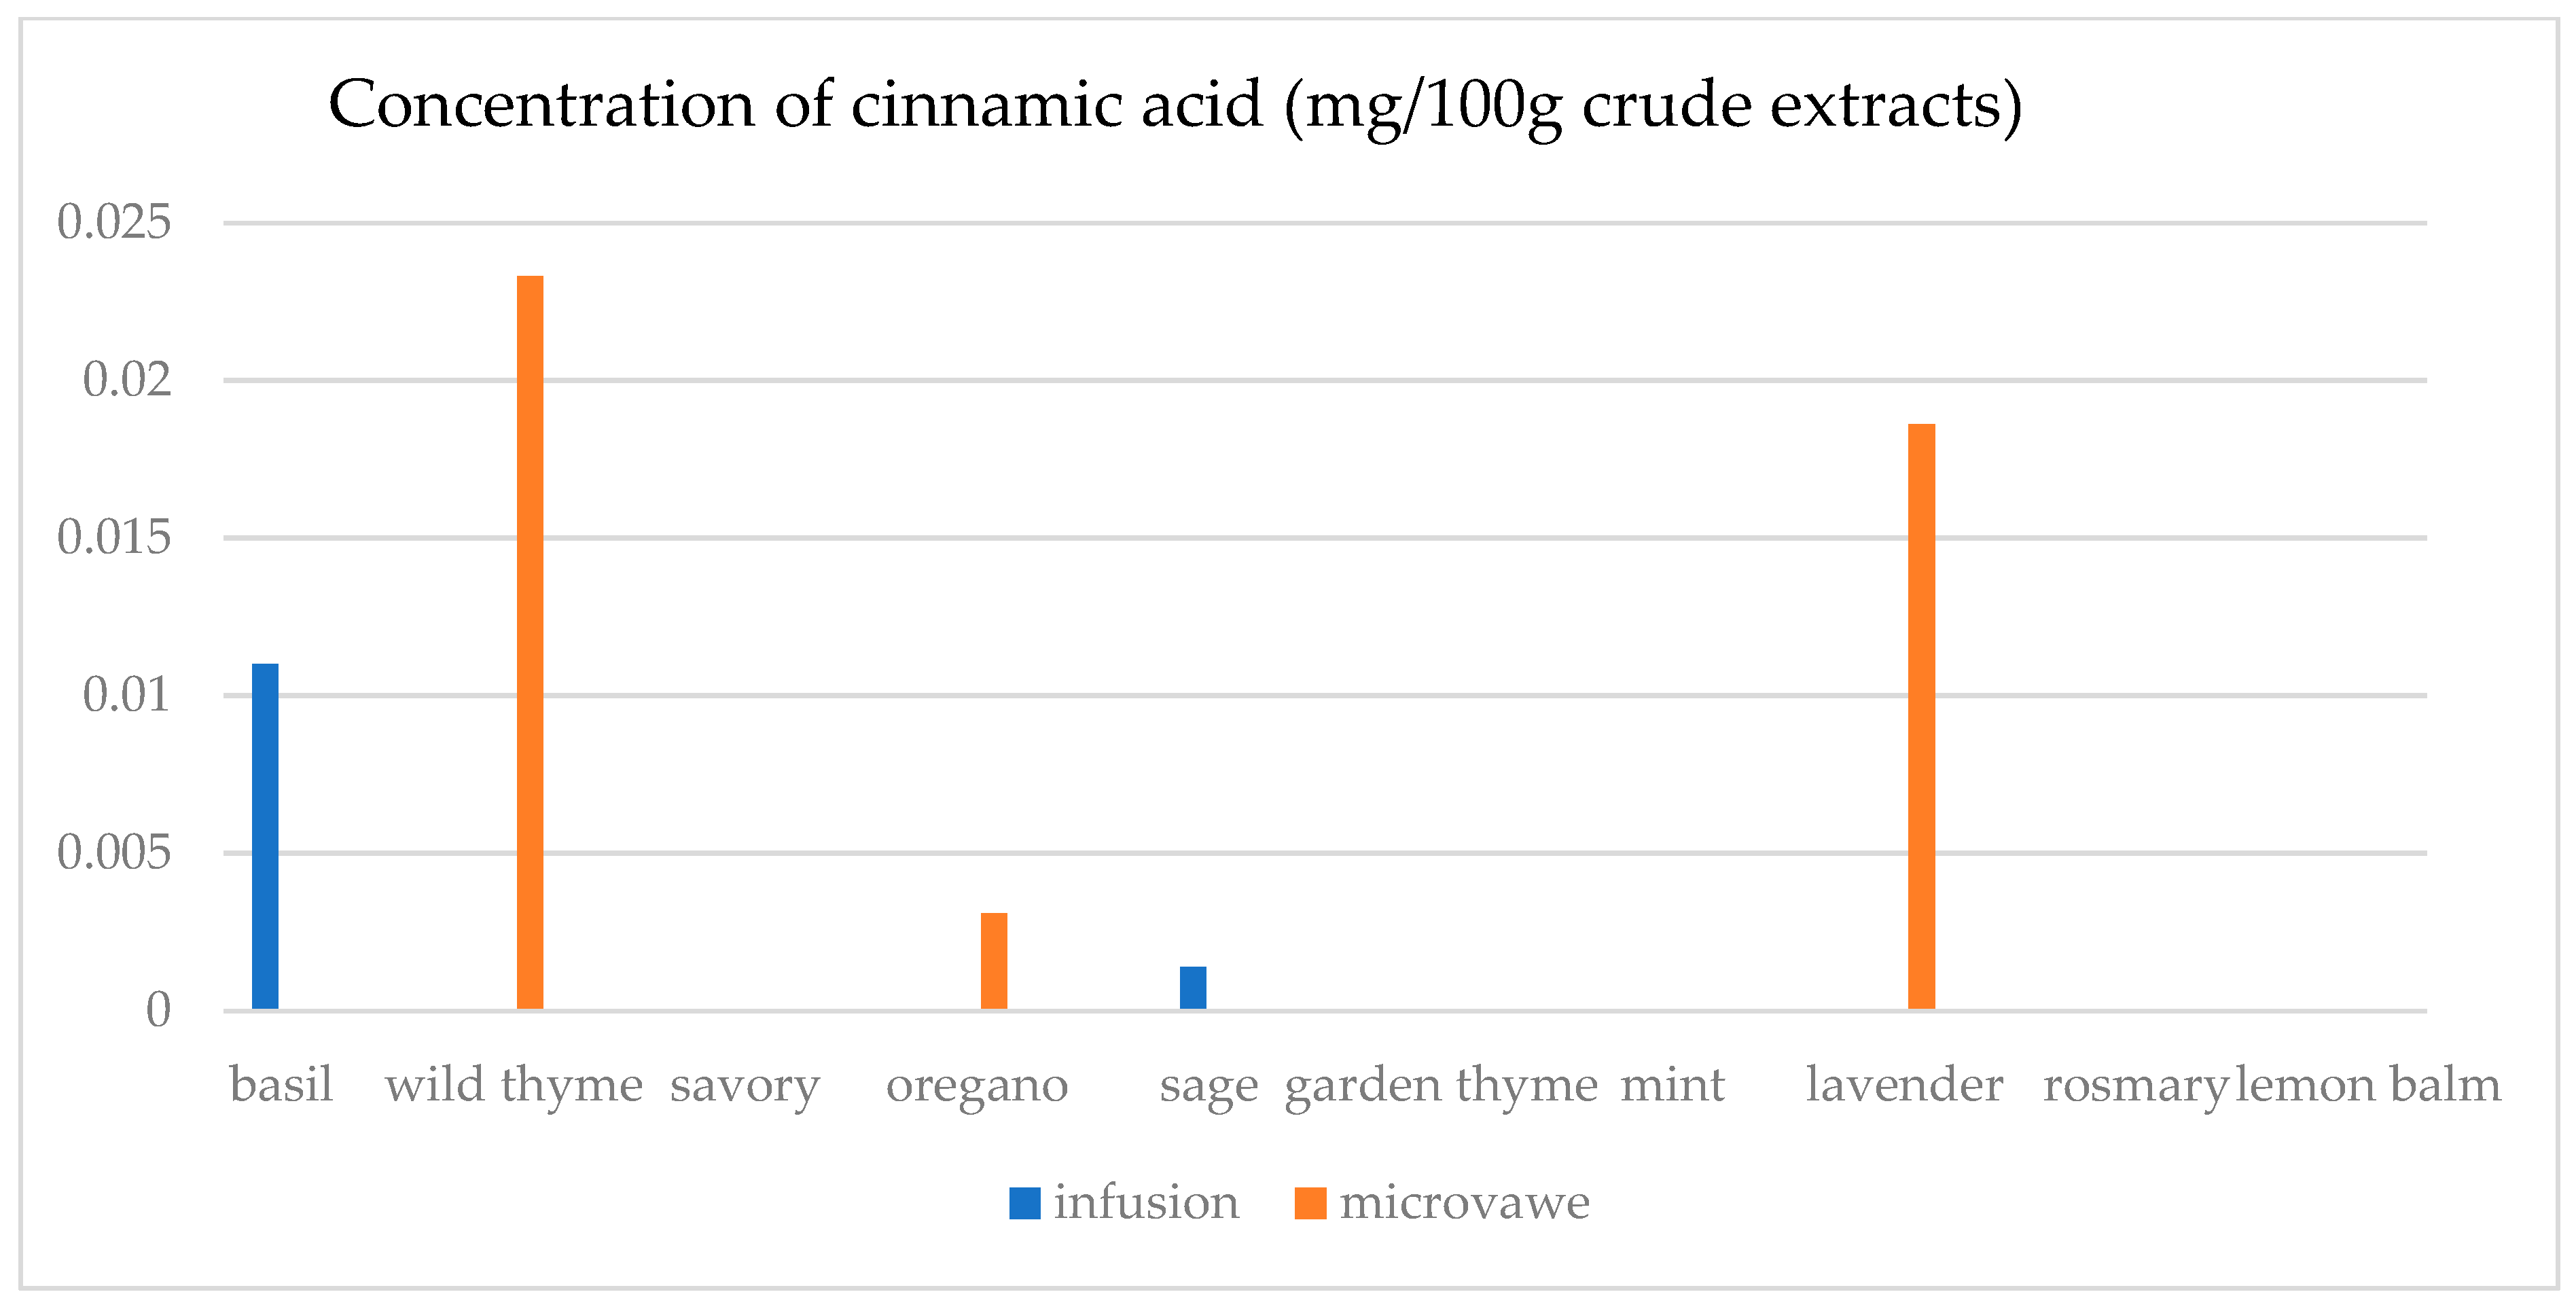
3.4. HPLC
4. Discussion
4.1. Extraction Yield
4.2. Total Phenolic Content
4.3. Flavonoid Content
4.4. DPPH and ABTS Test
4.5. FRAP and CUPRAC Assay
4.6. PCA
4.7. HPLC
5. Conclusions
Author Contributions
Funding
Data Availability Statement
Conflicts of Interest
Abbreviations
| TPC | Total phenolic content |
| FLV | Total flavonoid content |
| GAE | Gallic acid equivalent |
| QE | Quercetin equivalent |
| DPPH | 2,2-Diphenyl-1-picrylhydrazyl |
| ABTS | 2,2′-Azino-bis(3-ethylbenzothiazoline-6-sulfonic acid) |
| FRAP | Ferric reducing antioxidant power |
| CUPRAC | Cupric ion reducing antioxidant capacity |
| HPLC | High-performance liquid chromatography |
| PCA | Principal component analysis |
| MAE | Microwave-assisted extraction |
| GA | Gallic acid |
| ChlA | Chlorogenic acid |
| pHBA | Para hydroxy benzoic acid |
| CafA | Caffeic acid |
| Epi | Epicatechin |
| VA | Vanillic acid |
| ComA | Para coumaric acid |
| FA | Ferulic acid |
| RA | Rosmarinic acid |
| Qu | Quercetin |
| CinA | Cinnamic acid |
| Nar | Naringenin |
Appendix A


References
- Ulewicz-Magulska, B.; Wesolowski, M. Antioxidant activity of medicinal herbs and spices from plants of the Lamiaceae, Apiaceae and Asteraceae families: Chemometric interpretation of the data. Antioxidants 2023, 12, 2039. [Google Scholar] [CrossRef] [PubMed]
- Juan, C.A.; Pérez de la Lastra, J.M.; Plou, F.J.; Pérez-Lebeña, E. The chemistry of reactive oxygen species (ROS) revisited: Outlining their role in biological macromolecules (DNA, lipids and proteins) and induced pathologies. Int. J. Mol. Sci. 2021, 22, 4642. [Google Scholar] [CrossRef]
- Campinho, A.; Alves, J.; Martins, R.; Vieira, M.; Grosso, C.; Delerue-Matos, C. Exploring the antiradical potential of species from lamiaceae family: Implications for functional food development in the context of neurodegenerative and neuropsychiatric diseases. Biol. Life Sci. Forum 2023, 26, 33. [Google Scholar]
- Munteanu, I.G.; Apetrei, C. Analytical methods used in determining antioxidant activity: A review. Int. J. Mol. Sci. 2021, 22, 3380. [Google Scholar] [CrossRef]
- Oalđe, M.M.; Kolarević, S.M.; Živković, J.C.; Vuković-Gačić, B.S.; Marić, J.M.J.; Kolarević, M.J.K.; Đorđević, J.Z.; Aradski, A.Z.A.; Marin, P.D.; Šavikin, K.P. The impact of different extracts of six Lamiaceae species on deleterious effects of oxidative stress assessed in acellular, prokaryotic and eukaryotic models in vitro. Saudi Pharm. J. 2020, 28, 1592–1604. [Google Scholar] [CrossRef] [PubMed]
- Ali, A.; Bashmil, Y.M.; Cottrell, J.J.; Suleria, H.A.; Dunshea, F.R. Lc-ms/ms-qtof screening and identification of phenolic compounds from australian grown herbs and their antioxidant potential. Antioxidants 2021, 10, 1770. [Google Scholar] [CrossRef]
- Kaltsas, A.; Zikopoulos, A.; Moustakli, E.; Zachariou, A.; Tsirka, G.; Tsiampali, C.; Palapela, N.; Sofikitis, N.; Dimitriadis, F. The silent threat to women’s fertility: Uncovering the devastating effects of oxidative stress. Antioxidants 2023, 12, 1490. [Google Scholar] [CrossRef]
- Kuciel-Lewandowska, J.; Kasperczak, M.; Bogut, B.; Heider, R.; Laber, W.T.; Laber, W.; Paprocka-Borowicz, M. The impact of health resort treatment on the nonenzymatic endogenous antioxidant system. Oxid. Med. Cell. Longev. 2020, 2020, 8423105. [Google Scholar] [CrossRef] [PubMed]
- Quílez, M.; Ferreres, F.; López-Miranda, S.; Salazar, E.; Jordán, M.J. Seed oil from Mediterranean aromatic and medicinal plants of the Lamiaceae family as a source of bioactive components with nutritional. Antioxidants 2020, 9, 510. [Google Scholar] [CrossRef]
- Selvi, S.; Polat, R.; Çakilcioğlu, U.; Celep, F.; Dirmenci, T.; Ertuğ, Z.F. An ethnobotanical review on medicinal plants of the Lamiaceae family in Turkey. Turk. J. Bot. 2022, 46, 283–332. [Google Scholar] [CrossRef]
- Ahn, J.; Alford, A.R.; Niemeyer, E.D. Variation in phenolic profiles and antioxidant properties among medicinal and culinary herbs of the Lamiaceae family. J. Food Meas. Charact. 2020, 14, 1720–1732. [Google Scholar] [CrossRef]
- Alara, O.R.; Abdurahman, N.H.; Olalere, O.A. Ethanolic extraction of flavonoids, phenolics and antioxidants from Vernonia amygdalina leaf using two-level factorial design. J. King Saud Univ.-Sci. 2020, 32, 7–16. [Google Scholar] [CrossRef]
- López-Salazar, H.; Camacho-Díaz, B.H.; Ocampo, M.A.; Jiménez-Aparicio, A.R. Microwave-assisted extraction of functional compounds from plants: A Review. Bioresources 2023, 18, 6614–6638. [Google Scholar] [CrossRef]
- Verep, D.; Ateş, S.; Karaoğul, E. A review of extraction methods for obtaining bioactive compounds in plant-based raw materials. Bartın Orman Fakültesi Derg. 2023, 25, 492–513. [Google Scholar] [CrossRef]
- Picot-Allain, C.; Mahomoodally, M.F.; Ak, G.; Zengin, G. Conventional versus green extraction techniques—A comparative perspective. Curr. Opin. Food Sci. 2021, 40, 144–156. [Google Scholar] [CrossRef]
- Chaves, J.O.; De Souza, M.C.; Da Silva, L.C.; Lachos-Perez, D.; Torres-Mayanga, P.C.; Machado, A.P.d.F.; Forster-Carneiro, T.; Vázquez-Espinosa, M.; González-de-Peredo, A.V.; Barbero, G.F. Extraction of flavonoids from natural sources using modern techniques. Front. Chem. 2020, 8, 507887. [Google Scholar] [CrossRef]
- Teofilović, B.; Grujić-Letić, N.; Gligorić, E.; Rašković, A.; Igić, R.; Vastag, G.; Gadžurić, S. Experimental and computational evaluation of extraction procedure and scavenging capacity of sweet basil extracts (Ocimum basilicum L.). Plant Foods Hum. Nutr. 2021, 76, 240–247. [Google Scholar] [CrossRef]
- Mandić, K.N.; Kukrić, Z.; Latinović, S.; Cvjetković, T.; Šobot, T.; Bajić, Z.; Maličević, U.; Marinković, S.; Đukanović, Đ.; Uletilović, S. Antioxidative potential of pomegranate peel extract: In vitro and in vivo studies. Scr. Medica 2023, 54, 9–18. [Google Scholar] [CrossRef]
- Teofilović, B.; Grujić-Letić, N.; Karadžić, M.; Kovačević, S.; Podunavac-Kuzmanović, S.; Gligorić, E.; Gadžurić, S. Analysis of functional ingredients and composition of Ocimum basilicum. S. Afr. J. Bot. 2021, 141, 227–234. [Google Scholar] [CrossRef]
- Blekić, M.; Režek Jambrak, A.; Chemat, F. Mikrovalna ekstrakcija bioaktivnih spojeva. Croat. J. Food Sci. Technol. 2011, 3, 32–47. [Google Scholar]
- Dai, J.; Orsat, V.; Raghavan, G.V.; Yaylayan, V. Investigation of various factors for the extraction of peppermint (Mentha piperita L.) leaves. J. Food Eng. 2010, 96, 540–543. [Google Scholar] [CrossRef]
- Gallego, M.G.; Gordon, M.H.; Segovia, F.J.; Skowyra, M.; Almajano, M.P. Antioxidant properties of three aromatic herbs (rosemary, thyme and lavender) in oil-in-water emulsions. J. Am. Oil Chem. Soc. 2013, 90, 1559–1568. [Google Scholar] [CrossRef]
- Skendi, A.; Irakli, M.; Chatzopoulou, P. Analysis of phenolic compounds in Greek plants of Lamiaceae family by HPLC. J. Appl. Res. Med. Aromat. Plants 2017, 6, 62–69. [Google Scholar] [CrossRef]
- Albayrak, S.; Aksoy, A.; Albayrak, S.; Sagdic, O. In vitro antioxidant and antimicrobial activity of some Lamiaceae species. Iran. J. Sci. 2013, 37, 1–9. [Google Scholar]
- Rahimmalek, M.; Afshari, M.; Sarfaraz, D.; Miroliaei, M. Using HPLC and multivariate analyses to investigate variations in the polyphenolic compounds as well as antioxidant and antiglycative activities of some Lamiaceae species native to Iran. Ind. Crops Prod. 2020, 154, 112640. [Google Scholar] [CrossRef]
- Petkova, N.; Ivanova, L.; Filova, G.; Ivanov, I.; Denev, P. Antioxidants and carbohydrate content in infusions and microwave extracts from eight medicinal plants. J. Appl. Pharm. Sci. 2017, 7, 055–061. [Google Scholar]
- López-Cobo, A.; Gómez-Caravaca, A.M.; Švarc-Gajić, J.; Segura-Carretero, A.; Fernández-Gutiérrez, A. Determination of phenolic compounds and antioxidant activity of a Mediterranean plant: The case of Satureja montana subsp. kitaibelii. J. Funct. Foods 2015, 18, 1167–1178. [Google Scholar] [CrossRef]
- Ilyasov, I.R.; Beloborodov, V.L.; Selivanova, I.A.; Terekhov, R.P. ABTS/PP decolorization assay of antioxidant capacity reaction pathways. Int. J. Mol. Sci. 2020, 21, 1131. [Google Scholar] [CrossRef]
- Prior, R.L.; Wu, X.; Schaich, K. Standardized methods for the determination of antioxidant capacity and phenolics in foods and dietary supplements. J. Agric. Food Chem. 2005, 53, 4290–4302. [Google Scholar] [CrossRef]
- Farnad, N.; Heidari, R.; Aslanipour, B. Phenolic composition and comparison of antioxidant activity of alcoholic extracts of Peppermint (Mentha piperita). J. Food Meas. Charact. 2014, 8, 113–121. [Google Scholar] [CrossRef]
- Gharib, F.; da Silva, J.T. Composition, total phenolic content and antioxidant activity of the essential oil of four Lamiaceae herbs. Med. Aromat. Plant Sci. Biotechnol. 2013, 7, 19–27. [Google Scholar]
- Robu, S.; Aprotosoaie, A.; Miron, A.; Cioancă, O.; Stănescu, U.; Hăncianu, M. In vitro antioxidant activity of ethanolic extracts from some Lavandula species cultivated in Romania. FARMACIA 2012, 60, 394–401. [Google Scholar]
- Popova, A.; Dalemska, Z.; Mihaylova, D.; Hristova, I.; Alexieva, I. Melissa officinalis L.—GC profile and antioxidant activity. Int. J. Pharmacogn. Phytochem. Res. 2016, 8, 634–638. [Google Scholar]
- Sadowska, U.; Armenta Villavicencio, R.; Dziadek, K.; Skoczylas, J.; Sadowski, S.K.; Kopeć, A. The identification of polyphenolic compounds and the determination of antioxidant activity in extracts and infusions of peppermint, lemon balm and lavender. Appl. Sci. 2024, 14, 699. [Google Scholar] [CrossRef]
- Hmidani, A.; Bouhlali, E.d.T.; Ajebli, M.; Khouya, T.; Benlyas, M.; Alem, C. In vitro investigation of antioxidant and antihemolytic activities of three Lamiaceae species from Morocco. Beni-Suef Univ. J. Basic Appl. Sci. 2021, 10, 27. [Google Scholar] [CrossRef]
- Todorović, V.; Dančetović, A.; Dabetić, N.; Šobajić, S.; Vidović, B. Antioksidativna aktivnost odabranih začina sa tržišta Srbije. Hrana Ishr. 2018, 59, 74–79. [Google Scholar] [CrossRef]
- Luca, S.V.; Zengin, G.; Sinan, K.I.; Skalicka-Woźniak, K.; Trifan, A. Post-distillation by-products of aromatic plants from Lamiaceae family as rich sources of antioxidants and enzyme inhibitors. Antioxidants 2023, 12, 210. [Google Scholar] [CrossRef]


| Yield (mg/g CD) | TPC (mg eq GA/g DE) | FLV (mg QE/g DE) | ||||
|---|---|---|---|---|---|---|
| Infusion | Microwave | Infusion | Microwave | Infusion | Microwave | |
| basil | 90.73(2.32) | 130.22(4.17) | 39.58(0.15) | 40.26(1.51) | 4.01(0.06) | 4.46(0.09) |
| wild thyme | 92.81(3.5) | 97.61(2.8) | 25.30(0.61) | 37.85(2.10) | 5.13(0.07) | 7.46(0.12) |
| savory | 82.75(1.47) | 106.47(6.45) | 59.36(0.09) | 69.85(0.34) | 9.90(0.14) | 11.23(0.08) |
| oregano | 116.88(5.18) | 163.35(5.19) | 36.08(1.17) | 48.64(0.27) | 7.37(0.04) | 7.71(0.07) |
| sage | 115.00(4.57) | 150.85(6.13) | 53.97(0.36) | 64.46(0.05) | 5.00(0.02) | 6.72(0.09) |
| garden thyme | 111.89(7.24) | 124.63(4.89) | 37.51(0.85) | 60.42(0.29) | 6.56(0.12) | 8.80(0.06) |
| mint | 196.83(5.28) | 250.75(8.16) | 40.01(0.56) | 48.24(1.69) | 8.18(0.11) | 8.97(0.12) |
| lavender | 121.12(3.25) | 162.03(4.16) | 33.05(0.55) | 47.63(0.11) | 3.14(0.04) | 5.27(0.14) |
| rosemary | 30.94(1.02) | 33.70(1.08) | 43.80(0.73) | 46.54(0.14) | 7.06(0.06) | 10.45(0.05) |
| lemon balm | 217.43(8.65) | 226.55(6.94) | 51.24(0.61) | 53.02(0.50) | 2.62(0.02) | 4.21(0.07) |
| DPPH (µg/mL) | ABTS (µg/mL) | |||
|---|---|---|---|---|
| Infusion | Microwave | Infusion | Microwave | |
| basil | 7.71(0.24) | 7.23(0.18) | 8.55(0.41) | 8.39(0.61) |
| wild thyme | 4.68(0.11) | 3.96(0.18) | 4.44(0.23) | 4.20(0.32) |
| savory | 3.73(0.13) | 2.63(0.11) | 6.12(0.38) | 4.84(0.34) |
| oregano | 7.73(0.49) | 4.88(0.25) | 2.89(0.18) | 1.89(0.09) |
| sage | 5.07(0.14) | 4.53(0.21) | 5.14(0.41) | 3.35(0.22) |
| garden thyme | 8.03(0.17) | 7.67(0.26) | 5.33(0.47) | 4.16(0.32) |
| mint | 4.35(0.23) | 3.81(0.21) | 6.64(0.52) | 4.88(0.34) |
| lavender | 7.22(0.13) | 5.88(0.37) | 6.89(0.53) | 5.00(0.43) |
| rosemary | 7.10(0.15) | 6.84(0.32) | 5.84(0.39) | 4.34(0.38) |
| lemon balm | 6.01(0.24) | 5.70(0.28) | 3.32(0.27) | 1.34(0.11) |
| FRAP mmolFe/g DE | CUPRAC µg TE/mg DE | |||
|---|---|---|---|---|
| Infusion | Microwave | Infusion | Microwave | |
| basil | 1.27(0.03) | 1.88(0.06) | 351.93(11.85) | 333.37(5.90) |
| wild thyme | 3.50(0.01) | 4.11(0.04) | 550.05(43.82) | 780.92(47.07) |
| savory | 2.64(0.03) | 3.08(0.11) | 554.42(15.62) | 559.33(41.13) |
| oregano | 5.46(0.03) | 11.51(0.09) | 956.12(28.84) | 1110.58(43.52) |
| sage | 4.08(0.13) | 3.84(0.13) | 901.54(54.87) | 615.00(42.95) |
| garden thyme | 4.50(0.09) | 3.18(0.09) | 779.83(47.47) | 587.71(43.98) |
| mint | 2.03(0.01) | 3.32(0.07) | 521.12(15.9) | 679.95(21.37) |
| lavender | 2.18(0.07) | 3.46(0.20) | 554.42(29.61) | 597.53(7.38) |
| rosemary | 2.87(0.07) | 4.34(0.08) | 608.45(48.38) | 786.92(7.14) |
| lemon balm | 6.60(0.26) | 14.60(0.12) | 1129.68(44.46) | 1284.69(38.37) |
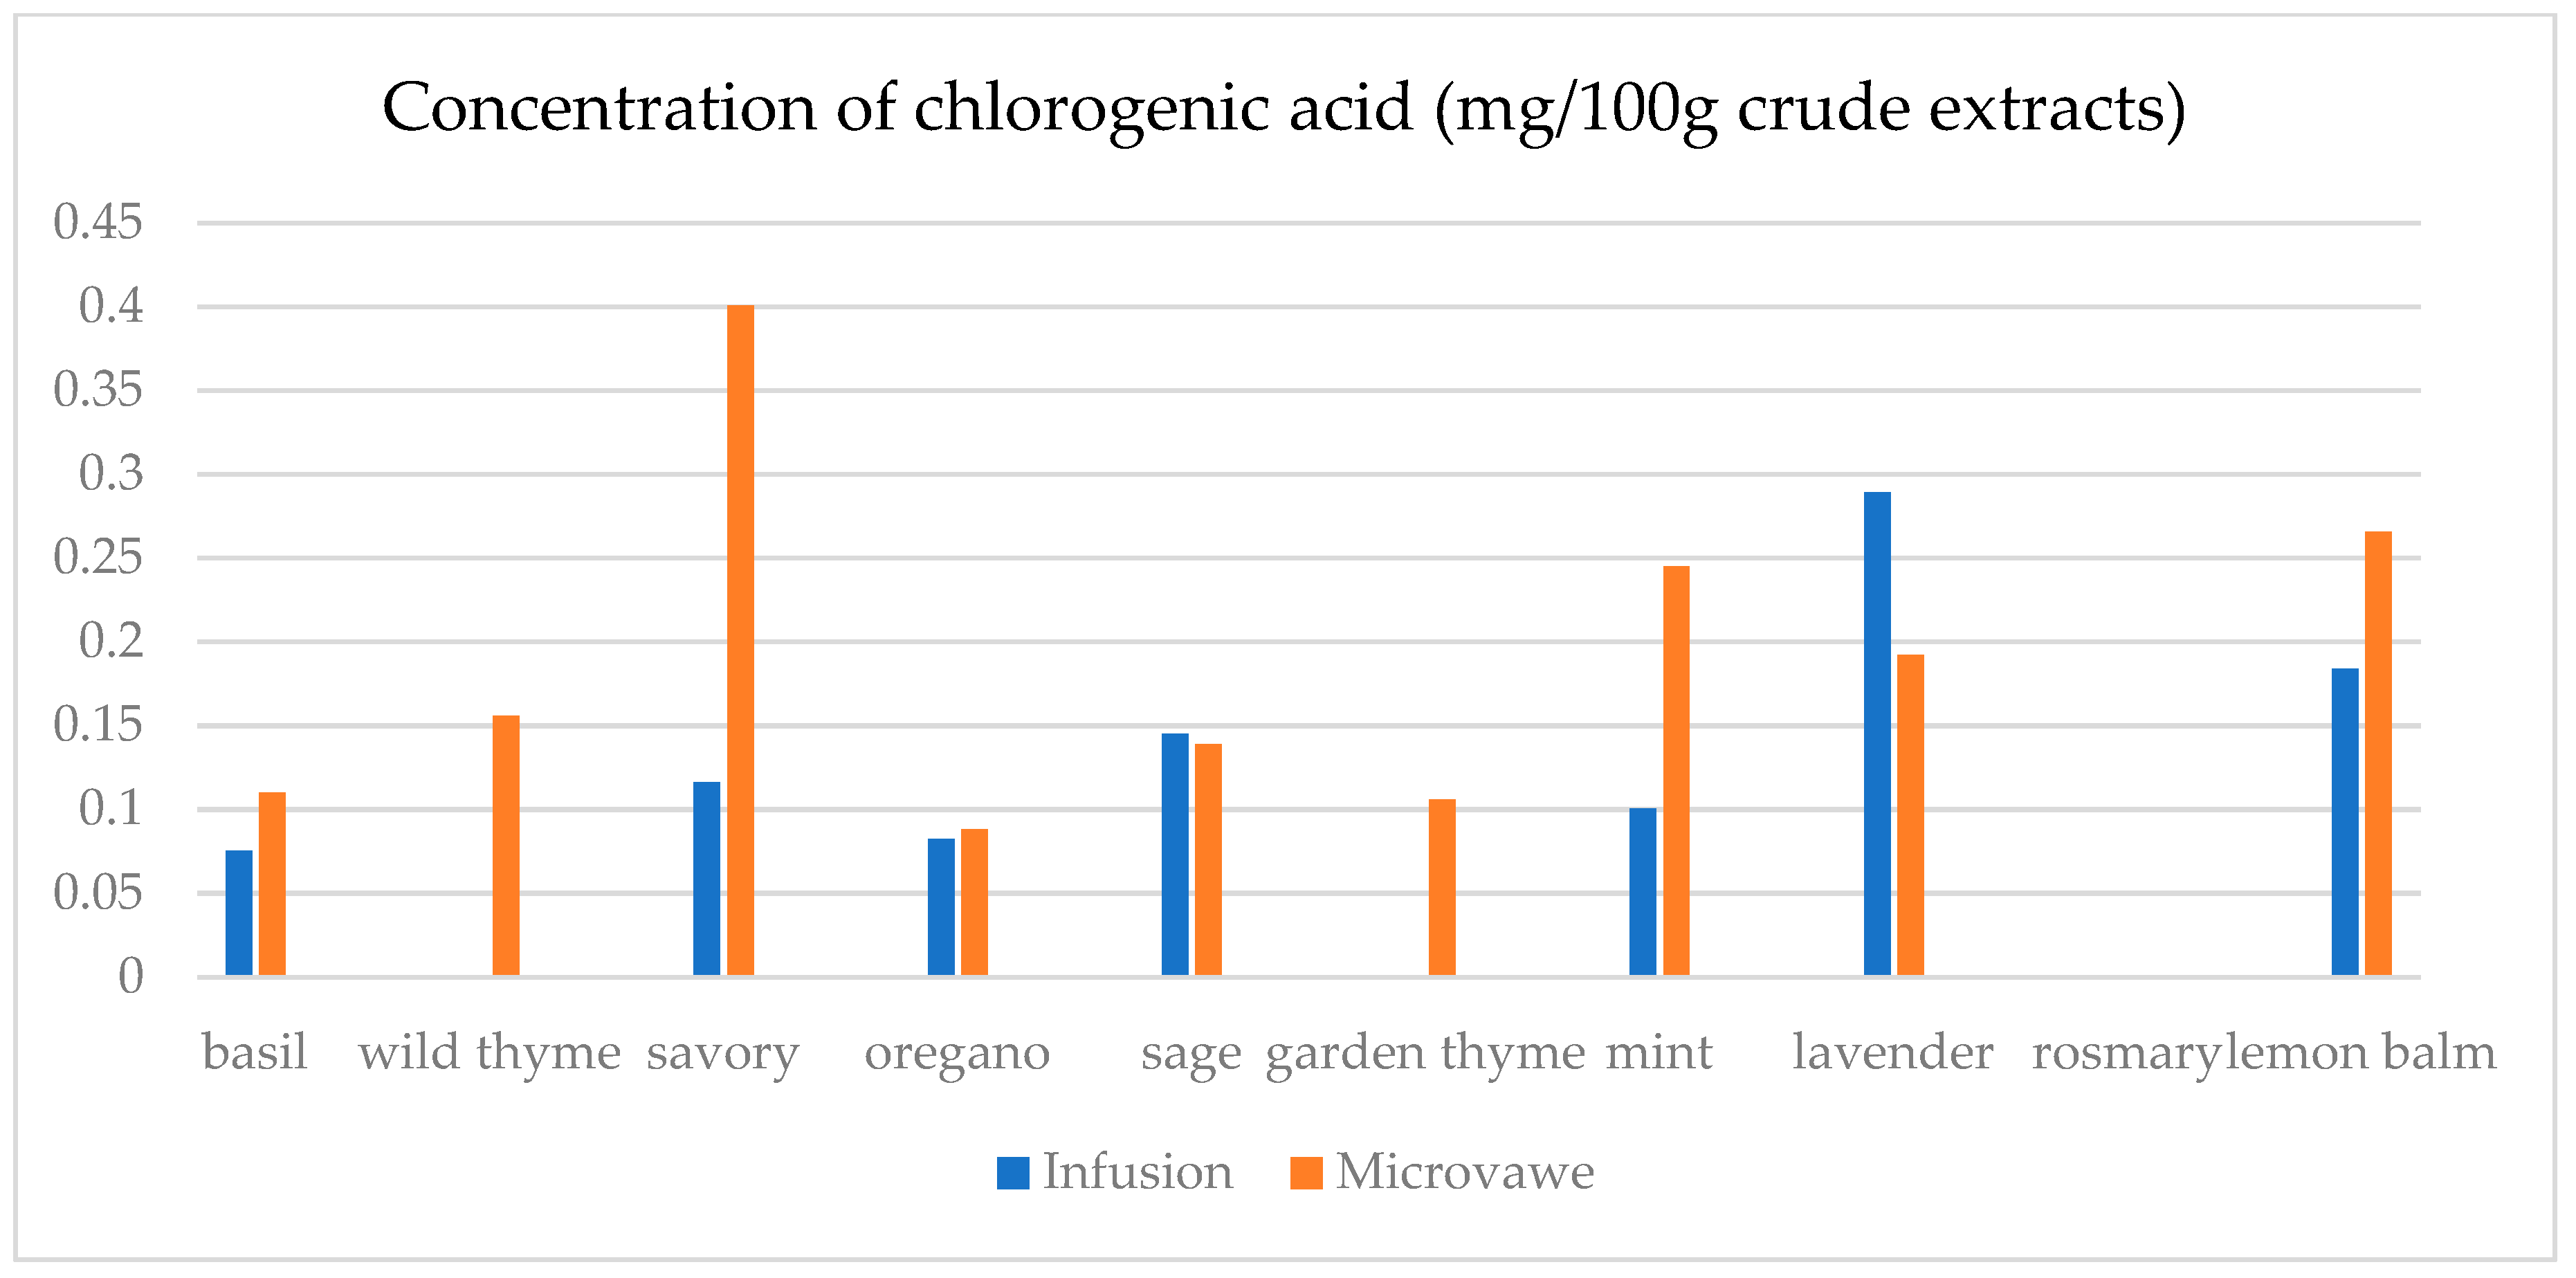
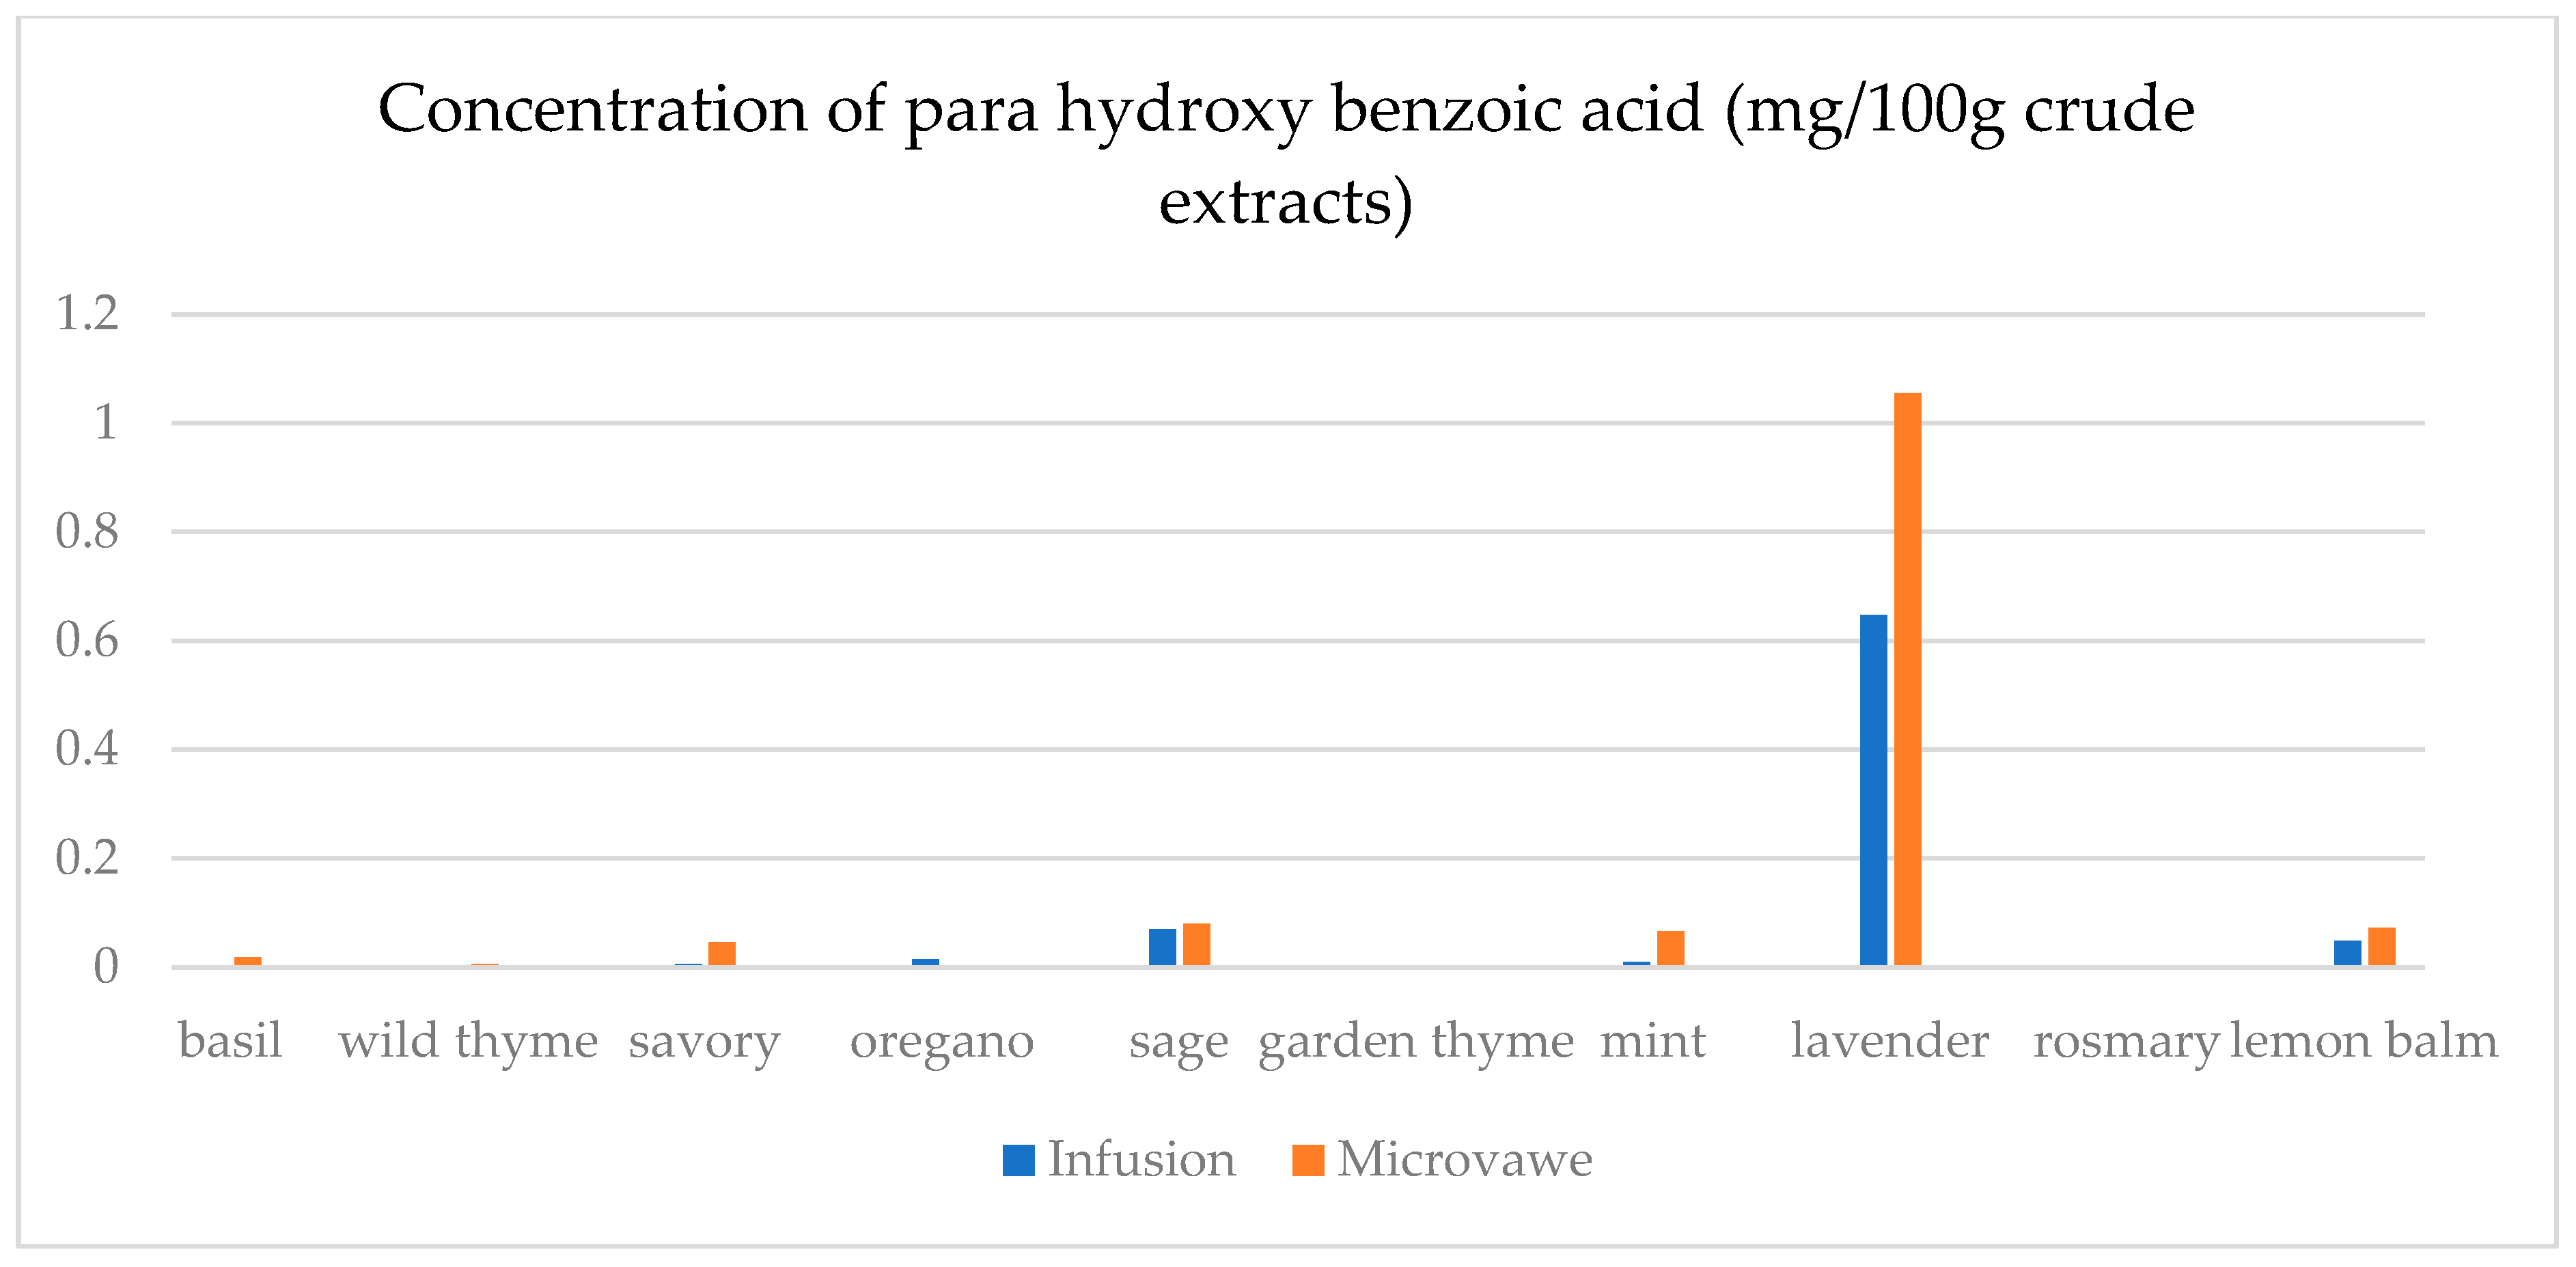
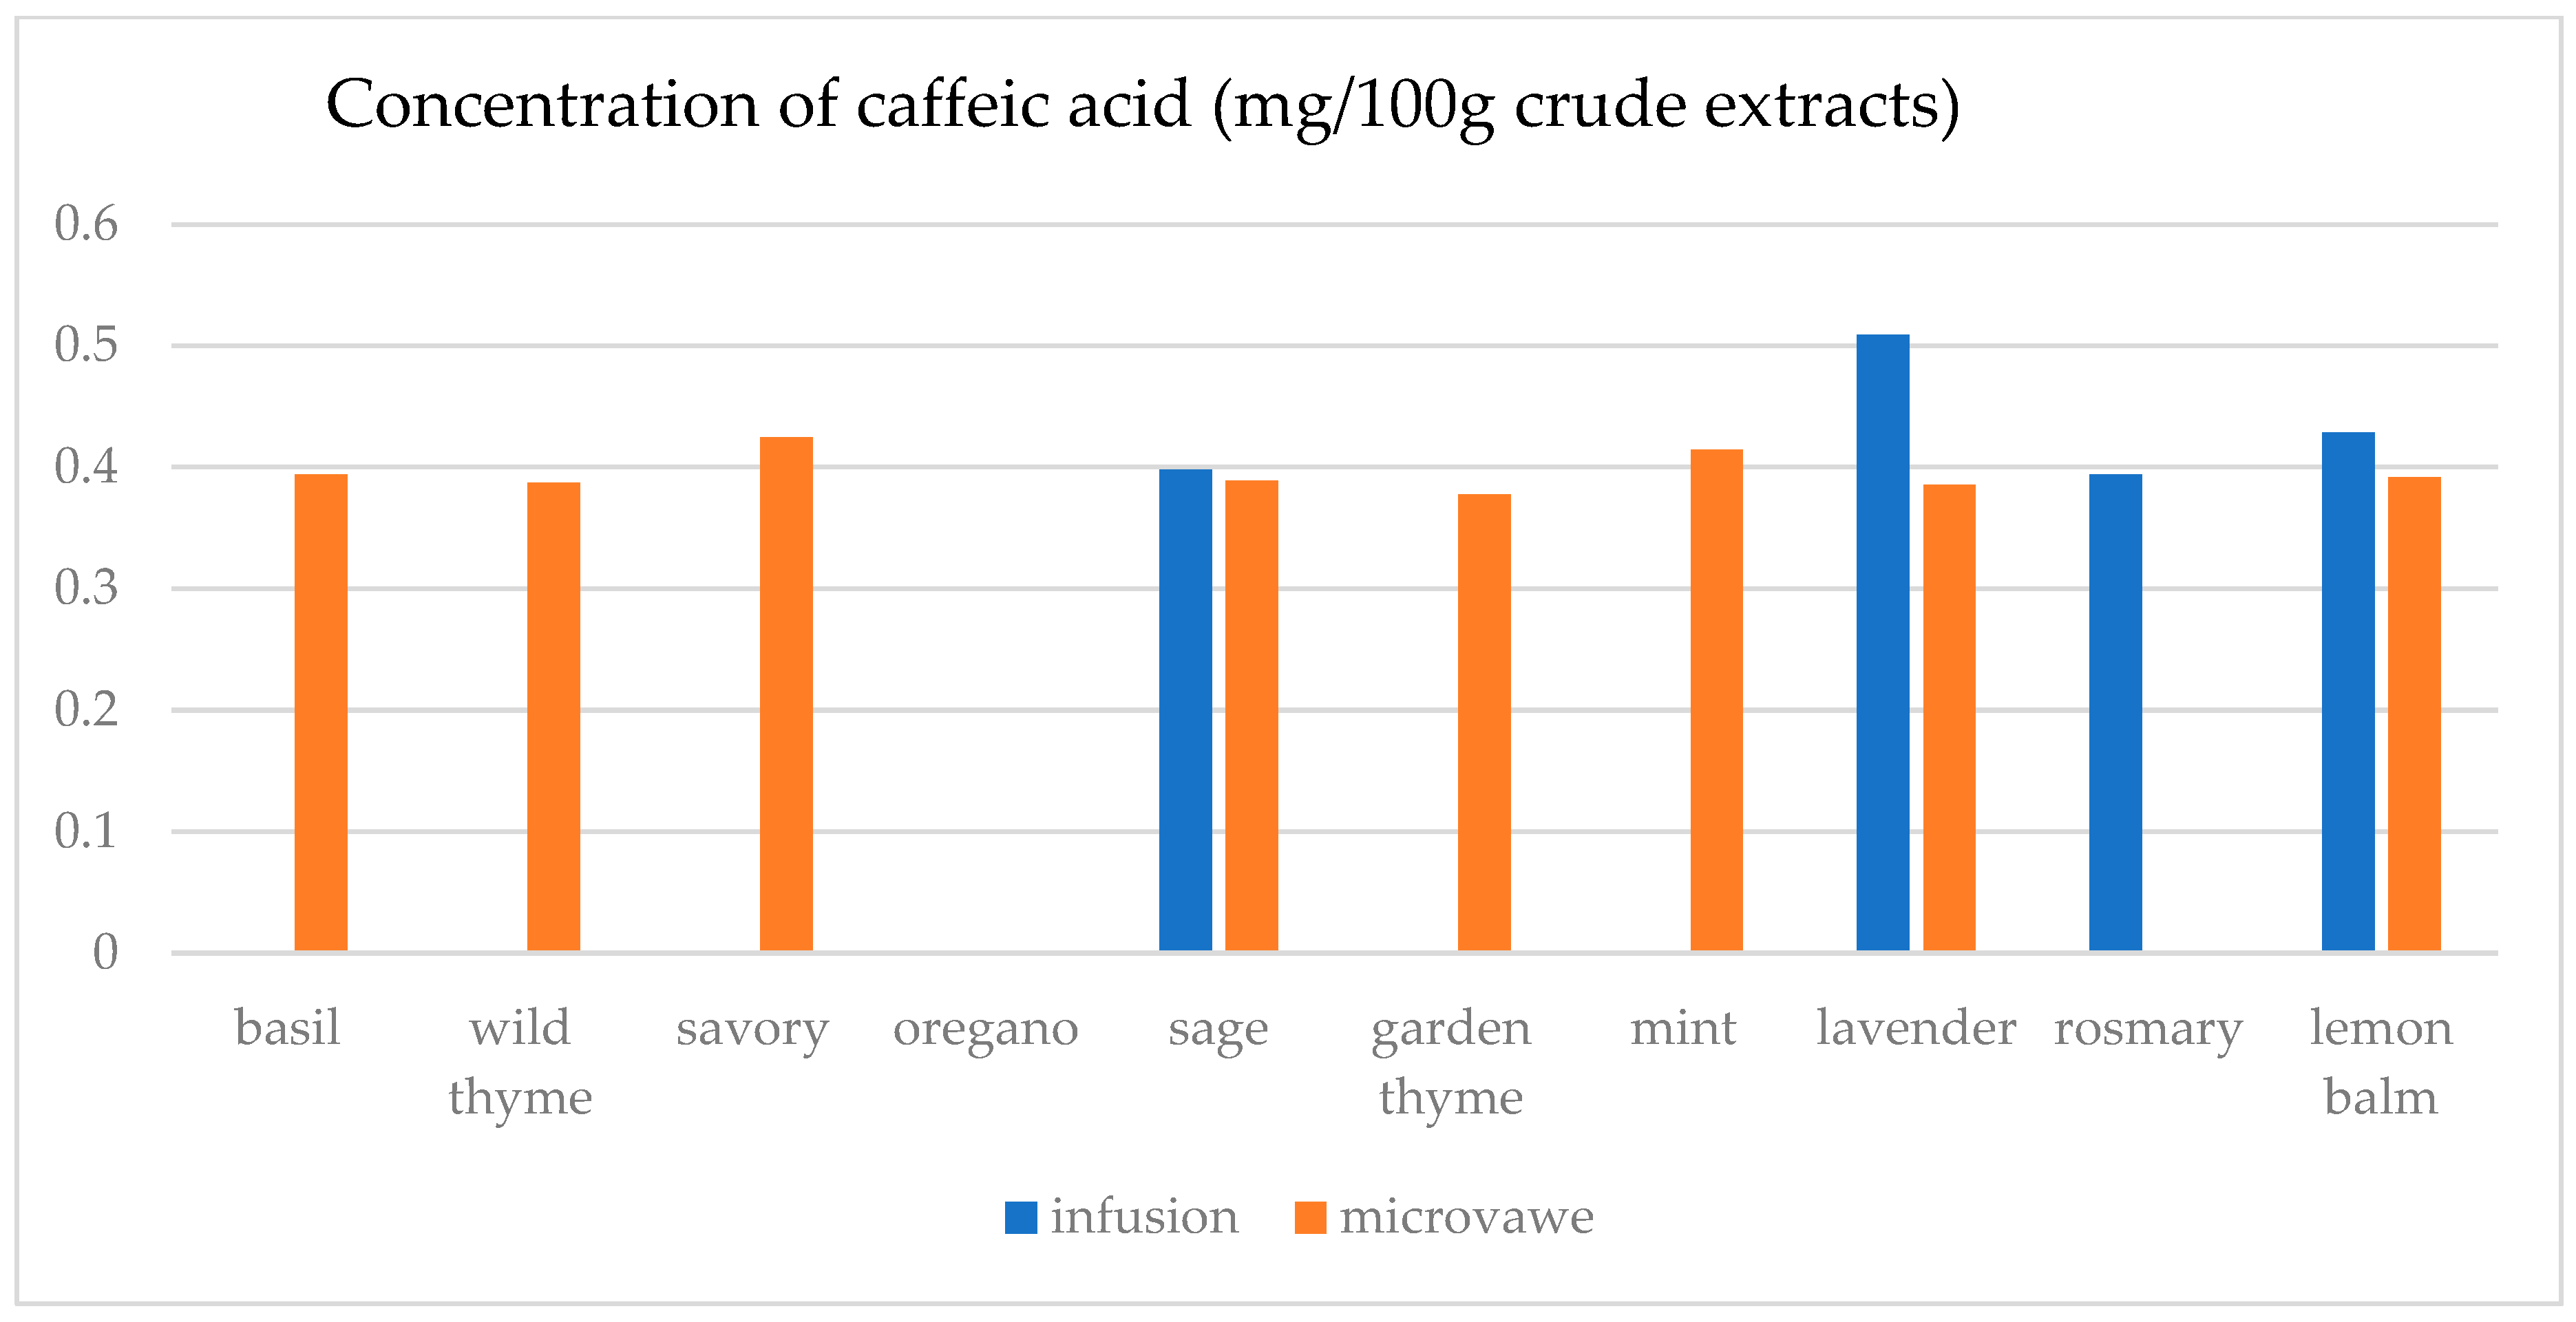
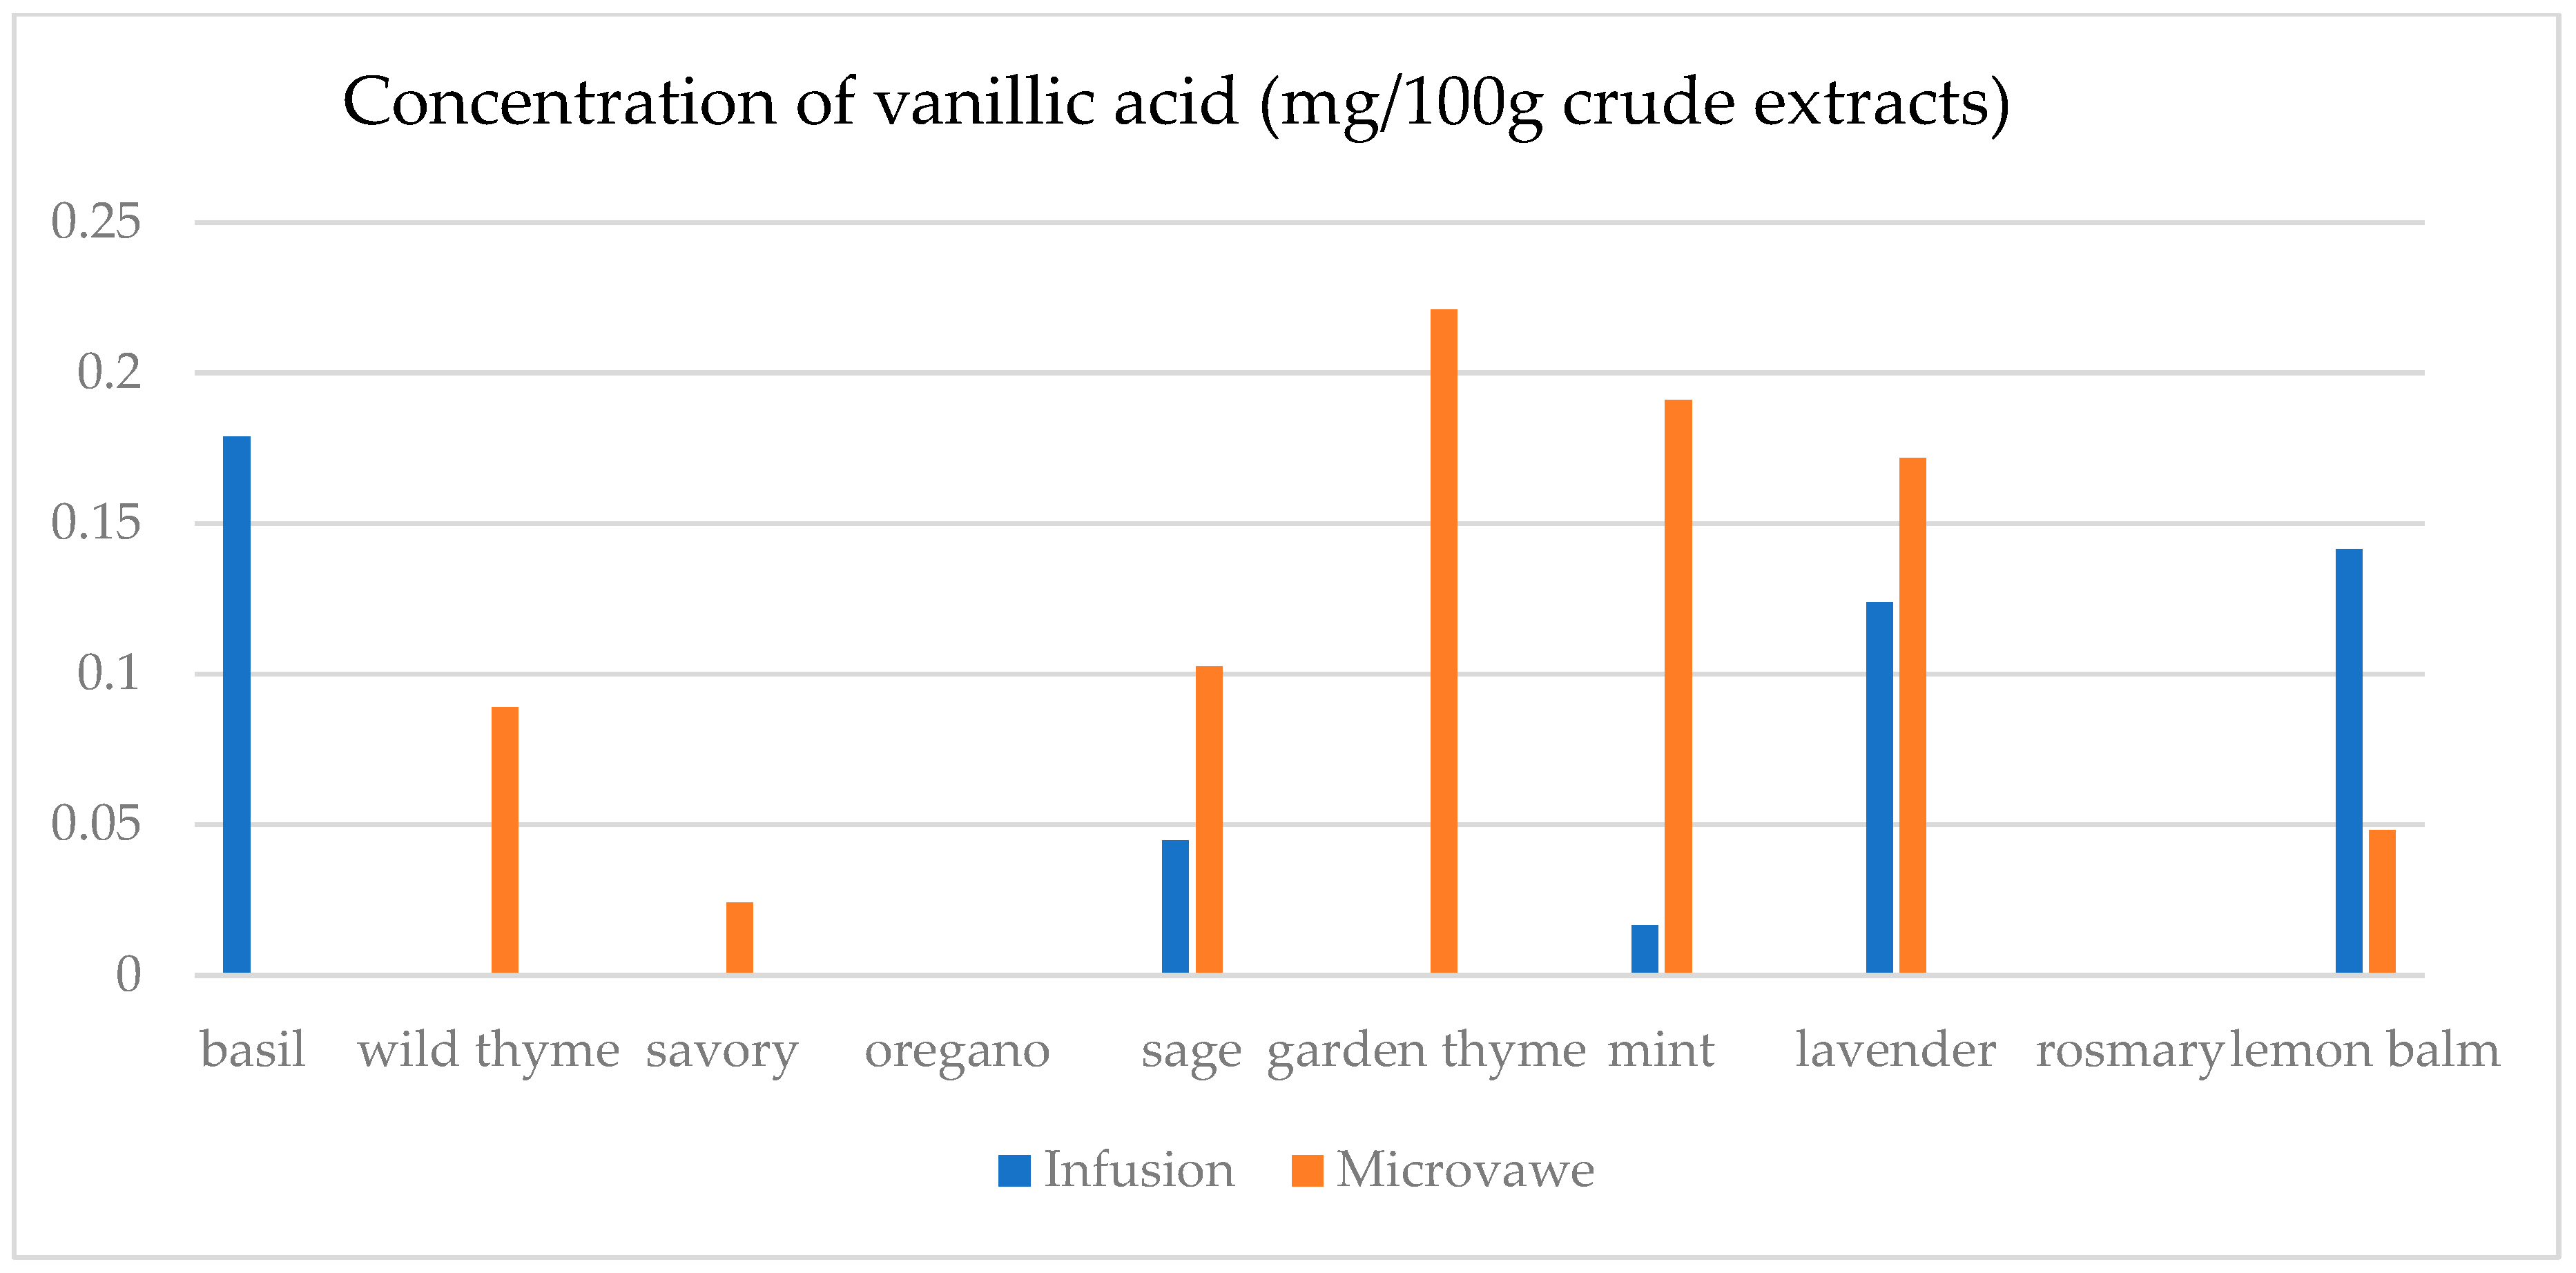
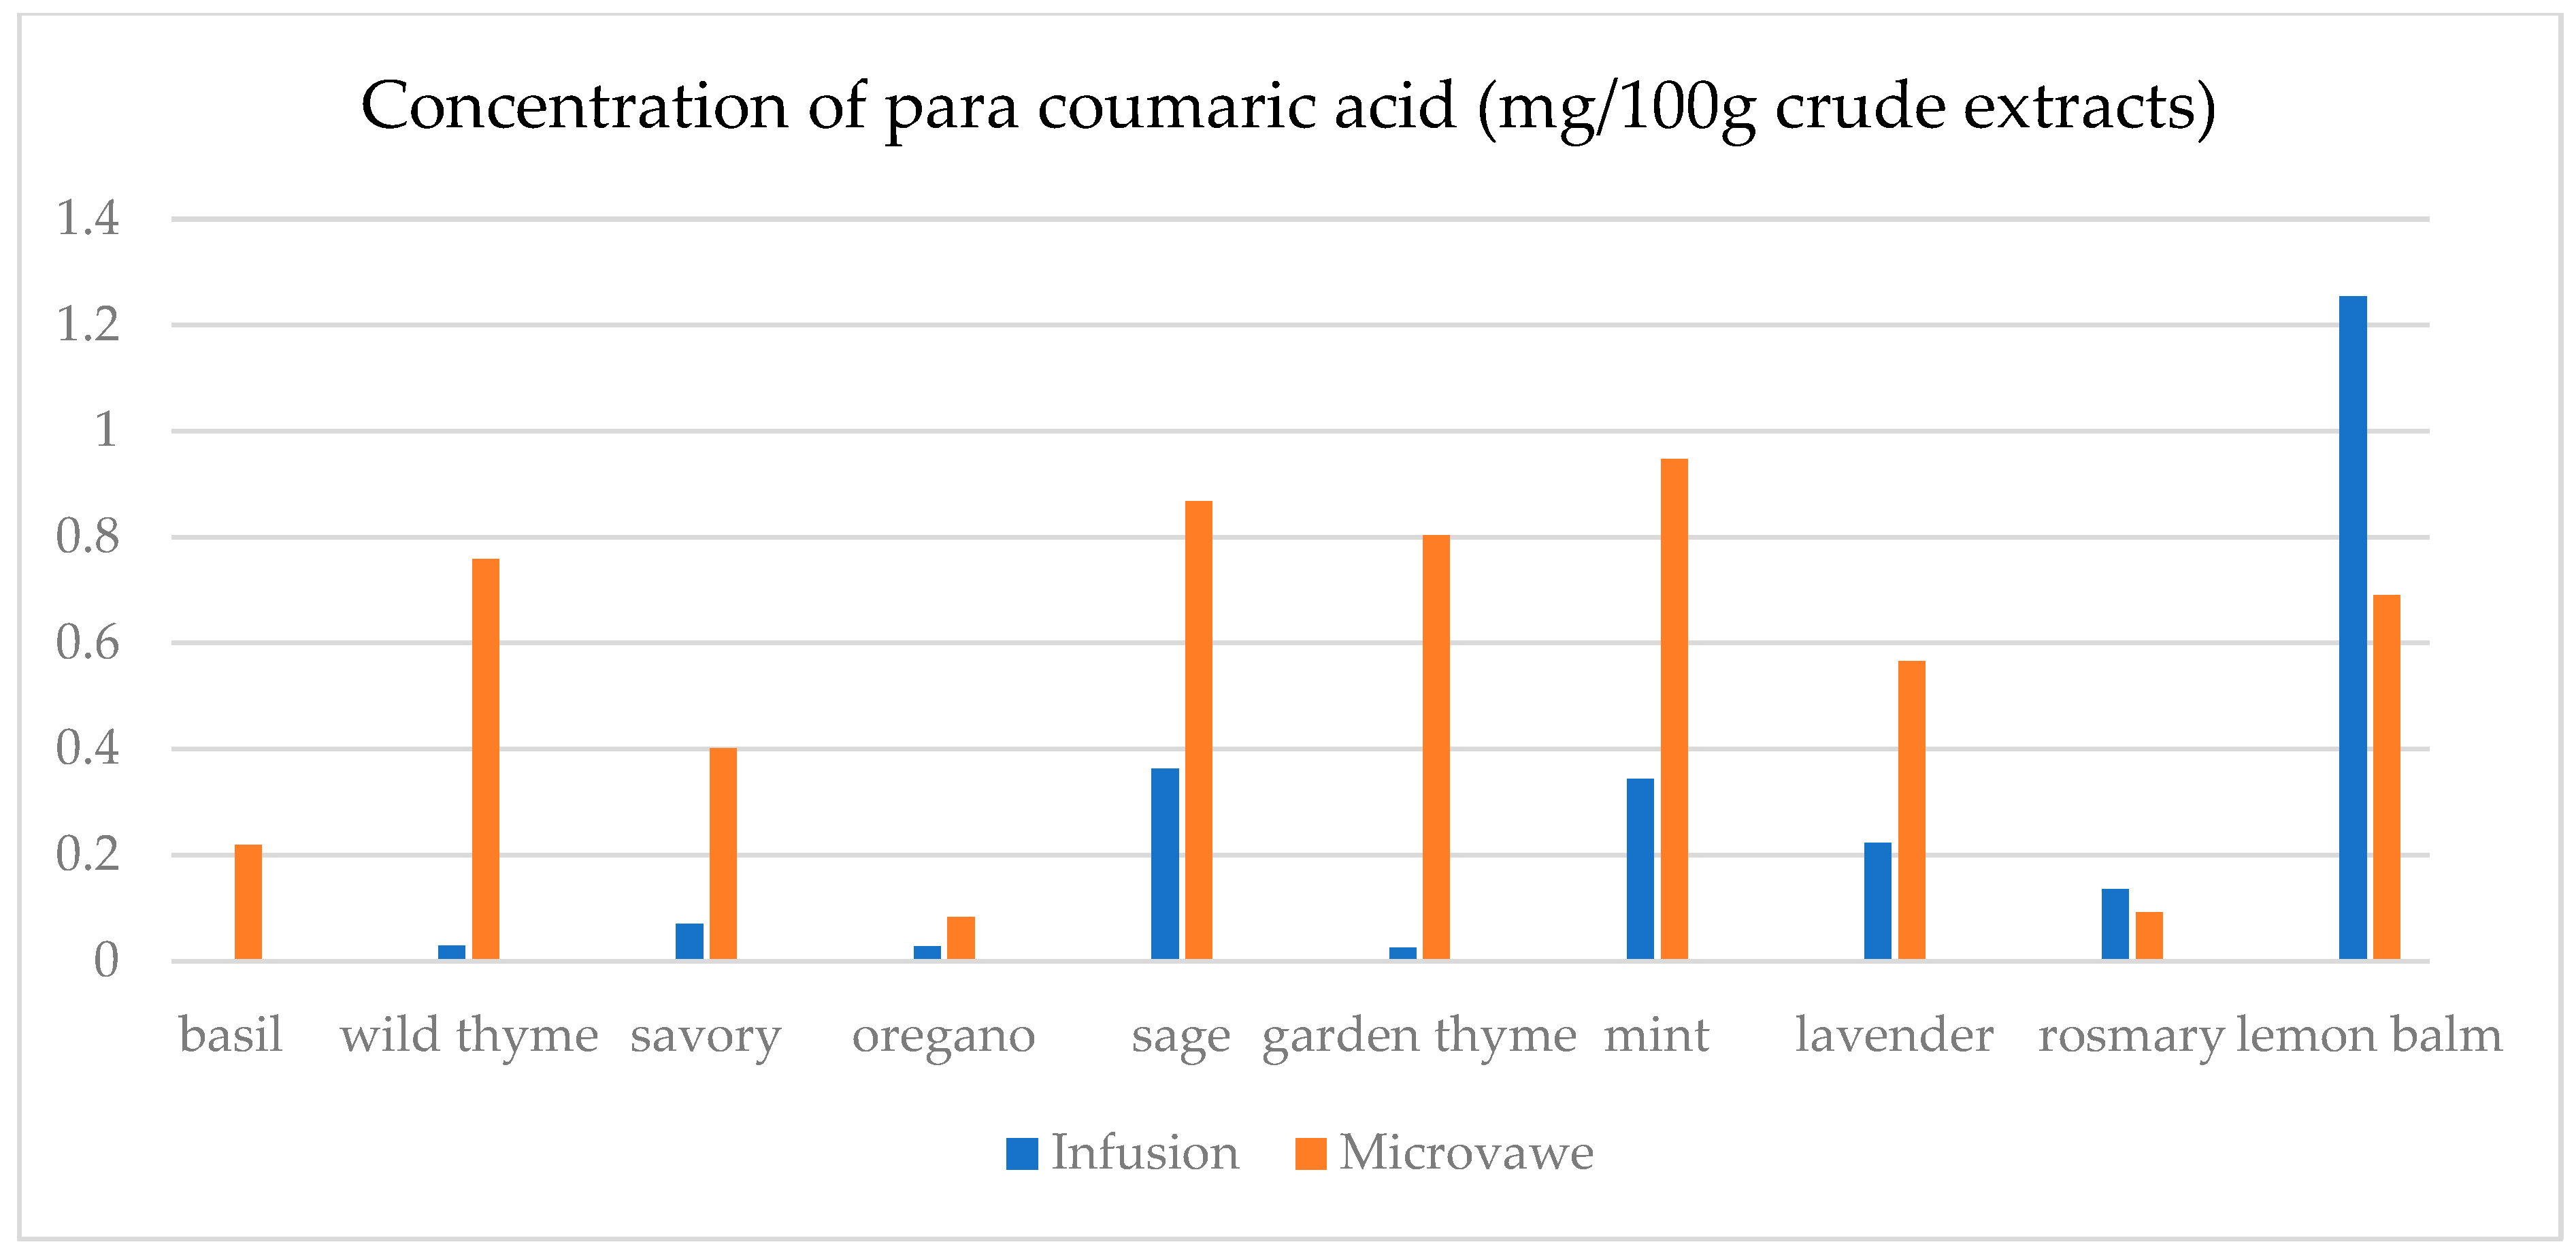
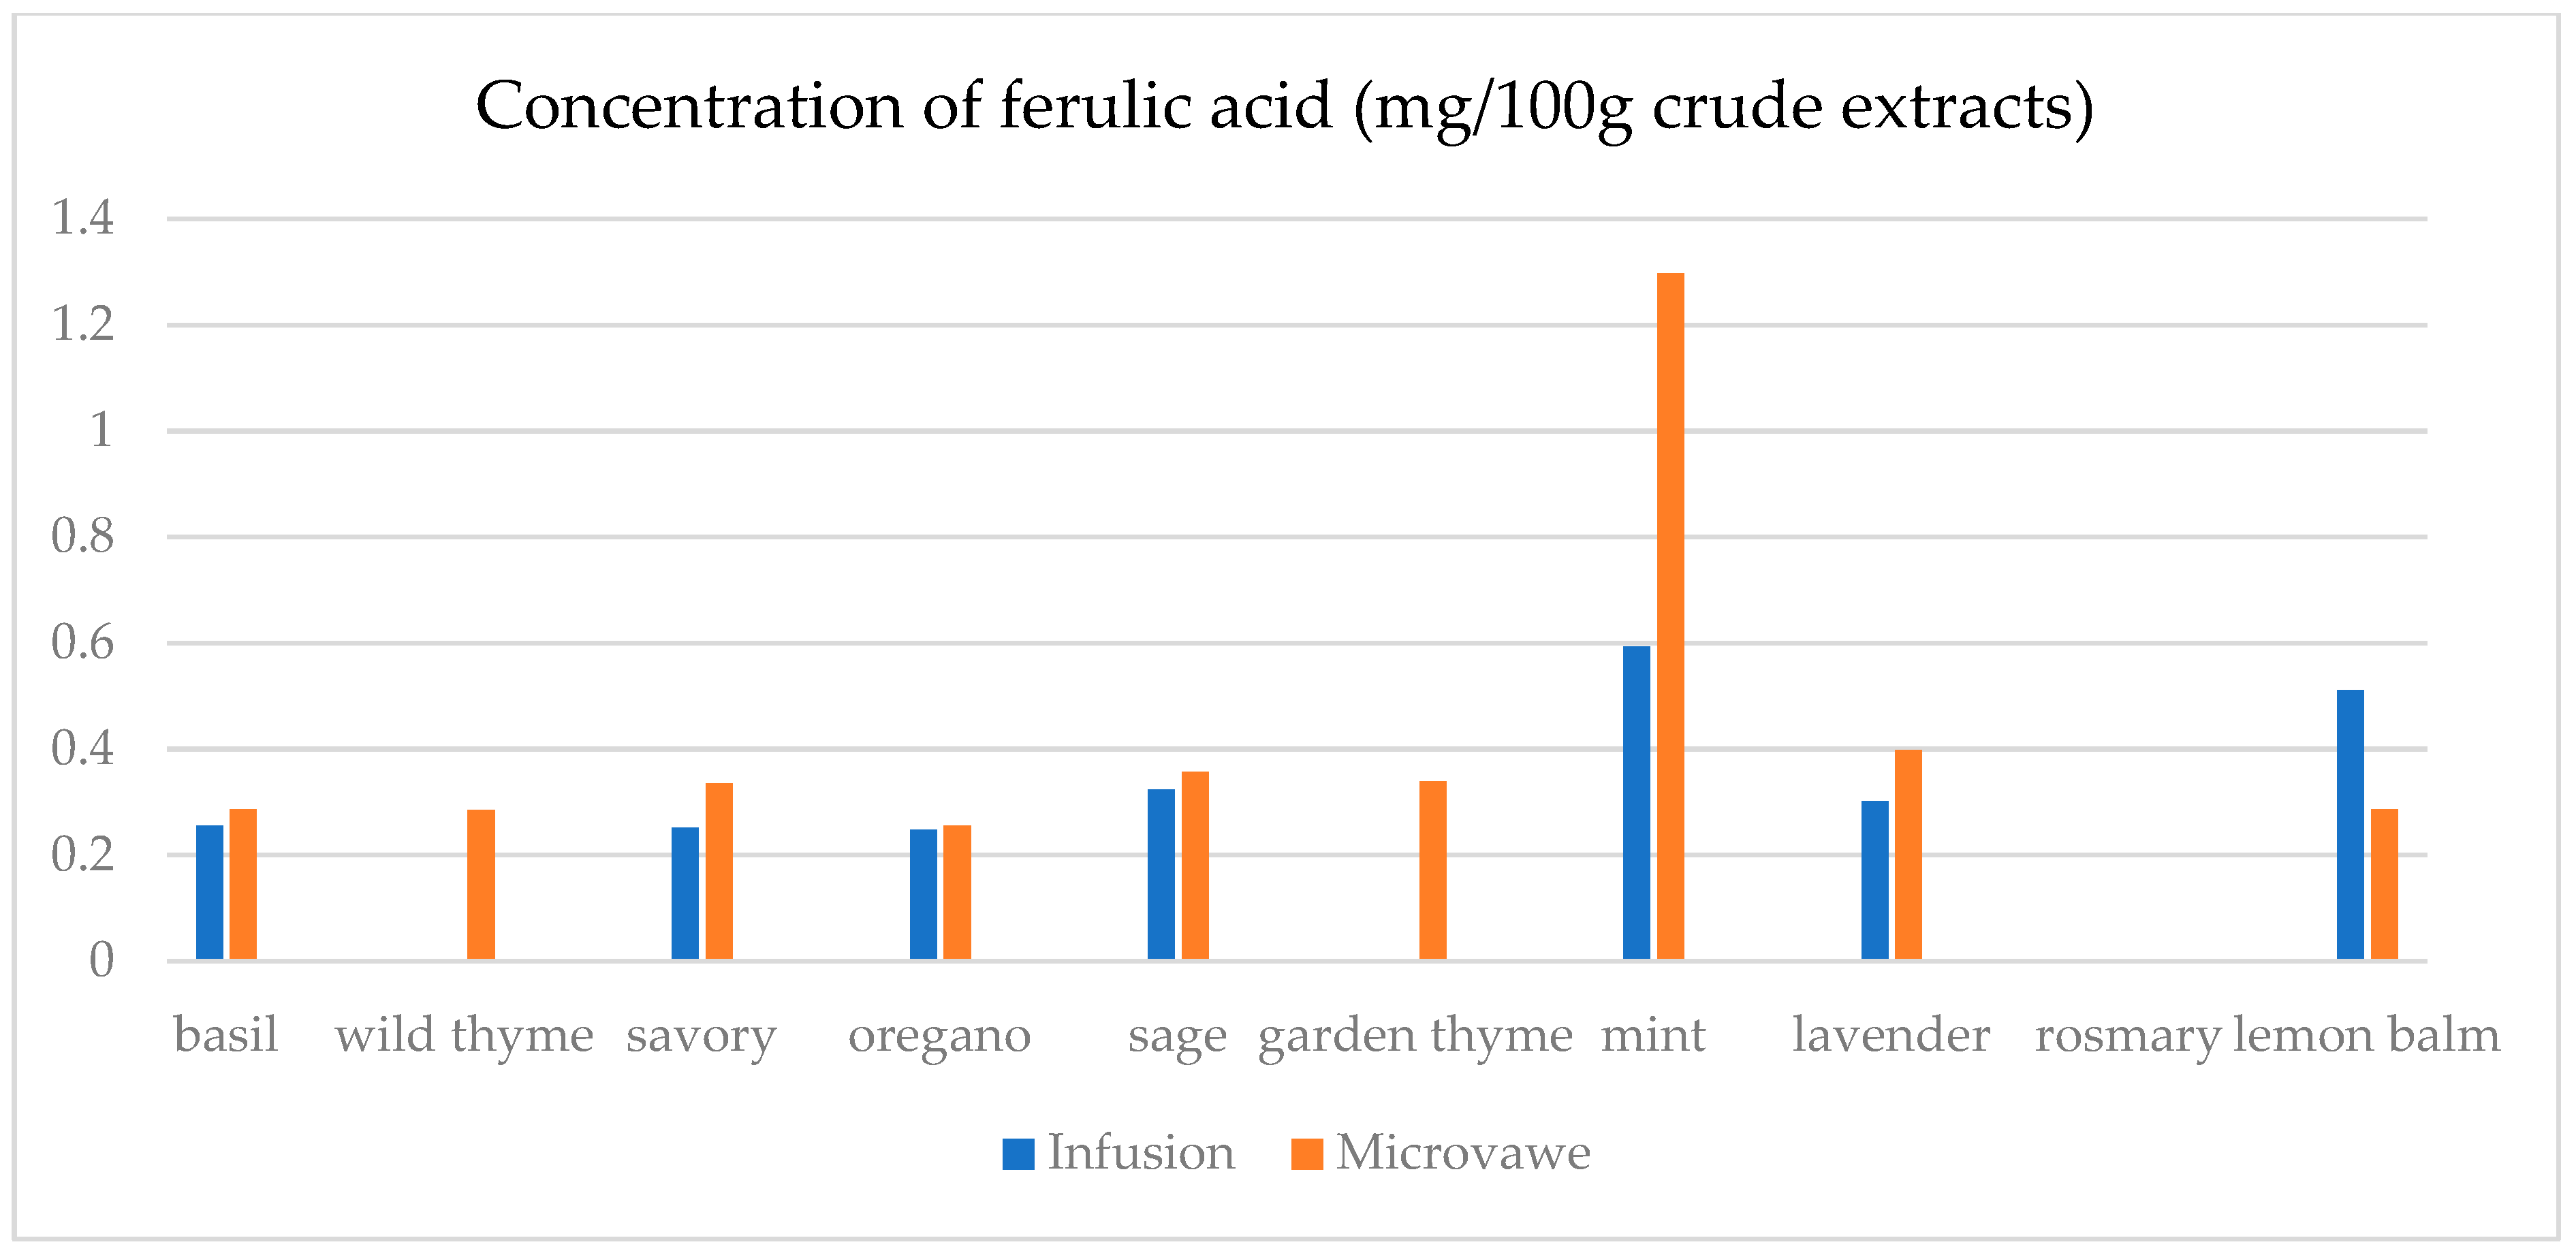
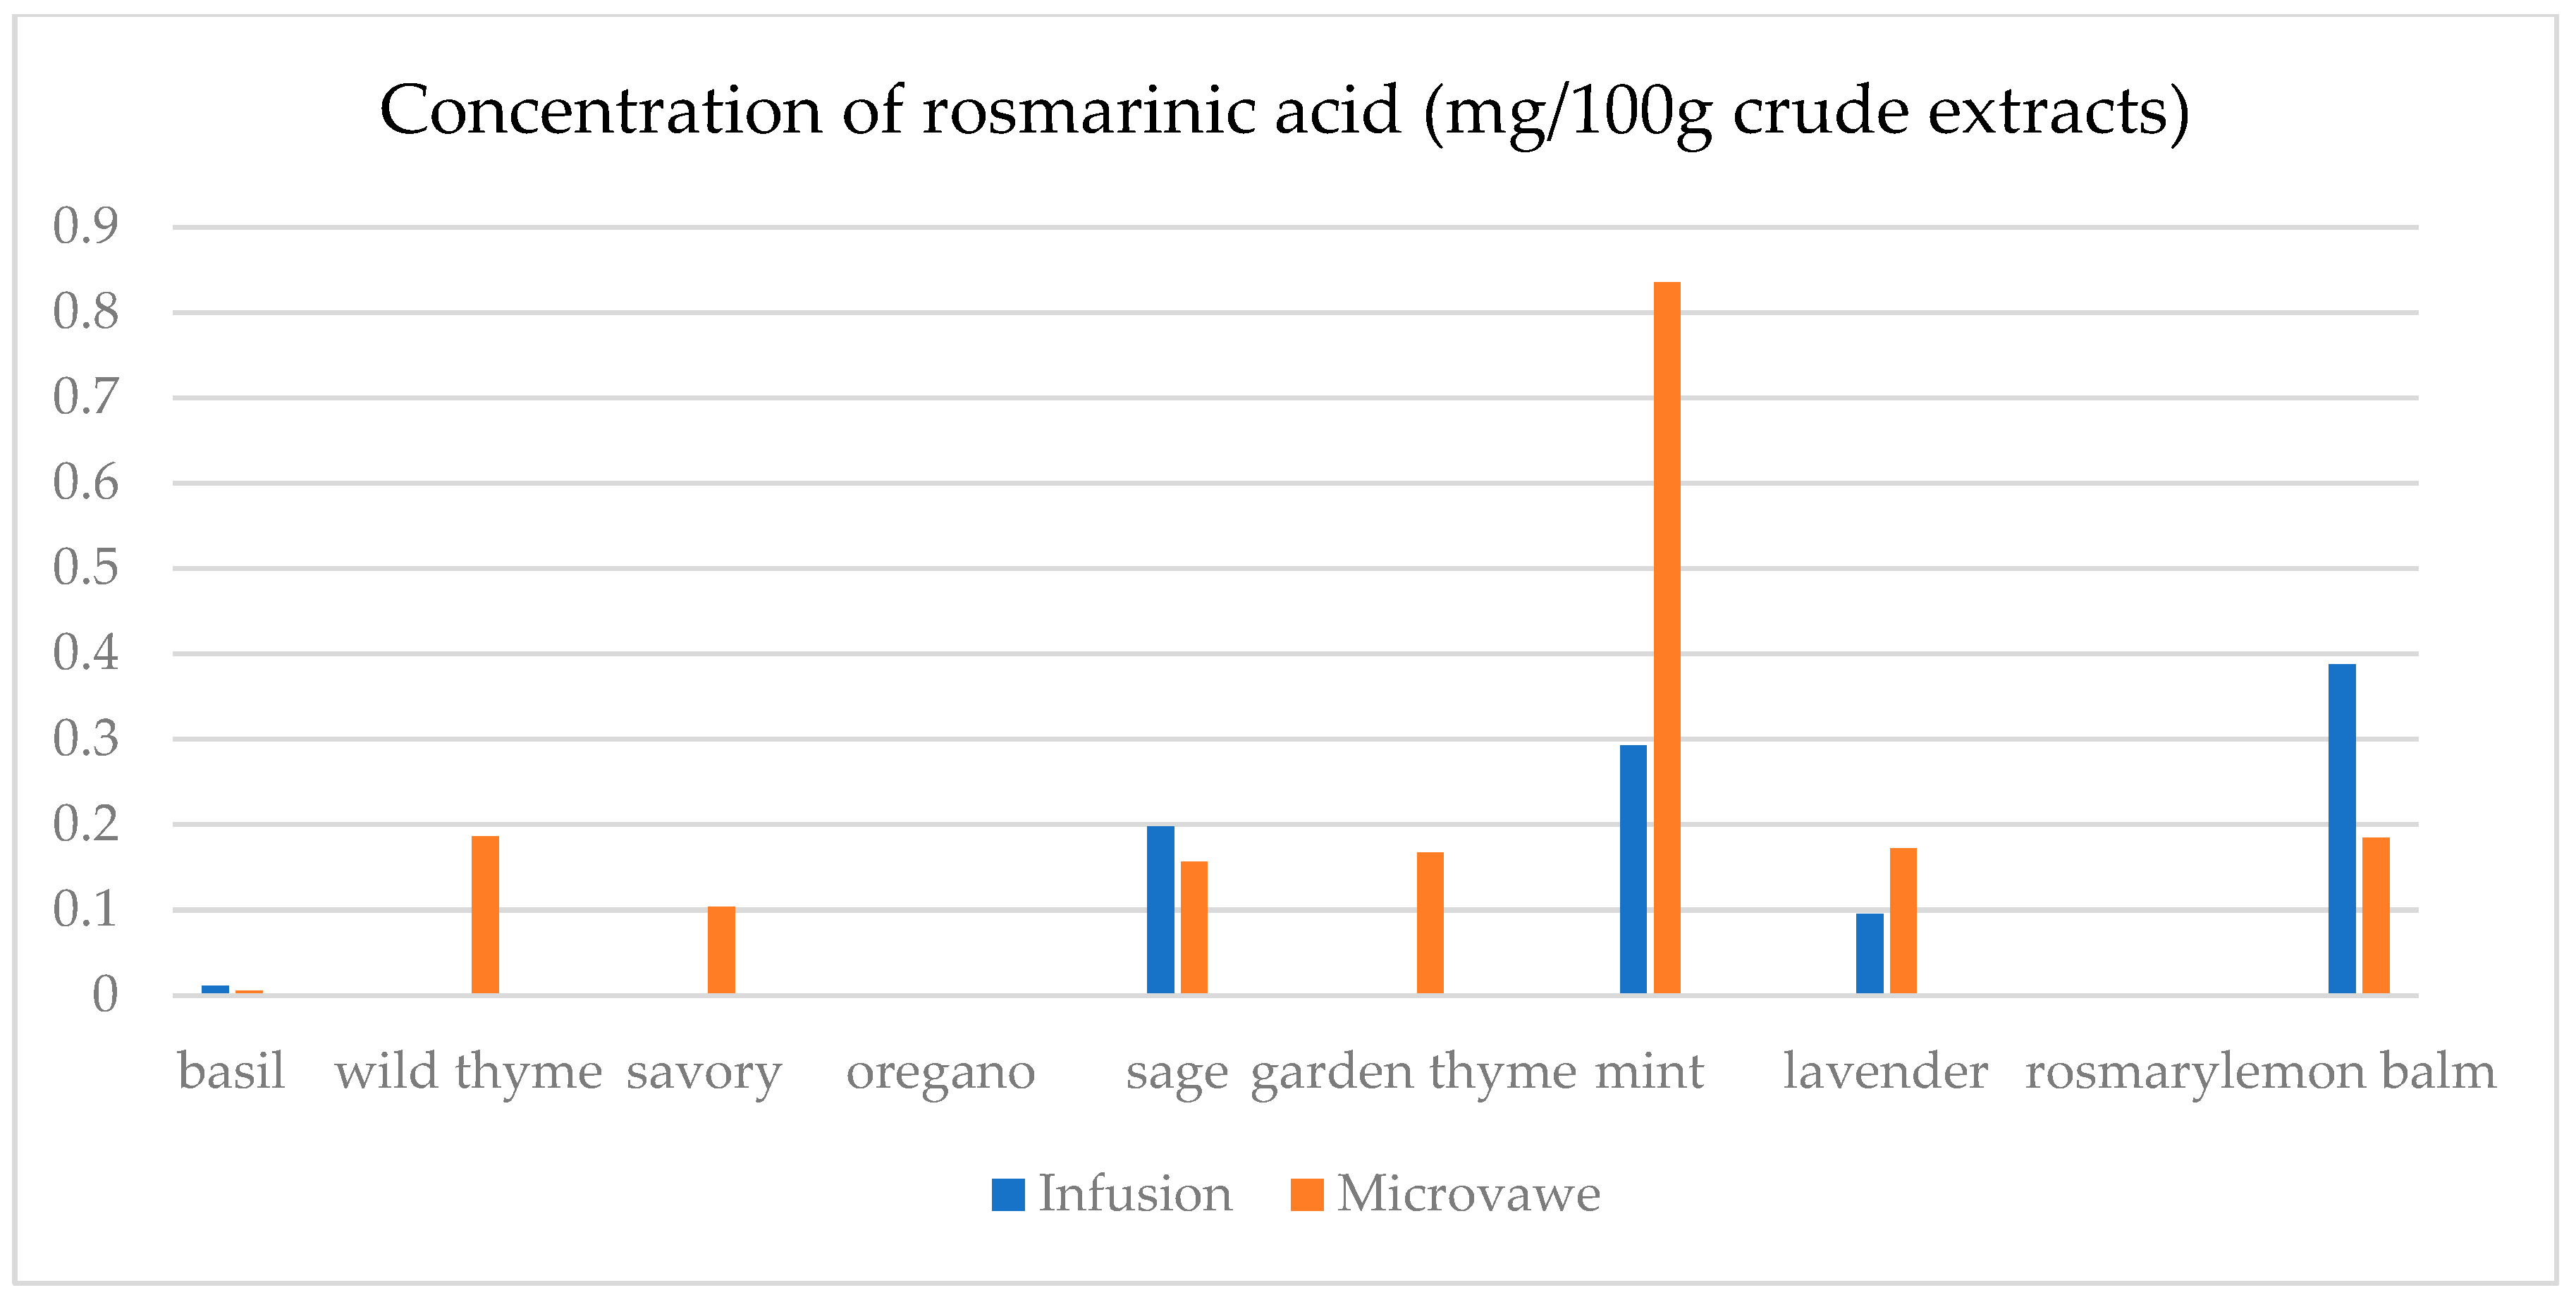
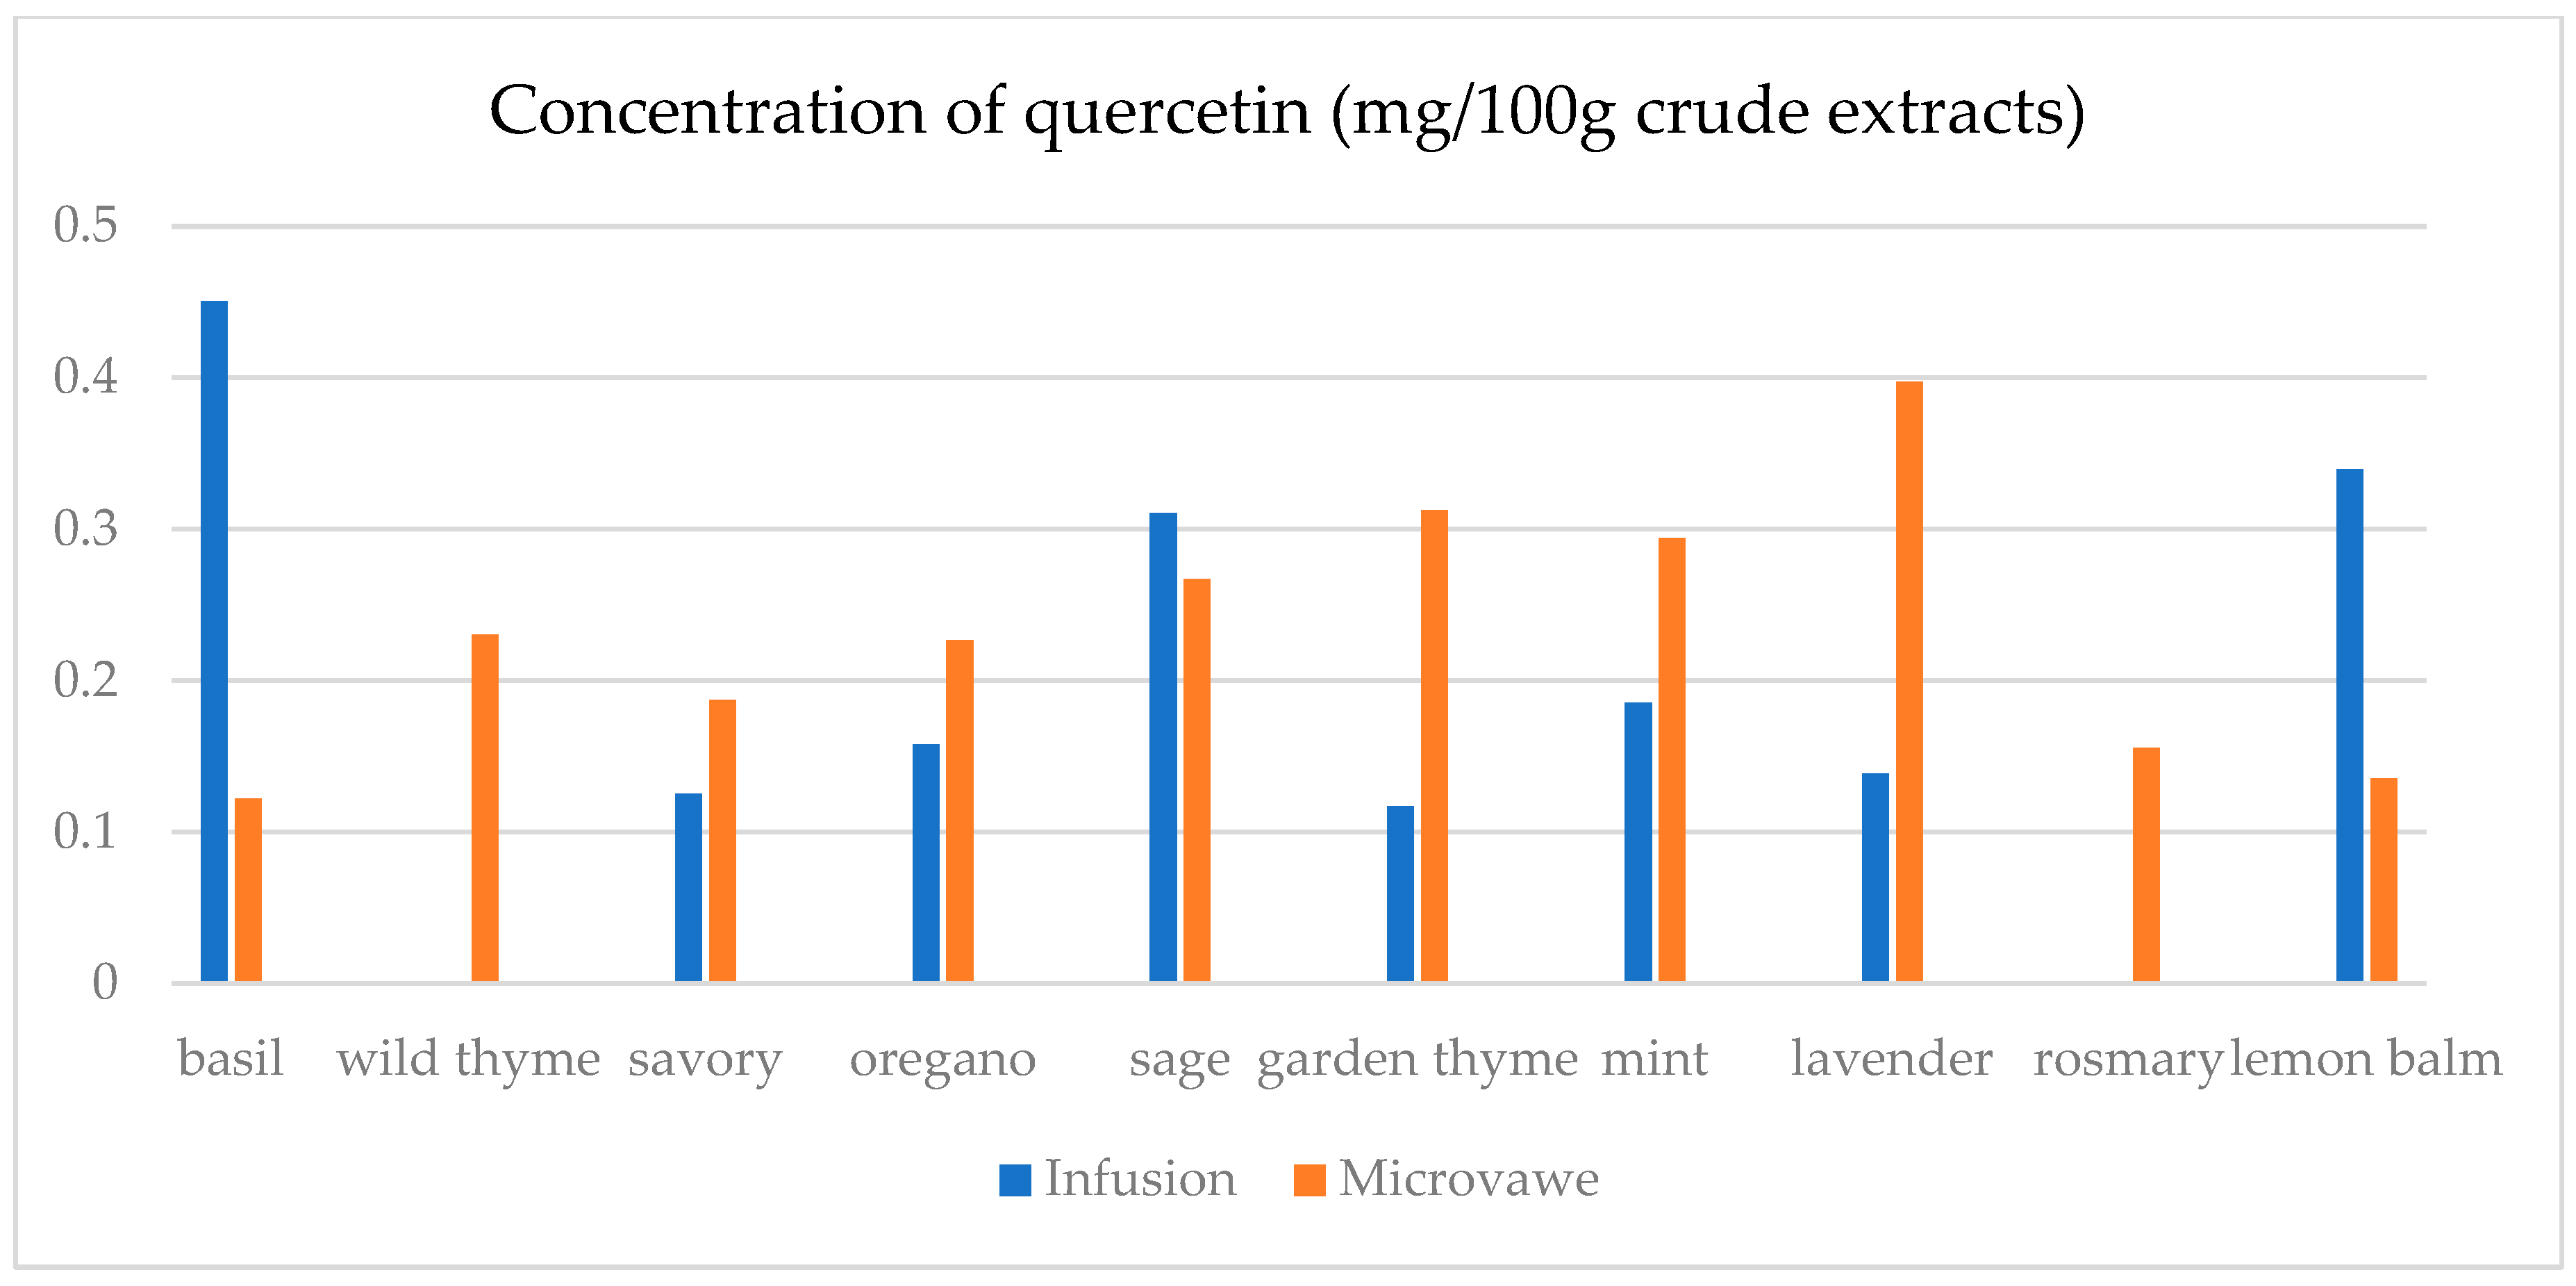
| Infusion (mg/100 g CD) | GA | ChlA | pHBA | CafA | CimA | VA | ComA | FA | RA | Qu | Epi | Nar |
| basil | 23.4(0.3) a | 7.5(0.5) a | n.d. | n.d. | 1.1(0.1) a | 17.9(0.5) e | n.d. | 25.6(1.8) a | 1.1(0.1) a | 45.0(2.1) a | n.d. | 30.3(2.1) a |
| wild thyme | 25.0(0.5) b | n.d. | n.d. | n.d. | n.d. | n.d. | 2.9(0.1) a | n.d. | n.d. | n.d. | n.d. | n.d. |
| savory | 30.3(1.9) d | 11.6(0.3) c | 5.0(0.1) a | n.d. | n.d. | n.d. | 7.1(0.7) b | 25.2(1.6) a | n.d. | 12.5(0.3) b | n.d. | 29.6(1.1) b,c |
| oregano | 29.4(1.5) c | 8.2(0.5) a | 1.4(0.1) b | n.d. | n.d. | n.d. | 2.8(0.2) a | 24.8(1.3) a | n.d. | 15.8(0.3) c | n.d. | 29.2(1.0) c |
| sage | 26.2(1.2) b | 14.5(0.4) d | 6.9(0.4) d | 39.8(1.5) a | 0.14(0.0) b | 4.5(0.2) b | 36.3(0.6) f | 32.3(2.5) c | 19.8(0.6) c | 31.1(1.6) d | 30.5(1.5) a | 30.6(1.3) a |
| garden thyme | 25.8(1.2) b | n.d. | n.d. | n.d. | n.d. | n.d. | 2.6(0.2) a | n.d. | n.d. | 11.7(0.4) e | n.d. | n.d. |
| mint | 23.8(0.9) a | 10.0(0.8) b | 1.0(0.1) b | n.d. | n.d. | 1.6(0.1) a | 34.3(0.7) e | 59.4(2.5) e | 29.3(1.4) d | 18.5(0.9) f | 25.6(1.8) b | 29.3(0.8) a,b,c |
| lavender | 32.2(2.2) e | 28.9(0.4) f | 64.8(0.3) e | 50.9(0.3) c | n.d. | 12.4(0.5) c | 22.3(0.5) d | 30.2(2.6) b | 9.5(0.4) b | 13.8(0.8) g | 48.3(1.4) c | n.d. |
| rosemary | 27.7(1.5) c | n.d. | n.d. | 39.4(0.3) a | n.d. | n.d. | 13.5(0.8) c | n.d. | n.d. | n.d. | n.d. | n.d. |
| lemon balm | 38.0(2.3) f | 18.4(0.4) e | 4.8(0.3) c | 42.9(0.2) b | n.d. | 14.1(0.6) d | 125.3(6.1) g | 51.1(3.6) d | 38.8(0.3) e | 33.9(2.1) h | 26.4(1.2) d | 29.9(0.9) a,b |
| Microwave (mg/100 g CD) | GA | ChlA | pHBA | CafA | CimA | VA | ComA | FA | RA | Qu | Epi | Nar |
| basil | 24.6(1.1) a | 11.0(0.8) a | 1.8(0.1) a,b | 39.4(2.7) a,b | n.d. | 0.1(0.0) a | 21.9(0.9) a | 28.7(0.7) a | 0.5(0.0) a | 12.2(0.4) a | n.d. | n.d. |
| wild thyme | 27.3(1.2) c,d | 15.5(0.7) b | 0.5(0.0) a | 38.7(2.4) a,b | 2.3(0.1) a | 8.9(0.2) b | 75.9(0.4) b | 28.6(1.8) a | 18.6(0.4) e | 23.0(1.8) d | 27.7(1.1) a | 30.1(1.7) b |
| savory | 26.8(1.3) b,c | 40.1(2.1) c | 4.5(0.3) a,b,c | 42.5(3.1) c | n.d. | 2.4(0.1) c | 40.2(2.3) c | 33.5(1.7) b | 10.4(0.8) b | 18.7(1.2) c | 26.0(1.3) b | 29.6(1.8) a |
| oregano | 30.1(2.0) e | 8.8(0.2) d | n.d. | n.d. | 0.3(0.0) b | n.d. | 8.3(0.4) d | 25.6(0.9) c | n.d. | 22.7(1.7) d | n.d. | 30.1(2.2) b |
| sage | 25.2(1.6) a,b | 13.9(0.8) e | 7.9(0.3) c | 38.9(2.6) b | n.d. | 10.2(0.7) d | 86.8(2.6) e | 35.7(1.6) d | 15.6(0.7) c | 26.7(1.5) e | 37.0(2.1) c | 30.8(2.3) b |
| garden thyme | 28.5(0.9) d | 10.6(0.5) a | n.d. | 37.8(2.4) a | n.d. | 22.1(1.1) e | 80.4(3.1) f | 33.9(1.1) b | 16.8(0.8) c,d | 31.3(1.8) g | 29.0(1.4) d | 32.8(2.1) c,d |
| mint | 25.4(0.8) a,b | 24.5(1.4) f | 6.5(0.4) b,c | 41.4(2.1) c | n.d. | 19.1(0.9) f | 94.8(1.8) g | 129.8(5.8) f | 83.5(2.4) f | 29.4(1.7) f | 33.2(1.6) e | 31.6(1.7) b,c |
| lavender | 42.5(1.9) f | 19.2(1.2) g | 105.6(5.4) d | 38.6(2.8) a,b | 1.9(0.1) c | 17.2(1.0) f | 56.6(1.2) h | 39.8(2.1) e | 17.2(0.7) d,e | 39.7(2.1) h | 70.9(3.4) f | 33.7(1.8) d |
| rosemary | 28.4(1.0) d | n.d. | n.d. | n.d. | n.d. | n.d. | 9.2(0.2) d | n.d. | n.d. | 15.6(0.9) b | n.d. | 29.5(1.3) a |
| lemon balm | 30.7(2.1) e | 26.6(1.7) h | 7.3(0.5) c | 39.2(2.2) a,b | n.d. | 4.8(0.3) g | 69.0(1.4) i | 28.6(0.7) a | 18.5(0.9) e | 13.5(1.1) a | 25.1(1.4) g | n.d. |
| GA | ChlA | pHBA | CafA | CinA | VA | ComA | FA | RA | Qu | Epi | Nar | |
|---|---|---|---|---|---|---|---|---|---|---|---|---|
| GA | 1 | 0.289 | 0.710 ** | 0.290 | 0.280 | 0.296 | 0.326 | 0.034 | 0.073 | 0.281 | 0.529 * | 0.161 |
| ChlA | 0.289 | 1 | 0.259 | 0.411 | 0.004 | 0.189 | 0.315 | 0.423 | 0.294 | 0.266 | 0.431 | 0.223 |
| pHBA | 0.710 ** | 0.259 | 1 | 0.363 | 0.414 | 0.392 | 0.104 | 0.108 | 0.067 | 0.284 | 0.759 ** | 0.006 |
| CafA | 0.290 | 0.411 | 0.363 | 1 | 0.130 | 0.469 * | 0.671 ** | 0.352 | 0.430 | 0.193 | 0.667 ** | −0.086 |
| Epi | 0.529 * | 0.431 | 0.759 ** | 0.667 ** | 0.376 | 0.630 ** | 0.620 ** | 0.471 * | 0.500 * | 0.491 * | 1 | 0.270 |
| VA | 0.296 | 0.189 | 0.392 | 0.469 * | 0.365 | 1 | 0.630 ** | 0.547 * | 0.557 * | 0.763 ** | 0.630 ** | 0.388 |
| ComA | 0.326 | 0.315 | 0.104 | 0.671 ** | 0.151 | 0.630 ** | 1 | 0.611 ** | 0.738 ** | 0.469 * | 0.620 ** | 0.340 |
| FA | 0.034 | 0.423 | 0.108 | 0.352 | 0.004 | 0.547 * | 0.611 ** | 1 | 0.930 ** | 0.469 * | 0.471 * | 0.424 |
| RA | 0.073 | 0.294 | 0.067 | 0.430 | 0.014 | 0.557 * | 0.738 ** | 0.930 ** | 1 | 0.402 | 0.500 * | 0.332 |
| Qu | 0.281 | 0.266 | 0.284 | 0.193 | 0.449 * | 0.763 ** | 0.469 * | 0.469 * | 0.402 | 1 | 0.491 * | 0.719 ** |
| CinA | 0.280 | 0.004 | 0.414 | 0.130 | 1 | 0.365 | 0.151 | 0.004 | 0.014 | 0.449 * | 0.376 | 0.296 |
| Nar | 0.161 | 0.223 | 0.006 | −0.086 | 0.296 | 0.388 | 0.340 | 0.424 | 0.332 | 0.719 ** | 0.270 | 1 |
Disclaimer/Publisher’s Note: The statements, opinions and data contained in all publications are solely those of the individual author(s) and contributor(s) and not of MDPI and/or the editor(s). MDPI and/or the editor(s) disclaim responsibility for any injury to people or property resulting from any ideas, methods, instructions or products referred to in the content. |
© 2025 by the authors. Licensee MDPI, Basel, Switzerland. This article is an open access article distributed under the terms and conditions of the Creative Commons Attribution (CC BY) license (https://creativecommons.org/licenses/by/4.0/).
Share and Cite
Teofilović, B.; Gligorić, E.; Ninić, M.; Vukmirović, S.; Gagić, Ž.; Mandić-Kovačević, N.; Tubić, B.; Đukanović, Đ.; Grujić-Letić, N. Green Extraction Combined with Chemometric Approach: Profiling Phytochemicals and Antioxidant Properties of Ten Species of the Lamiaceae Family. Separations 2025, 12, 155. https://doi.org/10.3390/separations12060155
Teofilović B, Gligorić E, Ninić M, Vukmirović S, Gagić Ž, Mandić-Kovačević N, Tubić B, Đukanović Đ, Grujić-Letić N. Green Extraction Combined with Chemometric Approach: Profiling Phytochemicals and Antioxidant Properties of Ten Species of the Lamiaceae Family. Separations. 2025; 12(6):155. https://doi.org/10.3390/separations12060155
Chicago/Turabian StyleTeofilović, Branislava, Emilia Gligorić, Martina Ninić, Saša Vukmirović, Žarko Gagić, Nebojša Mandić-Kovačević, Biljana Tubić, Đorđe Đukanović, and Nevena Grujić-Letić. 2025. "Green Extraction Combined with Chemometric Approach: Profiling Phytochemicals and Antioxidant Properties of Ten Species of the Lamiaceae Family" Separations 12, no. 6: 155. https://doi.org/10.3390/separations12060155
APA StyleTeofilović, B., Gligorić, E., Ninić, M., Vukmirović, S., Gagić, Ž., Mandić-Kovačević, N., Tubić, B., Đukanović, Đ., & Grujić-Letić, N. (2025). Green Extraction Combined with Chemometric Approach: Profiling Phytochemicals and Antioxidant Properties of Ten Species of the Lamiaceae Family. Separations, 12(6), 155. https://doi.org/10.3390/separations12060155