Article

The Application of Sn2 in Autotrophic Denitrification Process for Advanced Nitrogen Removal in Wastewater Treatment

1
School of Ecology and Environment, Harbin Institute of Technology, Shenzhen 518055, China
2
State Key Laboratory of Urban Water Resource and Environment, School of Environment, Harbin Institute of Technology, Harbin 150090, China
3
Shenzhen Key Laboratory of Water Resource Utilization and Environmental Pollution Control, Shenzhen 518055, China
*
Authors to whom correspondence should be addressed.
Separations 2025, 12(6), 157; https://doi.org/10.3390/separations12060157
Submission received: 25 April 2025 / Revised: 4 June 2025 / Accepted: 5 June 2025 / Published: 8 June 2025
(This article belongs to the Topic Sustainable Technologies for Water Purification)

Abstract

:
This study presents a cost-effective and feasible technique for the deep denitrification of wastewater, based on sulfur autotrophic denitrification mediated by polysulfides ( S n 2 ). Various polysulfides were used as electron donors in an aerobic/anoxic sequencing batch reactor (SBR) to simulate nitrification and denitrification processes. The performance of different polysulfide species and their respective dosages were evaluated to determine the optimal conditions for nitrogen removal. Under optimal nitrogen removal conditions with a dosing of 19.2 mg S/L from Na2S3, the system was operated continuously for 38 days, with low sludge production during the process. During stable operation, the system achieved an average removal of 7.3 mg/L of N O 3 - N , corresponding to a removal efficiency of 23.1%. No significant accumulation of N O 2 - N was observed in the effluent, and the average utilization efficiency of Na2S3 reached 83.7%. Continuous dosing of Na2S3 promoted the enrichment of sulfur autotrophic denitrification-related microorganisms within the system.

1. Introduction

Nitrogen pollution in aquatic environments continues to pose a serious environmental challenge in China. The excessive accumulation of nitrogen, particularly in the forms of N H 4 + - N , N O 3 - N , and N O 2 - N , frequently results in eutrophication, algal overgrowth, and water blooms, which severely degrade aquatic ecosystems and water quality, ultimately affecting the habitat of aquatic organisms [1,2]. Therefore, the control of TN concentrations in aquatic environments is critically important. In recent years, China has implemented stricter wastewater discharge regulations, with several regions adopting more stringent TN discharge standards. For instance, the “Standards of water quality for wastewater treatment plant” of Shenzhen [3] mandates that TN concentrations in effluent from wastewater purification plants must be maintained below 10 mg/L (B standard) and 8 mg/L (A standard) [4].
However, conventional wastewater treatment processes often struggle to meet TN standards, especially when the wastewater has low C/N ratios. To enhance the nitrogen removal efficiency, many wastewater treatment plants resort to adding exogenous carbon sources (e.g., sodium acetate, methanol), which significantly increases the operating costs [5]. This challenge underscores the urgent need for low-cost, high-efficiency nitrogen removal technologies that comply with stringent emission standards while reducing operational expenses and minimizing ecological impact.
In recent years, sulfur-based autotrophic denitrification has emerged as a promising solution for low-carbon wastewater treatment due to its advantages, including the absence of additional carbon sources and low sludge production [6,7]. Compared with traditional heterotrophic denitrification, sulfur autotrophic denitrification offers high nitrogen removal efficiency, safe operation, and minimal residual sludge production [8,9,10,11]. Sulfur-based autotrophic denitrification is widely recognized as a cost-effective and sustainable nitrogen removal strategy [12]. A primary reason is the low cost and stable supply of elemental sulfur (S0). Sulfur is abundantly available as a byproduct of petroleum refining and natural gas desulfurization. Currently, over 80% of global sulfur production comes from such waste sources. This makes S0 an inexpensive commodity, especially when compared with additional carbon sources [13]. Besides the cheap electron donor, sulfur-driven processes produce less sludge because of the lower growth yield of autotrophic microorganism. The biomass yield in sulfur autotrophic denitrifiers is about 0.40–0.57 g VSS/g N O 3 - N , roughly half of that in heterotrophic systems (0.8–1.2 g VSS/g N O 3 - N ) [14]. Correspondingly, the cost of sludge disposal is much lower.
Sulfur autotrophic denitrification involves sulfur-oxidizing bacteria that utilize inorganic chemical energy or light energy to convert nitrogen compounds to nitrogen gas under anoxic or anaerobic conditions, using reduced sulfur species (e.g., elemental sulfur (S0), sulfide (S2−), thiosulfate ( S 2 O 3   2 ), and so on) as electron donors. The reaction principles are described by Equations (1)–(3):
S 0 + 1.2   N O 3   + 0.4   H 2 O     S O 4   2 + 0.6   N 2 + 0.8   H +
S 2 + 1.6   N O 3   + 1.6   H +     S O 4   2 + 0.8   N 2 + 0.8   H 2 O
S 2 O 3   2 + 1.6   N O 3   + 0.2   H 2 O     2   S O 4   2 + 0.8   N 2 + 0.4   H +
The low solubility of S0 in water limits its application in elemental sulfur autotrophic denitrification (SDAD) technology for wastewater treatment. In SDAD, S2− serves as an electron donor, enabling a fast reaction rate and contributing to the acid-base balance. However, excessively high sulfide concentrations can inhibit microbial activity. In contrast, S 2 O 3   2 offers high solubility and bioavailability with superior nitrogen removal performance compared to S0 and S2−. Nevertheless, it consumes substantial alkalinity, increases operational costs, and tends to accumulate nitrite. As a result, its application remains primarily at the experimental stage.
Recent studies have indicated that polysulfides, naturally formed by the abiotic reaction of elemental sulfur with sulfides, exhibit good water solubility. The chemical formula of polysulfides is S n   2 , where sulfur atoms form long-chain structures, as illustrated in Figure 1.
S n 2 play a crucial role in the sulfur cycle. Under neutral or alkaline conditions, HS can attack S0, causing it to break and form S n 2 . These S n 2 can cross cell membranes and undergo intracellular reduction to sulfide by NADPH or oxidation to elemental sulfur, thereby increasing the bioavailability of S0 and enhancing sulfur oxidation processes [12,15,16]. S n 2 dominate when sufficient sulfur is present, forming spontaneously when S0 coexists with sulfides [17]. Additionally, various enzymes in biological systems facilitate the use of S n 2 as electron donors, promoting autotrophic denitrification and improving wastewater denitrification efficiency. S n 2 -based electron donors have been shown to significantly improve autotrophic denitrification performance compared to using S0 alone. Xu et al. reported that the addition of a small dose of sulfide (about 20 mg S/L) to sulfur-packed bioreactors increased the specific N O 3 - N removal rate by approximately 50% and reduced the proportion of N O 3 - N removed as N O 2 - N , from 1.6% to 0.7%, compared to the sulfide-free control [14]. Similarly, Qiu et al. demonstrated that the sulfur disproportionation-induced S n 2 formation achieved highly efficient autotrophic denitrification, with average denitrification rates of 1.46–1.65 kg/(m3·d) [18]. Bao et al. found that the appropriate addition of Na2S (0.9 kg/m3/d) to the sulfur-packed system could increase the N O 3 - N removal rate from 33.6% to 97.3%, but excessive addition would lead to the accumulation of N O 2 - N   [19].
However, concerns have been raised regarding the potential toxicity of S n 2 , which is primarily attributed to the hydrolysis or oxidation of them to release S2− into the system. S2− is an inhibitor for microbial activity, as it can disrupt membrane integrity, interfere with respiratory enzymes, and generate reactive sulfur species that induce oxidative stress in functional bacteria [20,21]. S0, which may also be formed during polysulfide transformation, is essentially non-toxic due to its low solubility and chemical inertness. S0 serves as a stable, slow-release electron donor and is well tolerated by sulfur-oxidizing bacteria. Therefore, controlling S n 2 dosage and maintaining favorable sulfur speciation are crucial for mitigating adverse effects and ensuring the stability of sulfur-based autotrophic denitrification systems. Overall, the formation of S n 2 significantly enhances the solubility and bioavailability of S0 in water, providing a promising avenue for efficient autotrophic denitrification in nitrogen removal. In addition, the research on polysulfides in denitrification and nitrogen removal remains limited. Further investigation is needed to deepen the understanding in this area. Therefore, this study explores the efficiency of autotrophic denitrification using polysulfides as electron donors.
This study employs an aerobic/anoxic sequencing batch reactor to simulate the nitrification and denitrification processes of the anaerobic/anoxic/oxic (AAO) system. The impact of polysulfides has been investigated by the addition of polysulfides to achieve autotrophic denitrification. The optimization has been identified by monitoring the denitrification performance, sulfur source utilization rate, and variations in nitrogen pollutants under different polysulfide species and dosages. Additionally, this study examines the denitrification efficiency, sludge characteristics, and functional microbial community structure during the stable operation of the polysulfide-driven autotrophic denitrification process to reveal the function of polysulfides in nitrogen removal.

2. Materials and Methods

2.1. Reactor System and Operation

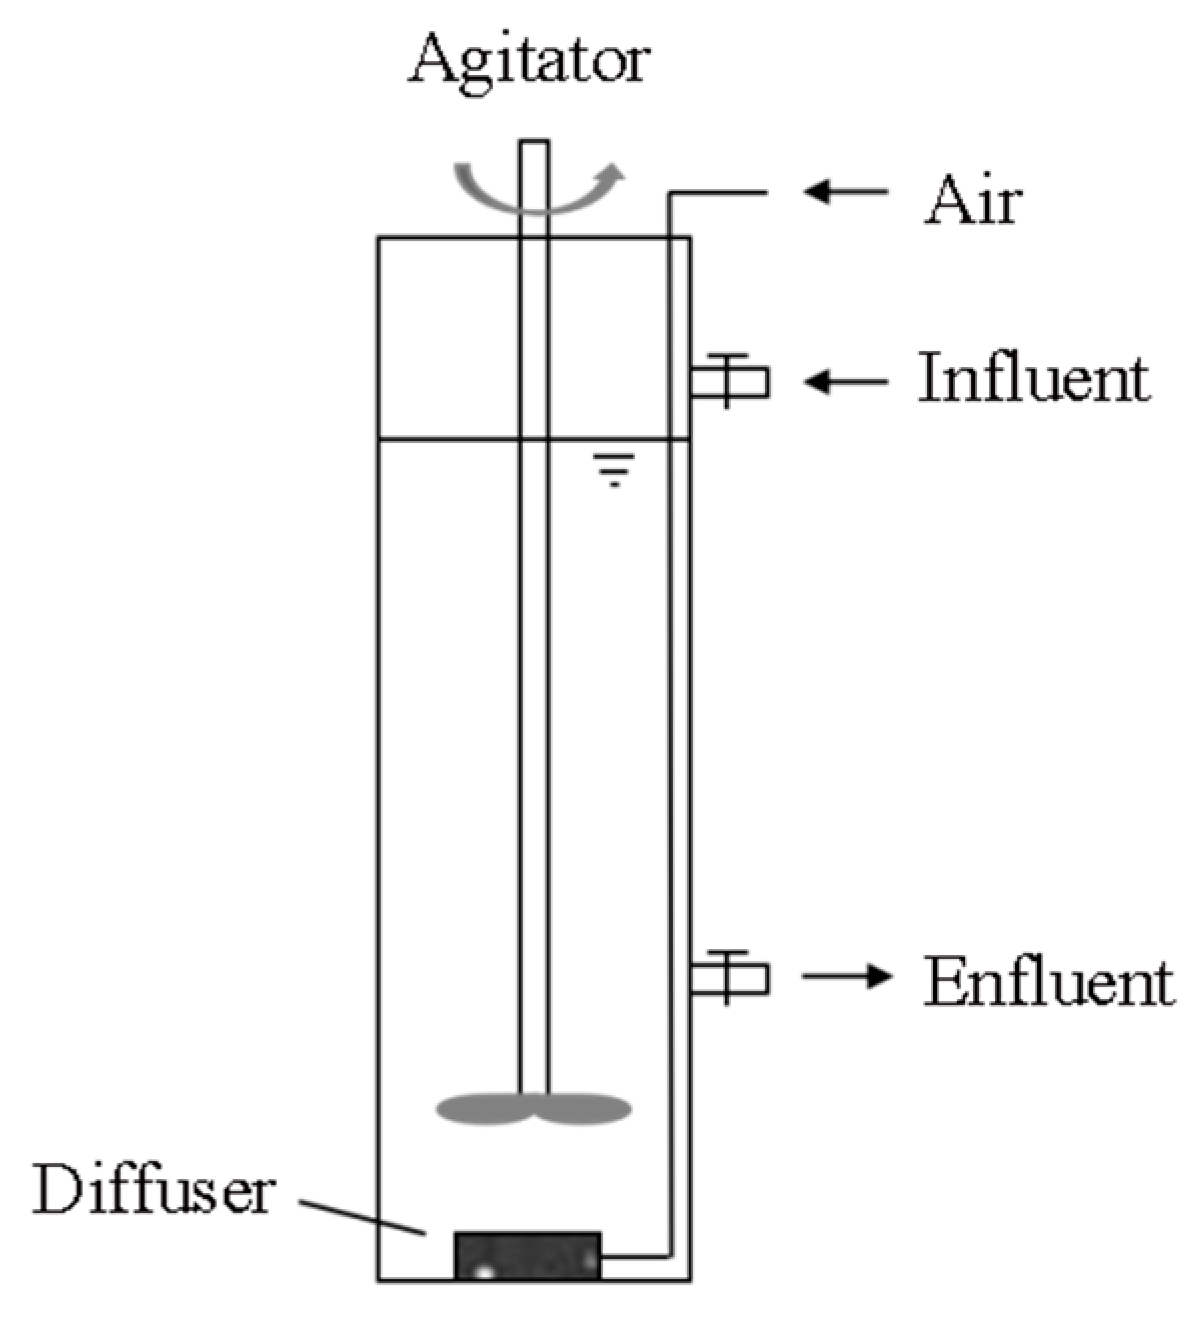
A schematic diagram of the aerobic/anoxic sequencing batch reactor unit is presented in Figure 2. The reactor was constructed from transparent polyvinyl chloride (PVC) tubes with an inner diameter of 100 mm and an effective volume of 3 L. Influent and effluent were introduced and discharged at heights of 40 cm and 18 cm from the bottom of the reactor, respectively, with a drainage ratio of 60%. During the aerobic stage, aeration was provided by an air compressor connected to a diffuser located at the reactor bottom. An electric stirrer was used to ensure a thorough mixing of the sludge and water.
Each operational cycle lasted 8 h, with the time settings for each stage detailed in Table 1. During the aerobic phase, the aeration rate was adjusted to 2 L/min using a flowmeter. During the anoxic phase, an electric stirrer was employed to regulate the speed of 200–300 r/min. Residual dissolved oxygen (DO) may inhibit the activity of denitrifying bacteria, leading to delayed or incomplete N O 3 - N reduction. To eliminate residual DO and establish anoxic conditions, a concentrated chemical oxygen demand (COD) solution was added within 5 min of transitioning from the aerobic to the anoxic stage, resulting in a final COD concentration of about 30 mg/L in the 3.0 L reactor volume. The biodegradable organics promoted microbial oxygen uptake, thereby depleting DO to below 0.20 mg/L within 5 min.

2.2. Influent Water Quality

In this study, a simplified synthetic wastewater was used to simulate the nitrogen transformation pathway in the aerobic and anoxic phases of the AAO process, rather than to fully replicate the composition of municipal wastewater. The synthetic feed contained ammonium as the sole nitrogen source, and no organic carbon was added to allow for the evaluation of sulfur-based autotrophic denitrification. The composition of the synthetic wastewater is shown in Table 2.
To enhance the simulation, trace element concentrates were added, consisting of two types with specific compositions and concentrations listed in Table 3 and Table 4, respectively. For each liter of synthetic wastewater, 1 mL of Trace Element Concentrate I and 2 mL of Trace Element Concentrate II were added.

2.3. Polysulfide Solutions

Polysulfides are usually synthesized by two methods, sodium hydrosulfide oxidation and sodium sulfide synthesis. The sodium hydrosulfide oxidation method requires harsh preparation conditions, involves a complex process, and is difficult to operate [22,23]. In contrast, the sodium sulfide synthesis method offers simpler preparation conditions and can produce sodium polysulfide at room temperature and atmospheric pressure [24]. Consequently, the sodium sulfide synthesis method was employed in this study to prepare the sodium polysulfide solution. The raw materials for this method include sulfur powder and sodium sulfide, with the preparation process involving the addition of sulfur powder to a sodium sulfide solution. The corresponding chemical reaction is shown in Equation (4):
N a 2 S +   ( n 1 )   S     N a 2 S n
In the equation, n = 1, 2, 3, 4, …
By adjusting the molar ratio of sulfur sulfide to sodium powder, sodium disulfide (Na2S2), sodium trisulfide (Na2S3), and sodium tetrasulfide (Na2S4) solutions were prepared. The specific dosing ratios are presented in Table 5.
To ensure complete dissolution of sulfur powder, the sodium polysulfide solution was stirred continuously for 48 to 72 h using a magnetic stirrer. Initially, the sodium sulfide solution is colorless and transparent. However, as the sulfur powder dissolves, the solution color changes from colorless to light yellow and eventually to orange-red.

2.4. Selection of Polysulfide Species

To investigate the autotrophic denitrification performance of different polysulfides as electron donors, appropriate amounts of Na2S, Na2S2, Na2S3, and Na2S4 solutions were added separately. This study compared pollutant removal efficiency, sulfur source utilization rate, and nitrogen concentration changes throughout the denitrification process. The experiments were conducted in two subseries.
In the first series, the denitrification efficiencies of sodium sulfide and sodium disulfide, when employed as electron donors, were compared. Equal amounts and concentrations of sodium sulfide and sodium disulfide solutions were added to compare their denitrification performance, aiming to determine whether S0 in polysulfides was effectively used in the autotrophic denitrification process. The experiment was carried out in two stages. The dosage of sulfur compounds in each stage is shown in Table 6.
In the second series, the respective denitrification performance of Na2S2, Na2S3, and Na2S4 when used as autotrophic denitrification electron donors was explored. In this study, the influent S/N ratio (the ratio of sulfur concentration to nitrogen concentration in the influent) was not used as a dosing control parameter. This is because sulfur was added at the transition from the aerobic to the anoxic phase, whereas N O 3 - N concentrations at that time varied dynamically across SBR cycles. Therefore, calculating a fixed S/N ratio based on influent N H 4 + - N would be inappropriate and unrepresentative of actual electron demand during denitrification. Additionally, due to variations in S0 and S2− content among the systems, the theoretical dosages required for the removal of each gram of N O 3 - N differed accordingly. To compare the nitrogen removal efficiencies of different polysulfide types, their required dosages were calculated based on the theoretical removal of 10 mg/L of N O 3 - N . The experiment was carried out in three stages. The dosage of polysulfides in each stage is shown in in Table 7.
To quantitatively evaluate the roles of S0 and S2− in N O 3 - N removal, the contribution and utilization rates in various polysulfide-based autotrophic denitrification systems were calculated by Equations (5) to (8).
R S 0 = M T S 2 T S 0 T S 2
R S 2 = T S 0   M T S 0 T S 2
In the equations,
  • M—actual generation of S O 4   2 , in mg/L;
  • T S 2 —theoretical production of S O 4   2 when actual removal of N O 3 - N entirely due to S2−, in mg/L;
  • T S 0 —theoretical production of S O 4   2 when actual removal of N O 3 - N entirely due to S0, in mg/L;
  • R S 2 —proportion of the contribution of S2− to the actual removal of N O 3 - N , in %;
  • R S 0 —proportion of the contribution of S0 to the actual removal of N O 3 - N , in %.
η S 0 =   R S 0   ×   m N M N   ×   r S 0
η S 2 =   R S 2   ×   m N M N   ×   r S 2
In the equations,
  • M N —theoretical generation of N O 3 - N , in mg/L;
  • m N —actual generation of N O 3 - N , in mg/L;
  • r S 2 —proportion of the contribution of S2− to the theoretical removal of N O 3 - N , in %;
  • r S 0 —proportion of the contribution of S0 to the theoretical removal of N O 3 - N , in %;
  • η S 2 —relative utilization rate of S2− to N O 3 - N removal, in %;
  • η S 0 —relative utilization rate of S0 to N O 3 - N removal, in %.

2.5. Optimization of Polysulfide Dosage

The previous study identified the optimal polysulfide electron donor among Na2S, Na2S2, Na2S3, and Na2S4. In this section, the influence of different doses of optimal polysulfides on the nitrogen removal efficiency of autotrophic denitrification was examined. The optimal polysulfide dosage was selected based on a comprehensive assessment of denitrification performance, including N O 3 - N removal efficiency, N O 2 - N accumulation, sulfur utilization efficiency, and potential signs of process inhibition. The experiments in this section were conducted into six operational stages, with the corresponding polysulfide dosages outlined in Table 8.

2.6. Research on the Stable Operation of the Polysulfide Autotrophic Denitrification Process

Building upon prior research, the selected optimal electron donor and its dosage were used to operate the system stably for 38 days. Active sludge discharge was not carried out during operation. Denitrification performance was evaluated by measuring the concentrations of nitrogen pollutants in the initial anoxic phase and effluent and assessing sulfur source utilization. Sludge samples were collected regularly to analyze changes in sludge concentration and settling performance at different operating stages. The sampling times of sludge samples are shown in Table 9. Additionally, microbial community structure succession at the genus level was examined to understand its role in sulfur autotrophic denitrification.

3. Results and Discussion

3.1. Influence of Polysulfide Species on the Effectiveness of Autotrophic Denitrification for Nitrogen Removal

3.1.1. Comparison of Nitrogen Removal Performance Among Different Polysulfide Species

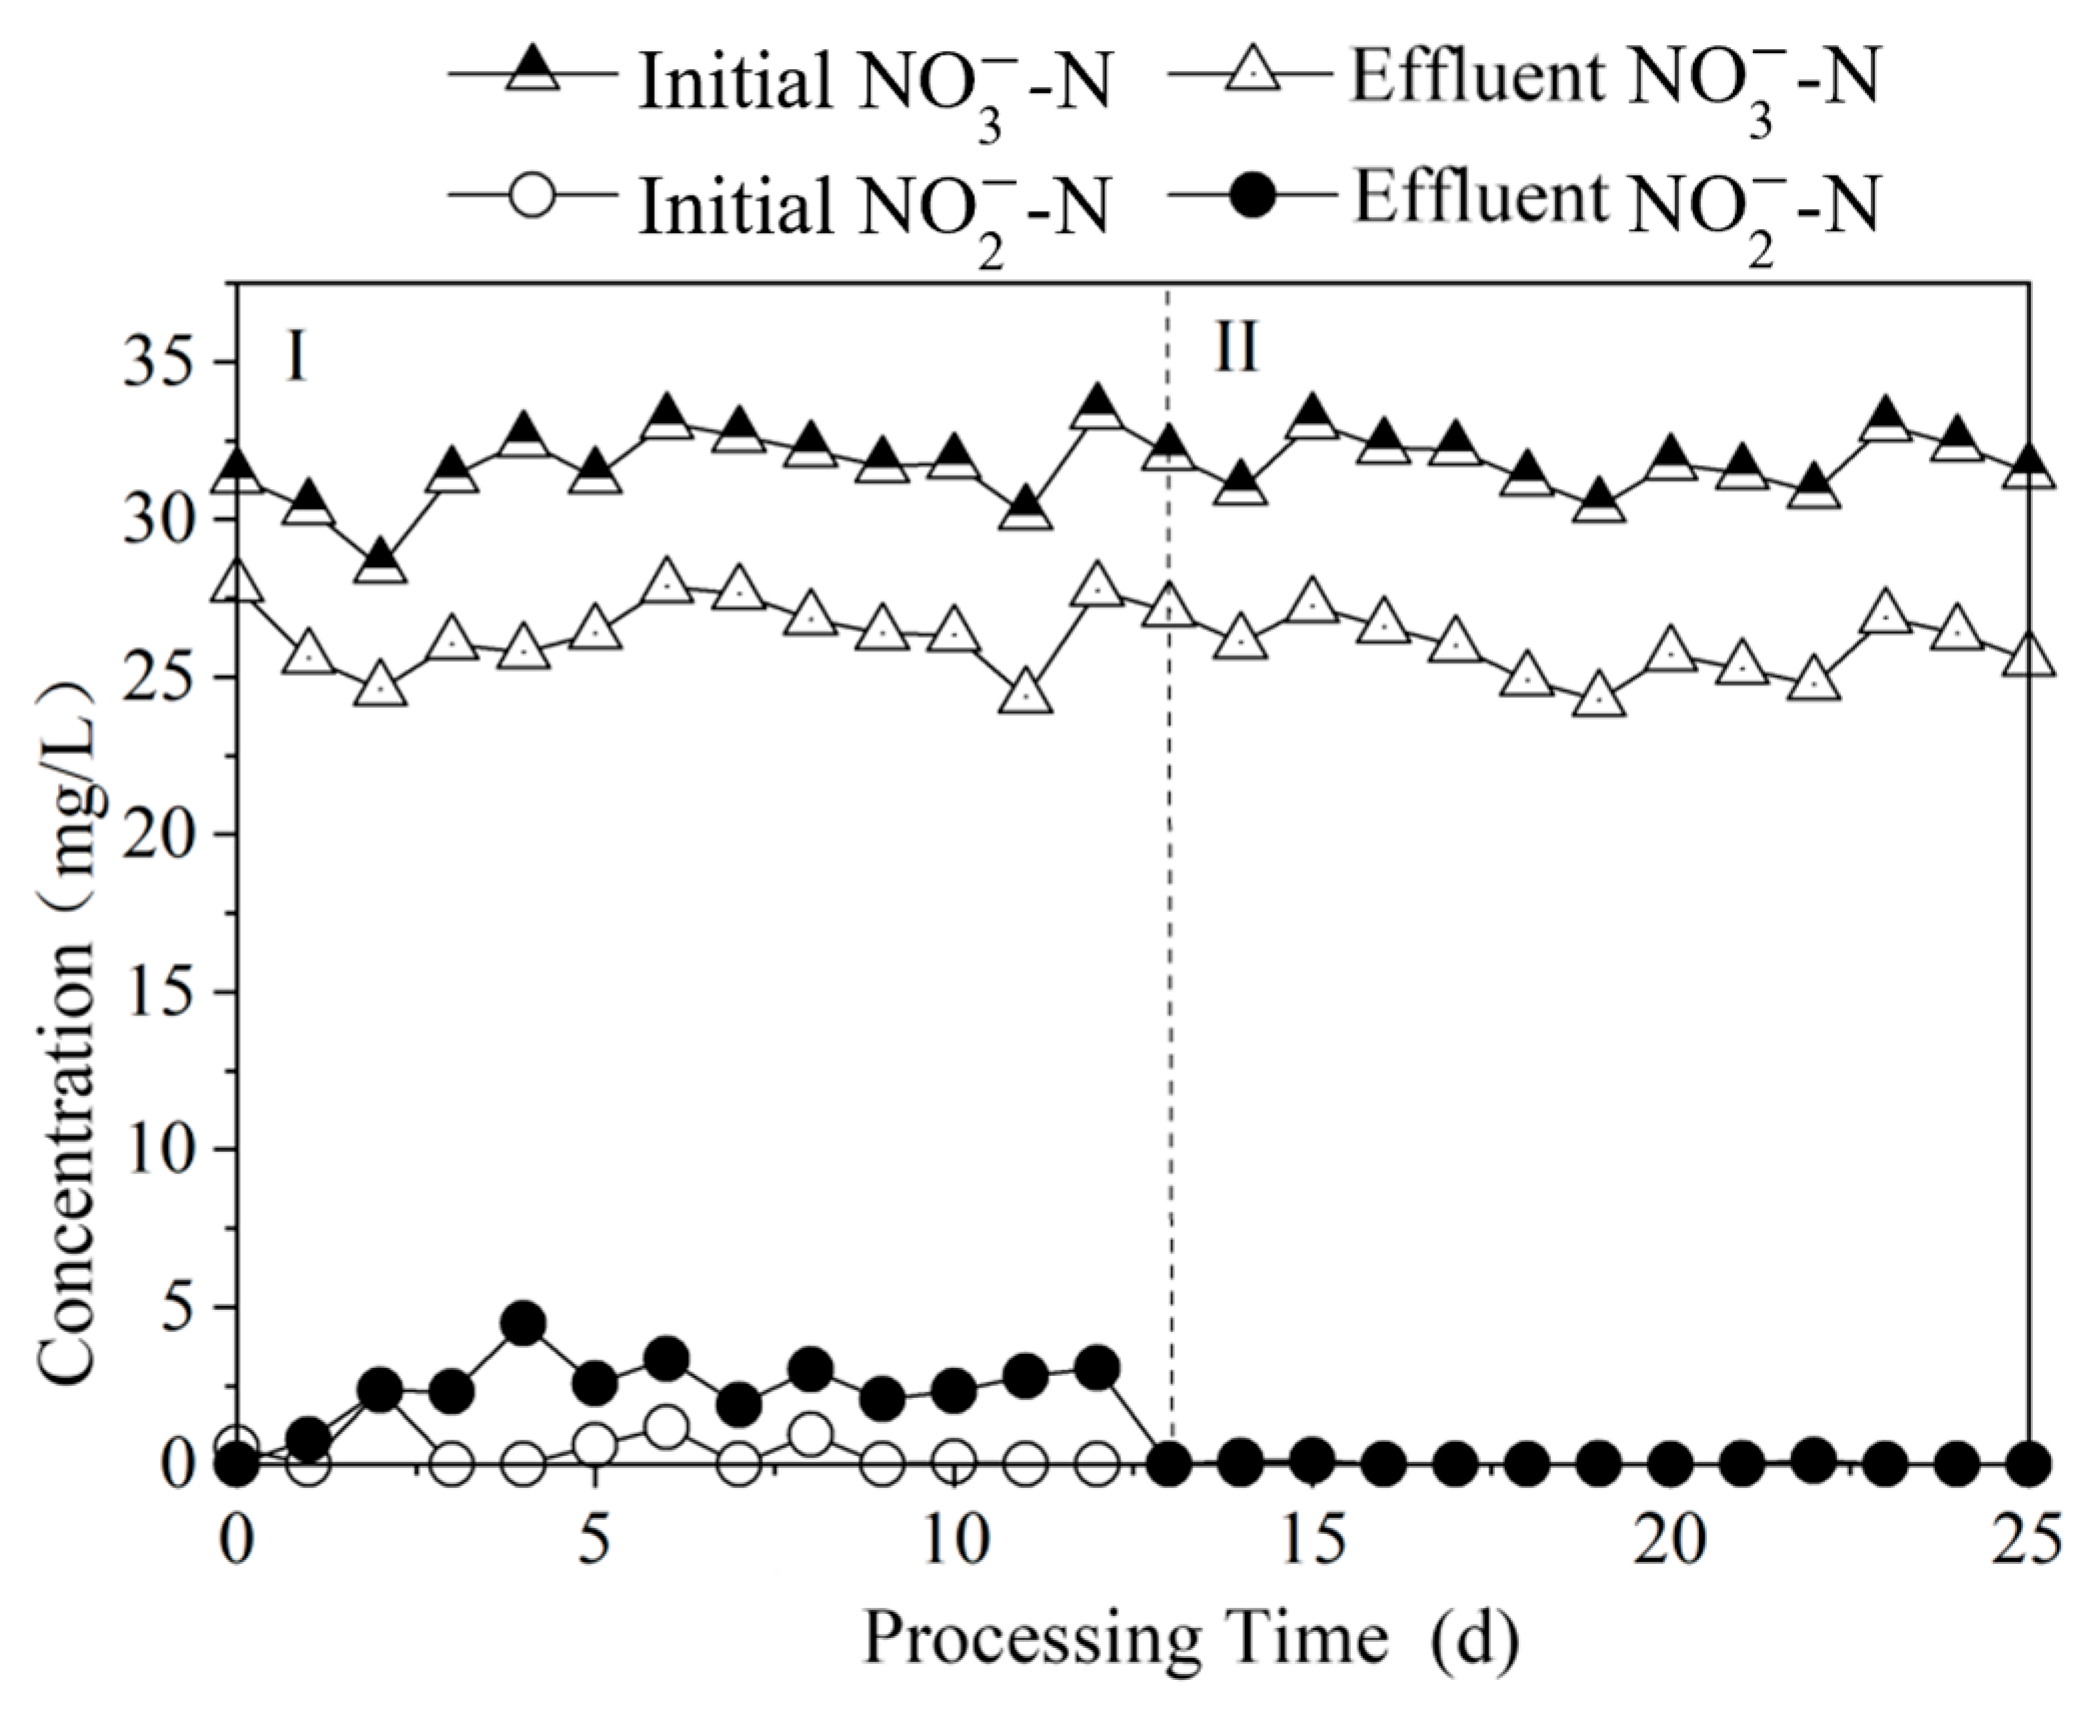
A comparative analysis was conducted to evaluate the denitrification efficiency of Na2S and Na2S2. N O 3 - N removal was primarily expressed as the absolute concentration (mg/L) reduced. This approach reflects the practical challenge in AAO systems, where residual N O 3 - N concentrations of several mg/L must be further removed to meet TN discharge standards. The concentration changes in the initial anoxic phase and effluent are presented in Figure 3. After the addition of sodium sulfide solution during Stage I, the average concentrations of N O 3 - N   in the initial anoxic phase and effluent were 31.6 mg/L and 26.4 mg/L, respectively, resulting in the removal amount of 5.2 mg/L (removal efficiency of 16.5%). Simultaneously, 2.4 mg/L of N O 2 - N was generated, corresponding to an accumulation rate of 46.3%. N O 2 - N accumulation was expressed as the percentage of N O 3 - N removed that was transformed into N O 2 - N , calculated by dividing the net increase in N O 2 - N by the net decrease in N O 3 - N during the anoxic phase. Previous studies have indicated that a lower S/N ratio in sulfide autotrophic denitrification systems promotes nitrite accumulation [25,26,27]. Therefore, it was hypothesized that the primary cause of N O 2 - N   accumulation in the experimental effluent is the low S/N ratio in the system.
During Stage II, the average concentrations of N O 3 - N in the initial anoxic phase and effluent were 31.8 mg/L and 25.9 mg/L, respectively, corresponding to a removal amount of 5.9 mg/L (removal efficiency of 18.6%). No accumulation of N O 2 - N was detected in the effluent. These results demonstrated that compared to sodium sulfide, an equivalent dose of sodium disulfide achieved an additional 0.7 mg/L of nitrogen removal without leading to N O 2 - N accumulation.
At present, study on the autotrophic denitrification of polysulfides remains limited. The prevailing perspective suggests that polysulfides are more readily utilized by microorganisms as electron shuttles. Within microbial cells, polysulfides are converted through a series of enzymatic reactions into S0 and S2− (with S2− representing the total dissolved sulfide in the system), which are subsequently utilized. In this study, the analysis of polysulfide utilization in denitrification systems was primarily based to the perspective corresponding to the S2−. During the evaluation of S0 utilization in the sodium disulfide system, it was initially assumed that all S2− contributed to autotrophic denitrification, theoretically supporting a N O 3 - N removal amount of up to 4.6 mg/L. However, the observed average removal amount of N O 3 - N was 5.9 mg/L, indicating that S0 in sodium disulfide also contributed to denitrification. The specific utilization rate of S0 requires further analysis in conjunction with the generation of sulfate ( S O 4   2 ). This aspect will be investigated in detail in Section 3.1.2.
Previous studies have demonstrated the considerable potential of polysulfides as electron donors in autotrophic denitrification. Several types of polysulfides, namely Na2S2, Na2S3, and Na2S4, have been identified. In this study, the denitrification performance of each type of polysulfide as an electron donor was further investigated.
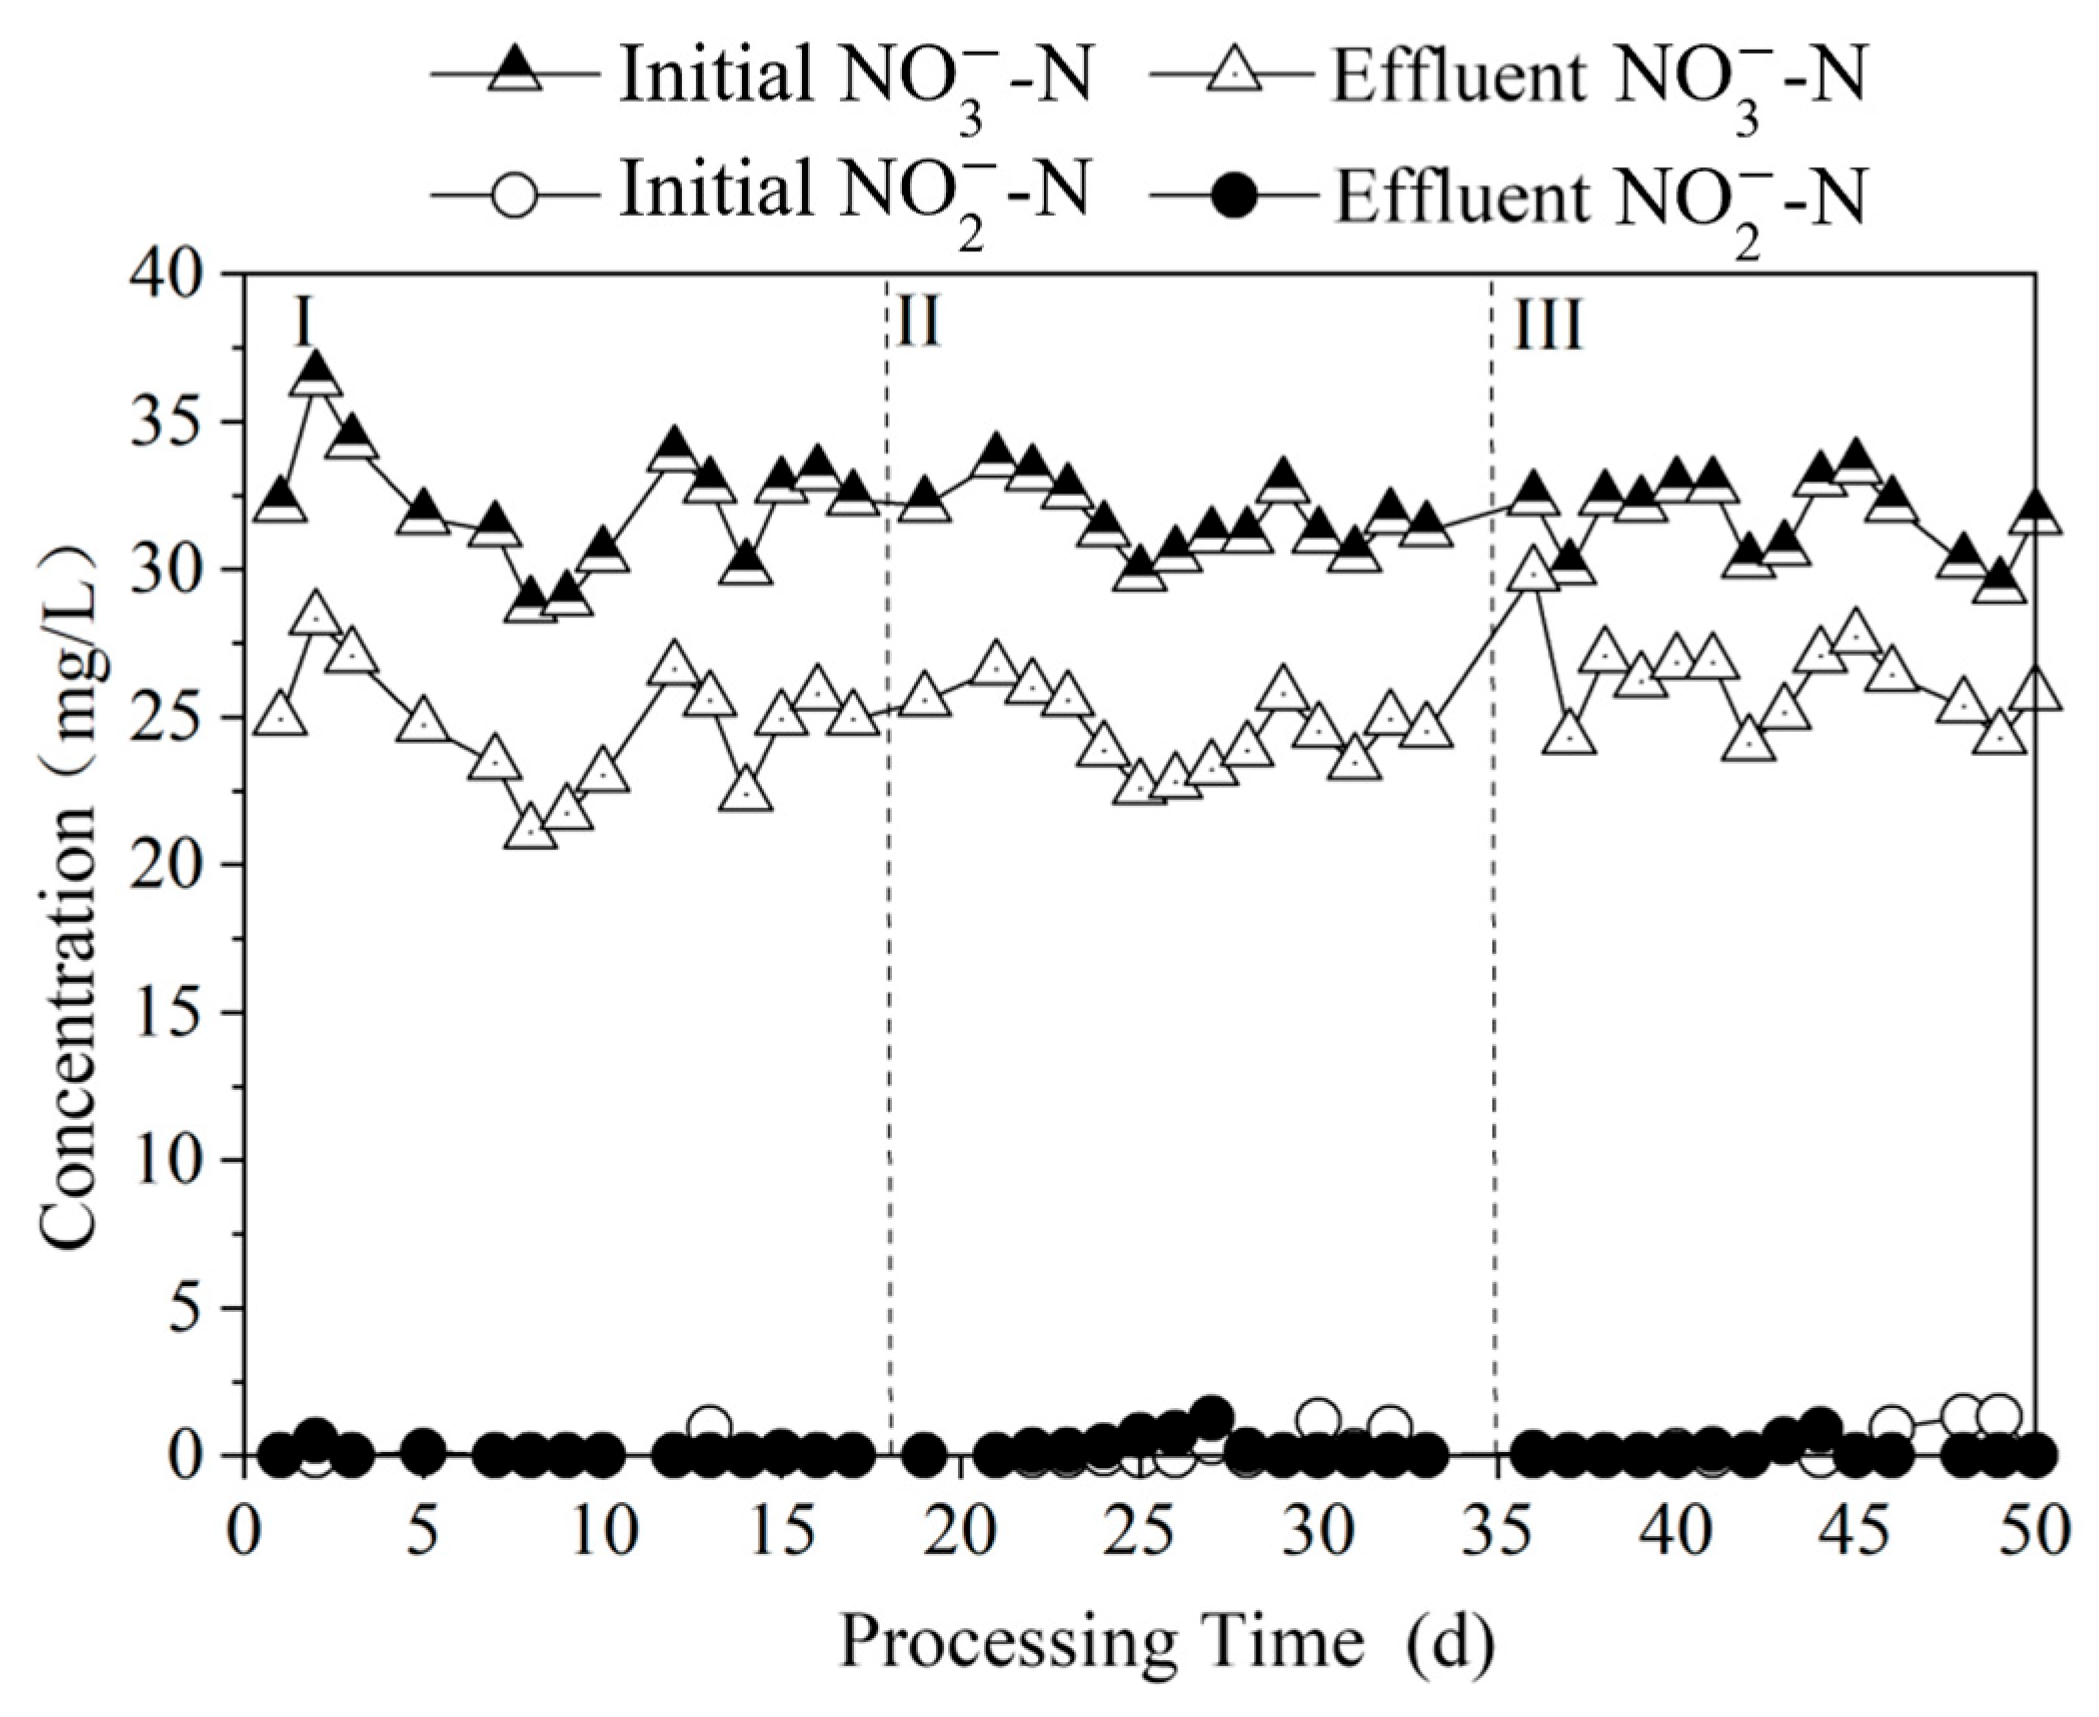
The variations in initial and effluent concentrations of   N O 3 - N   and N O 2 - N across the three operational stages are shown in Figure 4. In Stage I, the average initial and effluent concentrations of N O 3 - N were 32.1 mg/L and 24.6 mg/L, respectively, resulting in an average N O 3 - N removal amount of 7.5 mg/L (removal efficiency of 23.4%). In Stage II, the average initial and effluent concentrations N O 3 - N were 31.6 mg/L and 24.5 mg/L, respectively, resulting in an average N O 3 - N removal amount of 7.1 mg/L (removal efficiency of 22.5%). In Stage III, the average initial and effluent concentrations of N O 3 - N were 31.7 mg/L and 26.2 mg/L, resulting in an average N O 3 - N removal of 5.5 mg/L (removal efficiency of 17.4%). Notably, N O 2 - N accumulation in the effluent was negligible throughout all operational stages. In terms of N O 3 - N removal, both Na2S2 and Na2S3 demonstrated better performance than Na2S4.

3.1.2. Sulfur Utilization Efficiency Among Different Polysulfide Species

The utilization of Na2S and Na2S2 in the autotrophic denitrification process was analyzed initially. The autotrophic denitrification processes involving S0 and Na2S are illustrated in Equations (9) and (10) [28,29]:
1.1   S 0 + N O 3 + 0.76   H 2 O + 0.08   N H 4 + + 0.4   C O 2   0.08   C 5 H 7 O 2 N + 0.5   N 2   + 1.1   S O 4 2 +   1.28   H +
H S + 1.2 28   N O 3 + 0.4 38   HC O 3 +   0.5 73   H + + 0.093   N H 4 + + 0.027   C O 2   0.093   C 5 H 7 O 2 N + 0.614   N 2 + 0.866   H 2 O + S O 4 2  
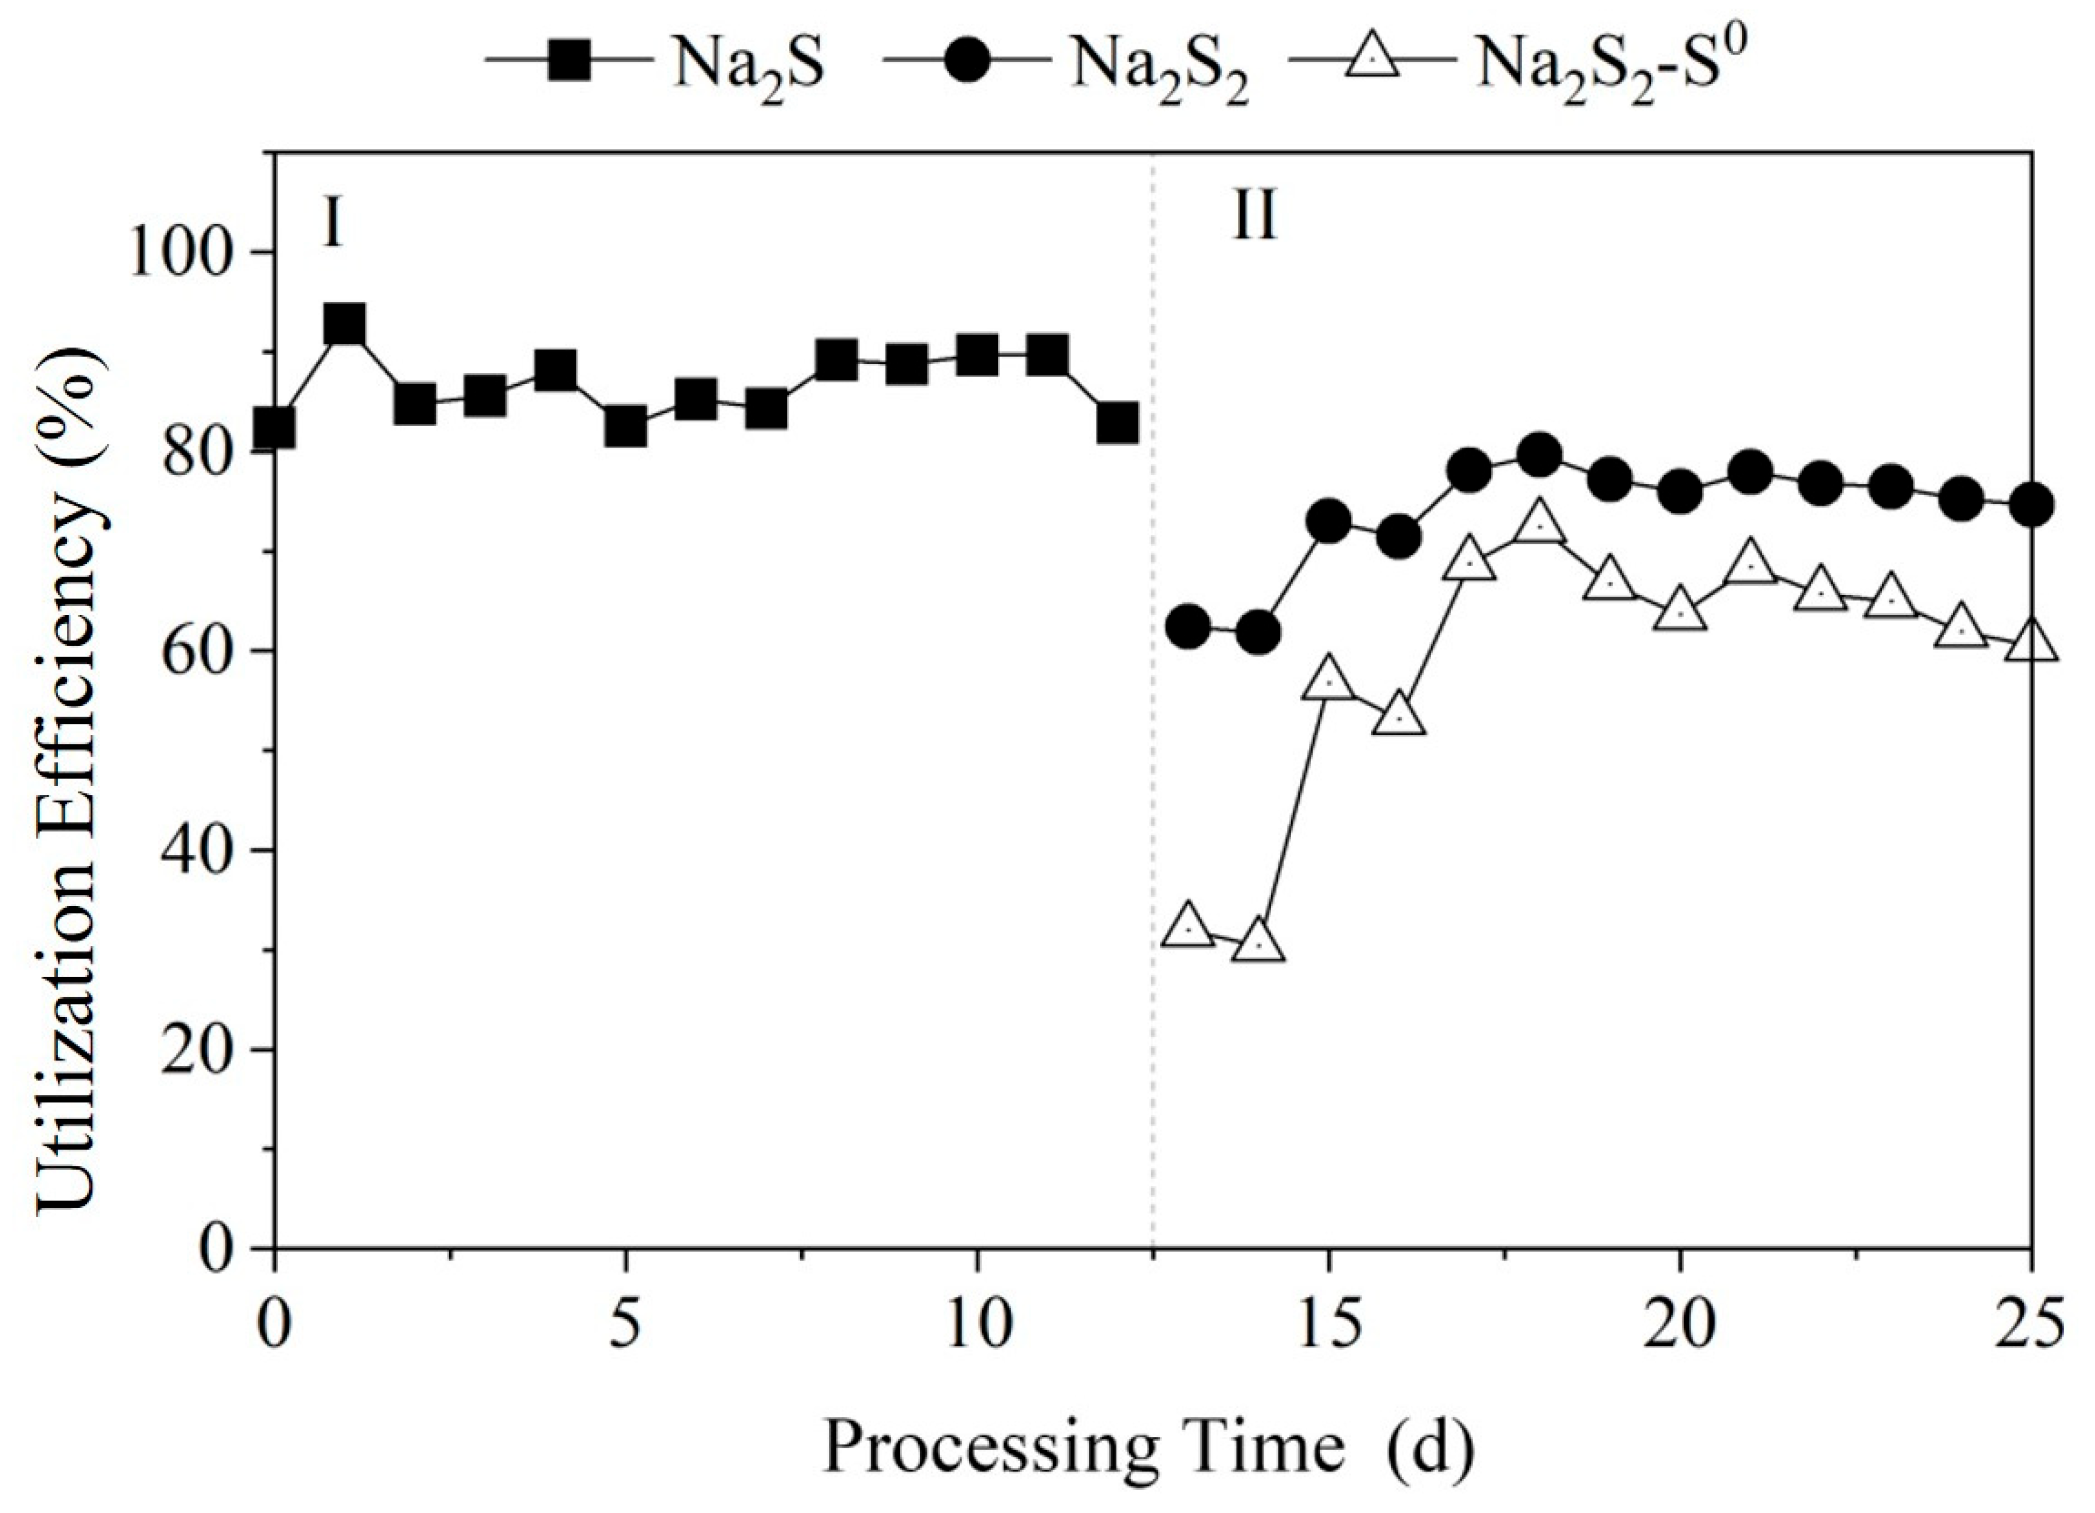
The utilization efficiency of the sulfur source was analyzed based on the theoretical and actual removal of N O 3 - N . Theoretically, the added Na2S is capable of removing 4.59 mg/L of N O 3 - N . However, in practice, the autotrophic denitrification process using Na2S led to the accumulation of N O 2 - N . Therefore, when calculating the utilization efficiency, the actual removal of N O 3 - N and the accumulation of N O 2 - N were uniformly converted into the number of electrons utilized. Additionally, the added Na2S2 is theoretically capable of removing 8.0 mg/L of N O 3 - N . By calculation, the average utilization efficiencies of Na2S and Na2S2 were 86.6% and 76.0%, respectively, as shown in Figure 5.
Further analysis of S0 utilization in Na2S2 system was conducted performed under the assumption that S2− utilization was identical in both Na2S and polysulfide systems. Based on the actual utilization efficiency of 86.6% measured in the Na2S system, an average S0 utilization efficiency of 65.4% in Na2S2 was calculated. It is suggested that S0 dissolved from polysulfides can serve as an electron donor in autotrophic denitrification.
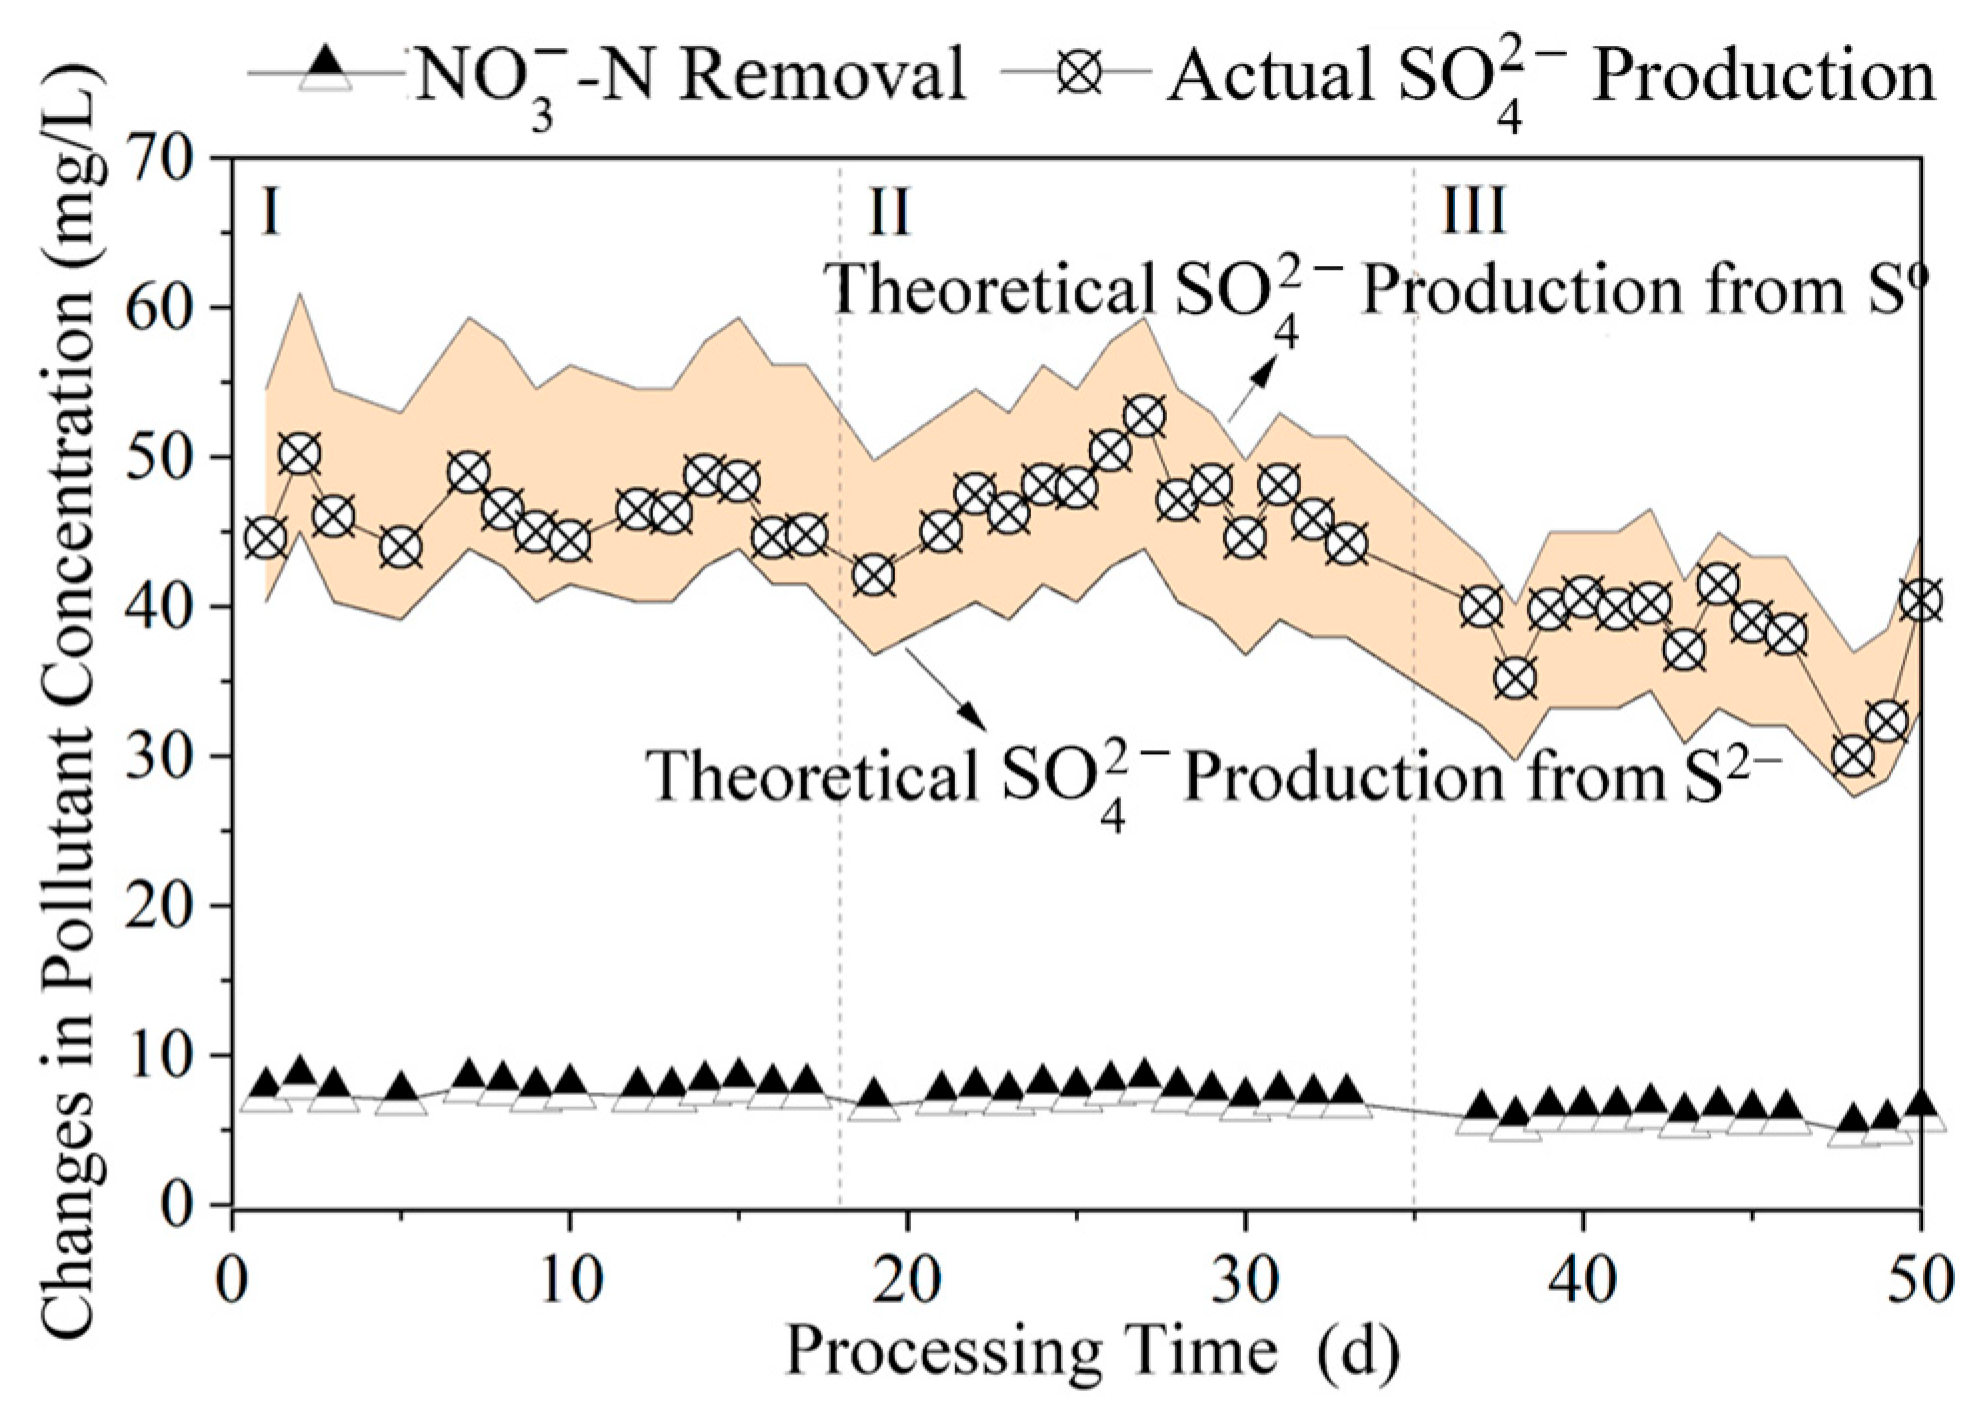
The utilization efficiencies of Na2S2, Na2S3, and Na2S4 as electron donors in autotrophic denitrification were compared based on the amount of S O 4   2 generated. According to the reaction illustrated in Equations (5) and (6), the amount of S O 4   2 generated is related to the type of electron donor used in autotrophic denitrification. When S0 and S2− were employed as electron donors in autotrophic denitrification, the corresponding S O 4   2 yields were 7.5 mg/L and 5.6 mg/L per mg of N O 3 - N removed, respectively.
To investigate the utilization of different polysulfide species, it was initially assumed that S0 or S2− were the sole electron donors involved in the autotrophic denitrification process. Theoretical S O 4   2 production was calculated based on the actual N O 3 - N removal, assuming either S0 or S2− served as the sole electron donor. By comparing actual and theoretical production of S O 4   2 , the utilization efficiencies of S0 and S2− in the autotrophic denitrification of polysulfides were determined. The actual S O 4   2 production values were 46.3 mg/L, 47.0 mg/L, and 36.3 mg/L when different polysulfides were employed as electron donors, as shown in Figure 6.
When Na2S2 was added, the actual S O 4   2 production values closely matched the theoretical production values for autotrophic denitrification using S2− as the sole electron donor. When Na2S3 was added, the actual S O 4   2 production values fell between the theoretical production values from S0 and S2− systems. When Na2S4 was added, the actual S O 4   2 production values were more consistent with the theoretical values for autotrophic denitrification using S0 alone. These results suggest that the utilization efficiencies of S0 and S2− differ among polysulfide species, and that microorganisms may exhibit selectivity in their using S0 and S2− during autotrophic denitrification.
The respective contributions of S0 and S2− from polysulfides during autotrophic denitrification were further explored. The individual contributions of S0 and S2− to nitrogen removal are shown in Figure 7. The contribution rates of S0 in Na2S2, Na2S3, and Na2S4 were 31.9%, 52.7%, and 55.4%, respectively. With an increasing proportion of S0 in the polysulfide compounds, its contribution to denitrification also increased.
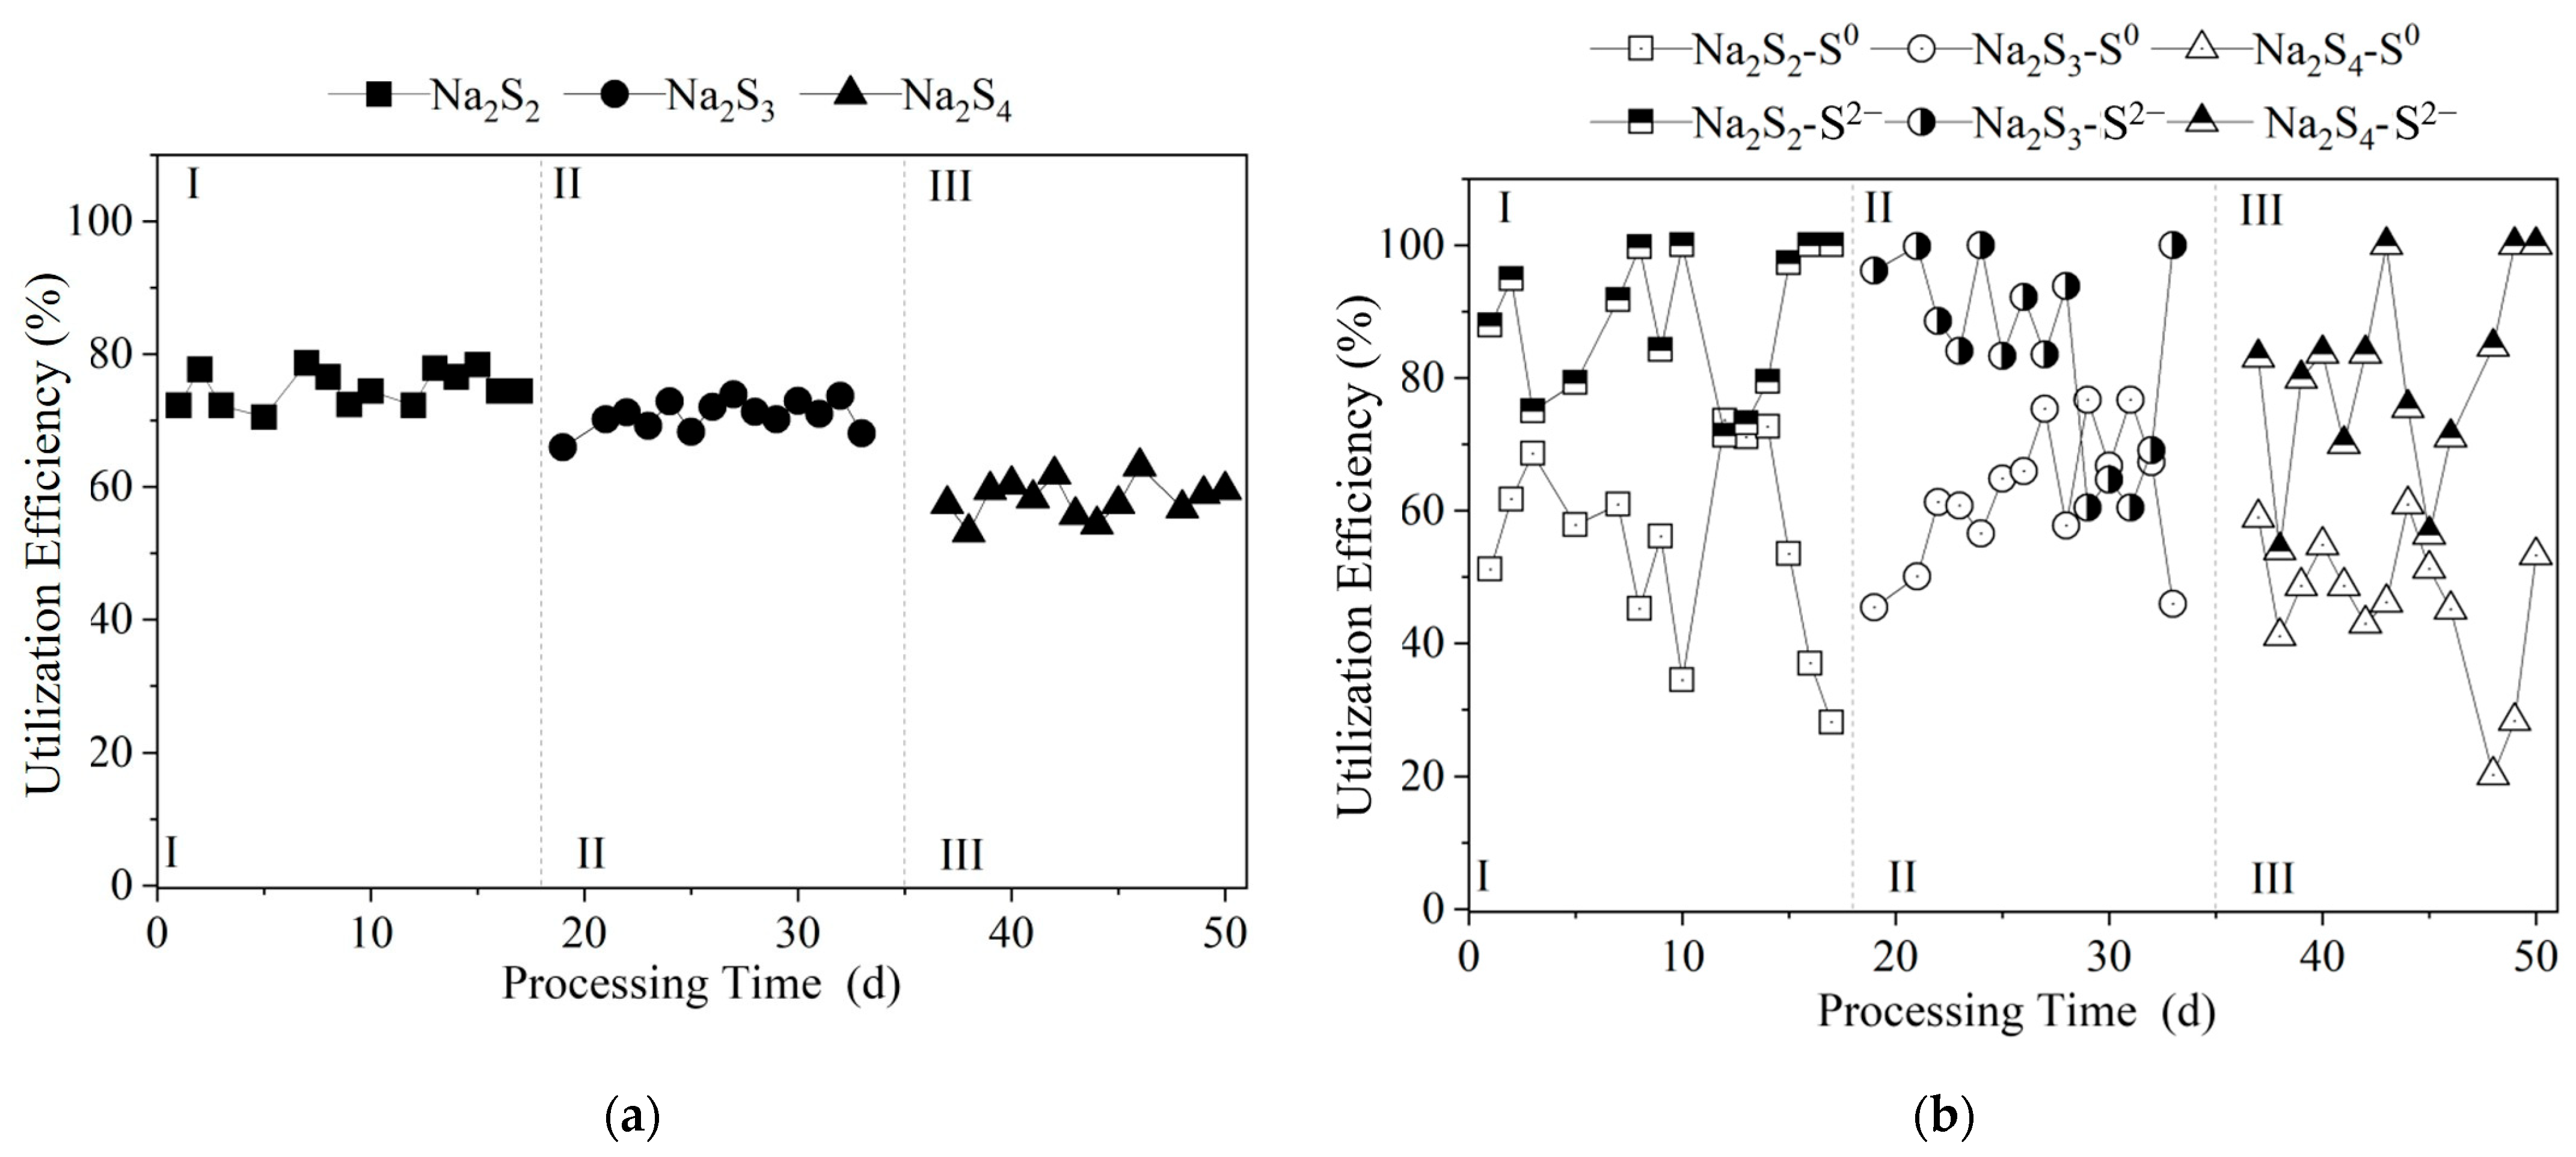
In addition, due to the differences in N O 3 - N removal among various types of polysulfides, it is necessary to compare the overall utilization efficiency of each polysulfide with the individual utilization efficiencies of S0 and S2−. As shown in Figure 8a, the average utilization efficiencies of Na2S2, Na2S3, and Na2S4 were 75.1%, 71.2%, and 58.7%, respectively. The overall utilization efficiencies of Na2S2 and Na2S3 were similar, while the utilization efficiency of Na2S4 was significantly lower, indicating that approximately 40% of the sulfur source remained unutilized in the Na2S4 autotrophic denitrification system.
The utilization efficiencies of S0 and S2− in polysulfides during autotrophic denitrification are shown in Figure 8b. It is indicated that the utilization efficiency of S2− was higher than that of S0 when different types of polysulfides were used as electron donors. Specifically, the utilization efficiency of S2− approached 90% in both the Na2S2 and Na2S3 systems, whereas it was only 80.8% in the Na2S4 system. Additionally, S0 utilization efficiency remained relatively low across all polysulfide systems, with corresponding values of 55.2%, 62.3%, and 42.9%. These findings suggest that microorganisms preferred to utilize S2− over S0 as an electron donor for autotrophic denitrification.
In the Na2S4 system, although S0 accounted for over half (55.4%) of the N O 3 - N removal, its actual utilization rate remained relatively low. This phenomenon may be attributed to the accumulation of underutilized S2−, which could inhibit microbial activity and further limited the efficiency of S0 utilization. As a result, the actual contribution of S0 to N O 3 - N removal in the Na2S4 system was only 3.0 mg/L, compared to 3.7 mg/L in the Na2S2 system, despite a lower percentage (52.7%) in the latter. This comparison suggests that the higher S0 contribution in the Na2S4 system did not reflect an improvement in S0 utilization efficiency but rather resulted from the relatively higher S0 content in Na2S4.
The comparative analysis of the autotrophic denitrification performance between Na2S2 and Na2S3 showed that although Na2S2 achieved 0.4 mg/L more N O 3 - N removal, Na2S3 exhibited a 6.3% higher S0 utilization rate. Furthermore, the higher proportion of S0 in Na2S3 compared to Na2S2 resulted in a 30% reduction in the sulfur dosage required to achieve equivalent N O 3 - N removal.
S0 is less expensive and more readily available on the market. Na2S3 presented greater potential for N O 3 - N removal and was therefore considered a more suitable electron donor for autotrophic denitrification in terms of both efficiency and economic cost. Accordingly, in subsequent studies, Na2S3 was selected as the electron donor for polysulfide-based autotrophic denitrification, with all subsequent references to polysulfides specifically referring to Na2S3.

3.1.3. Time-Dependent Changes in Nitrogen Pollutants Among Different Polysulfide Species

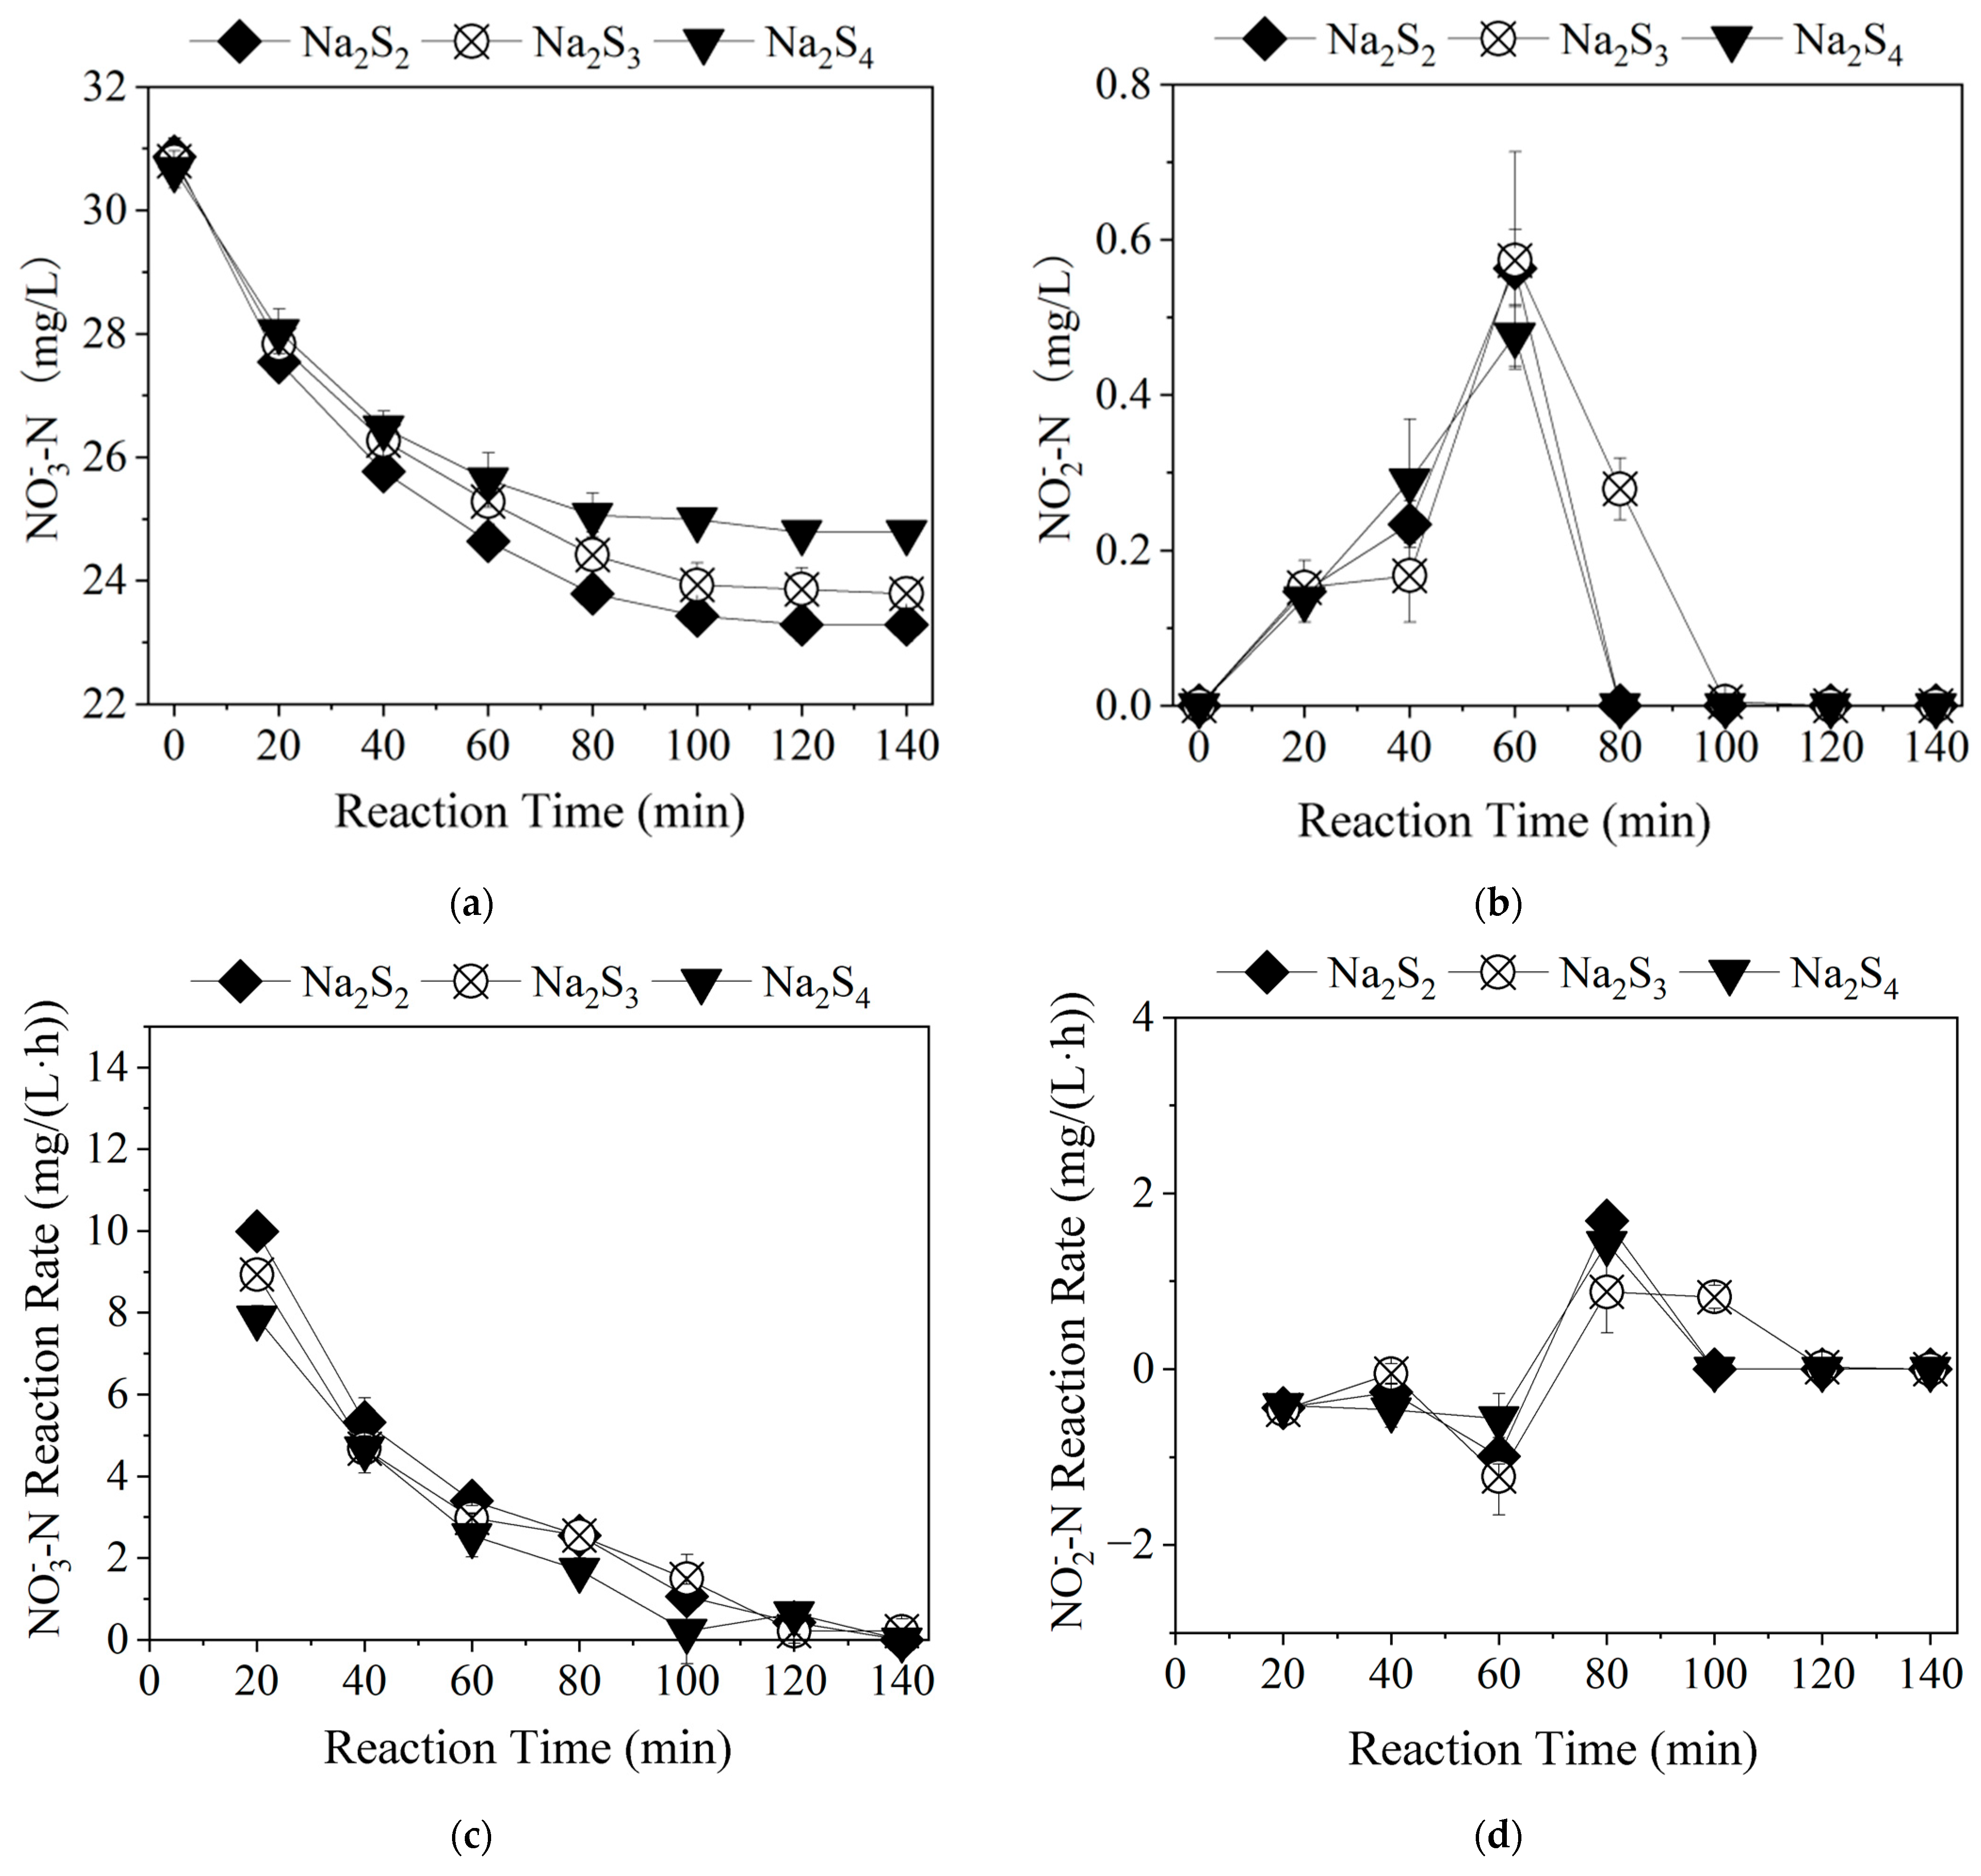
As can be seen from Figure 9, during the process of autotrophic denitrification of polysulfides, the majority of N O 3 - N removal was achieved within the first 40 min of the reaction. At 20 min of the reaction, the N O 3 - N removal rates of each system peaked at 10.0 mg/(L·h), 8.9 mg/(L·h), and 7.9 mg/(L·h), respectively. Subsequently, the N O 3 - N removal rates gradually declined. It can be seen that the N O 3 - N removal rate of the Na2S2 system was higher than that of the Na2S3 and Na2S4 systems. This may be attributed to the fact that S2− has a higher denitrification rate than S0 under equivalent conditions. Moreover, some studies have pointed that S2− can provide alkalinity supplementation for sulfur autotrophic denitrification to a certain extent, thereby enhancing the denitrification rate [30,31,32]. As the reaction progressed, the concentration of S2− in the system decreased, and the promotion effect of S2− on S0 denitrification gradually disappeared, so the removal rate gradually declined. The Na2S2 system had a relatively higher S2− concentration compared to the Na2S3 and Na2S4 systems, which contributed to its higher overall denitrification rate.
At 60 min of the reaction, the N O 2 - N concentrations in all systems peaked at 0.6 mg/L, 0.6 mg/L, and 0.5 mg/L, indicating that during the first 60 min, the rate of reduction of N O 3 - N to N O 2 - N was higher than the rate of conversion of N O 2 - N to N2. After 60 min of reaction, N O 2 - N concentrations began to decrease, and no N O 2 - N accumulation was observed at the end of the reaction.

3.2. Influence of Polysulfide Dosage on the Effectiveness of Autotrophic Denitrification for Nitrogen Removal

3.2.1. Comparison of Nitrogen Removal Effect at Different Na2S3 Dosages

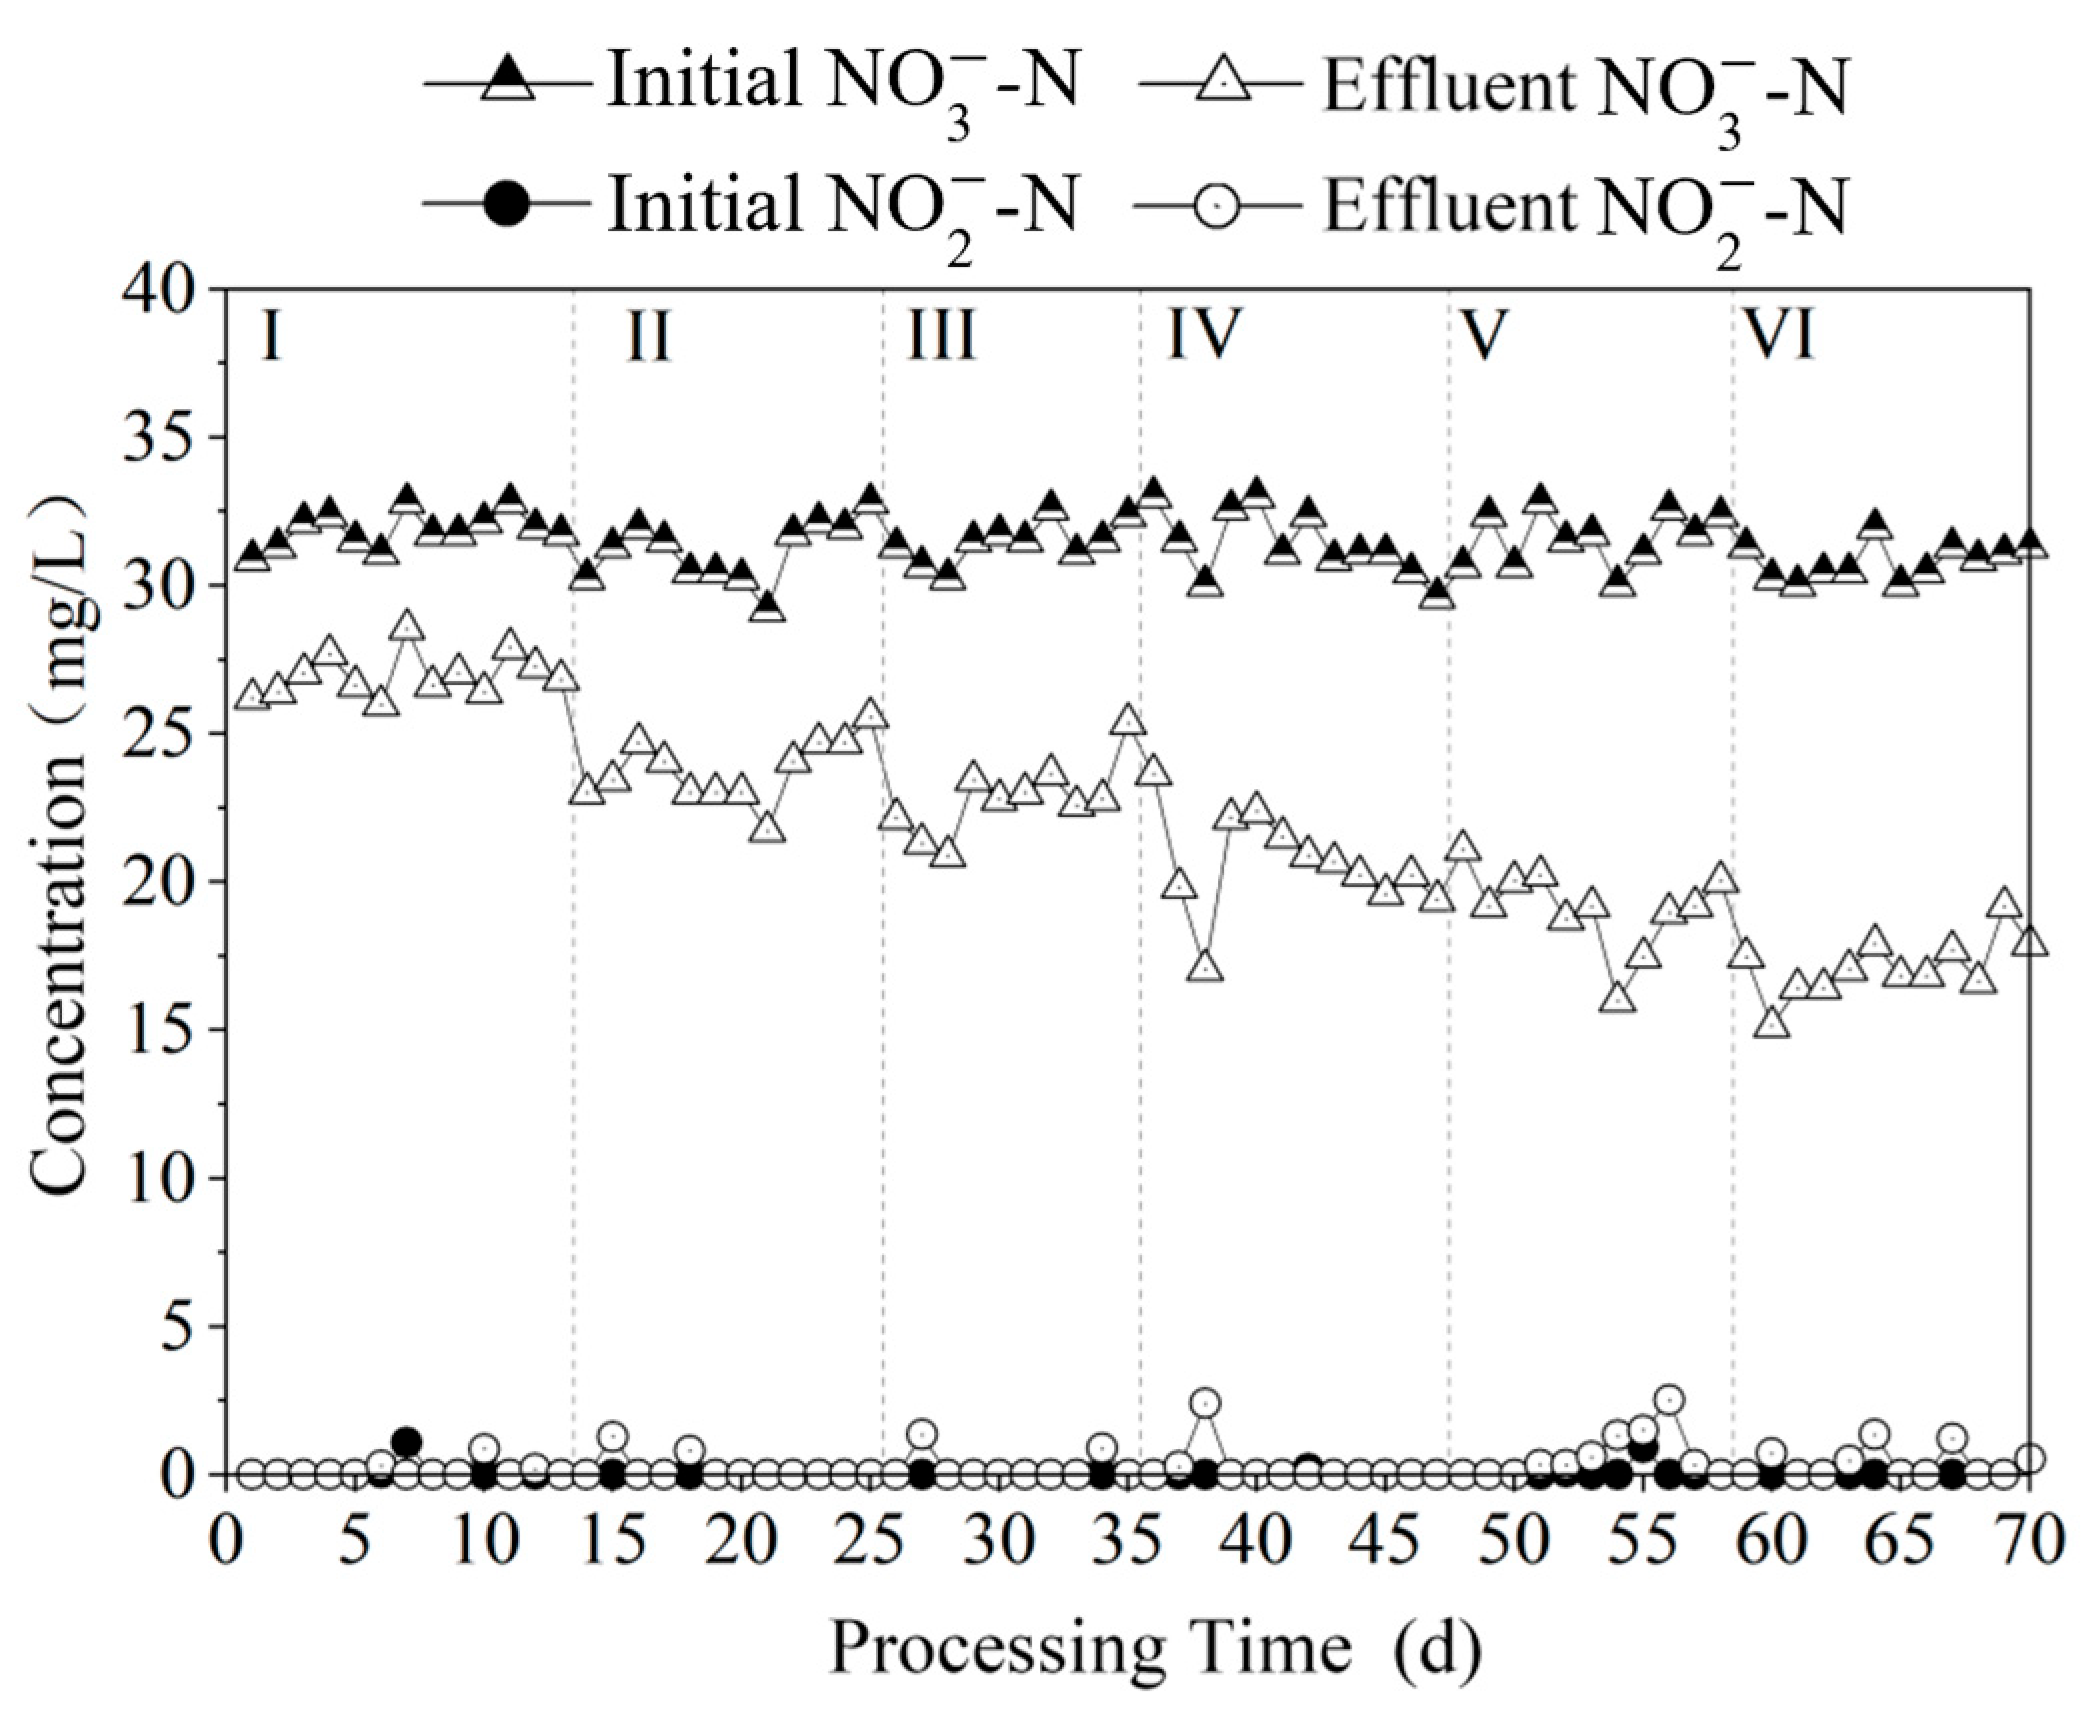
The nitrogen removal performance under varying polysulfide dosages is presented in Figure 10. Increasing the polysulfide dosage led to a gradual decrease in the N O 3 - N concentration in the effluent. Although occasional fluctuations were observed in the effluent, the N O 2 - N concentration generally remained below 2.0 mg/L, with no significant accumulation of N O 2 - N . The respective, average N O 3 - N removal amount at each stage was 4.9 mg/L, 7.4 mg/L, 8.6 mg/L, 10.9 mg/L, 12.5 mg/L, and 13.7 mg/L.
In stages V and VI, the sulfur concentration increased from 51.2 mg S/L to 64.0 mg S/L, theoretically improving N O 3 - N removal amount by 5.7 mg/L. However, the actual N O 3 - N removal amount increased by only 1.2 mg/L. This discrepancy may be attributed to the fact that when the polysulfide dosage increases, the rising S2− concentration could inhibit the biological activity of autotrophic denitrifying bacteria, consequently affecting the bioavailability of S0 and reducing autotrophic denitrification efficiency [9,33,34,35]. Therefore, although increasing polysulfide dosage improved N O 3 - N removal, it simultaneously reduced the polysulfide utilization efficiency.

3.2.2. Sulfur Utilization Efficiency at Different Na2S3 Dosages

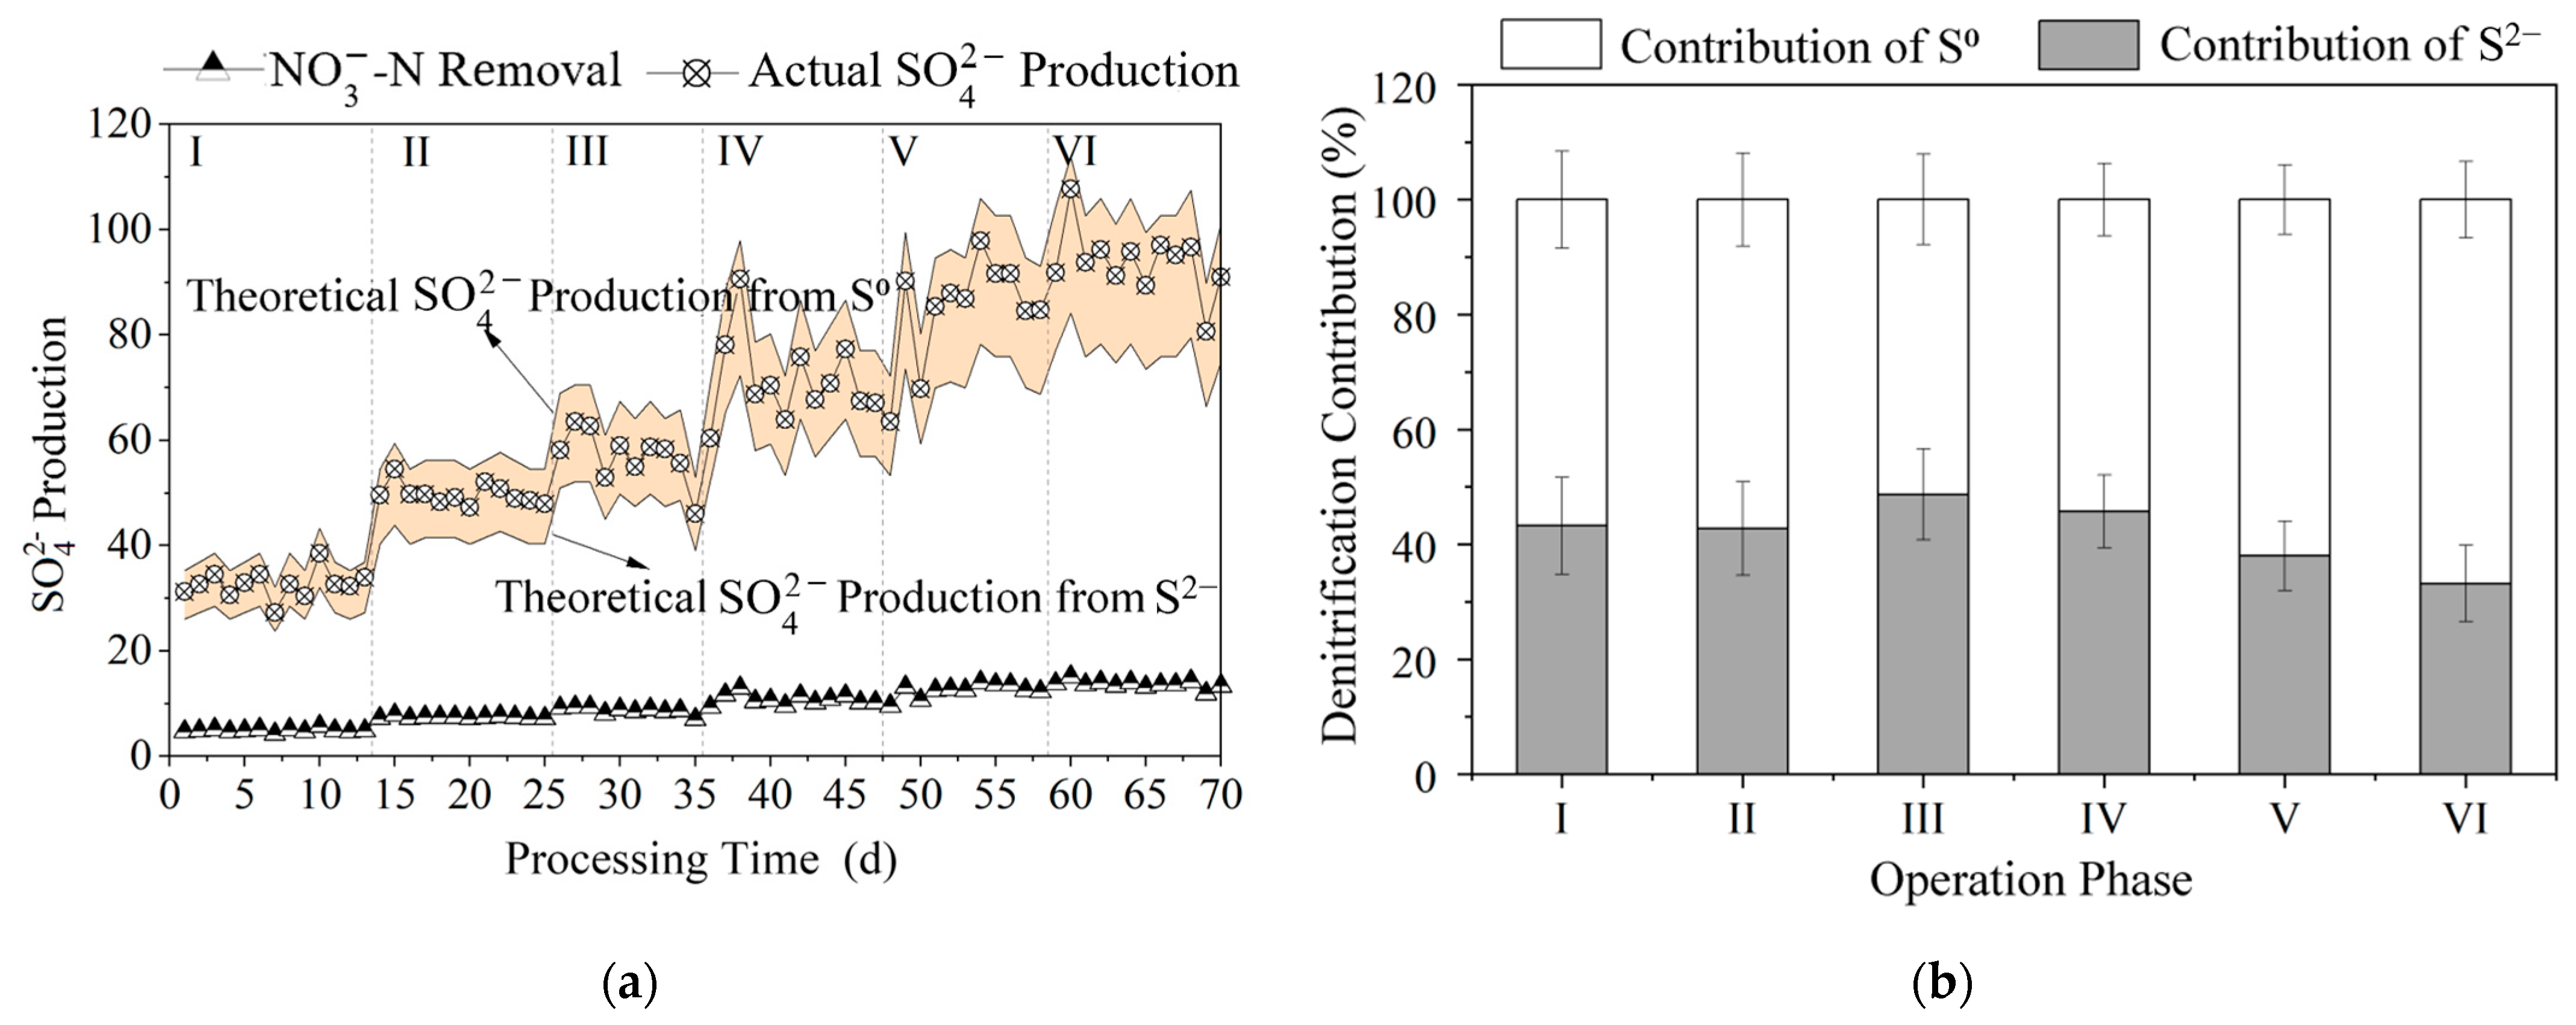
The production of S O 4   2 under varying polysulfide dosages is presented in Figure 11. As shown in Figure 11a, S O 4   2 production exhibited an increasing trend with increasing polysulfide dosages. The actual S O 4   2 production consistently fell between the theoretical values obtained when autotrophic denitrification was carried out using S0 or S2− as the sole electron donor. Figure 11b shows that the contribution of S2− from polysulfides to denitrification, initially increased and then decreased as the polysulfide dosage rose. It is suggested that denitrifying bacteria tend to increasingly prefer S0 over S2− as an electron donor at higher polysulfide concentrations.
The utilization efficiencies of polysulfides under different dosages is shown in Figure 12. As the polysulfide dosage increased, the overall utilization efficiency exhibited a declining trend. At dosages of 12.8 mg S/L and 19.2 mg S/L, the sulfur utilization efficiencies were 85.7% and 85.5%, respectively. However, when the dosage reached 64.0 mg S/L, sulfur utilization declined to 47.2%, indicating that more than half of the polysulfides remained unused during the autotrophic denitrification process for N O 3 - N removal. Additionally, the utilization efficiencies of S2− and S0 also showed a declining trend. This reduction may be attributed to the increased S2− concentration in the system, which likely inhibited the biological activity of denitrifying bacteria, and subsequently decreased the overall sulfur utilization efficiency.

3.2.3. Time-Dependent Changes in Nitrogen Pollutants at Different Na2S3 Dosages

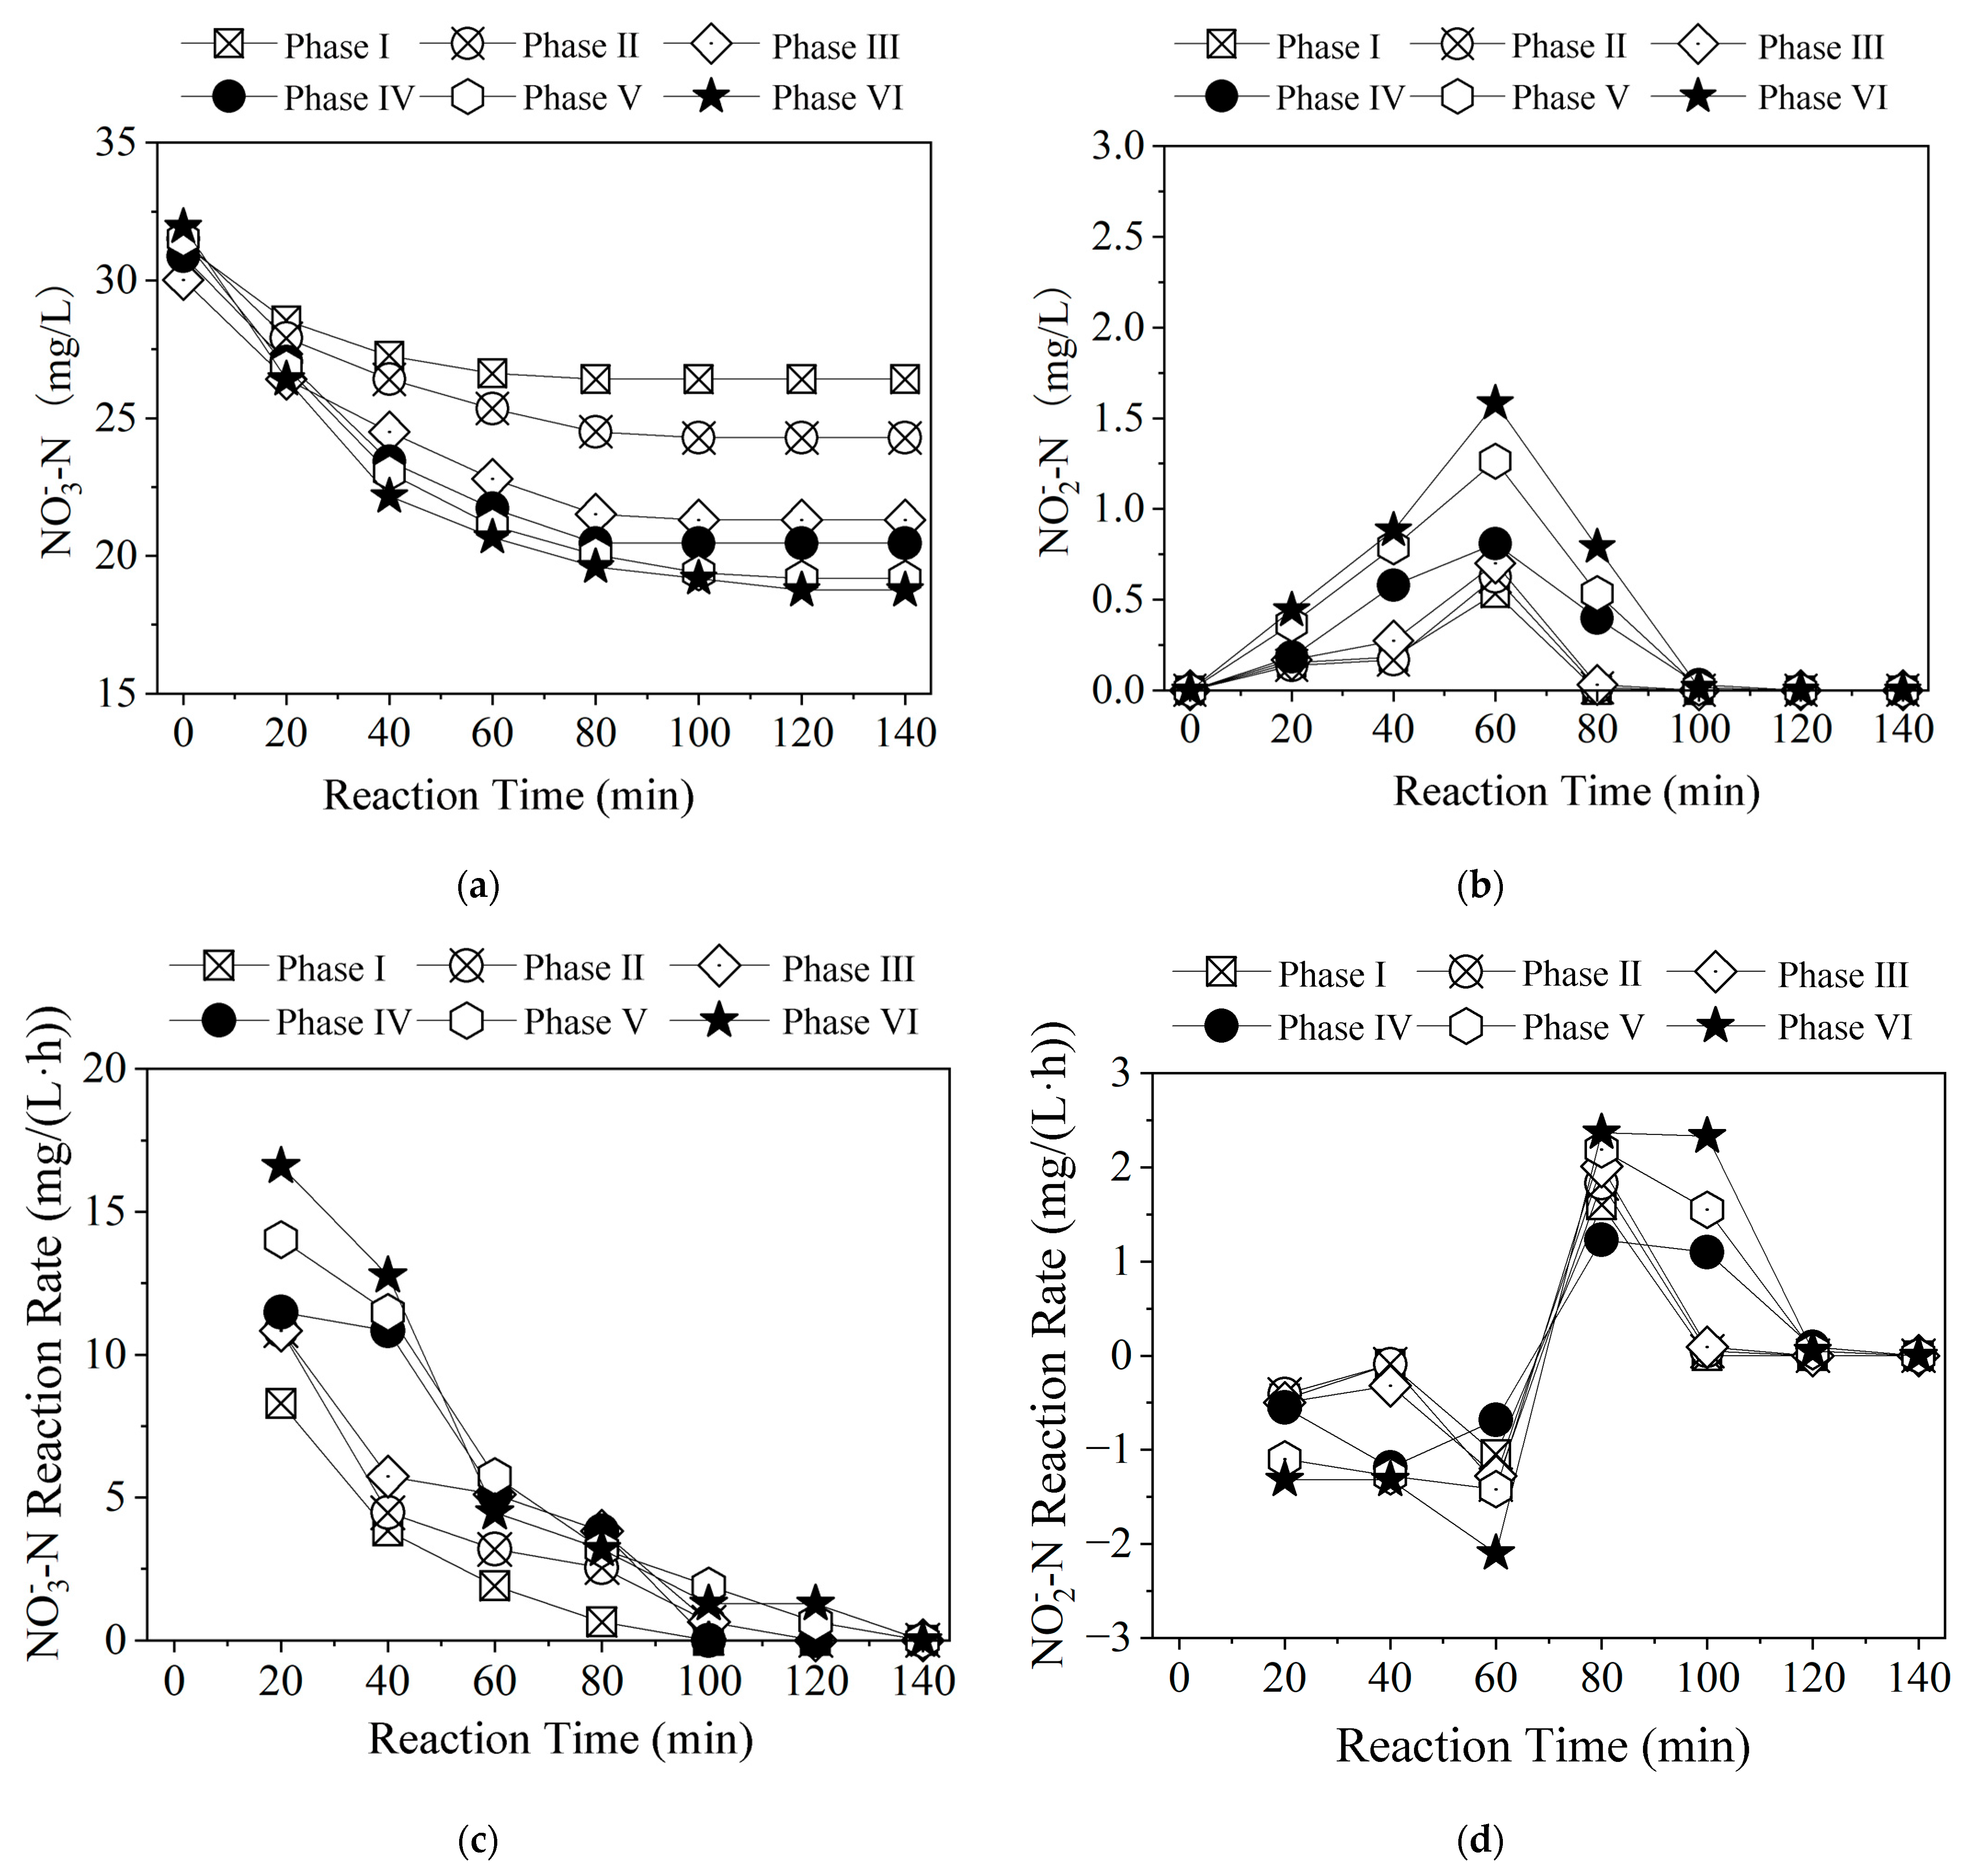
To examine the effect of polysulfide dosing on time-dependent concentration changes in nitrogen pollutants during autotrophic denitrification, the changes in N O 3 - N and N O 2 - N concentrations and reaction rates in the anoxic stage were analyzed. As shown in Figure 13, the N O 3 - N removal rate increased with increasing polysulfide dosages. At polysulfide dosages of 38.4–64.0 mg S/L, the average N O 3 - N removal rates remained high during the first 40 min of the reaction. After 60 min, the rate declined to 3.2–3.8 mg/(L·h) and continued to decline thereafter. It is indicated that increasing the sulfur concentration enhances the initial N O 3 - N removal rate, but the rate declines significantly in the later stages due to sulfur depletion. After 120 min, the concentrations of N O 3 - N and N O 2 - N stabilized, suggesting the completion of the nitrogen removal process.
The N O 2 - N concentrations showed a rise-and-fall trend, peaking at 0.5, 0.6, 0.7, 0.8, 1.3, and 1.6 mg/L at 60 min in the respective systems. It is suggested that during the first 60 min, the reduction of N O 3 - N to N O 2 - N outpaced the subsequent conversion of N O 2 - N to N2. At 80 min, the N O 2 - N removal rates reached peaks across all systems. In systems with polysulfide dosages of 38.4–64.0 mg S/L, the reaction rates remained high between 80 and 100 min, ranging from 1.0 to 2.5 mg/(L·h). After 100 min, N O 2 - N concentration decreased to 0 mg/L in all systems.

3.3. Study on Stable Operation of Polysulfide Autotrophic Denitrification Process

Previous studies have demonstrated that polysulfides possess strong potential for nitrogen removal. When the polysulfide dosage ranged from 12.9 to 19.2 mg S/L, the autotrophic denitrification process using polysulfides exhibited both high nitrogen removal efficiency and sulfur utilization efficiency. Therefore, in this section, a polysulfide (Na2S3) dosage of 19.2 mg S/L was selected to investigate the performance of the polysulfide-based autotrophic denitrification process.

3.3.1. Effect of Nitrogen Removal

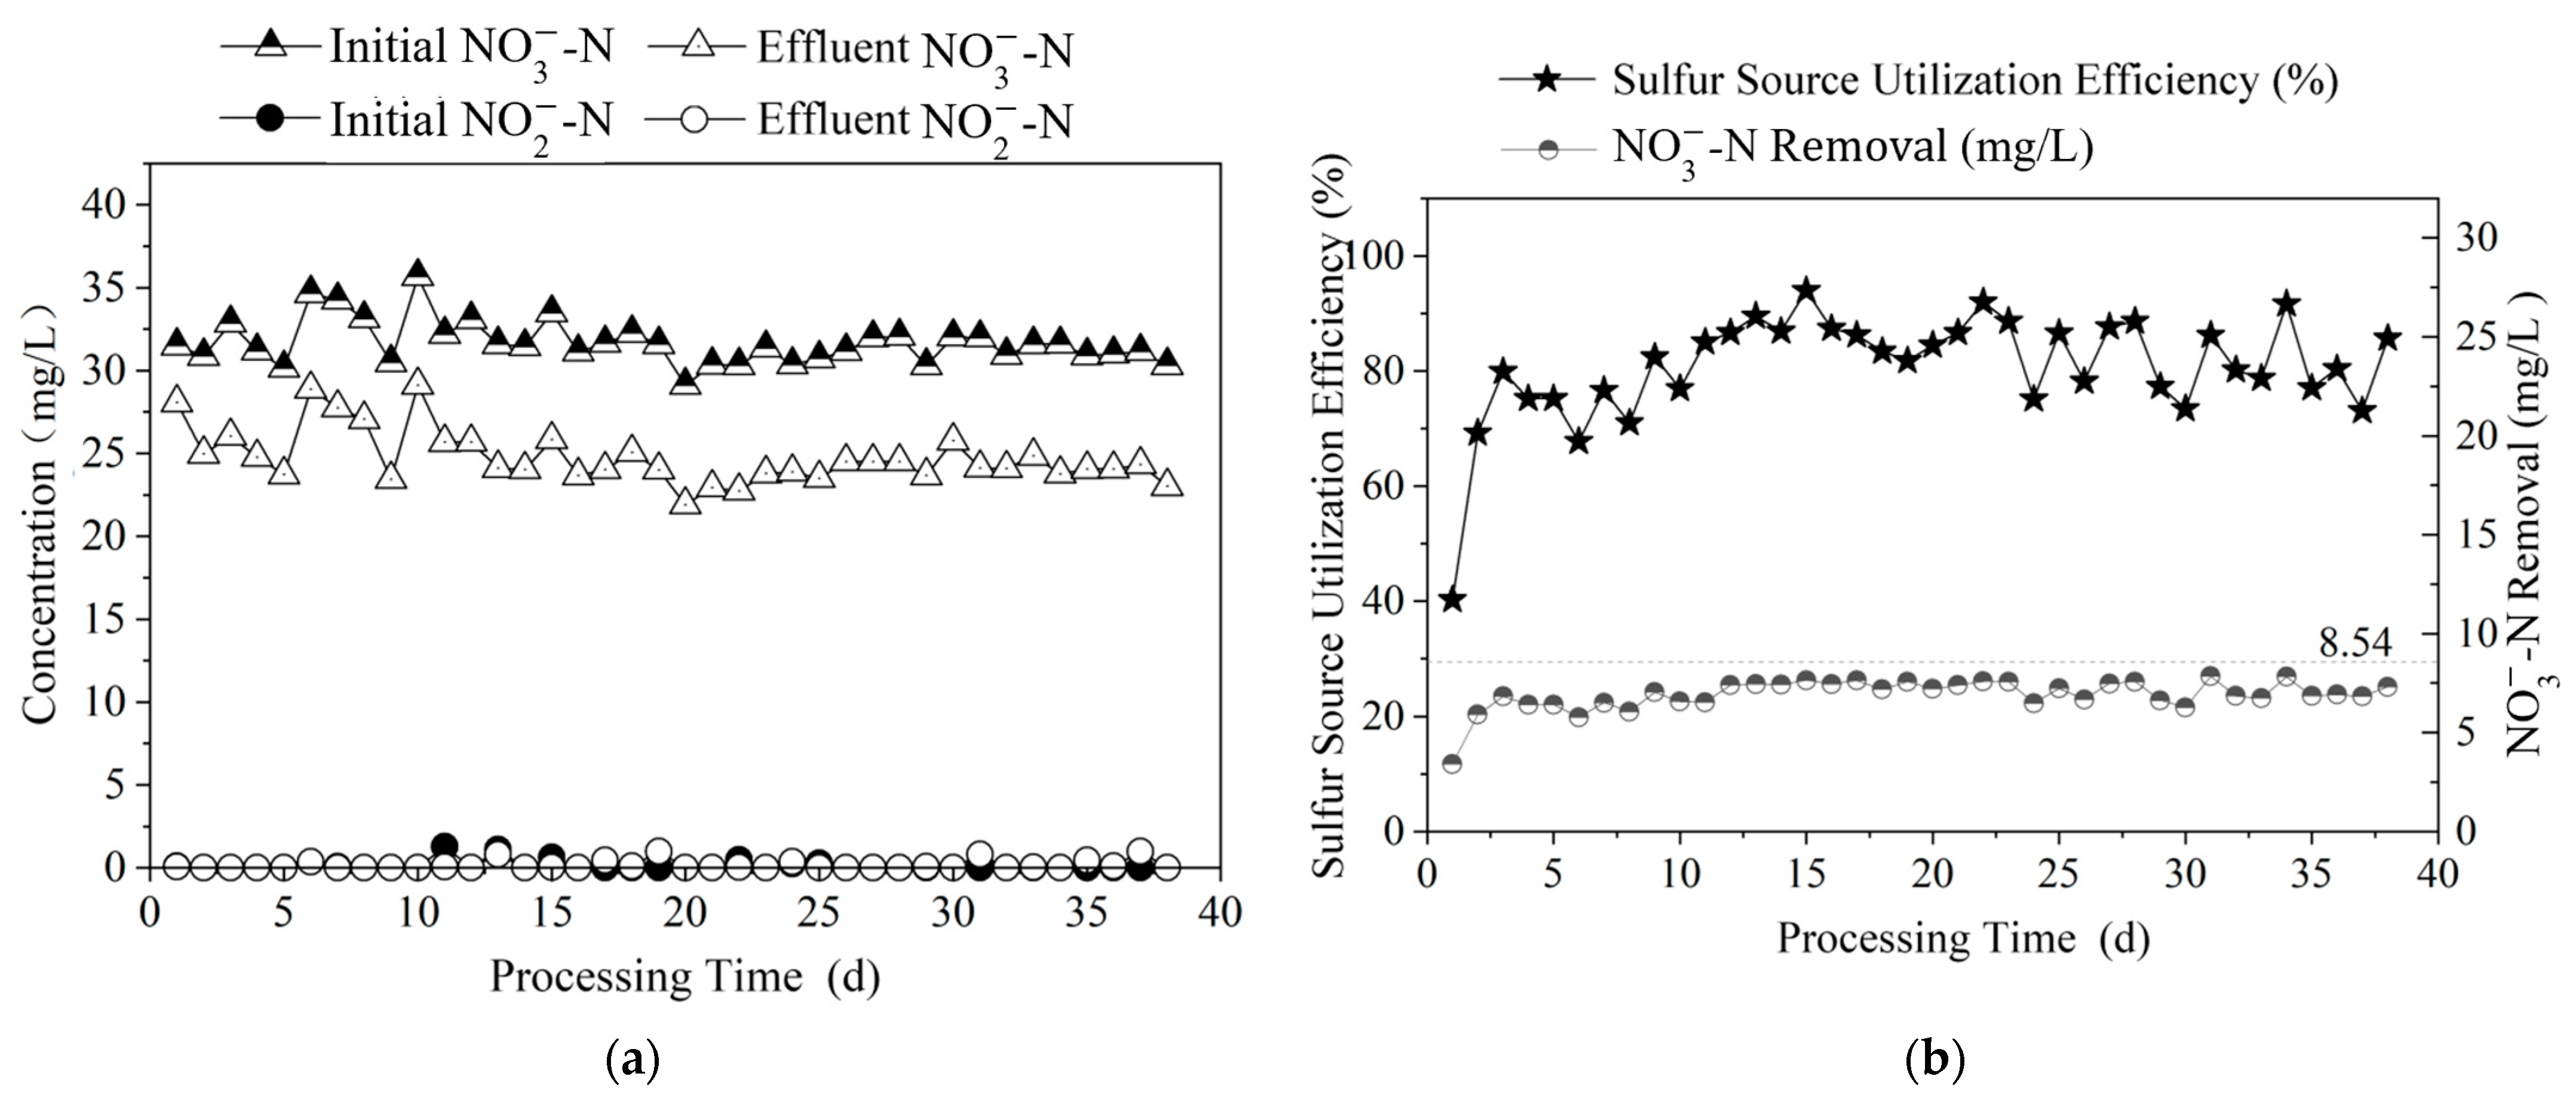
The system was operated stably for 38 days, and the experimental results are shown in Figure 14. The concentration of N O 3 - N   in the effluent gradually decreased with the continuous operation. After 9 days of operation, the N O 3 - N concentrations in the initial anoxic phase and effluent of the system were 31.6 mg/L and 24.3 mg/L, respectively, with an average N O 3 - N removal of 7.3 mg/L. There was no N O 2 - N accumulation in the effluent. The utilization efficiency of the polysulfide was 83.7% during stable operation.

3.3.2. Changes in Sludge Characteristics

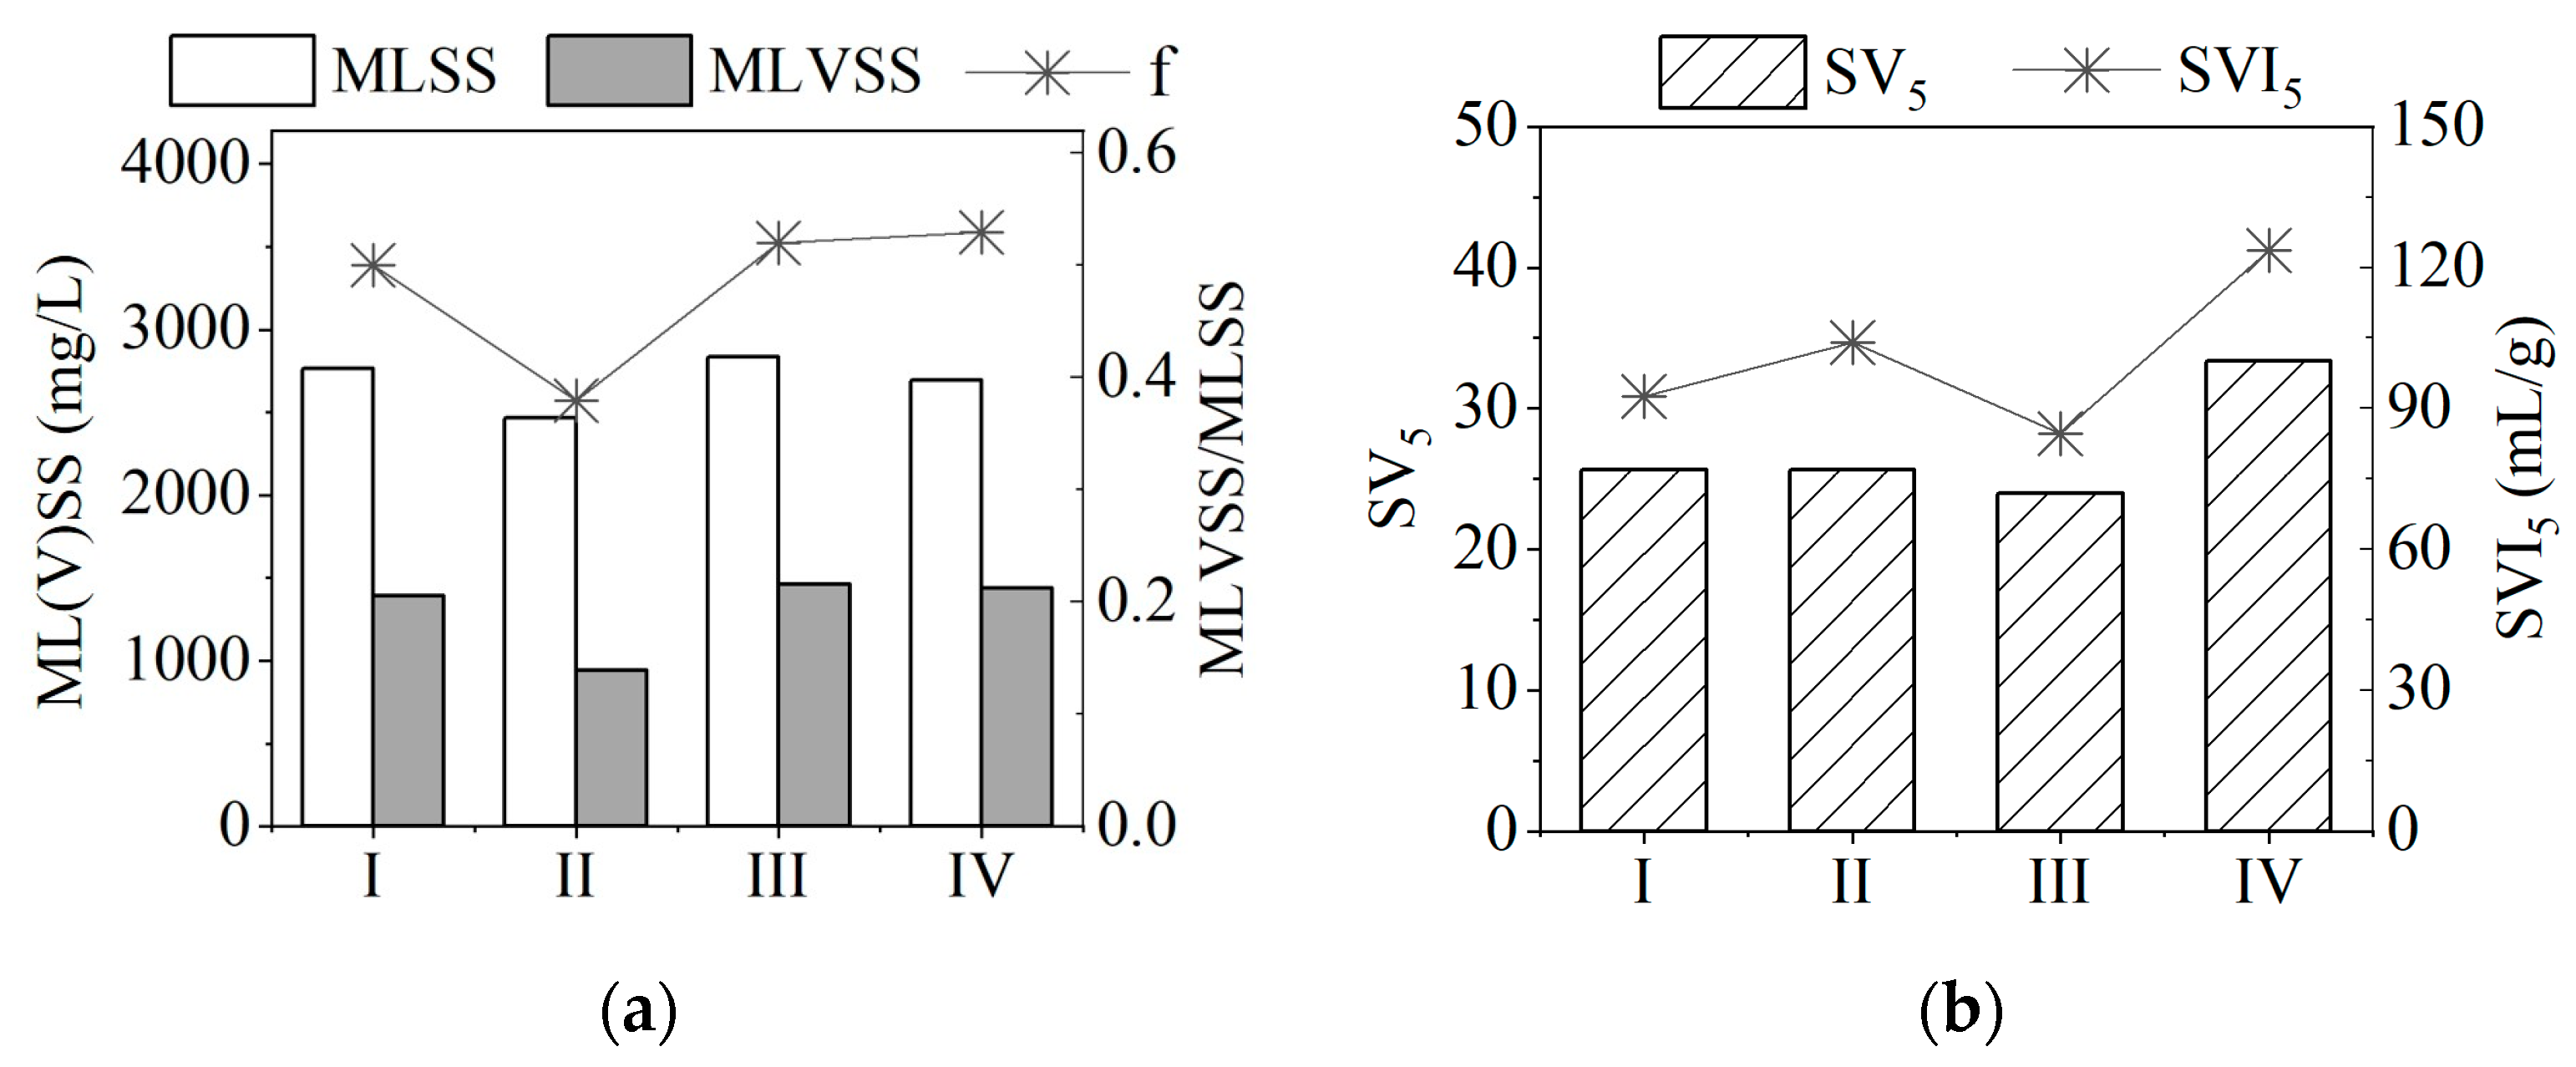
The changes in sludge concentration and the settling performance of the system during stable operation are shown in Figure 15.
Sludge concentrations exhibited minor variations with the absence of active sludge discharging. During the operation period, the MLSS level was maintained at 2400–2800 mg/L. It is indicated that the sludge production during the polysulfide-based autotrophic denitrification process was relatively low. MLVSS can reflect the microbial content in the sludge. The trend of it indicates that some microorganisms were initially inhibited by polysulfide exposure, resulting in a decrease in MLVSS during the initial dosing stage. At the same time, those microorganisms that could not adapt to polysulfides were eliminated and discharged out of the reactor [35]. With the continuous dosing of polysulfides, those microorganisms had better environmental adaptability gradually increased, which was reflected in the rebound of MLVSS concentration. However, after 38 days of operation, the SV5 and SVI5 values of the sludge increased, implying that the settling performance of the sludge deteriorated. This may be attributed to the toxic effects of polysulfides on floc-forming bacteria, placing them at a competitive disadvantage against filamentous bacteria, thereby resulting in a deteriorated sludge-settling performance [36].

3.3.3. Changes in Microbial Community Structure

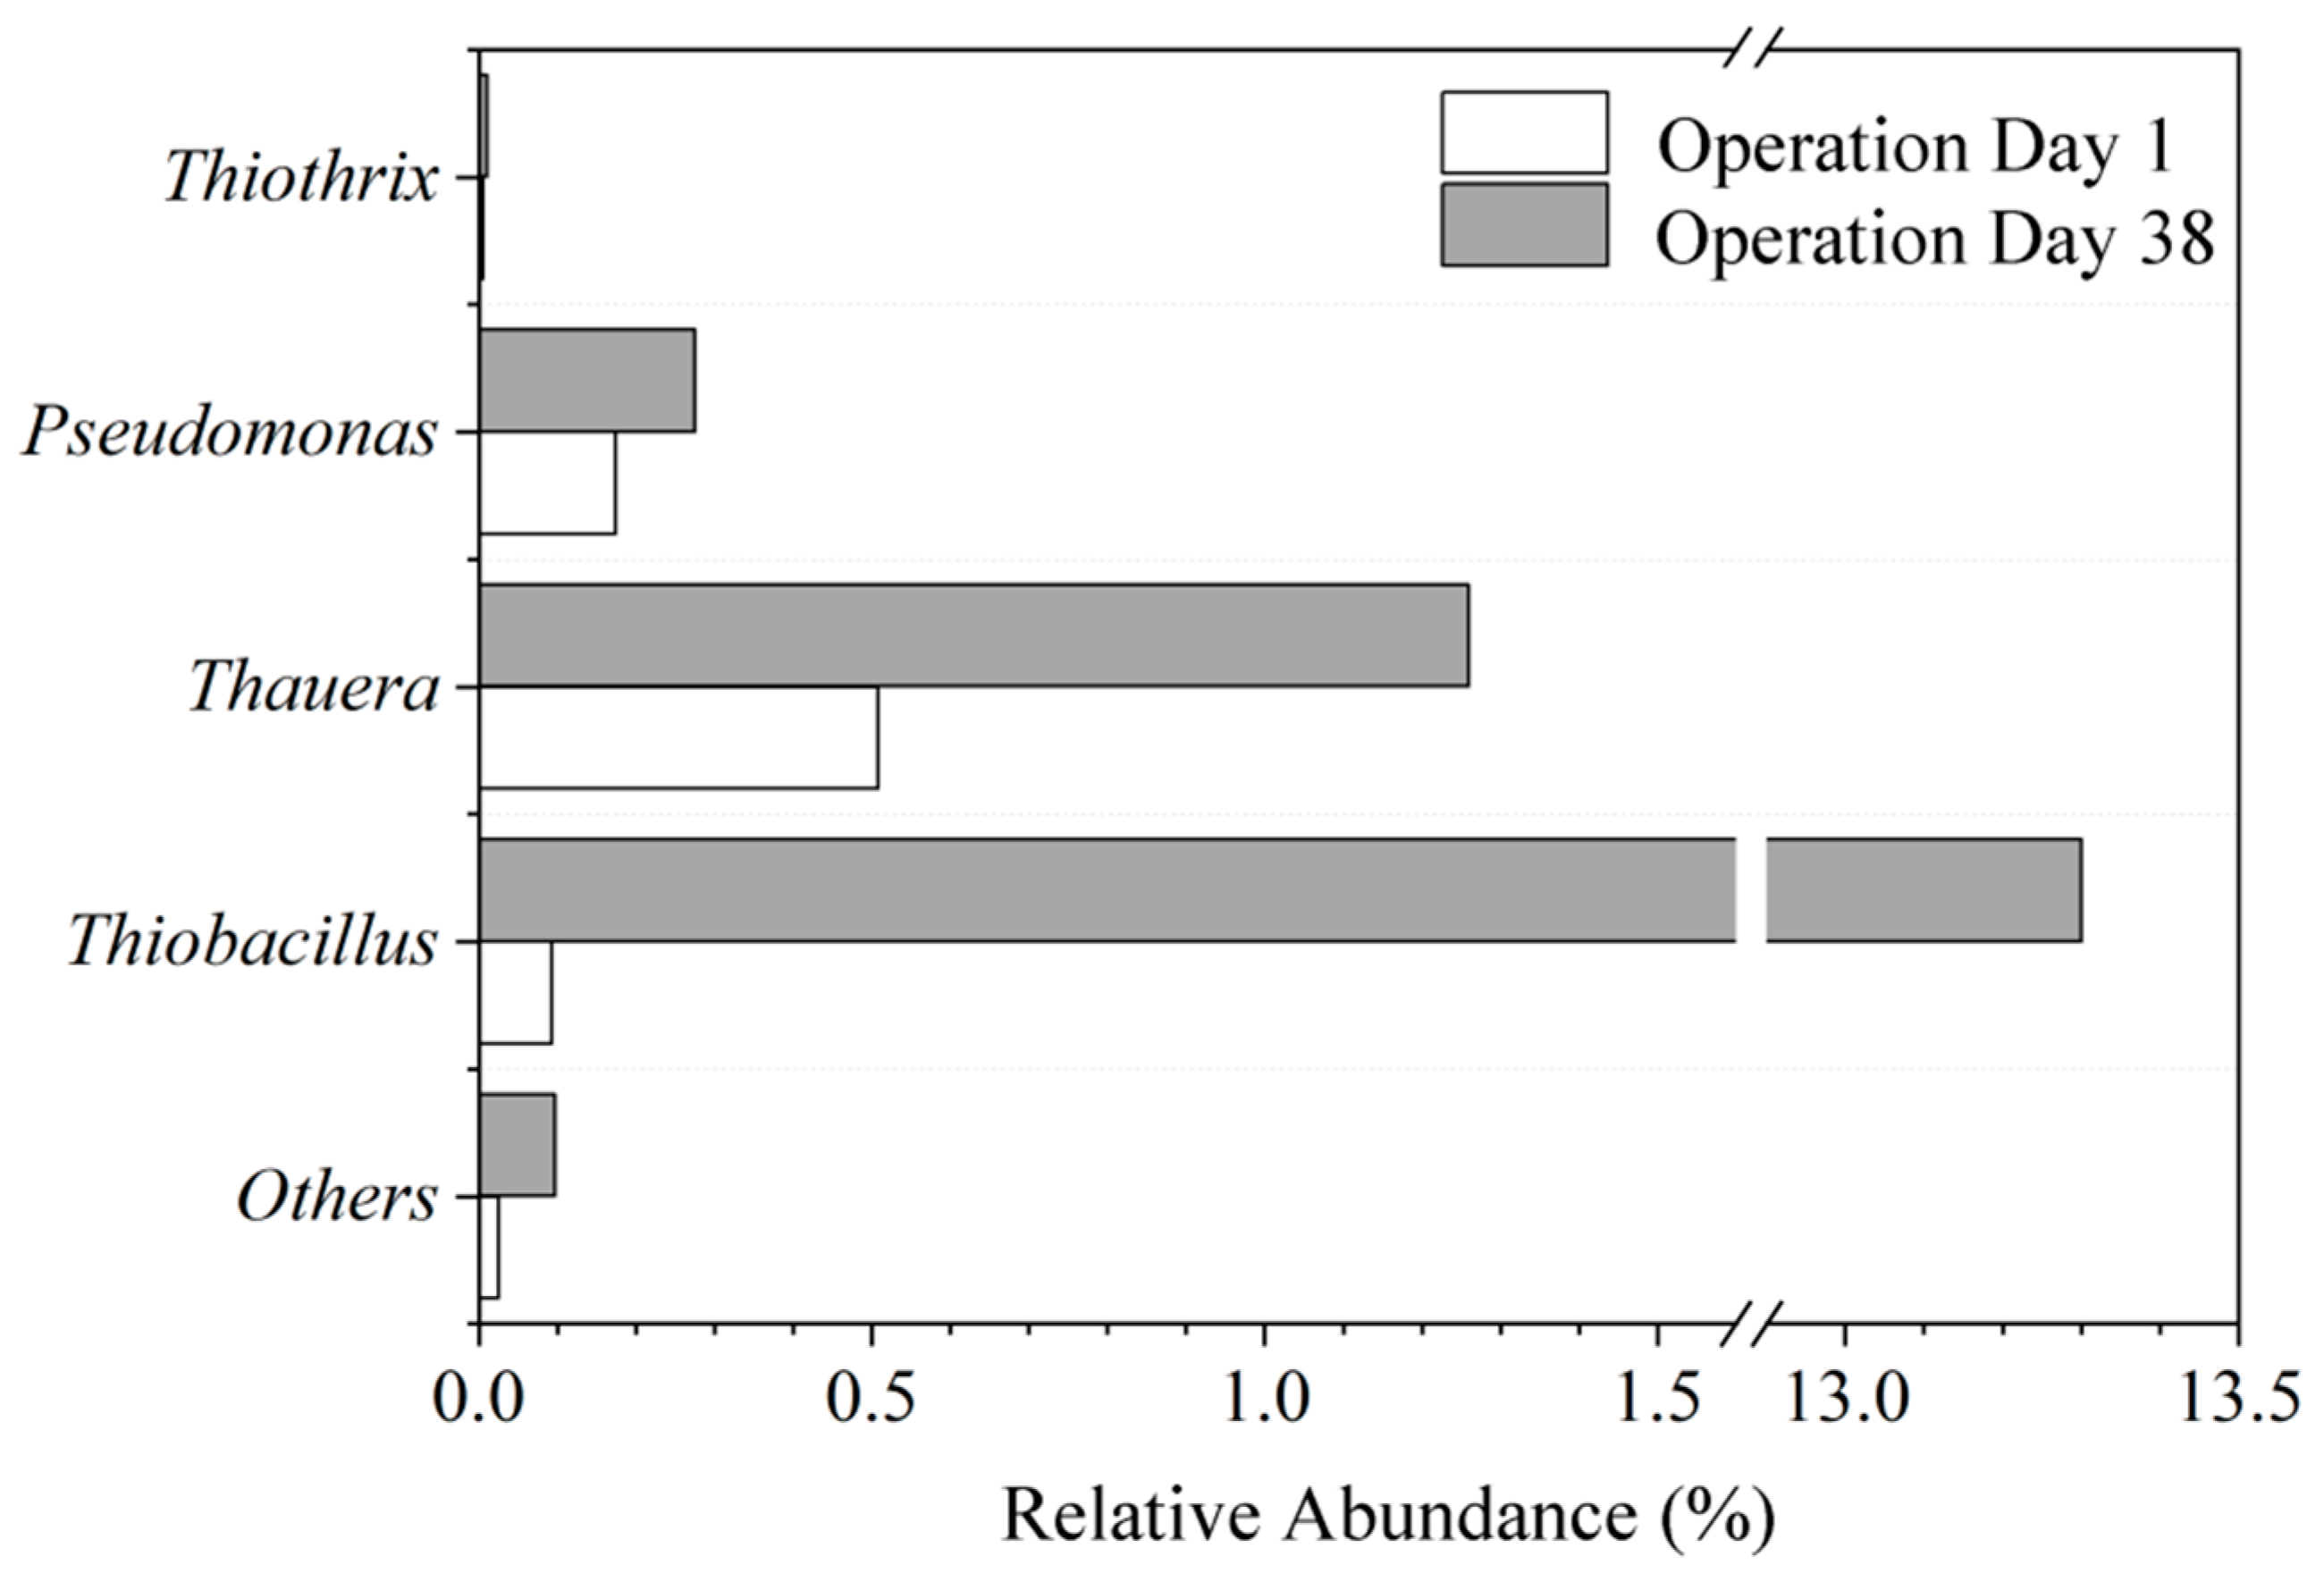
The microbial community structure of sludge before and after the operation of polysulfide-based autotrophic denitrification process was analyzed, with emphasis on genus-level changes among sulfur-autotrophic denitrifying microorganisms. As shown in Figure 16, the relative abundances of four key genera, Thiobacillus, Thauera, Pseudomonas, and Thiothrix, increased significantly after 38 days of operation, with fold increases of 124.3, 1.5, 0.6 and 1.0, respectively.
Among them, Thiobacillus was the dominant genus in the system with a relative abundance of 13.3%. Thiobacillus is recognized as one of the most common sulfur autotrophic denitrifying bacteria, and the significant enrichment indicated its key role in the process of sulfur autotrophic denitrification of polysulfides [37,38]. Members of Thauera are common heterotrophic denitrifying bacteria capable of utilizing organic substrates as electron donors. Recent studies have reported that some denitrifiers in sulfur-based systems have also been classified under the genus Thauera, with demonstrated metabolic capacity for sulfide utilization in autotrophic growth and denitrification [39]. Members of Pseudomonas have been reported in several studies to be able to participate in the sulfur cycle. They can utilize S0 and S2- as electron donors for sulfur autotrophic denitrification [40]. In addition, Others include the genera such as Sulfuricella, Sulfuriferula, Sulfurimicrobium, Desulfuromonas, Sulfuritortu, and Sulfurivermis, which were closely associated with sulfur cycling. Although not directly involved in the autotrophic denitrification process, these genera are capable of utilizing sulfur sources such as sulfide and elemental sulfur as electron donors for autotrophic growth [41].
With the addition of polysulfides, the relative abundances of genera related to sulfur autotrophic denitrification and sulfur oxidation processes have increased. It is suggested that these microorganisms become progressively enriched within the polysulfide-based autotrophic denitrification system and play essential roles in sustaining the sulfur autotrophic denitrification process.

3.4. Cost Analysis

During the stable operation of the polysulfide-based autotrophic denitrification process, a N O 3 - N removal of 7.3 mg/L was achieved at a polysulfide dosing concentration of 19.2 mg S/L. Na2S3 was synthesized using the sodium sulfide method, with a molar ratio of sodium sulfide to sulfur powder of 1:2. The market price of sodium sulfide is approximately CNY 2300/ton (CNY 2.3/kg), while sulfur powder is relatively inexpensive, typically ranging from CNY 1500 to 2500/ton (CNY 1.5 to 2.5/kg). Cost values for sodium sulfide and sulfur powder were based on typical market prices in China, obtained from industrial procurement references and supplier quotation. Consequently, the estimated cost of producing Na2S3 is CNY 1.9~2.4/kg. Then the cost-effectiveness of the electron donor can be evaluated as CNY 0.036~0.046/m3, and the cost-effectiveness of N O 3 - N removal can be evaluated as CNY 4.9~6.3/kg· N O 3 - N .

4. Conclusions

In this study, the feasibility of polysulfide-based autotrophic denitrification for nitrogen removal was evaluated using an aerobic/anoxic sequencing batch reactor. The type and dosage of polysulfides were optimized. Polysulfides synthesized chemically from sodium sulfide and sulfur powder could serve as electron donors to facilitate autotrophic denitrification. Among them, Na2S3 demonstrated better denitrification efficiency, lower preparation cost, and greater application potential. Under the dosage for the same theoretical N O 3 - N removal, the Na2S3 system removed N O 3 - N of 7.1 mg/L, achieved a sulfur utilization efficiency of 71.2%, and generated S O 4   2 of 47.0 mg/L. When the dosages of Na2S3 were 12.8 mg S/L and 19.2 mg S/L, the sulfur utilization efficiencies were 85.7% and 85.5%, respectively, with 4.9 mg/L and 7.4 mg/L of N O 3 - N removed. Further increasing the polysulfide dosage resulted in decreased sulfur utilization. During stable operation of the polysulfide-based autotrophic denitrification process, the system removed 7.3 mg/L of N O 3 - N with no N O 2 - N accumulation, achieving a sulfur utilization efficiency of 83.7% at an Na2S3 dosage of 19.2 mg S/L. The process generated less sludge. However, sludge settling performance deteriorated after 38 days of continuous operation. Moreover, the addition of polysulfides promoted the enrichment of sulfur autotrophic denitrification-related microorganisms. Among them, Thiobacillus was the dominant genus, with a relative abundance of 13.3%, representing a 124-fold increase compared to conditions without the addition of polysulfides.

Author Contributions

Conceptualization, J.L. and X.Z.; methodology, Z.H. and Y.S.; software, C.Y. and Y.S.; validation, Z.H.; formal analysis, Z.H.; investigation, Y.S.; resources, H.W.; data curation, C.Y., Z.H., and Y.S.; writing—original draft preparation, Y.S.; writing—review and editing, X.Z. and J.L.; visualization, Y.S.; supervision, J.L. and H.W.; project administration, X.Z.; funding acquisition, J.L. and H.W. All authors have read and agreed to the published version of the manuscript.

Funding

This research was funded by the Shenzhen Municipal Science and Technology Innovation Commission (KCXFZ20211020163404006 and KCXFZ20240903093500001).

Data Availability Statement

Data will be made available on request.

Conflicts of Interest

The authors declare no conflicts of interest.

References

  1. Tian, G.X.; Kong, Z.A.; Zhang, Y.F.; Qiu, L.W.; Wang, H.; Yan, Q. Simultaneous ammonia and nitrate removal by novel integrated partial denitrification-anaerobic ammonium oxidation-bioelectrochemical system. Bioresour. Technol. 2024, 396, 130428. [Google Scholar] [CrossRef] [PubMed]
  2. Pan, S.P.; Li, Q.H.; Meng, C.L.; Han, M.S.; Ma, Y.M.; Brancelj, A. Using a structural equation model to assess the spatiotemporal dynamics and driving factors of phytoplankton in the plateau hongfeng reservoir in southwest china. Aquat. Ecol. 2022, 56, 1297–1313. [Google Scholar] [CrossRef]
  3. DB4403/T 64-2020; Standards of Water Quality for Wastewater Treatment Plant. Shenzhen Administration for Market Regulation: Shenzhen, China, 2020.
  4. Liu, S.Q.; Long, Z.Q.; Liang, J.S.; Zhang, J.; Hu, D.F.; Hou, P.F.; Zhang, G.M. Interpretable causal machine learning optimization tool for improving efficiency of internal carbon source-biological denitrification. Bioresour. Technol. 2025, 416, 131787. [Google Scholar] [CrossRef]
  5. Chen, T.Y.; Yang, X.Y.; Sun, Q.; Hu, A.Y.; Qin, D.; Li, J.W.; Wang, Y.H.; Yu, C.P. Changes in wastewater treatment performance and the microbial community during the bioaugmentation of a denitrifying pseudomonas strain in the low carbon-nitrogen ratio sequencing batch reactor. Water 2022, 14, 540. [Google Scholar] [CrossRef]
  6. DiCapua, F.; Pirozzi, F.; Lens, P.N.L.; Esposito, G. Electron donors for autotrophic denitrification. Chem. Eng. J. 2019, 362, 922–937. [Google Scholar] [CrossRef]
  7. Zhai, L.M.; CaiJi, Z.M.; Liu, J.; Wang, H.Y.; Ren, T.Z.; Gai, X.P.; Xi, B.; Liu, H.B. Short-term effects of maize residue biochar on phosphorus availability in two soils with different phosphorus sorption capacities. Biol. Fertil. Soils. 2015, 51, 113–122. [Google Scholar] [CrossRef]
  8. Yang, W.M.; Zhao, Q.; Lu, H.; Ding, Z.; Meng, L.; Chen, G.H. Sulfide-driven autotrophic denitrification significantly reduces n2o emissions. Water Res. 2016, 90, 176–184. [Google Scholar] [CrossRef]
  9. Huang, Z.Z.; Gao, J.Q.; Liu, L.; Mao, Y.L.; Kang, H.Y.; Song, Z.X.; Cai, M.; Guo, P.C.; Chen, K. Performance and by-product generation in sulfur-siderite/limestone autotrophic denitrification systems: Enhancing nitrogen removal efficiency and operational insights. J. Environ. Manag. 2024, 370, 123042. [Google Scholar] [CrossRef]
  10. Yuan, Y.; Li, X.; Li, B.l. Autotrophic nitrogen removal characteristics of pn-anammox process enhanced by sulfur autotrophic denitrification under mainstream conditions. Bioresour. Technol. 2020, 316, 123926. [Google Scholar] [CrossRef]
  11. Zhu, T.T.; Ding, J.Z.; Liu, Y.R.; Li, X.F.; Wang, Z.W.; Liu, Y.W. The effect of organic sources on the electron distribution and n2o emission in sulfur-driven autotrophic denitrification biofilters. Sci. Total Environ. 2023, 903, 166126. [Google Scholar] [CrossRef]
  12. Qiu, Y.Y.; Zhang, L.; Mu, X.T.; Li, G.B.; Guan, X.Q.; Hong, J.Y.; Jiang, F. Overlooked pathways of denitrification in a sulfur-based denitrification system with organic supplementation. Water Res. 2020, 169, 115084. [Google Scholar] [CrossRef] [PubMed]
  13. Ortega-Martínez, E.; Toledo-Alarcón, J.; Fernández, E.; Campos, J.L.; Oyarzún, R.; Etchebehere, C.; Cardeña, R.; Cabezas, A.; Koók, L.; Bakonyi, P.; et al. A review of autotrophic denitrification for groundwater remediation: A special focus on bioelectrochemical reactors. J. Environ. Chem. Eng. 2024, 12, 111552. [Google Scholar] [CrossRef]
  14. Xu, J.; Lu, Z.K.; Xu, Y.F.; Liang, C.Z.; Peng, L. Improved performance of sulfur-driven autotrophic denitrification process by regulating sulfur-based electron donors. Water 2024, 16, 730. [Google Scholar] [CrossRef]
  15. Li, W.J.; Zhu, L.; Pan, C.; Chen, W.D.; Xu, D.D.; Kang, D.; Guo, L.Y.; Mei, Q.Q.; Zheng, P.; Zhang, M. Insights into the superior bioavailability of biogenic sulfur from the view of its unique properties: The key role of trace organic substances. Environ. Sci. Technol. 2023, 57, 1487–1498. [Google Scholar] [CrossRef]
  16. Ma, K.; Adams, M.W. Ferredoxin: Nadp oxidoreductase from pyrococcus furiosus. Methods Enzymol. 2001, 334, 40–45. [Google Scholar]
  17. Sorokin, D.Y.; Rusanov, I.I.; Pimenov, N.V.; Tourova, T.P.; Abbas, B.; Muyzer, G. Sulfidogenesis under extremely haloalkaline conditions in soda lakes of kulunda steppe (Altai, Russia). FEMS Microbiol. Ecol. 2010, 73, 278–290. [Google Scholar] [CrossRef]
  18. Qiu, Y.Y.; Gong, X.Z.; Zhang, L.; Zhou, S.J.; Li, G.B.; Jiang, F. Achieving a novel polysulfide-involved sulfur-based autotrophic denitrification process for high-rate nitrogen removal in elemental sulfur-packed bed reactors. ACS ES&T Eng. 2022, 2, 1504–1513. [Google Scholar]
  19. Bao, H.X.; Wang, H.L.; Wang, S.T.; Sun, Y.L.; Zhang, X.N.; Cheng, H.Y.; Qian, Z.M.; Wang, A.J. Response of sulfur-metabolizing biofilm to external sulfide in element sulfur-based denitrification packed-bed reactor. Environ. Res. 2023, 231, 116061. [Google Scholar] [CrossRef]
  20. Wang, F.; Liang, D.D.; He, W.H.; Liu, G.H.; Li, J.N.; Tian, Y.; Feng, Y.J. Insights into sulfur cycling contribution to nitrogen removal in sulfur autotrophic denitrification combined microbial electrochemical denitrification. Chem. Eng. J. 2024, 482, 148882. [Google Scholar] [CrossRef]
  21. Sun, Y.L.; Zheng, K.; Zhai, S.Y.; Cheng, H.Y.; Qian, Z.M.; Wang, H.C.; Yang, J.X.; Zhang, X.N.; Wang, A.J. A novel pattern of coupling sulfur-based autotrophic disproportionation and denitrification processes for achieving high-rate and precisely adjustable nitrogen removal. Chem. Eng. J. 2023, 476, 146772. [Google Scholar] [CrossRef]
  22. Qiao, Z.S.; Zhang, Y.G.; Meng, Z.H.; Xie, Q.S.; Lin, L.; Zheng, H.F.; Sa, B.S.; Lin, J.; Wang, L.S.; Peng, D.L. Anchoring polysulfides and accelerating redox reaction enabled by Fe-based compounds in lithium–sulfur batteries. Adv. Funct. Mater. 2021, 31, 2100970. [Google Scholar] [CrossRef]
  23. Wang, W.; Xi, K.; Li, B.W.; Li, H.J.; Liu, S.; Wang, J.N.; Zhao, H.Y.; Li, H.L.; Abdelkader, A.M.; Gao, X.P.; et al. A sustainable multipurpose separator directed against the shuttle effect of polysulfides for high-performance lithium–sulfur batteries. Adv. Energy Mater. 2022, 12, 2200160. [Google Scholar] [CrossRef]
  24. Johnston, K.A.K.Y.; van Lankveld, M.; Rink, R.d.; Mol, A.R.; Keesman, K.J.; Buisman, C.J.N. Influence of oxidation-reduction potential and pH on polysulfide concentrations and chain lengths in the biological desulfurization process under haloalkaline conditions. Water Res. 2024, 259, 121795. [Google Scholar] [CrossRef]
  25. Fu, K.M.; Kang, J.; Zhao, J.; Bian, Y.H.; Li, X.D.; Yang, W.B.; Li, Z.R. Efficient nitrite accumulation in partial sulfide autotrophic denitrification (PSAD) system: Insights of S/N ratio, pH and temperature. Environ. Technol. 2024, 45, 5419–5436. [Google Scholar] [CrossRef]
  26. Polizzi, C.; Gabriel, D.; Munz, G. Successful sulphide-driven partial denitrification: Efficiency, stability and resilience in srt-controlled conditions. Chemosphere 2022, 295, 133936. [Google Scholar] [CrossRef]
  27. Zhan, M.J.; Zeng, W.; Wu, C.C.; Chen, G.X.; Meng, Q.A.; Hao, X.J.; Peng, Y.Z. Impact of organic carbon on sulfide-driven autotrophic denitrification: Insights from isotope fractionation and functional genes. Water Res. 2024, 255, 121507. [Google Scholar] [CrossRef]
  28. Hao, X.D.; Wei, H.Y.; Yu, W.B.; Zhu, Y.M. Analysis of the pros and cons for sulfur autotrophic denitrification technology. Acta Sci. Circumstantiae 2024, 44, 1–10. [Google Scholar]
  29. Ucar, D.; Yilmaz, T.; Di Capua, F.; Esposito, G.; Sahinkaya, E. Comparison of biogenic and chemical sulfur as electron donors for autotrophic denitrification in sulfur-fed membrane bioreactor (SMBR). Bioresour. Technol. 2020, 299, 122574. [Google Scholar] [CrossRef]
  30. Yuan, Y.; Li, X.; Li, W.; Shi, M.; Zhang, M.; Xu, P.L.; Li, B.L.; Huang, Y. Effects of different reduced sulfur forms as electron donors in the start-up process of short-cut sulfur autotrophic denitrification. Bioresour. Technol. 2022, 354, 127194. [Google Scholar] [CrossRef]
  31. Wang, S.S.; Cheng, H.Y.; Zhang, H.; Su, S.G.; Sun, Y.L.; Wang, H.c.; Han, J.L.; Wang, A.J.; Guadie, A. Sulfur autotrophic denitrification filter and heterotrophic denitrification filter: Comparison on denitrification performance, hydrodynamic characteristics and operating cost. Environ. Res. 2021, 197, 111029. [Google Scholar] [CrossRef]
  32. Shen, Z.Q.; Xie, L.Y.; Lyu, C.; Xu, P.L.; Yuan, Y.; Li, X.; Huang, Y.; Li, W.; Zhang, M.; Shi, M. Effects of salinity on nitrite and elemental sulfur accumulation in a double short-cut sulfur autotrophic denitrification process. Bioresour. Technol. 2023, 369, 128432. [Google Scholar] [CrossRef] [PubMed]
  33. Chen, C.A.; Ren, N.Q.; Wang, A.J.; Liu, L.H.; Lee, D.J. Enhanced performance of denitrifying sulfide removal process under micro-aerobic condition. J. Hazard. Mater. 2010, 179, 1147–1151. [Google Scholar] [CrossRef] [PubMed]
  34. Liu, X.R.; Yu, J.H.; Wang, H.T.; Jin, C.J.; Zhao, Y.G.; Guo, L. Effect of magnetic powder (Fe3O4) on heterotrophic-sulfur autotrophic denitrification efficiency and electron transport system activity for marine recirculating aquacultural wastewater treatment. J. Environ. Manag. 2024, 370, 122749. [Google Scholar] [CrossRef] [PubMed]
  35. Shao, L.X.; Wang, D.X.; Chen, G.; Zhao, X.B.; Fan, L.H. Advance in the sulfur-based electron donor autotrophic denitrification for nitrate nitrogen removal from wastewater. World J. Microbiol. Biotechnol. 2023, 40, 7. [Google Scholar] [CrossRef]
  36. Wang, X.; Jiang, C.C.; Wang, D.H.; Yang, Y.; Fan, L.J.; Xu, S.J.; Zhuang, X.L. Quorum sensing responses of activated sludge to free nitrous acid: Zoogloea deformation, ahl redistribution, and microbiota acclimatization. Water Res. 2023, 238, 119993. [Google Scholar] [CrossRef]
  37. Sahinkaya, E.; Hasar, H.; Kaksonen, A.H.; Rittmann, B.E. Performance of a sulfide-oxidizing, sulfur-producing membrane biofilm reactor treating sulfide-containing bioreactor effluent. Environ. Sci. Technol. 2011, 45, 4080–4087. [Google Scholar] [CrossRef]
  38. Huang, C.; Liu, Q.; Li, Z.L.; Ma, X.D.; Hou, Y.N.; Ren, N.Q.; Wang, A.J. Relationship between functional bacteria in a denitrification desulfurization system under autotrophic, heterotrophic, and mixotrophic conditions. Water Res. 2021, 188, 116526. [Google Scholar] [CrossRef]
  39. Yao, S.; Zhang, K.; Yang, S.; Li, Z.J.; Wang, Y.Z.; Ma, F.; Chen, P.; Zhu, T. A novel coupling process to replace the traditional multi-stage anammox process-sulfur autotrophic denitrification coupled anammox system. Biodegradation 2024, 35, 565–582. [Google Scholar] [CrossRef]
  40. Ma, X.R.; Zheng, Z.M.; Bian, W.; Li, J.; Zhou, R.X.; Zhou, X.Y. Study on operation efficiency and microbial community structure of sulfur-based autotrophic denitrification system. China Environ. Sci. 2020, 40, 4335–4341. [Google Scholar]
  41. Hisaya, K.; Miho, W.; Manabu, F. Sulfuritortus calidifontis gen. Nov., sp. Nov., a sulfur oxidizer isolated from a hot spring microbial mat. Int. J. Syst. Evol. Microbiol. 2017, 67, 1355–1358. [Google Scholar]
Figure 1. Schematic structure of polysulfides.
Separations 12 00157 g001
Figure 2. Schematic structure of polysulfides. The periodic processes of operation, including filling, aeration, mixing, settlement, and draining were automatically controlled by time controllers to simulate the nitrification and denitrification processes.
Separations 12 00157 g002
Figure 3. Concentrations of N O 3 - N and N O 2 - N in the initial anoxic phase and effluent during two-stage dosing of Na2S and Na2S2.
Separations 12 00157 g003
Figure 4. Concentrations of N O 3 - N and N O 2 - N in the initial anoxic phase and effluent during three-stage dosing of Na2S2, Na2S3 and Na2S4.
Separations 12 00157 g004
Figure 5. Utilization of Na2S and Na2S2.
Separations 12 00157 g005
Figure 6. Changes in concentrations of S O 4   2   and N O 3   - N in initial anoxic phase and effluent during six-stage dosing of Na2S3 at different dosages.
Separations 12 00157 g006
Figure 7. The contribution rates of S2− and S0 in autotrophic denitrification.
Separations 12 00157 g007
Figure 8. Utilization efficiencies of polysulfides in autotrophic denitrification: (a) Utilization efficiencies of sulfur sources in autotrophic denitrification; (b) utilization efficiencies of S0 and S2− in polysulfides.
Separations 12 00157 g008
Figure 9. Changes in nitrogen pollutant concentrations and reaction rates along denitrification among different polysulfide species: (a) Changes in time-dependent concentration of N O 3 - N ; (b) changes in time-dependent concentration of N O 2 - N ; (c) changes in time-dependent reaction rates of N O 3 - N ; (d) changes in time-dependent reaction rates of N O 2 - N .
Separations 12 00157 g009
Figure 10. Changes in N O 3   - N and N O 2 - N concentrations in initial anoxic phase and effluent during six-stage dosing of Na2S3 at different dosages.
Separations 12 00157 g010
Figure 11. Contribution of S0 and S2− to denitrification at different Na2S3 dosages: (a) Changes in S O 4   2 production under different polysulfide dosages; (b) changes in the contribution of S0 and S2− in polysulfides to denitrification.
Separations 12 00157 g011
Figure 12. Utilization efficiencies of polysulfides.
Separations 12 00157 g012
Figure 13. Changes in nitrogen pollutant concentrations and reaction rates along denitrification at different Na2S3 dosages: (a) Changes in time-dependent concentration of N O 3 - N : (b) changes in time-dependent concentration of N O 2 - N ; (c) changes in time-dependent reaction rate of N O 3 - N ; (d) changes in time-dependent reaction rate of N O 2 - N .
Separations 12 00157 g013
Figure 14. Performance of autotrophic denitrification for nitrogen removal by polysulfides: (a) Changes in concentrations of N O 3 - N and N O 2 - N in initial anoxic phase and effluent; (b) utilization efficiencies of sulfur source.
Separations 12 00157 g014
Figure 15. Changes in sludge concentration and settling performance of the sulfur autotrophic denitrification system: (a) Changes in sludge concentration; (b) changes in sludge settling performance.
Separations 12 00157 g015
Figure 16. Changes in community structure of microorganisms at the genus level.
Separations 12 00157 g016
Table 1. Aerobic/anoxic sequential batch reaction device time setting (unit/min).
FillingAerobic PhaseAnoxic PhaseAeration StrippingSettlementDrainingCycle
102401805405480
Table 2. Influent water quality of aerobic/anoxic sequencing batch reactor.
ComponentsConcentration
(mg/L)
Mean Value
(mg/L)
Pharmaceuticals
NH 4   + - N 20–2522.5NH4Cl
TP3–54.0KH2PO4
Alkalinity240–300270NaHCO3
Table 3. Trace element concentrate I.
ComponentsConcentration (g/L)
EDTA-2Na6.37
FeSO4·7H2O9.15
Table 4. Trace element concentrate II.
ComponentsConcentration (g/L)
EDTA-2Na 19.11
ZnSO4·7H2O0.43
CoCl2·6H2O0.24
MnCl2·4H2O0.99
CuSO4·5H2O0.25
NaMo4·2H2O0.22
NiCl2·6H2O0.19
NaSeo4·10H2O0.21
H3BO40.014
Table 5. Types and preparation solutions of sodium polysulfide.
S n 2 SpeciesMolar Ratio
Csodium sulfide:Csulfur powder
n = 1Na2S-
n = 2Na2S21:1
n = 3Na2S31:2
n = 4Na2S41:3
Table 6. The composition of sodium sulfide solution and sodium disulfide solution.
StageSpeciesConcentration
(mol/L)
Dosage
(mL)
Dosage of S
(mg S/L)
INa2S0.18.08.5
IINa2S20.18.017.1
Table 7. Polysulfide types and corresponding dosages at operational stages.
StageSpeciesDosage of S
(mg S/L)
Theoretically   Removable   N O 3   - N   Content (mg/L)
INa2S221.4 10.0
IINa2S322.510.0
IIINa2S423.1 10.0
Table 8. The dosage of polysulfides.
StageSpecies Concentration   of   S n 2 Solution
(mol/L)
Volume   of   S n 2 Solution
(mg/L)
Dosage   of   S n 2
(mg S/L)
Theoretically   Removable   N O 3   - N   Content
(mg/L)
INa2S30.14.012.85.7
IINa2S30.16.019.28.5
IIINa2S30.18.025.611.4
IVNa2S30.112.038.417.1
VNa2S30.116.051.222.8
VINa2S30.120.064.028.5
Table 9. Sampling schedule of sludge sample.
GroupsSampling PeriodSulfur Concentration in System mg S/L
IDay 1 of operation19.2
IIDay 12 of operation19.2
IIIDay 22 of operation19.2
IVDay 38 of operation19.2
Disclaimer/Publisher’s Note: The statements, opinions and data contained in all publications are solely those of the individual author(s) and contributor(s) and not of MDPI and/or the editor(s). MDPI and/or the editor(s) disclaim responsibility for any injury to people or property resulting from any ideas, methods, instructions or products referred to in the content.