Article

MEMS-Based Micropacked Thermal Desorption GC/PID for In-Field Volatile Organic Compound Profiling from Hot Mix Asphalt

by
Stefano Dugheri
1,*,
Giovanni Cappelli
2,
Riccardo Gori
3,
Stefano Zampolli
4,
Niccolò Fanfani
2,
Ettore Guerriero
5,
Donato Squillaci
2,
Ilaria Rapi
2,
Lorenzo Venturini
2,
Alexander Pittella
3,
Chiara Vita
6,
Fabio Cioni
7,
Domenico Cipriano
8,
Mieczyslaw Sajewicz
9,
Ivan Elmi
4,
Luca Masini
4,
Simone De Sio
10,
Antonio Baldassarre
2,11,
Veronica Traversini
2,11 and
Nicola Mucci
2,11
1
Department of Life Science, Health, and Health Professions, Link Campus University, 00165 Roma, Italy
2
Department of Experimental and Clinical Medicine, University of Florence, 50134 Florence, Italy
3
Department of Civil and Environmental Engineering, University of Florence, 50139 Florence, Italy
4
National Research Council of Italy, Institute for the Study of Nanostructured Materials, 00010 Montelibretti, Italy
5
National Research Council of Italy, Institute on Atmospheric Pollution (CNR-IIA), 00185 Roma, Italy
6
Quality of Goods and Product Reliability Laboratory, PIN Foundation, Prato Campus, University of Florence, Piazza dell’Università 1, 59100 Prato, Italy
7
Regional Agency for Environmental Protection of Tuscany, 50144 Florence, Italy
8
Energy System Research (RSE), 20134 Milan, Italy
9
Institute of Chemistry, University of Silesia, 40-006 Katowice, Poland
10
Department of Occupational Medicine, University of Rome “Sapienza”, 00185 Roma, Italy
11
Division of Occupational Medicine, Careggi University Hospital, 50134 Florence, Italy
*
Author to whom correspondence should be addressed.
Separations 2025, 12(5), 133; https://doi.org/10.3390/separations12050133
Submission received: 18 April 2025 / Revised: 5 May 2025 / Accepted: 14 May 2025 / Published: 19 May 2025
(This article belongs to the Special Issue Separation Techniques on a Miniaturized Scale)

Abstract

:
Background: In response to the growing demand for the real-time, in-field characterization of odorous anthropogenic emissions, this study develops and uses a MEMS-based micropacked thermal desorption Gas Chromatography system coupled with a PhotoIonization Detector (GC/PID) for Hot Mix Asphalt (HMA) plant emissions. Methods: The innovative portable device, Pyxis GC, enables the high-sensitivity profiling of Volatile Organic Compounds (VOCs), particularly aldehydes and ketones, with sub-ppb detection limits using ambient air as the carrier gas. A comprehensive experimental design optimized the preconcentration parameters, resulting in an efficient, green analytical method evaluated via the Green Analytical Procedure Index (GAPI). Sorbent comparison showed quinoxaline-bridged cavitands outperform the conventional materials. Results and conclusions: The method was successfully deployed on site for source-specific sampling at an HMA plant, generating robust emission fingerprints. To assess environmental impact, a Generalized Additive Model (GAM) was developed, incorporating the process temperature and Sum of Odour Activity Values (SOAV) to predict odour concentrations. The model revealed a significant non-linear influence of temperature on emissions and validated its predictive capability despite the limited sample size. This integrated analytical–statistical approach demonstrates the utility of MEMS technology for real-time air quality assessment and odour dispersion modelling, offering a powerful tool for environmental monitoring and regulatory compliance.

Graphical Abstract

1. Introduction

Odorous emissions stemming from anthropogenic activities may contribute to adverse health outcomes, diminished property values, and increased levels of public annoyance. Therefore, many jurisdictions classify odour as an atmospheric pollutant and regulate emissions and/or impacts from odour-generating activities at a national, state, or municipal level [1]. Asphalt Mixture Plants represent common sources of odour-active Volatile Organic Compounds (VOCs), due to the high temperature (ranging from 150 to 180 °C) of the final Hot Mix Asphalt (HMA) [2]. Given this context, the need for effective monitoring techniques becomes evident. A current monitoring technique for odour concentration (OC) is dynamic olfactometry [3], which reflects the human perception threshold to odorous compounds but presents some limitations, such as subjectivity, the definition of odour responsibility, and the impossibility of continuous monitoring. Analytical short-time air monitoring, using high sensitivity and specificity to calculate the relationship between the concentration of compounds and the relative odour concentration and anticipate the odour’s perception, is encouraged. Moreover, advancements in automation driven primarily by the growing demand for Green Analytical Chemistry (GAC) [4] have facilitated the evolution of person-portable Gas Chromatography (GC) instruments. Tackling the challenges of on-site airborne chemical exosomes required the implementation of diverse analytical strategies and technological advancements; this approach contributed to miniaturization and automation via online preconcentration, which can reduce the time and the cost of sample preparation [5].
The recent upswing of Micro-Electro-Mechanical Systems (MEMSs) technology has brought new availability and a range of automation to air monitoring. Even though the first work on a microchip-based chromatographic system was a miniaturized GC in 1979 [6], using MEMSs by etching channels into a substrate, this groundbreaking work had not led to further developments of related skills or technology until the 1990s, with the introduction of chip-based preconcentrators instead of an injector to increase sensitivity and selectivity when the solute concentration is below the detection limit of the detector [7]. Since the first preconcentrating microstructures by Frye-Mason et al. [8] in 1999, many works have been carried out, combined with a wide range of adsorbents capable of generating sharp injection plugs [9,10,11,12]. Water condensation problems can be prevented by sampling VOCs on traps filled with hydrophobic materials kept at room temperature [13]. As no single adsorbent material can effectively capture VOCs across a broad volatility spectrum [14], multi-layer sorbent traps comprising various combinations of hydrophobic materials have been introduced to enable VOC collection under varying humidity conditions. Among them, those based on graphitic carbons and poly-2,6-diphenyleneoxide porous polymers (Tenax) are widely used as non-specific sorbents for the quantitative thermal desorption of polar and non-polar components up to C20 [15], despite the low mass of the artefacts provided [16]. This explains the recommended by the US Environmental Protection Agency (EPA) TO-17 Method of multi-layer tubes filled with graphitized Tenax (Tenax-GR) and Carbopack B set in series. Similar performances are provided by traps filled with combinations of Carbopack C and Carbopack B [17]. Traps containing Carbograph 5 are also proposed for the collection of very volatile VOCs at an ambient temperature [13].
The introduction of MEMS-based micropacked GC columns allowed for the separation of unsaturated isomers of light hydrocarbons, and standardized methods [18] as the detectors for chip-based GC. Detection has consistently represented a major challenge in the field of MEMSs, primarily due to the need for highly sensitive techniques capable of analyzing ultrasmall sample volumes. The miniaturization of the Thermal Conductivity Detector (TCD) started with the first micro GC in 1979 [6], and since then, several studies have been published in this area [19]. Yang et al. [20] proposed a miniaturized planar Flame Ionization Detector (FID) in 2000, where the oxygen–hydrogen flame burns inside a glass–silicon chip. Many sensors, such as the chemiresistor array and Metal Oxide (MOX) sensors, have been reported for chip-based GC [20,21]. The proposal of the Photo Ionization Detector (PID) as a selective detector is recent [22,23,24,25,26,27]. Conventional detectors can suffer from large dead volumes and thus slow response times. Therefore, proposals relating to optical detectors used in micro GCs based on surface plasmon resonance [28], ring resonators [29], Fabry–Perot interferometry [30], diode laser spectroscopy [31], optomechanical sensors [32], photonic crystal slab [33], and photoacoustic spectroscopy [34] have been offered. Person-portable GC, in contrast to conventional transportable chromatographs, are typically smaller, lighter, and more energy-efficient, often powered by batteries and using compact gas tanks. While some person-portable devices weigh around one kilogram, others are built on chips using MEMS technology. To be considered truly portable, a system must be easily carried or moved. This can, of course, be very subjective, but objective frameworks of the Health and Safety Executive of the United Kingdom [35] and the International Organization for Standardization [36] set out several helpful guidelines for safe lifting capacity, depending on the task at hand and the posture of the individual. Gałuszka et al. [37] defined a portable system as one ideally weighing no more than 10 kg. It follows that the instrument should be a monolithic system, integrating all the necessary computers and electronics into a single housing. A summary of person-portable GC instruments is in Table 1.
Therefore, to appreciate the fingerprint of the odour rather than the single molecule, the key attributes of a micro GC system—coupled with non-mass detectors—are its compactness, automaticity, reduced power consumption, minimal maintenance costs, and suitability for field analysis.
The global micro GC market was valued at 256 million in 2022, and is projected to reach United States Dollar (USD) 437 million by 2029, at a Compound Annual Growth Rate (CAGR) of 8.5% during the forecast period. The first commercial micro GC product released by the C2V Company dates back to 2010, and it was called C2V-200 [38]. Since then, only a few commercialization experiences have been presented to date, and the remaining projects are within research groups [33,39]. The challenges faced by this work include the in-field and laboratory characterization of the odorous emissions from HMA via MEMS technology via a new, innovative micro GC monitoring system. To contribute to the growing use of this technology, this study explores the air sampling for the preconcentration, and the related analysis performed by GC/PID. So, to reduce the number of experiments needed for the optimization of the preconcentration, and thus the resources utilized, the development of the method was performed by applying the Design of Experiment (DoE) approach. Using the GAPI approach, the conformity principles of GAC were evaluated for the developed method. The analysis of olfactometry nuisance in this study combines field measurements with subsequent modelling to assess the impact of odorous emissions. Field sampling was conducted over several days at the site of the final HMA production, capturing variations in odour intensity and composition. Following the field data collection, a statistical modelling based on Generalized Additive Models (GAMs) approach was employed to predict the odour concentration emitted by channelled emissions of Asphalt Mixture Plants, offering a comprehensive understanding of the spatial and temporal distribution of the olfactory nuisance. This integrated methodology aims to provide insights into the underlying factors contributing to the perceived olfactory impact, facilitating more effective management and mitigation strategies.

2. Materials and Methods

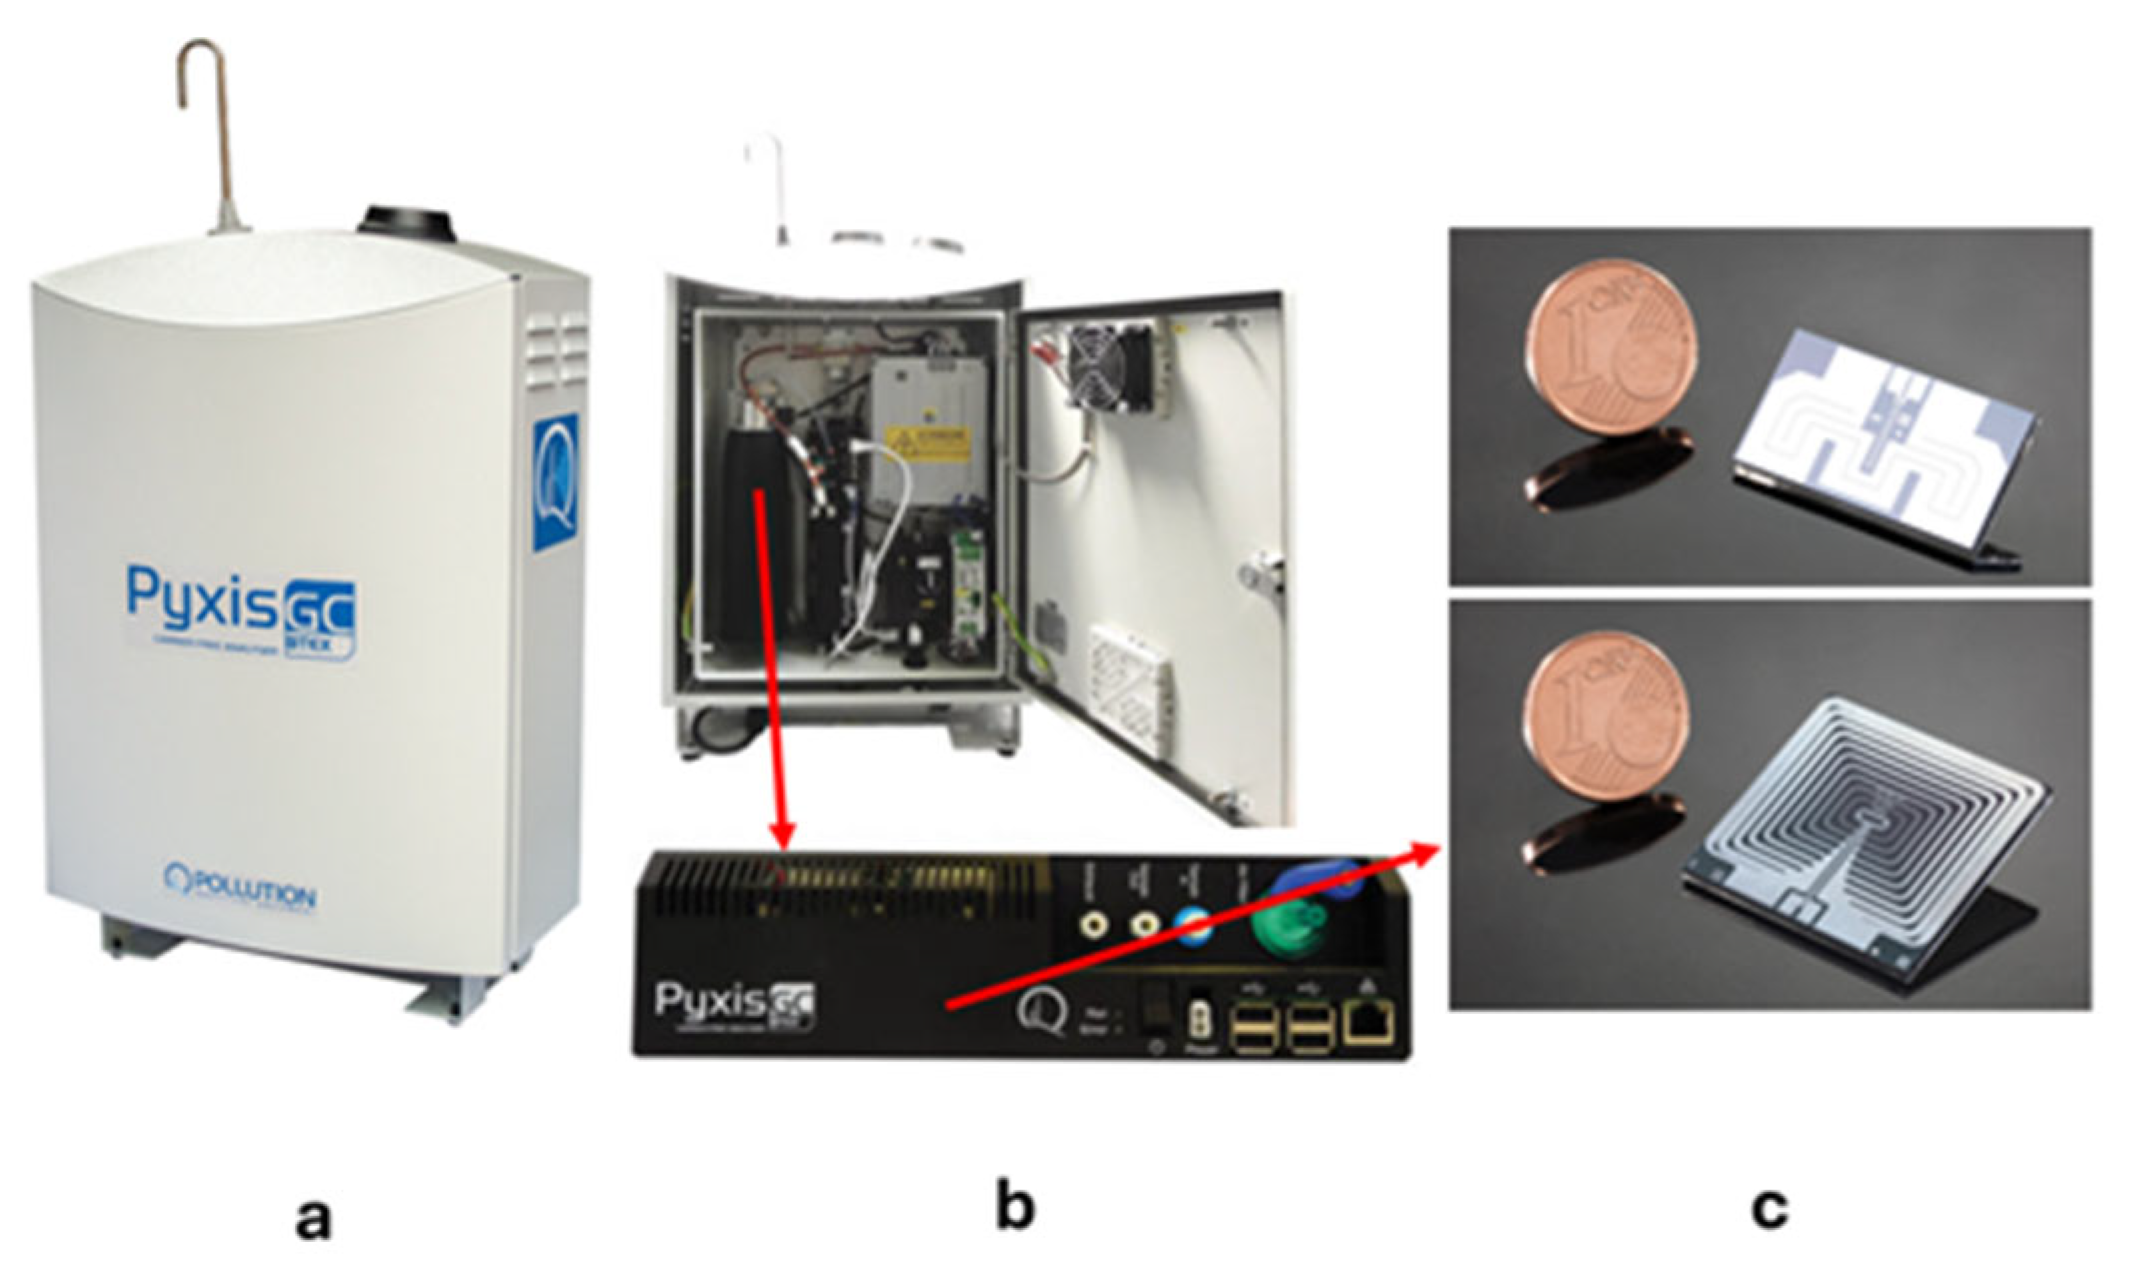
2.1. Analytical Instruments: Micro GC, Preconcentration, MEMS Packed Column

Pyxis GC (Pollution, Budrio, Italy) combines the MEMS of microfluidics for selective preconcentration and GC separation (Figure 1), with the peak quantification given by the miniaturized PID (10.6 eV), allowing VOC monitoring (detection limit 0.01 ppb of benzene) using ambient air as the carrier gas.
The use of flow inversion in the pre-concentrator between the sampling and the desorption phase ensures sharp injection peaks into the packed GC column, optimizing the chromatographic separation. The robustness, enabling monitoring from −40 °C to 50 °C, was represented by dimensions (420 mm × 620 mm × 210 mm) and weight (19 kg), with batteries that can be connected to the electric mains or photovoltaic cells. Pyxis GC was equipped with an auto-check system to verify and eventually correct the instrumental drift. Remote control for data access was performed by the Pollution Guardian IoT Service (Pollution, Budrio, Italy), and notifications via SMS, email, or a dedicated app were applied. The wind speed and direction, barometric pressure, relative humidity (RH), air temperature, and solar radiation were obtained by the Pyxis GC weather control unit. Additionally, the pre-concentration efficiency of quinoxaline-bridged cavitand (QxCav) [40], Carbograph 1 (Lara, Formello, Italy), and Activated Porous Carbon Fibre (APCF) by Labtech (Labtech s.r.l., Rome, Italy) [41], used as a sorbent micropacked on the MEMS pre-concentrators, was assessed in terms of mass loading, trapping time, desorption temperature, and desorption time. For the MEMS GC packed column, the material used in our investigation was non-porous Carbograph 2SAP (Lara) with a surface area of 13 m2/g. Carbograph is obtained via the graphitization process from different kinds of carbon black derived from mineral oil or natural gas, heated in an oxygen-poor environment.
The initial column temperature was set to 50 °C for 50 s, then reached 180 °C in 180 s for a total analysis time of 600 s. Ambient air at a flow rate of 8.0 mL/min was used as the carrier gas.
For confirmation of the considered aldehydes and ketones detected in the field, the Pyxis GC was coupled with a Varian 320-QpQ-MS (Varian Inc.) detector. The MEMS GC packed column was connected to the injector via retention gaps (1 m, ID 0.25 mm, part # 10009, Restek, Bellefonte, PA, USA) and to the MS via a particle trap (1 m, ID 0.25 mm, part # 19774, Restek). Helium was used as the carrier gas at 3 mL/min.

2.2. Training and Calibration: Dynamic Atmosphere Standard by ATIS

Calibration of the Pyxis GC was carried out using a dynamic atmosphere system (ATIS, Supelco, Merck KGaA, Saint Louis, MO, USA).
Subsequently, the configured instrument was employed to determine the odour fingerprint of the emissions from the HMA, specifically the conventional Surface Layer (SL) made (w/w) of 5% bitumen (50/70 type), 65% aggregate, 8% filler, and 22% Reclaimed Asphalt Pavement (RAP). The RH of the HMA-SL declared by the manufacturer was less than 1%. For the analysis, ten grams of the HMA-SL sample was loaded into a 40 mL crimp-top amber glass vial (Supelco, Merck KGaA, Saint Louis, USA, product no. 23189), with a closure-type screw top vial, a closure-type white polypropylene hole cap, and a PTFE/silicone septa equipped with two 18-gauge needles (1.219 mm external diameter), one of which was connected to Pyxis GC. The vial was then heated at the bottom at 160 °C and cooled at the head with compressed air at 25 °C.
For the calibration of the instrument, stock solutions of butanal, pentanal, hexanal, heptanal, octanal, 2-butanone, 2-hexanone, and 3- heptanone in methanol were prepared and were stored at −20 °C.
Starting from stock solutions, a mixed working solution containing the diluted substances in methanol was prepared. A five-level calibration curve was prepared for each compound by adding the appropriate volume of STD work solution, and the standard atmospheres were generated through the adsorbent Tube Injector System (ATIS, Supelco, Bellefonte, PA, USA), in order to obtain the desired airborne concentration. The analysis was carried out using the following instrumental parameters: a sampling time of 100 s, a flow rate sampling of 250 mL/min, a desorption time of 10 s, and a desorption temperature of 120 °C (obtained via chemometric optimization in Section 3.2). The analyte concentrations for each calibration-generated atmosphere are reported in Table 2.
The calibration curves were obtained by plotting the peak area ratios (PARs) between the analyte and IS quantitation ions versus the nominal concentration of the calibration solution. A linear regression analysis was applied to obtain the best-fitting calibration curve. The limits of detection and quantitation (LOD and LOQ) were calculated according to the ICH guidelines, using the approach based on the standard deviation of the blanks and slope of the regression [42].

2.3. Experimental Plan on MEMS Preconcentrators

The data were collected using Microsoft Excel and processed using the Chemometric Agile Tool (CAT), an open source and R-based software (3.0.0) [43]. The application of a D-Optimal design allowed for the evaluation of the effect of four factors on MEMS preconcentrators using MEMS trapping materials with a multivariate approach, only performing nine experiments. From the preliminary results, it was possible to exclude the possibility—compared to the ones of the quinoxaline-bridged cavitand (QxCav)—of using both Carbograph 1, with a far inferior performance, and the APCF, which was too fragile. Moreover, the sampling times higher than 100 s were not considered during the optimization of the method, because this would have enhanced the duration of the sample analysis too much. To optimize the analysis, the effects of four factors were studied in three levels each: the sampling time (x1) at 25, 50, and 100 s, the flow rate sampling (x2) at 250, 350, and 450 mL/min, the desorption time (x3) at 10, 40, and 80 s, and the desorption temperature (x4) at 120, 140, and 180 °C. To build the model, the interactions among the factors were omitted, since the authors already knew that the variables considered are naturally linked. The relative experimental plan with the experiments performed is reported in Table 3.
To optimize the method, three responses were selected. The intensities, as PID signals reported in mV, were selected for three key analytes, namely hexanal (y1), butanal (y2), and octanal (y3) (as shown in Section 3.2. The aim was to maximize the sensitivity in terms of the intensities for all the analytes. Each experiment was performed in triplicate and the models were computed at the concentration of 50 ppb.

2.4. Greenness Evaluation

The environmental friendliness of the analytical method was evaluated by applying the GAPI tool [44] (moGAPI 2024)(performed with the software available in [45]). The GAPI was utilized to highlight that the method is safer for the operators and complies with green chemistry principles. Each pentagram of the GAPI [44] represents a specific factor: the pictogram represents a step of the analytical protocol and the colour scale from red to green indicates a high or low environmental impact.

2.5. Model Specification and Fitting

Channelled emissions of an Asphalt Mixture Plant were evaluated for OC determination (n = 15) using dynamic olfactometry following standardized procedures in accordance with EN 13725:2022 [3]. VOC concentrations were quantified using Pyxis GC, and the temperature (°C) was recorded concurrently. The sample size was selected to ensure the adequate representation of emission variability and to comply with the 30 h analytical time window mandated by the standard for odour emission evaluation (EN 13725). The Odour Activity Value ( O A V i ) [46] was computed by dividing its VOC concentration ( C i ) by its established Odour Threshold ( O T i ) [47]:
C i O T i = O A V i
The Sum of ( O A V i ) (SOAV) represents an aggregate predictor variable uncorrelated with other predictors of interest such as the process temperature.
i = 1 n C i O T i = S O A V
A GAM [48] was formulated to predict odour emissions using a Gamma family distribution of the response variable with a logarithm function link.
log O d o u r   C o n c e n t r a t i o n = β 0 + β 1 S O A V + f ( P r o c e s s   T e m p e r a t u r e )

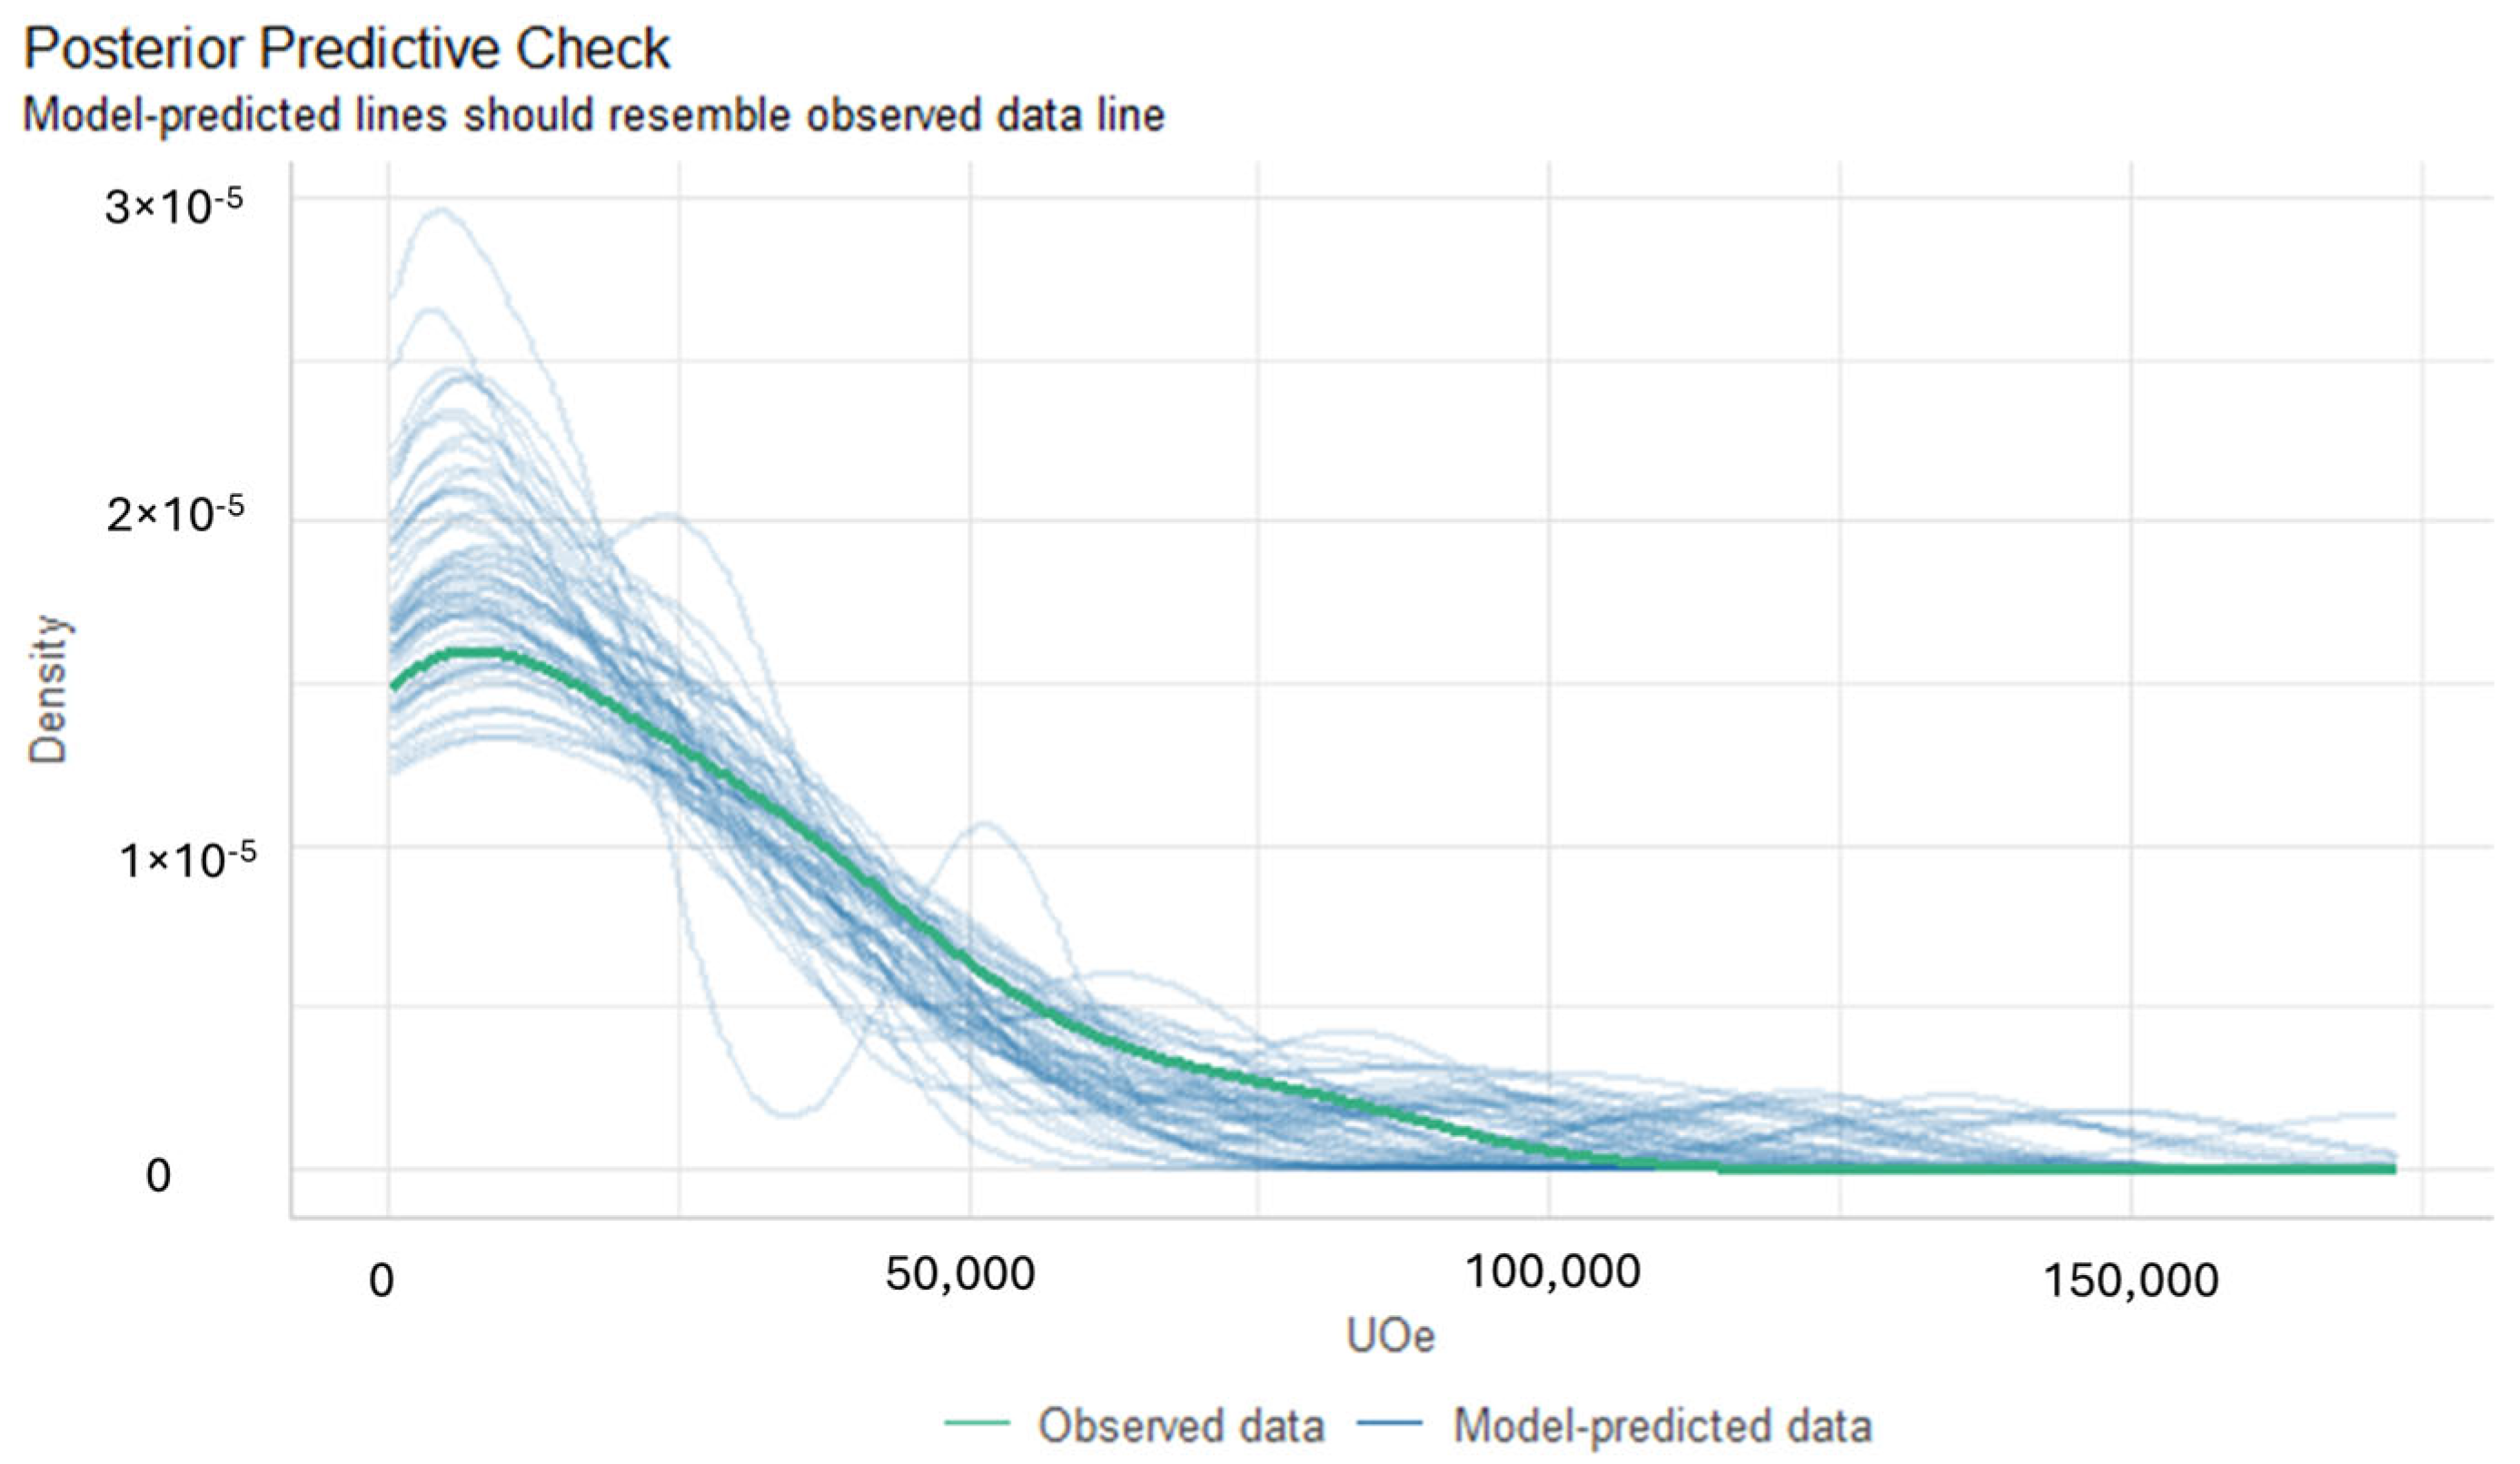
Diagnostic Evaluation

Basis Dimension (k) Check: A diagnostic (commonly referred to as the “k-index”) was employed to verify that the chosen spline basis dimension was sufficient. An excessively low k would over-smooth the data, while an excessively high k could lead to overfitting.
Goodness-of-Fit Metrics: The Deviance-Explained and Adjusted R2 measured how much of the odour emission variability was captured by the model.
GCV Score: This provided a comparative index for model complexity.
Akaike Information Criterion (AIC) and Bayesian Information Criterion (BIC): These were also monitored to ensure an appropriate balance between model fit and parsimony.
To check the collinearity and the concurvity and to evaluate the potential multicollinearity between the predictors included in the GAM, the Pearson correlation coefficient and the concurvity measure were captured. The Pearson correlation matrix for the predictors SOAV and process temperature revealed a correlation (r = 0.7), indicating a certain degree of linear association between these variables. Furthermore, the concurvity in the GAM was assessed. A posterior predictive check—where the empirical data densities are compared to model-predicted densities (Figure 2)—helped confirm that the model approximates the observed odour emissions reasonably well.

3. Results and Discussion

To date, there are few analytical methods [49] for the determination of the odour-active compounds of HMA; the gap especially occurs for in-field monitoring. A person-portable MEMS-based micropacked thermal desorption GC/PID system was evaluated as a potential alternative to conventional methods for the determination of odorous compounds, offering a simple, rapid, sensitive, and solvent-free approach for HMA fingerprinting. These compounds are represented by aldehydes and ketones [48], having an Odour Threshold (OT) that decreases markedly to sub-ppb as the number of carbon atoms increases.

3.1. Analytical Set up Optimizatiom: Sorptive Material Evaluation and Method Calibration

The sorptive material of the preconcentrator must selectively adsorb one or more molecules of interest over a time necessary to concentrate the chemical compound in the adsorptive material [41]. The optimization of the adsorption and desorption performance—established between a suitable adsorbent, low power consumption, and simple fabrication technology—is crucial for achieving a high preconcentration factor, and is then able to be refocused at the head of the GC column. Subsequently, the sorptive layer is rapidly heated to induce thermal desorption, generating sharp peaks with relatively high analyte concentrations directed toward the connected sensor or detector. This process enables the purification and preconcentration of analytes from a large air volume, thereby enhancing detection efficiency.
The dimensions of MEMS-based micropacked technology in relation to preconcentrators led us to consider the comparison of three unconventional trapping materials, namely APCF, QxCav, and Carbograph 1. Paris et al. [40] point out the surface area of granular-active carbon (usually of about 1000 m2/g) versus fibrous APCF (2000 m2/g, density of 0.095 g/cm3, and fibre diameter 10 μm), and compared tubes in APCF and classic multilayers tubes (Carbograph 1TD plus Carboxen 1003), showing that APCF provides better results with lower standard deviations when compared to others, even with different sampling volumes. The Authors [40] also note that APCF, being a fibre, allows the tubes to be packed more homogenously for sampling than the current activated granular-active carbons, resulting in a superior adsorption/desorption capacity. The selective complexation of aromatic hydrocarbons by QxCav, driven by multiple π–π and CH–π interactions between the aromatic guest and the deep, hydrophobic cavitand cavity [50,51,52], has been leveraged to develop a low-cost system capable of sub-ppb detection limits for VOCs, even in the presence of other airborne pollutants and with high resistance to humidity [53].
Although aldehydes and ketones generally require, for trace analysis, a derivatization of the carbonyl group or the use of mass detectors when considered as such [54,55], the miniaturized PID (10.6 eV) has proven in lab tests to be particularly sensitive (Table 4) for the molecules considered in this work, and capable of generating a particularly significant HMA fingerprint.
Graphitized Carbon Blacks (GCBs), such as Carbograph, Carbopack, and Carbotrap, are broadly utilized non-selective carbon sorbents in trace-level VOC analyses, primarily due to their low artefact production. Uniquely among hydrophobic materials, they offer performance comparable to that of certain molecular sieve adsorbents. GCBs exhibit a spectrum of adsorption strengths—from very weak to medium and strong—with the most retentive forms displaying some degree of microporosity, thereby positioning them as intermediates between standard GCBs and carbonized molecular sieves. Carbograph 2SAP has proven to be excellent for the rapid separation of ultra-volatiles and volatile C2-C7 VOCs, as shown in Section 3.3.

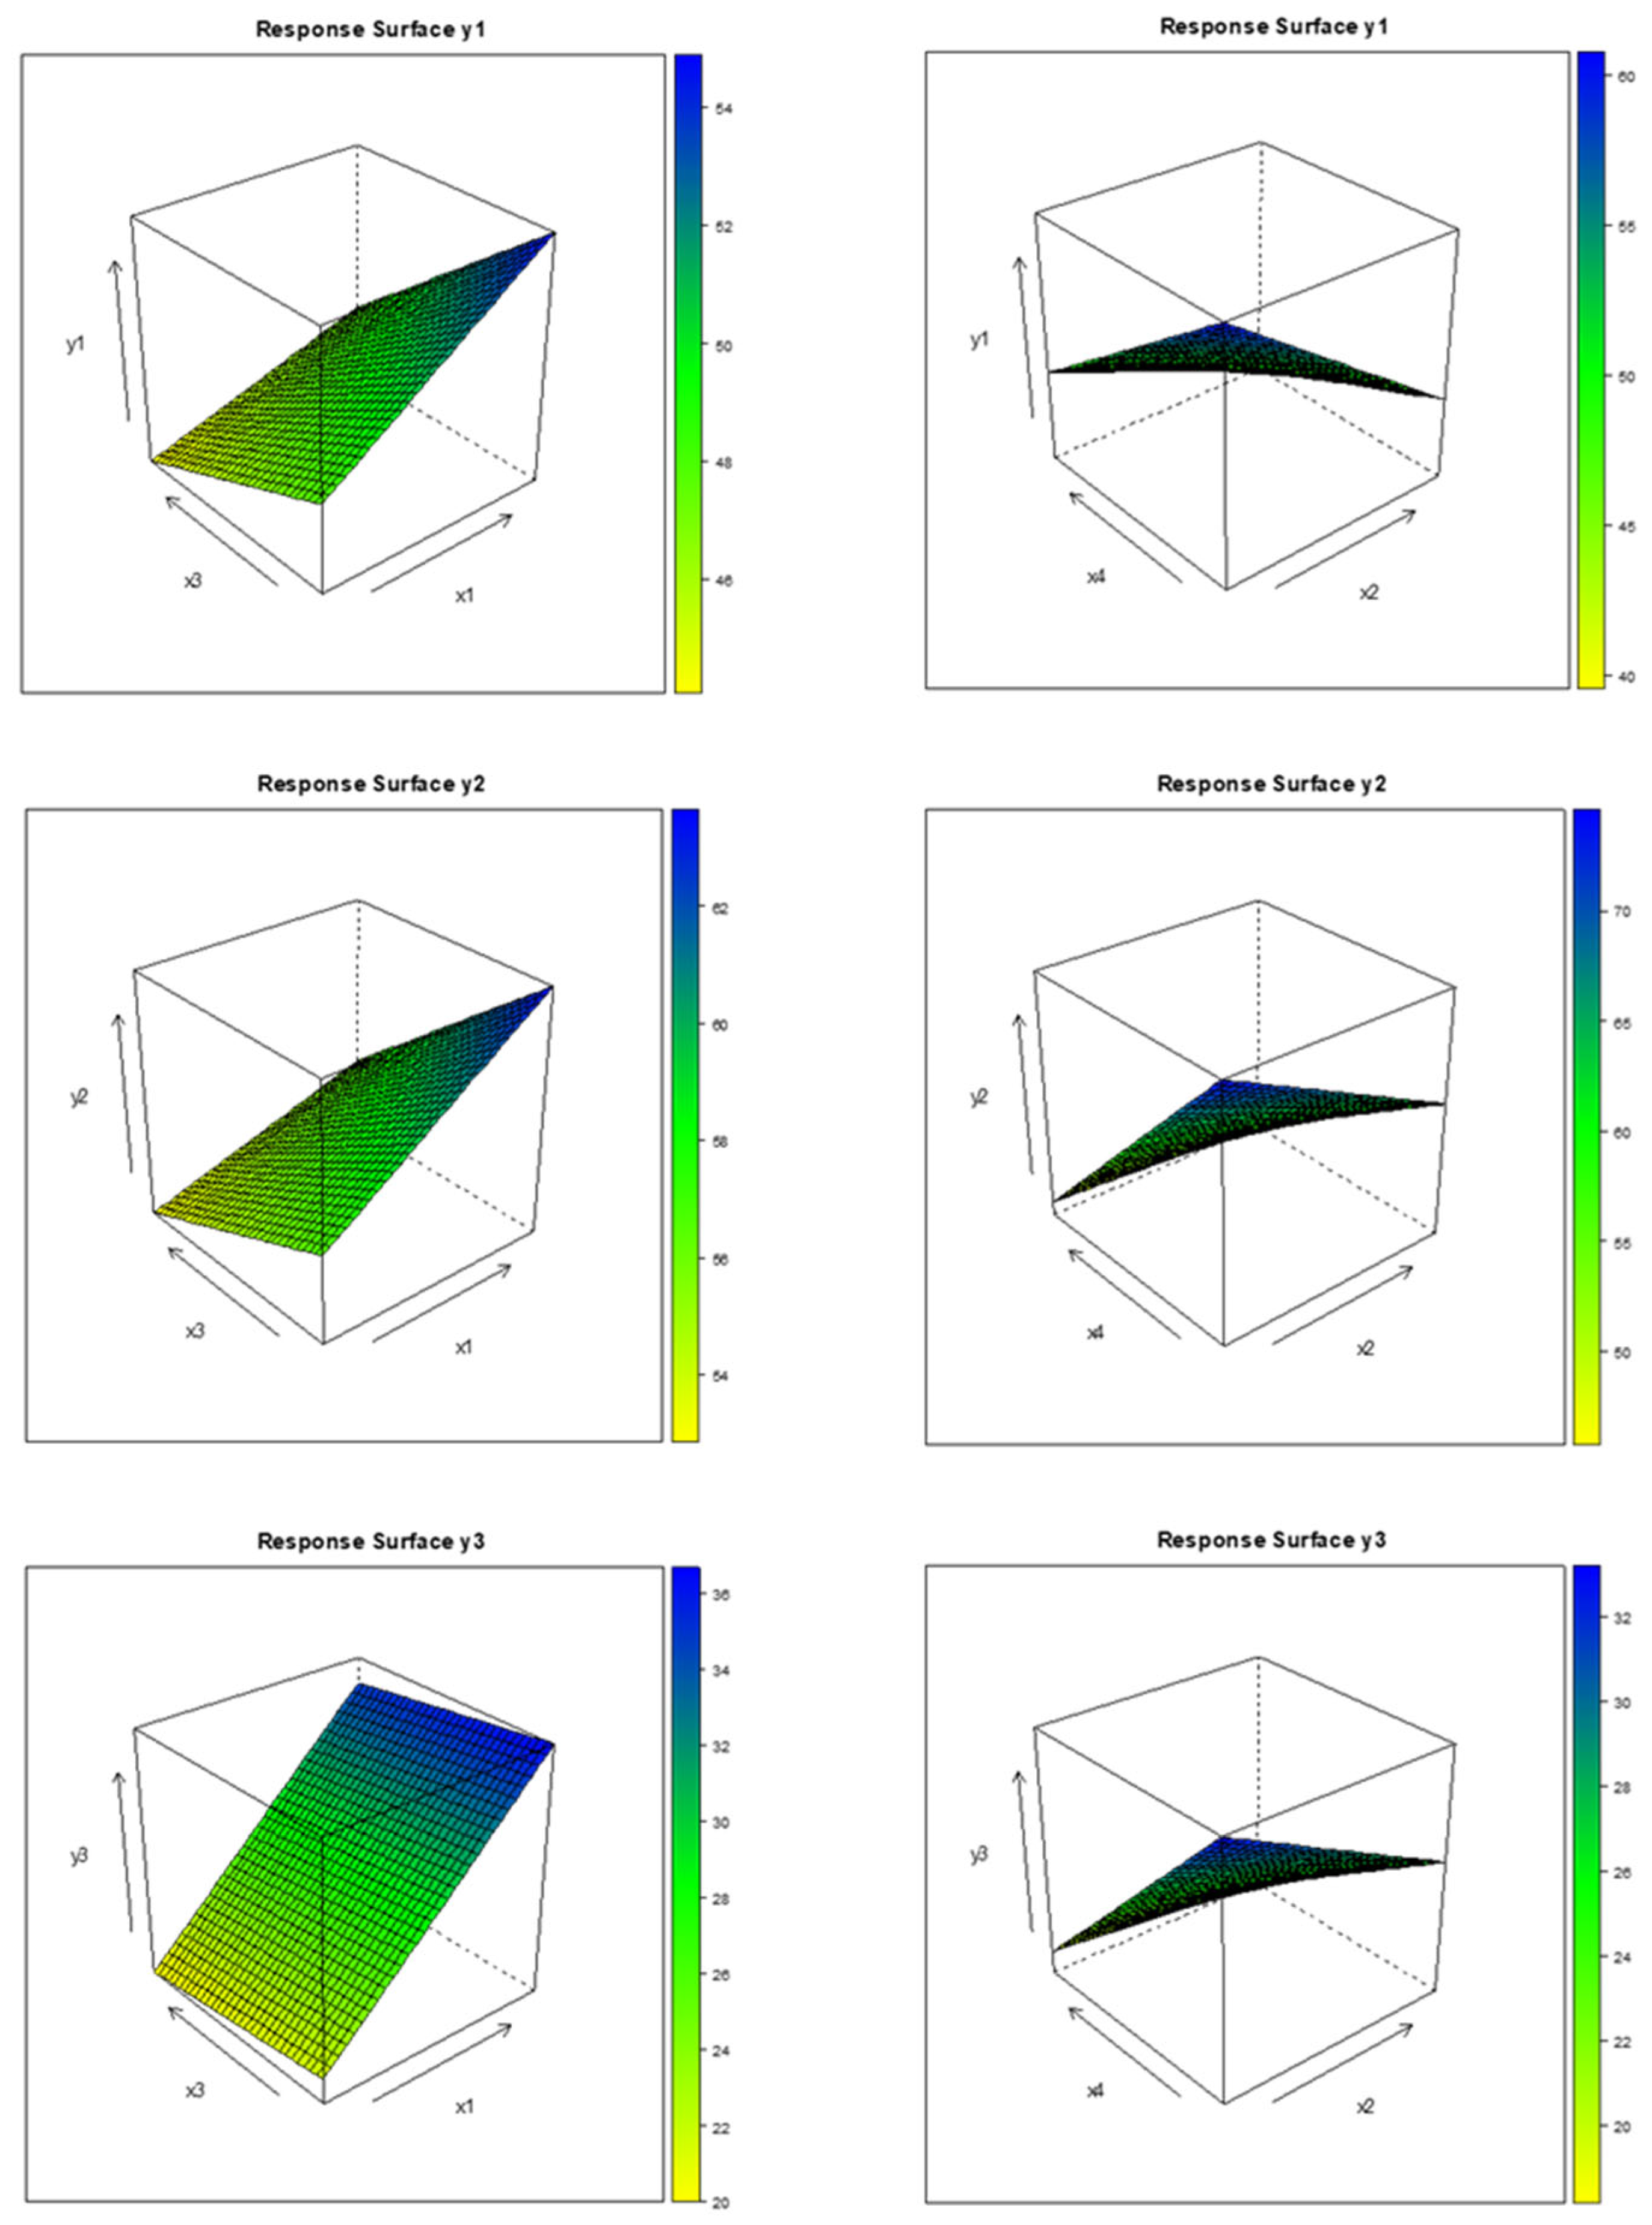
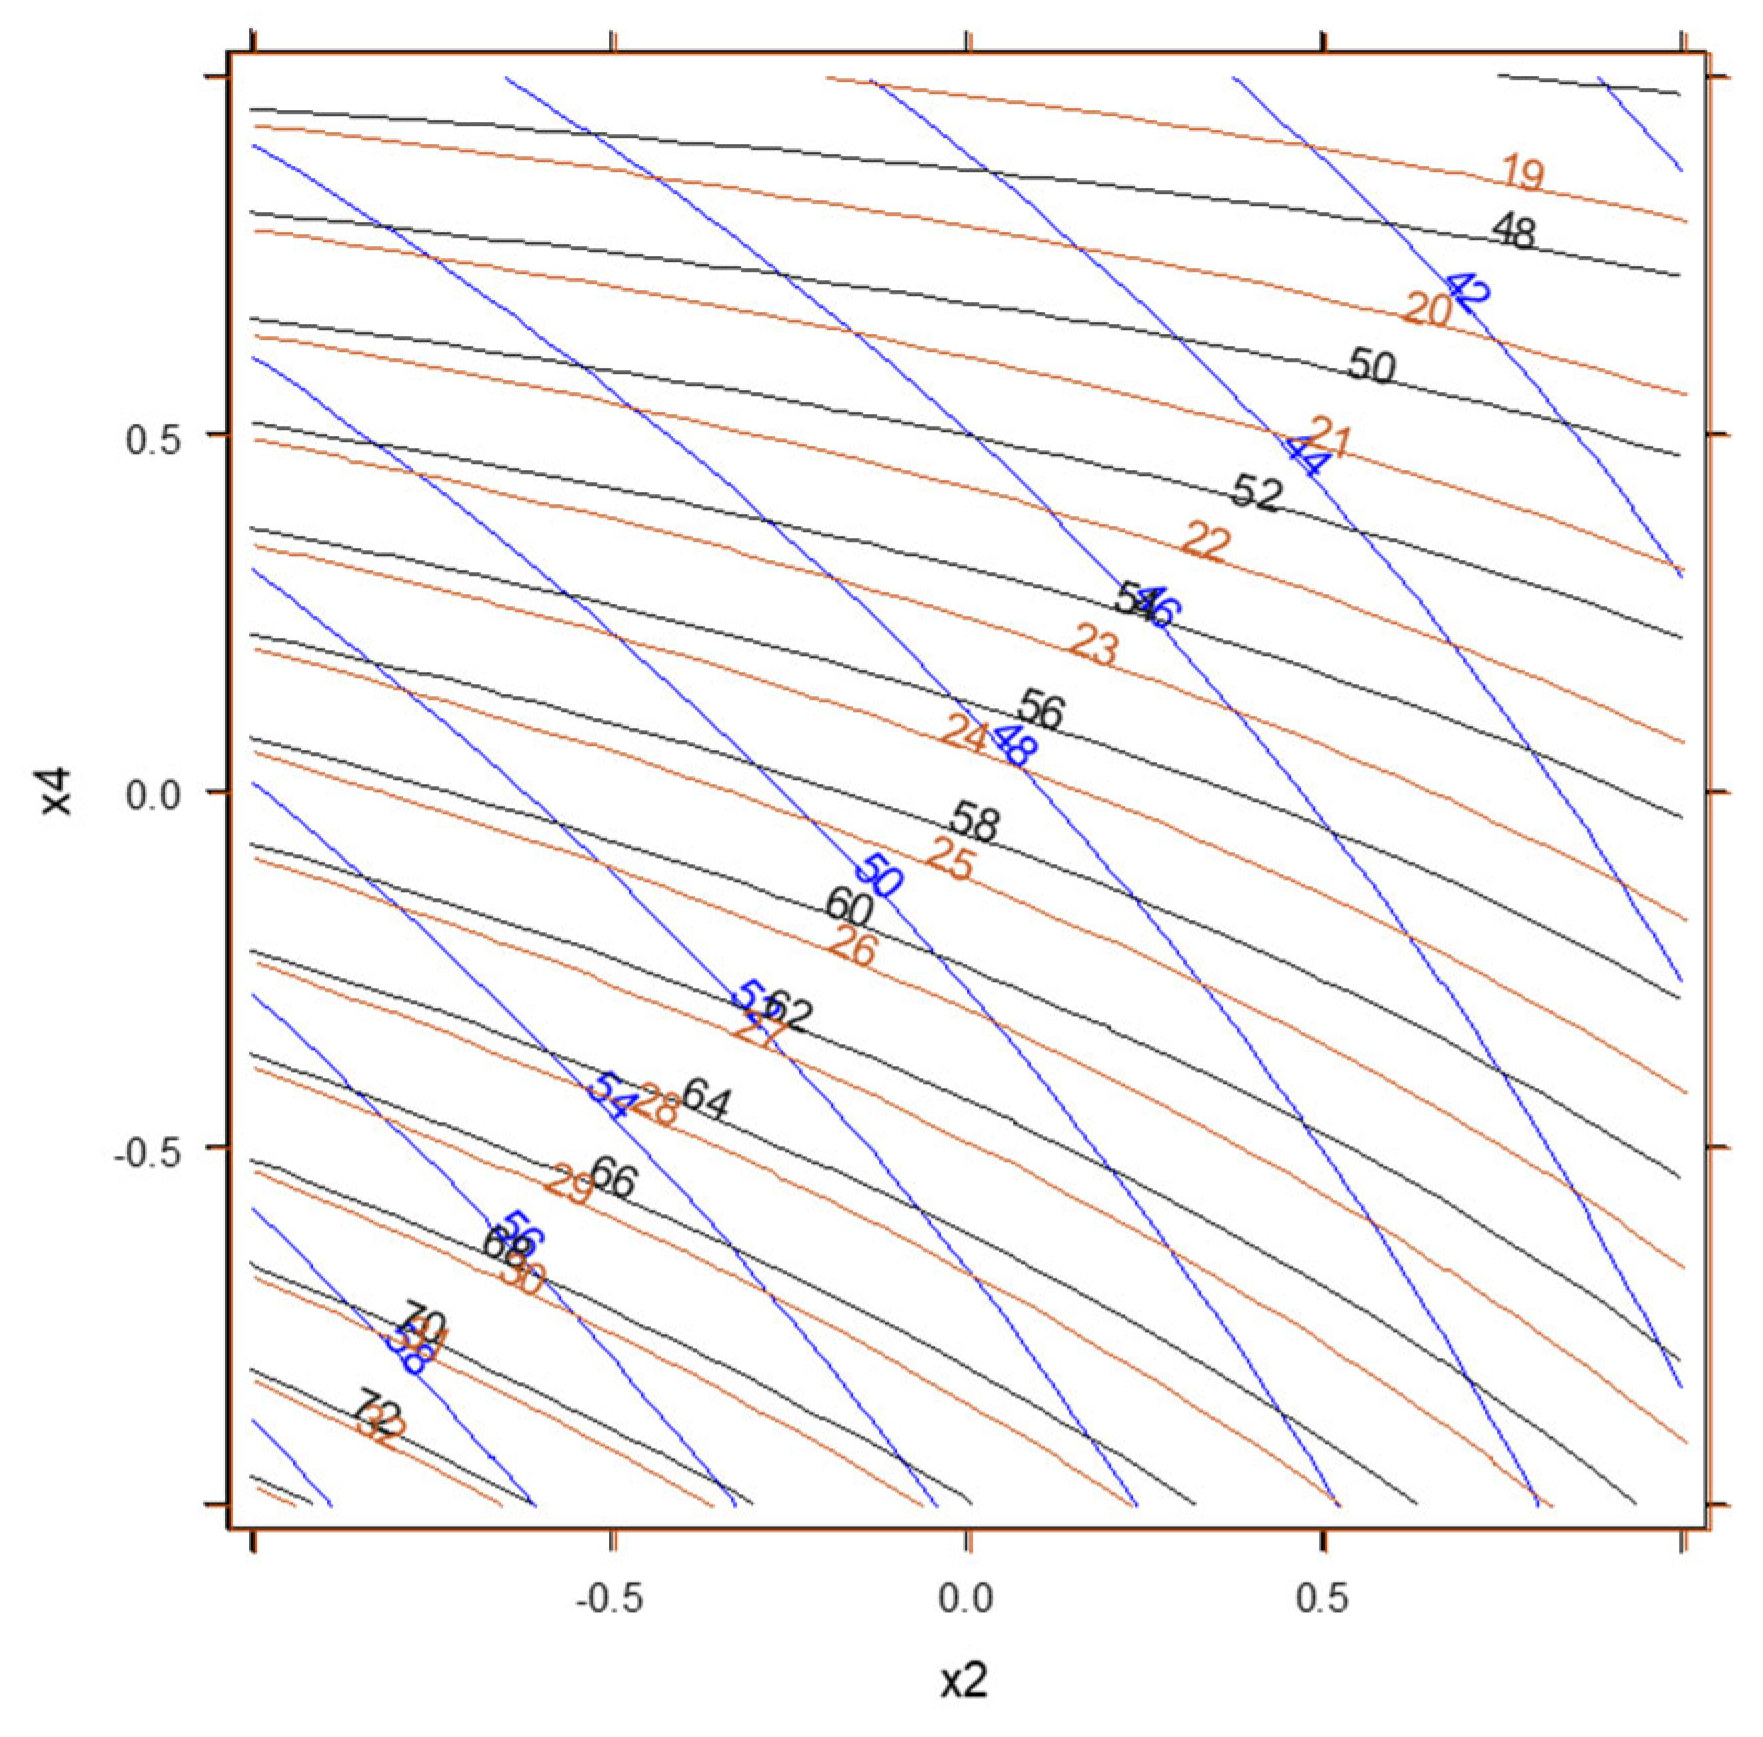
3.2. Chemometric Analysis

As already mentioned in Materials and Methods, a D-Optimal design was applied to investigate all the possible interactions among the variables involved during the sampling and detection of three aldehydes with the Micro-Electro-Mechanical System, performing only nine experiments. As can been seen from Table 3, all the variables were studied at three levels each, with the sampling time (x1) between 25, 50, and 100 s, the flow rate sampling (x2) between 250, 350, and 450 mL/min, the desorption time between (x3) 10, 40, and 80 s, and the desorption temperature (x4) between 120, 140, and 180 °C.
The model describing the sensitivity of the analytes (y1, y2, and y3) can be considered parallel, meaning that the experimental conditions that allowed the highest response for the three analytes are the same. This can be easily seen from Figure 3, which reports the response surfaces obtained from the models; in fact, the highest responses for all the analytes can be achieved when the factors x2, x3, and x4 are at the lowest level (−1) and the factor x1 is at the highest level (+1).
So, the optimization of the analytical method can be obtained when working with a sampling time of 100 s (x1 = 1), a flow rate sampling of 250 mL/min (x2 = −1), a desorption time of 10 s (x3 = −1), and a desorption temperature of 120 °C (x4 = −1). The same results can be assessed by comparing the contour plots elaborated from the models for the intensities of the aldehydes. For example, in Figure 4, the contour plots regarding the factors x2 and x4 for the three analytes in different colours are reported. Also in this case, it is easy to indicate that to maximize the analyte responses, the two variables must be set at the lowest level (−1). The same can be carried out with the contour plots for the factors x1 and x3 (not reported), with the only difference that, in this case, to maximize the sensitivities, the factor x1 must be set at the highest value (1), and the other one at the lowest value (−1).

3.3. Greenness Evaluation

As can be easily assessed in Figure 5, this method has a complete green character, with the sample storage and pre-treatment being unnecessary, having a solvent-free method, and requiring a low amount of energy for each sample. The use of filtered ambient air as a carrier gas results in no need for carrier gas cylinders, further reducing the operational costs and environmental impact on the proposed MEMS-based GC/PID system.
The first pentagram on the bottom left (A) refers to the sample collection and storage, while the pentagrams on the upper left (B) and the upper right (C) account for the sample pre-treatment and the amount of reagent/solvent used. The last one, (D), on the bottom right, instead involves the quantity of generated waste, the hazard for the operator, and the energy requested for the analysis.
The evaluation of the green character of an analytical protocol has gained great importance; in our opinion, the developed method represents the gold standard for this kind of application and it can provide a benchmark against which to compare similar analytical scenarios.

3.4. Method of Field Application

On-field sampling was conducted with the developed instrument and settings for fifteen days (temperature ranged from 18 to 22 °C, and relative humidity ranged from 60 to 79%) directly at the source, specifically at the stack within a production facility. The data presented in Table 5 and in the graph (Figure 6) below are derived from these sampling activities. From the data obtained in the field, a characteristic fingerprint of the HMA can be observed, like the one obtained in the training phase of the instrument with aldehydes and ketones, which represent the most present compounds in the profile, with particular attention on hexanal.

3.5. GAM Approach

This study demonstrates the utility of a GAM approach in modelling odour emissions, particularly when the data exhibit non-linearity and collinearity issues among predictors. Although the sample size used in the GAM was limited (n = 15), it was considered sufficient to capture variability in the odour concentration, while respecting the 30 h analytical window mandated by EN 13,725 [3]. The model incorporated penalized thin-plate regression splines with a low basis dimension (k = 3) to avoid overfitting. Additionally, goodness-of-fit diagnostics, concurvity checks, and posterior predictive evaluations confirmed the model’s ability to approximate observed odour patterns despite the limited dataset. While the relatively small sample size may limit the generalizability of the findings to broader populations or other industrial settings, the model still provides robust insights within the scope of the observed operational conditions. The constrained complexity of the smooth terms and the use of an appropriate distribution (Gamma family with log link) contributed to a stable model fit, suggesting that the approach remains valid for exploratory and predictive purposes in similar contexts. The fitted Gamma model with a log link provided meaningful insights into how the overall SOAV and temperature can be used to predict odour emission rates. SOAV was computed as the sum of the OAV values of butanal, pentanal, hexanal, heptanal, octanal, 2-butanone, 2-hexanone, and 3-heptanone.
The Shapiro–Wilk test confirmed that the response variable, odour concentration (OC), was not normally distributed (p-value < 0.01). Scatterplots between OC and each predictor (i.e., VOC concentrations and process temperature) did not reveal any clear linear trends. The processing temperature refers to the actual temperature recorded at the point of emission during HMA production, as measured concurrently with odour sampling using the Pyxis GC system. This temperature is a key operational variable affecting the volatilization of odorous compounds.
Given the known influence of temperature on the volatilization of odorous compounds, and its potential non-monotonic effects, we opted for a Generalized Additive Model (GAM) that incorporates a spline-based smooth term for the process temperature. This allows for the flexible fitting of complex, non-linear relationships such as thresholds, plateaus, or saturation effects.
To validate the shape of the non-linear trend, we compared the GAM fit with a LOESS (Locally Estimated Scatterplot Smoothing) model—a non-parametric smoother widely used for exploratory data analysis. The purpose of this comparison, shown in Figure 7, is to ensure that the GAM, despite its more structured statistical formulation, aligns well with the trend revealed by the data-driven LOESS curve. The consistency between the two models strengthens the confidence in the GAM’s ability to accurately capture the underlying temperature–emission relationship.
Thus, we relied on a GAM to build a regression model that utilizes the process temperature and SOAV.
The response variable, OC, fit a Gamma distribution, reflecting the continuous and strictly positive nature of odour emission data and accounting for possible heteroskedasticity. A logarithmic link ensures that predictions remain positive. The Sum of Odour Activity Values (SOAV) was included in the model as a parametric linear term, as its relationship with odour concentration (OC) did not exhibit non-linear behaviour. In contrast, the process temperature was modelled using a penalized regression spline, denoted as f(), to account for its non-linear effects on odour emissions (Figure 6). A thin-plate regression spline with a moderate basis dimension (k = 3) was employed to ensure a balance between model flexibility and overfitting risk, with Generalized Cross-Validation (GCV) scores used to optimize the spline’s complexity. Concurvity analysis revealed a worst-case value of 0.8, suggesting a relatively strong dependency between predictors, indicative of potential collinearity. However, the concurvity values specific to the smooth term for temperature remained in the moderate range (0.4–0.5), supporting the model’s robustness.
The SOAV term exhibited a statistically significant positive effect on odour emissions (p < 0.05), indicating that as the combined odorant load increases, the overall emission rate also rises. The process temperature (smooth term) showed a non-linear relationship (p < 0.001), with an estimated effective degree of freedom of approximately 1.9, suggesting a near-quadratic trend. The model indicated an initial rise in emissions with increasing temperature, followed by a plateau or slight decline at higher temperatures (Figure 8).
Figure 7 and Figure 8 reinforce the predictive reliability of the GAM and emphasize the process temperature as a manageable operational variable for odour mitigation. The results we obtained are shown in Figure 9, where prediction values and observed odour concentrations are confronted. Overall, the model has a Mean Absolute Prediction Error (MAPE) of approximately 39%. Thus, this model can be used to obtain an estimate of the odour impact at the receptor by predicting the estimate of the odour concentration emitted from channelled emissions via Pyxis GC, and using it as the input of dispersion models such as AERMOD [56] or CALPUFF [57].
Residual plots were inspected to check for patterns or trends that might suggest misspecification in the model (e.g., leftover heteroskedasticity or unmodeled interactions). The residuals were normally distributed, thus, no patterns were found that could imply the misspecification of the model.

4. Conclusions

Micro Gas Chromatography systems have experienced significant growth over the past two decades, evolving into a powerful analytical tool for the real-time monitoring of gaseous emissions. The method developed in this study, based on a MEMS-enabled micro GC/PID system, represents a major innovation in the field of odour emission analysis. Its novelty lies in the integration of multiple technical components that have not previously been used together: miniaturized and directly heated MEMS devices for both the preconcentrator and the separation column; a hydrophobic quinoxaline-bridged cavitand as a highly selective sorbent material; and graphitized carbon (Carbograph 2SAP) as the active stationary phase within the MEMS GC column. Moreover, the system operates using filtered ambient air as the carrier gas, enabled by the oxygen tolerance of both the cavitand and the graphitized carbon under operational conditions.
The instrument, whose preconcentration process was optimized via D-Optimal experimental design, was tested on real HMA samples, and proved capable of generating detailed emission fingerprints composed predominantly of aldehydes and ketones—compounds known for their low Odour Thresholds and significant olfactory impact.
Concerning the greenness, the method demonstrated excellent environmental compatibility, as evaluated by the GAPI, confirming its minimal ecological footprint and alignment with green chemistry principles.
Finally, the field data acquired were incorporated into a GAM, which effectively captured the non-linear relationship between the odour concentration, process temperature, and the Sum of Odour Activity Values (SOAV). Despite a limited sample size, the model showed predictive capacity, underscoring the potential of micro GC systems not only as analytical tools, but also as integral components of environmental modelling workflows. This approach paves the way for the deployment of advanced, miniaturized instrumentation in environmental monitoring, regulatory compliance, and proactive odour management strategies.

Author Contributions

Conceptualization, S.D., G.C. and R.G.; methodology, L.V., M.S., S.Z., I.E., L.M., E.G. and D.C.; software, C.V. and I.R.; validation, R.G. and I.R.; formal analysis, N.F.; investigation, R.G., E.G. and A.P.; resources, N.M.; data curation, D.S. and F.C.; writing—original draft preparation, S.D.; writing—review and editing, D.S. and S.D.S.; visualization, N.F., A.B. and V.T.; supervision, N.M. and S.Z.; project administration, S.D.; funding acquisition, N.M. All authors have read and agreed to the published version of the manuscript.

Funding

This research received no external funding.

Data Availability Statement

The original contributions presented in this study are included in the article. Further inquiries can be directed to the corresponding author.

Acknowledgments

This manuscript has been developed based on the concept of the project FIN.E.ODOR. (FINgerprint ed Emissioni ODORigene di conglomerati bituminosi) by SITEB-associazione Strade ITaliane E Bitumi (Bologna, Italy) and the PIN-Polo Universitario Città di Prato (Prato, Italy) of the University of Florence. The authors of this work would like to thank Stefano Ravaioli and Alessandro Pesaresi, respectively, for their precious support and collaboration in harvesting the HMA samples analyzed.

Conflicts of Interest

Author Domenico Cipriano is employed by the company Ricerca sul Sistema Energetico. The remaining authors declare that the research was conducted in the absence of any commercial or financial relationships that could be construed as potential conflicts of interest.

Abbreviations

The following abbreviations are used in this manuscript:
HMAHot Mix Asphalt
VOCsVolatile Organic Compounds
GAPIGreen Analytical Procedure Index
GAMGeneralized Additive Model
GCGas Chromatography
MEMSsMicro-Electro-Mechanical Systems
GACGreen Analytical Chemistry
TCDThermal Conductivity Detector
FIDFlame Ionization Detector
SOAVSum of Odour Activity Values

References

  1. Brancher, M.; Griffiths, K.D.; Franco, D.; De Melo Lisboa, H. A review of odour impact criteria in selected countries around the world. Chemosphere 2017, 168, 1531–1570. [Google Scholar] [CrossRef] [PubMed]
  2. Milad, A.; Babalghaith, A.M.; Al-Sabaeei, A.M.; Dulaimi, A.; Ali, A.; Reddy, S.S.; Bilema, M.; Yusoff, N.I.M. A Comparative Review of Hot and Warm Mix Asphalt Technologies from Environmental and Economic Perspectives: Towards a Sustainable Asphalt Pavement. Int. J. Environ. Res. Public Health 2022, 19, 14863. [Google Scholar] [CrossRef]
  3. EN 13725:2003; UNI. Air Quality-Determination of Odour Concentration by Dynamic Olfactometry. Ente Italiano di Normazione, UNI: Minato City, Tokyo, 2003.
  4. Płotka-Wasylka, J.; Namieśnik, J. (Eds.) Green Analytical Chemistry: Past, Present and Perspectives. In Green Chemistry and Sustainable Technology; Springer: Singapore, 2019. [Google Scholar] [CrossRef]
  5. Pacenti, M.; Dugheri, S.; Villanelli, F.; Bartolucci, G.; Calamai, L.; Boccalon, P.; Arcangeli, G.; Vecchione, F.; Alessi, P.; Kikic, I.; et al. Determination of organic acids in urine by solid-phase microextraction and gas chromatography–ion trap tandem mass spectrometry previous “in sample” derivatization with trimethyloxonium tetrafluoroborate. Biomed. Chromatogr. 2008, 22, 1155–1163. [Google Scholar] [CrossRef] [PubMed]
  6. Terry, S.C.; Jerman, J.H.; Angell, J.B. A gas chromatographic air analyzer fabricated on a silicon wafer. IEEE Trans. Electron Devices 1979, 26, 1880–1886. [Google Scholar] [CrossRef]
  7. Wang, J.; Nuñovero, N.; Lin, Z.; Nidetz, R.; Buggaveeti, S.; Zhan, C.; Kurabayashi, K.; Steinecker, W.; Zellers, E. A Wearable MEMS Gas Chromatograph for Multi-Vapor Determinations. Procedia Eng. 2016, 168, 1398–1401. [Google Scholar] [CrossRef]
  8. Mason, F.; Charles, G. Microfabricated Gas Phase Chemical Analysis Systems. 1999. Available online: https://www.osti.gov/biblio/14040 (accessed on 28 March 2025).
  9. Lahlou, H.; Vilanova, X.; Correig, X. Gas phase micro-preconcentrators for benzene monitoring: A review. Sens. Actuators B Chem. 2013, 176, 198–210. [Google Scholar] [CrossRef]
  10. Bryant-Genevier, J.; Zellers, E.T. Toward a microfabricated preconcentrator-focuser for a wearable micro-scale gas chromatograph. J. Chromatogr. A 2015, 1422, 299–309. [Google Scholar] [CrossRef]
  11. Yeom, J.; Field, C.R.; Bae, B.; I Masel, R.; A Shannon, M. The design, fabrication and characterization of a silicon microheater for an integrated MEMS gas preconcentrator. J. Micromech. Microeng. 2008, 18, 125001. [Google Scholar] [CrossRef]
  12. Azzouz, I.; Bachari, K. MEMS Devices for Miniaturized Gas Chromatography. In MEMS Sensors—Design and Application; Yellampalli, S., Ed.; InTech: Haryana, India, 2018. [Google Scholar] [CrossRef]
  13. Brancaleoni, E.; Scovaventi, M.; Frattoni, M.; Mabilia, R.; Ciccioli, P. Novel family of multi-layer cartridges filled with a new carbon adsorbent for the quantitative determination of volatile organic compounds in the atmosphere. J. Chromatogr. A 1999, 845, 317–328. [Google Scholar] [CrossRef]
  14. Pollack, A.J.; Gordon, S.M.; Moschandreas, D.J. Evaluation of Portable Multisorbent Air Samplers for Use with an Automated Multitube Analyzer; US Environmental Protection Agency: Washington, DC, USA, 1993. [Google Scholar]
  15. Matisová, E.; Škrabáková, S. Carbon sorbents and their utilization for the preconcentration of organic pollutants in environmental samples. J. Chromatogr. A 1995, 707, 145–179. [Google Scholar] [CrossRef]
  16. Hewitt, C.N. (Ed.) Reactive Hydrocarbons in the Atmosphere; Academic Press: San Diego, CA, USA, 1999. [Google Scholar]
  17. Larsen, B.; Bomboi-Mingarro, T.; Brancaleoni, E.; Calogirou, A.; Cecinato, A.; Coeur, C.; Chatzinestis, I.; Duane, M.; Frattoni, M.; Fugit, J.-L.; et al. Sampling and analysis of terpenes in air. An interlaboratory comparison. Atmos. Environ. 1997, 31, 35–49. [Google Scholar] [CrossRef]
  18. Sun, J.; Guan, F.; Zhu, X.; Ning, Z.; Ma, T.; Liu, J.; Deng, T. Micro-fabricated packed gas chromatography column based on laser etching technology. J. Chromatogr. A 2016, 1429, 311–316. [Google Scholar] [CrossRef] [PubMed]
  19. Narayanan, S.; Agah, M. Fabrication and Characterization of a Suspended TCD Integrated with a Gas Separation Column. J. Microelectromech. Syst. 2013, 22, 1166–1173. [Google Scholar] [CrossRef]
  20. Yang, J.-C.; Dutta, P.K. High temperature amperometric total NOx sensors with platinum-loaded zeolite Y electrodes. Sens. Actuators B Chem. 2006, 123, 929–936. [Google Scholar] [CrossRef]
  21. Lorenzelli, L.; Benvenuto, A.; Adami, A.; Guarnieri, V.; Margesin, B.; Mulloni, V.; Vincenzi, D. Development of a gas chromatography silicon-based microsystem in clinical diagnostics. Biosens. Bioelectron. 2005, 20, 1968–1976. [Google Scholar] [CrossRef]
  22. Li, M.W.-H.; Ghosh, A.; Venkatasubramanian, A.; Sharma, R.; Huang, X.; Fan, X. High-Sensitivity Micro-Gas Chromatograph–Photoionization Detector for Trace Vapor Detection. ACS Sens. 2021, 6, 2348–2355. [Google Scholar] [CrossRef]
  23. Rezende, G.C.; Le Calvé, S.; Brandner, J.J.; Newport, D. Micro photoionization detectors. Sens. Actuators B Chem. 2019, 287, 86–94. [Google Scholar] [CrossRef]
  24. Sun, J.; Xue, N.; Wang, W.; Wang, H.; Liu, C.; Ma, T.; Li, T.; Tan, T. Compact prototype GC-PID system integrated with micro PC and micro GC column. J. Micromech. Microeng. 2018, 29, 035008. [Google Scholar] [CrossRef]
  25. Sun, J.; Cui, D.; Guan, F.; Zhang, L.; Chen, X.; Li, H. Detection biomarkers of lung cancer using mini-GC-PID system integrated with micro GC column and micro pre-concentrator. Nanoscale Res. Lett. 2014, 9, 576. [Google Scholar] [CrossRef]
  26. Sun, J.H.; Guan, F.Y.; Zhu, X.F.; Ning, Z.W.; Ma, T.J. The Integrated Mini GC-PID System for Monitoring Air Pollution. In Current Air Quality Issues; Nejadkoorki, F., Ed.; InTech: Haryana, India, 2015. [Google Scholar] [CrossRef]
  27. Pang, X.; Li, W.; Wang, S.; Wu, Z.; Sun, S.; Lyu, Y.; Chen, D.; Li, H. Application of homemade portable gas chromatography coupled to photoionization detector for the detection of volatile organic compounds in an industrial park. J. Chromatogr. A 2023, 1704, 464089. [Google Scholar] [CrossRef]
  28. Chen, F.-Y.; Chang, W.-C.; Jian, R.-S.; Lu, C.-J. Novel Gas Chromatographic Detector Utilizing the Localized Surface Plasmon Resonance of a Gold Nanoparticle Monolayer inside a Glass Capillary. Anal. Chem. 2014, 86, 5257–5264. [Google Scholar] [CrossRef] [PubMed]
  29. Shopova, S.I.; White, I.M.; Sun, Y.; Zhu, H.; Fan, X.; Frye-Mason, G.; Thompson, A.; Ja, S.-J. On-Column Micro Gas Chromatography Detection with Capillary-Based Optical Ring Resonators. Anal. Chem. 2008, 80, 2232–2238. [Google Scholar] [CrossRef]
  30. Reddy, K.; Guo, Y.; Liu, J.; Lee, W.; Oo, M.K.K.; Fan, X. Rapid, sensitive, and multiplexed on-chip optical sensors for micro-gas chromatography. Lab A Chip 2012, 12, 901–905. [Google Scholar] [CrossRef]
  31. Moriaux, A.-L.; Vallon, R.; Parvitte, B.; Zeninari, V.; Liger-Belair, G.; Cilindre, C. Monitoring gas-phase CO2 in the headspace of champagne glasses through combined diode laser spectrometry and micro-gas chromatography analysis. Food Chem. 2018, 264, 255–262. [Google Scholar] [CrossRef] [PubMed]
  32. Venkatasubramanian, A.; Sauer, V.T.K.; Roy, S.K.; Xia, M.; Wishart, D.S.; Hiebert, W.K. Nano-Optomechanical Systems for Gas Chromatography. Ano Lett. 2016, 16, 6975–6981. [Google Scholar] [CrossRef]
  33. Biswas, P.; Zhang, C.; Chen, Y.; Liu, Z.; Vaziri, S.; Zhou, W.; Sun, Y. A Portable Micro-Gas Chromatography with Integrated Photonic Crystal Slab Sensors on Chip. Biosensors 2021, 11, 326. [Google Scholar] [CrossRef] [PubMed]
  34. Zampolli, S.; Mengali, S.; Liberatore, N.; Elmi, I.; Masini, L.; Sanmartin, M.; Viola, R. A MEMS-Enabled Deployable Trace Chemical Sensor Based on Fast Gas-Chromatography and Quartz Enhanced Photoacousic Spectoscopy. Sensors 2019, 20, 120. [Google Scholar] [CrossRef]
  35. HSE. Manual Handling at Work—A Brief Guide. TSO London. 2020. Available online: https://www.hse.gov.uk/pubns/indg143.pdf (accessed on 16 March 2025).
  36. UNI ISO. MMC (Movimentazione Manuale Dei Carichi)—UNI ISO 11228-1:2022. 2022. Available online: https://www.certifico.com/sicurezza-lavoro/documenti-sicurezza/67-documenti-riservati-sicurezza/16255-mmc-iso-11228-1-2022 (accessed on 10 March 2025).
  37. Gałuszka, A.; Migaszewski, Z.M.; Namieśnik, J. Moving your laboratories to the field—Advantages and limitations of the use of field portable instruments in environmental sample analysis. Environ. Res. 2015, 140, 593–603. [Google Scholar] [CrossRef]
  38. Thermo Fisher Scientific. Thermo Scientific C2V-200 Micro GC. Available online: https://photos.labwrench.com/equipmentManuals/13023-5086.pdf (accessed on 10 March 2025).
  39. Regmi, B.P.; Agah, M. Micro Gas Chromatography: An Overview of Critical Components and Their Integration. Anal. Chem. 2018, 90, 13133–13150. [Google Scholar] [CrossRef]
  40. Paris, E.; Avino, P.; Guerriero, E.; Vincenti, B.; Palma, A.; Carnevale, M.; Benedetti, P.; Torre, M.; Gallucci, F. Activated Porous Carbon Fiber: New Adsorbent for Sampling and Analysis by Thermal Desorption of Siloxanes in Biogas and Biomethane. Int. J. Environ. Res. Public Health 2022, 19, 10890. [Google Scholar] [CrossRef]
  41. Voiculescu, I.; Zaghloul, M.; Narasimhan, N. Microfabricated chemical preconcentrators for gas-phase microanalytical detection systems. TrAC Trends Anal. Chem. 2008, 27, 327–343. [Google Scholar] [CrossRef]
  42. Abraham, J. International Conference on Harmonisation of Technical Requirements for Registration of Pharmaceuticals for Human Use. In Handbook of Transnational Economic Governance Regimes; Tietje, C., Brouder, A., Eds.; Brill|Nijhoff: Leiden, The Netherlands, 2010; pp. 1041–1053. ISBN 978-90-04-18156-4. [Google Scholar]
  43. Leardi, R.; Melzi, C.; Polotti, G. CAT (Chemometric Agile Tool). Available online: http://gruppochemiometria.it/index.php/software (accessed on 10 March 2025).
  44. Płotka-Wasylka, J. A new tool for the evaluation of the analytical procedure: Green Analytical Procedure Index. Talanta 2018, 181, 204–209. [Google Scholar] [CrossRef]
  45. Płotka-Wasylka, J. GAPI—Green Analytical Procedure Index. Available online: https://mostwiedzy.pl/en/justyna-plotka-wasylka,647762-1/gapi (accessed on 10 March 2025).
  46. Rothe, M.; Thomas, B. Aromastoffe des Brotes: Versuch einer Auswertung chemischer Geschmacksanalysen mit Hilfe des Schwellenwertes. Z Lebensm Unters Forch. 1963, 119, 302–310. [Google Scholar] [CrossRef]
  47. Nagata, Y. Measurement of odor threshold value Review of “Measurement of threshold value by tiriangle odor bag method Bull. Jap. Env. Sanit. Cent. No. 17. 1990” paper. J. Jpn. Assoc. Odor Environ. 2012, 43, 401–407. [Google Scholar] [CrossRef]
  48. Package “Mgcv”. 2023. Available online: https://cran.r-project.org/web/packages/mgcv/mgcv.pdf (accessed on 10 March 2025).
  49. Dugheri, S.; Cappelli, G.; Fanfani, N.; Squillaci, D.; Rapi, I.; Venturini, L.; Vita, C.; Gori, R.; Sirini, P.; Cipriano, D.; et al. Vacuum-Assisted MonoTrapTM Extraction for Volatile Organic Compounds (VOCs) Profiling from Hot Mix Asphalt. Molecules 2024, 29, 4943. [Google Scholar] [CrossRef] [PubMed]
  50. Zampolli, S.; Betti, P.; Elmi, I.; Dalcanale, E. A supramolecular approach to sub-ppb aromatic VOC detection in air. Chem. Commun. 2007, 2790–2792. [Google Scholar] [CrossRef]
  51. Rozzi, A.; Pedrini, A.; Pinalli, R.; Massera, C.; Elmi, I.; Zampolli, S.; Dalcanale, E. Tuning the conformational flexibility of quinoxaline cavitands for complexation at the gas–solid interface. Chem. Commun. 2022, 58, 7554–7557. [Google Scholar] [CrossRef]
  52. Zampolli, S.; Elmi, I.; Mancarella, F.; Betti, P.; Dalcanale, E.; Cardinali, G.; Severi, M. Real-time monitoring of sub-ppb concentrations of aromatic volatiles with a MEMS-enabled miniaturized gas-chromatograph. Sens. Actuators B Chem. 2009, 141, 322–328. [Google Scholar] [CrossRef]
  53. Bertani, F.; Riboni, N.; Bianchi, F.; Brancatelli, G.; Sterner, E.S.; Pinalli, R.; Geremia, S.; Swager, T.M.; Dalcanale, E. Triptycene-Roofed Quinoxaline Cavitands for the Supramolecular Detection of BTEX in Air. Chem.—A Eur. J. 2016, 22, 3312–3319. [Google Scholar] [CrossRef]
  54. Pacenti, M.; Dugheri, S.; Traldi, P.; Degli Esposti, F.; Perchiazzi, N.; Franchi, E.; Calamante, M.; Kikic, I.; Alessi, P.; Bonacchi, A.; et al. New Automated and High-Throughput Quantitative Analysis of Urinary Ketones by Multifiber Exchange-Solid Phase Microextraction Coupled to Fast Gas Chromatography/Negative Chemical-Electron Ionization/Mass Spectrometry. J. Anal. Methods Chem. 2010, 2010, 1–13. [Google Scholar] [CrossRef]
  55. Pacenti, M.; Dugheri, S.; Gagliano-Candela, R.; Strisciullo, G.; Franchi, E.; Degli Esposti, F.; Perchiazzi, N.; Boccalon, P.; Arcangeli, G.; Cupelli, V. Analysis of 2-Chloroacetophenone in air by multi-fiber solid-phase microextraction and fast gas chromatography-mass spectrometry. Acta Chromatogr. 2009, 21, 379–397. [Google Scholar] [CrossRef]
  56. Cimorelli, A.J.; Perry, S.G.; Venkatram, A.; Weil, J.C.; Paine, R.J.; Wilson, R.B.; Lee, R.F.; Peters, W.D.; Brode, R.W. AERMOD: A Dispersion Model for Industrial Source Applications. Part I: General Model Formulation and Boundary Layer Characterization. J. Appl. Meteorol. Clim. 2005, 44, 682–693. [Google Scholar] [CrossRef]
  57. Scire, J.S.; Stimaitis, D.G.; Yamartino, R.J. A User’s Guide for the CALPUFF Dispersion Model (Version 5). Earth Tech, Inc. 2000. Available online: https://www.calpuff.org/calpuff/download/CALPUFF_UsersGuide.pdf (accessed on 10 March 2025).
Figure 1. Pyxis GC in cabinet (a), instrument analytical core (b), and MEMS pre-concentrator (top) and GC separation column (bottom) (c).
Separations 12 00133 g001
Figure 2. Posterior predictive check graph shows that the obtained GAM approximates observed odour concentrations.
Separations 12 00133 g002
Figure 3. Response surfaces obtained for the models of the intensities of hexanal (y1), butanal (y2), and octanal (y3).
Separations 12 00133 g003
Figure 4. Overlapping of the contour plots, regarding the factors x2 and x4, obtained via computing the models for the intensities of hexanal (blue lines), butanal (black lines), and octanal (orange lines).
Separations 12 00133 g004
Figure 5. GAPI pictogram of the method.
Separations 12 00133 g005
Figure 6. Pyxis chromatogram with Carbograph 2SAP obtained from on-field sampling, with highlighted substances: butanal, butan-2-one, pentanal, hexanal, hexan-2-one, heptanal, heptan-3-one, and octanal.
Separations 12 00133 g006
Figure 7. Relationship between odour concentration and process temperature. A Generalized Additive Model (GAM) incorporating a spline-based smooth term was used to model the potentially non-monotonic influence of temperature on odour emissions. To assess the robustness and validity of the GAM fit, we compared it with a LOESS (Locally Estimated Scatterplot Smoothing) curve, which offers a flexible, assumption-free view of the data trend. The figure shows measured odour concentrations (black dots), the GAM fit (blue line with shaded 95% confidence interval), and the LOESS fit (black line). The convergence between the two curves confirms the appropriateness of the GAM’s non-linear formulation.
Separations 12 00133 g007
Figure 8. Estimated effect of the two covariates on the Y-axis is the partial effect of the variable (red line). On the X-axis is the variable. Shadow section (grey area) is the 95% level confidence interval band.
Separations 12 00133 g008
Figure 9. Observed odour concentration values (black dots) are confronted with predicted odour concentration values (red line).
Separations 12 00133 g009
Table 1. Summary of person-portable GC instruments available on the market. Including information about pre-concentration system, detector type, ruggedness, LOQ, dimensions, and manufacturer.
InstrumentPre-ConcentratorGC ColumnRuggedLOQDimensions (cm)Weight (kg)Producer
GC/MSTorion T-9NoneCapillaryRuggedppb-ppt38.1 × 39.4 × 22.914.5PerkinElmer Inc. (Hopkinton, MA, USA)
Link: PerkinElmer Inc. https://content.perkinelmer.com/library/prd-torion-t-9-portable-gcms.html
(28 March 2025)
HAPSITE ERNoneCapillary
(15 M, Rtx-1 MS, 0.25 mm × 0.1 µm)
Ruggedppm to-ppt46 × 43 × 1818INFICON (Bad Ragaz, Switzerland)
Link: https://www.inficon.com/en
(28 March 2025)
Griffin G510On-boardCapillaryRugged, classified asIP65ppb or less33.7 × 33.7 × 4016.3Teledyne FLIR LLC (Wilsonville, OR, USA)
Link: https://www.flir.it/
(28 March 2025)
EnviroprobeNoneCapillary
(es. DB-1, 5 m, 0.5 mm, 0.25 µm)
Ruggedppb15 × 12.7 × 1.71.3FemtoScan Corporation (Bountiful, UT, USA)
Link: http://www.femtoscan.com/index.htm
(28 March 2025)
GC/FIDNCMS 6300On-board
(low-temperature preconcentration)
CapillaryRugged0.5 ppbData not availableData not availableNutech Instruments (Richardson, TX, USA)
Link: https://www.nutechinst.com/
(28 March 2025)
PetroAlert® 9100NonePacked, micro-packed, or capillary columns; Specific to applicationRuggedppm13 × 48.26 × 4113.6AMETEK MOCON (Brooklyn Park, MN, USA)
Link: https://www.ametekmocon.com/
(28 March 2025)
GC/TCDMicro GC 990NoneCapillary
(WCOT, PLOT, micropacked)
RuggedWCOT 05 ppm;
PLOT 2 ppm
Micropacked 10 ppm
28.28 × 14.5 × 32.97.3
(15.6 cabined)
Agilent (Santa Clara, CA, USA)
Link: https://www.agilent.com/
(28 March 2025)
Micro GC FusionNoneCapillaryRugged1 ppm46.2 × 19.6 × 25.46.2INFICON (Bad Ragaz, Switzerland)
Link: https://www.inficon.com/en/products/chemical-detection-and-utility-monitoring/micro-gc-fusion-gas-analyzer
(28 March 2025)
DynamiQNoneMEMSRugged, classified as IP650.5 ppm28.9 × 12.2 × 25.815QMicro-Sensirion (Enschede, NL, USA)
Link: https://www.qmicro.com/about/
(28 March 2025)
I-Graph XNoneMEMSRugged1 ppm31 × 12 × 294.7I-GRAPHX GmbH (Reinbek, DE, USA)
Link:
https://www.i-graphx.com/
(28 March 2025)
DPS Micro-TCD GCNoneCapillaryRuggedppm20 × 15 × 108DPS Instruments Europe GmbH (Bad Honnef, DE, USA)
Link: https://www.dps-instruments.com/
(28 March 2025)
GC/PIDFROG-4000
VOCAM
On-boardMEMSRuggedsub-ppb25.4 × 19.1 × 372.2Defiant Technologies Inc (Albuquerque, NM, USA)
Link: https://www.defiant-tech.com/
(28 March 2025)
eGCSelective-trapCapillary (e.g., 0.53 mm × 10 m)Rugged0.5 ppb44.5 × 49.5 × 21.319.9ENMET (Ann Arbor, MI, USA)
Link: https://enmet.com/
(28 March 2025)
GC PIDSelective-trapCapillaryRugged<1 ppb36 × 30 × 157PAS Technology Deutschland GmbH (Magdala, DE, USA)
Link: http://www.pas-technologies.com/(11 Feburary 2025)
PyxisGCSelective-trapMEMSRugged0.01 ppb42 × 62 × 2119Pollution (Budrio, IT, USA)
Link: https://www.pollution.it/it/
(28 March 2025)
Baseline® 9200Selective-trapCapillaryRuggedsub-ppb13 × 48.26 × 56.913.6AMETEK MOCON (Brooklyn Park, MN, USA)
Link: https://www.ametekmocon.it/products/gaschromatographs/9200dualdetectorgc
(28 March 2025)
PID-AnalyzerNoneCapillaryData not availableppbData not availableData not availableIUT Technologies GmbH (Berlin, DE, USA)
Link: https://iut-technologies.de/
(28 March 2025)
NovaTest P300Selective-trapCapillaryRuggedsub-ppb47 × 35.7 × 17.610Nanova Environmental, Inc. (Columbia, MO, USA)
Link: https://nanovaenv.com/
(28 March 2025)
312 Portable GCSelective-trapCapillaryRuggedppb47.5 × 35 × 1912.2PID ANALYZERS, LLC (Sandwich, MA, USA) Link: https://hnu.com/
(28 March 2025)
GC 866
microVOC-Trap
Selective-trapCapillaryRuggedppt48.2 × 60.0 × 18.017Chromatotec® (Saint-André de Cubzac, France)
Link: https://chromatotec.com/
(28 March 2025)
Table 2. Concentration levels, reported in µg/m3 for each of the five calibration solutions.
CompoundLevel 1Level 2Level 3Level 4Level 5
Butanal02005007001000
Pentanal02005007001000
Hexanal02005007001000
Heptanal02005007001000
Octanal02005007001000
Butan-2-one0100300400600
Hexan-2-one0100300400700
Heptan-3-one0100300400700
Table 3. Experimental matrix with the corresponding experimental plan for MEMS preconcentrators.
Experimental MatrixExperimental Plan
Exp#x1x2x3x4Sampling Time
(x1)
Flow Rate Sampling
(x2)
Desorption Time
(x3)
Desorption Temperature
(x4)
10−1−1−150 s250 mL/min10 s120 °C
2110−1100 s450 mL/min40 s120 °C
3−101−125 s350 mL/min80 s120 °C
410−10100 s350 mL/min10 s140 °C
5−1−10025 s250 mL/min40 s140 °C
6011050 s450 mL/min80 s140 °C
7−11−1125 s450 mL/min10 s180 °C
8000150 s350 mL/min40 s180 °C
91−111100 s250 mL/min80 s180 °C
Table 4. Substances, information about IE and eV, and limits of quantitation (LOQ) in µg/m3 for each compound.
Chemical Name CASIE, eVLamp Type (RF)LOQ
10.6 eVµg/m3
Butanal123-72-89.861.75.0
Pentanal110-62-39.741.55.3
Hexanal66-25-19.721.24.9
Heptanal111-71-7N.D.N.D.5.4
Octanal124-13-0N.D.1.105.8
Butan-2-one78-93-39.510.962.8
Hexan-2-one591-78-69.340.83.3
Heptan-3-one106-35-49.020.733.4
Table 5. Descriptive statistics of substances identified at the chimney level.
ButanalButan-2-OnePentanalHexanal
μg/m3
Average227.62117.39129.97153.01
Dev. Std113.9158.5869.2885.23
Median224.28115.91123.99140.73
Hexan-2-oneHeptanalHeptan-3-oneOctanal
μg/m3
Average62.98105.752.7946.27
Dev. Std41.9474.0157.1534.88
Median45.0873.0419.4642.1
Disclaimer/Publisher’s Note: The statements, opinions and data contained in all publications are solely those of the individual author(s) and contributor(s) and not of MDPI and/or the editor(s). MDPI and/or the editor(s) disclaim responsibility for any injury to people or property resulting from any ideas, methods, instructions or products referred to in the content.

