Article

Rapid Determination of Nimesulide by Capillary Zone Electrophoresis in Various Pharmaceutical Formulations

Department of Chemical Drugs, Faculty of Pharmacy, Masaryk University Brno, Palackého 1946/1, CZ-612 42 Brno, Czech Republic
*
Author to whom correspondence should be addressed.
Separations 2025, 12(5), 132; https://doi.org/10.3390/separations12050132
Submission received: 28 April 2025 / Revised: 13 May 2025 / Accepted: 15 May 2025 / Published: 19 May 2025
(This article belongs to the Section Analysis of Natural Products and Pharmaceuticals)

Abstract

:
Nimesulide is a popular non-steroidal anti-inflammatory drug (NSAID) and a cyclooxygenase-2 inhibitor available in more than 50 countries worldwide. A rapid and simple method for nimesulide determination is presented. Experimental parameters based on a previously published work were revised and adopted into a method with significantly better performance: pH was shifted from 8.10 to 9.25, borate background electrolyte concentration from 10 to 60 mM—resulting in a run time less than 4 min, and number of theoretical plates greater than 100,000. The method was validated and applied for the determination of nimesulide in three formulations with the active substance of nimesulide: tablets, gel, and powder (in sachets for oral suspension). Also, the tablets were tested for uniformity of content of single-dose preparations according to Ph. Eur.

Graphical Abstract

1. Introduction

(N-(4-nitro-2-phenoxyphenyl)-methane sulfonamide) (NIM) (Figure 1) is a non-steroidal sulfonamide and an anti-inflammatory drug (NSAID), a relatively selective cyclooxygenase-2 (COX-2) inhibitor and, therefore, also has analgesic and antipyretic activities.

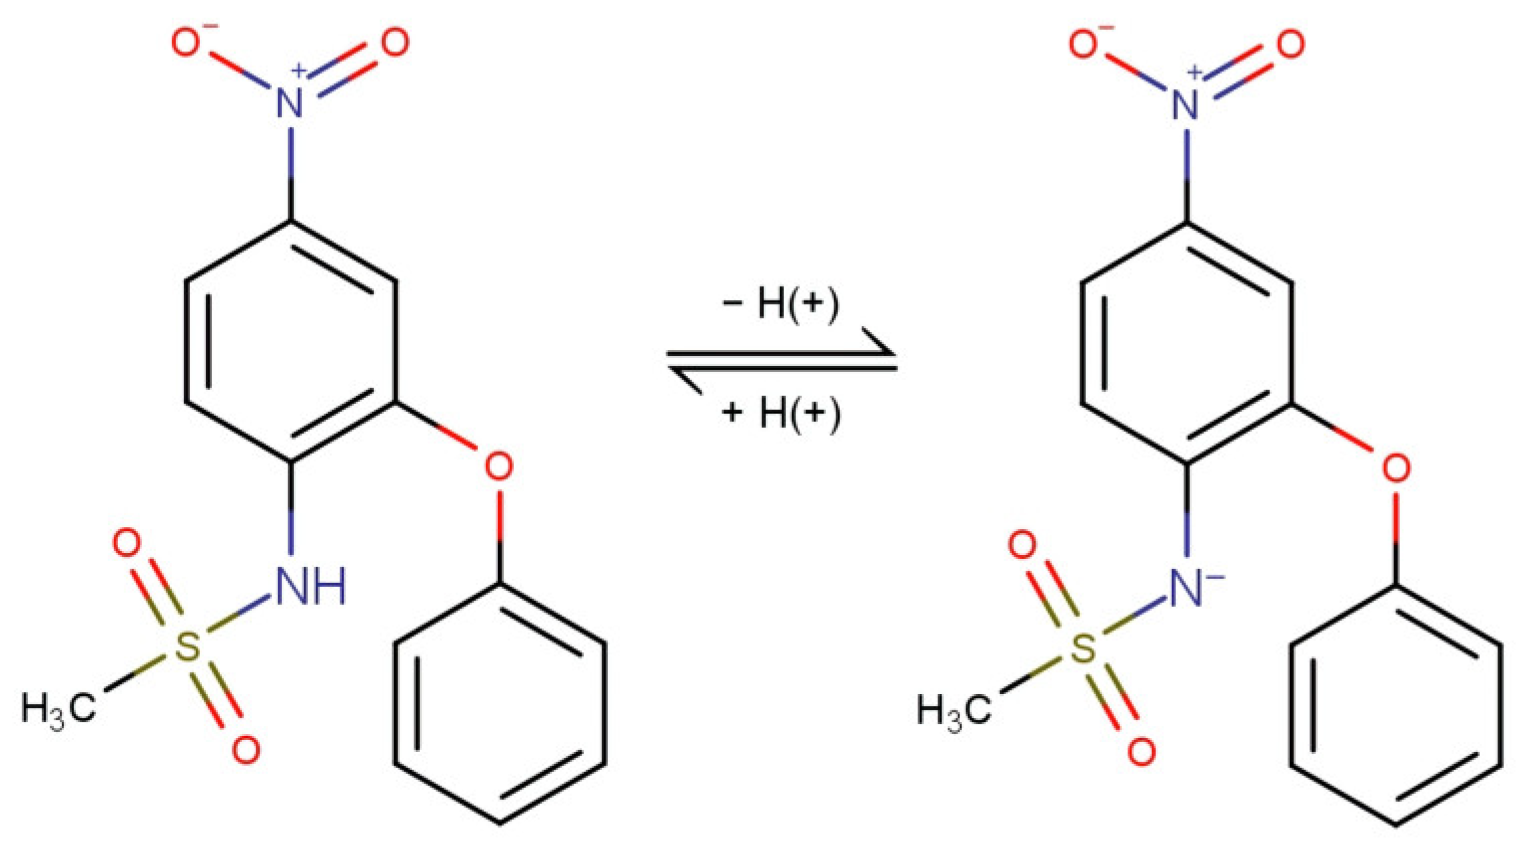
1.1. Nimesulide: An Important NSAID

NIM is an important medication with a unique pharmaceutical profile that no other COX-2 inhibitor can fully match. It holds significant potential for discovering additional therapeutic applications. NIM has mainly potent analgesic, anti-inflammatory and antipyretic properties, and it is the second-line treatment for acute pain, osteoarthritis, and primary dysmenorrhea. NIM is a key component of numerous drugs, e.g., Celecoxib, Parecoxib, Etoxib, Meloxicam, and others on the market. Even though these drugs are classified under the same group, they are different in their pharmacokinetic and pharmacodynamic profiles [1]. When administered in the recommended dosage, NIM demonstrates a low incidence of side effects and better tolerance than other NSAIDs, such as diclofenac, ketoprofen, naproxen, and piroxicam [2]. A comparison of therapeutic indications among some COX-2-selective inhibitors with NIM can be found in [3].
NIM exhibits the fastest onset for pain suppression among oral NSAIDs. Although NIM has safety concerns due to drug-induced liver injury [4], recent, comprehensive, new epidemiological data supported by clinical insights prove it is highly effective in treating several forms of acute pain with an acute inflammatory component, like primary dysmenorrhea. This provides more evidence of the profitable benefit-over-risk profile of NIM [5]. After reviewing a European Medicines Agency (EMA) referral from 2004 [6], the Committee concluded in 2012 [7] that the benefits of systemic formulations of NIM still outweigh their risks, provided that these medicines are restricted to minimize the risk of patients developing liver problems. To this effect, the Committee recommended that treatment duration should be limited to a maximum of 15 days (packs were also limited to a two-week supply), that NIM should be restricted to second-line treatment, and that doctors should be clearly informed about the risk.
NIM was first licensed in Switzerland in 1980, and its production commenced in 1985. Today, NIM is sold in over 50 countries worldwide, including South and Central America, China, India, and Southeast Asian countries under trade names such as Aulin, Mesulid, Nimed, and others [8]. In Europe, NIM is nationally authorized in 10 EU Member States: Austria, Belgium, Finland, France, Greece, Ireland, Italy, Luxembourg, Portugal, and Spain. However, due to hepatic toxicity and considering the relatively non-serious conditions for which NIM is indicated, as well as the existence of numerous alternative treatments, the Committee for Medicinal Products for Humans in EMA withdrew all 200 mg pharmaceutical formulations and restricted the daily dose to 100 mg twice daily. NIM continued to raise some concerns, and in 2007, Singapore also decided to withdraw NIM from the market [1,2,6,9]. It is noteworthy that Nimesil was observed to be sold on online platforms without a prescription. Despite its unapproved status in the UK and its prescription-only classification in Belgium, these products are accessible through platforms like British Amazon.co.uk [10] and Belgian Amazon.be [11]. This raises concerns about gaps in regulatory enforcement and oversight of digital pharmaceutical sales.
NIM is available in various dosage forms and combinations [12], including non-coated, coated, soluble, and effervescent tablets, capsules, hard capsules, powder or granules for oral suspension, topical gels, topical sprays, and suppositories. NIM is also available in combination with other active ingredients, such as Capsaicin (for topical use as an anti-inflammatory agent), Lidocaine (for topical use as an anesthetic), or Thiocolchicoside (for topical use as a muscle relaxant).
All these findings (together with a general need of monitoring of biologically active substances in clinical samples [13]) support the need for reliable analytical methods, such as the one developed in this study, to assess the quality and authenticity of nimesulide-containing medications, particularly those distributed through unregulated online channels. This paper aims to enhance the current determination method for nimesulide, streamlining the process for a rapid and simple separation method.

1.2. Analytical Methods for Nimesulide Determination

Various analytical methods are employed to determine NIM in drugs and biological samples, including separation techniques (approximately 65% of articles), spectrophotometric methods (UV–Vis, approximately 26% of articles), and electroanalytical methods (approximately 9% of articles), as reviewed by Starek and Krzek [14]. The most common analytical technique for NIM determination is high-performance liquid chromatography (HPLC) with spectrophotometric, electrochemical, or mass spectrometry (MS) detection. In the European Pharmacopoeia [15] and also in the Brazilian Pharmacopoeia [16], potentiometric titration (alkalimetry with 0.1 M NaOH) is recommended.
In the European Pharmacopoeia, photometry is recommended for testing the purity of NIM in acetone at 450 nm [15]. In the Brazilian Pharmacopeia [16], UV–Vis Spectrophotometry is recommended for tablet and capsule formulations as an alternative to potentiometry for an assay (IF264-00). The content of NIM in tablet dosage form or capsule dosage form has also been determined by photometry in 0.01 M NaOH [17]. Spectrophotometric methods have also been frequently used after derivatization to analyze NIM [14].
For quality control of pharmaceutical formulations, HPLC is one of the most widely applied analytical techniques for the assay of NIM. HPLC with UV detection is mainly used with C18 columns. There are reports of applications for determining NIM in real-life bio samples, such as in rat plasma, cerebrospinal fluid, and brain tissue. The experiment involved treating rats with NIM and hydroxy nimesulide. Then, the rat’s plasma, cerebrospinal fluids and brain tissues were extracted to quantify NIM and hydroxy-nimesulide with an MS detection [18]. Panusa et al. [19] have developed an HPLC-separation method combined with UV and ESI-MS (HPLC-ESI-MS) detection to analyze several NSAIDs, incl. nimesulide in different homeopathic formulations, including solutions, suppositories, tablets, mother tinctures, creams, and granules. The proposed reason for using HPLC-ESI-MS is due to rapid and comprehensive screening detections of the different natural remedy formulations of NSAIDs. For HPLC conditions, the mobile phase was a mixture of acetonitrile and water with 0.1% acetic acid, adjusted to pH 3.16 with a gradient elution. UV detection was conducted at a wavelength of 245 nm, and the NIM retention time was 22.7 min.

Capillary Electrophoresis (CE)

The advantages of capillary electrophoresis include high separation efficiency, resolution, rapid method development, simplicity, unique selectivity, and low sample consumption. Additionally, the CE method is compatible with automation, increasing its utility [20]. These advantages make CE a versatile and efficient choice for pharmaceutical enantiomeric separations [21].
Micellar Electrokinetic Capillary Chromatography (MEKC) was also used to determine nimesulide. Measurements were taken using a fused silica capillary with a 50 μm internal diameter and 56 cm length. The background electrolyte (BGE) is a mixture of 35 mM borate buffer and 35 mM anionic detergent (SDS) at pH 9.75 with addition of acetonitrile 5% (v/v). The analyte was detected at 234 nm using a Diode Array Detector [22].
Another MEKC analytical procedure used to determine NIM was created by Zacharis et al. [23] utilizing an uncoated fused silica capillary with a 50 μm internal diameter and a total length of 57 cm. The system operated at 25 °C. Separations were conducted with an applied voltage of +25 kV. UV absorption was detected at 280 nm.
Capillary zone electrophoresis is one of the most utilized modes for analyzing NSAIDS. Some methods and procedures have also been developed for NIM determination by CZE: Frequently used buffers were also mentioned, including borate, acetate, phosphate, and tris-(hydroxymethyl)-aminomethane, within the pH range of 7–9. Sometimes, aqueous or non-aqueous BGE can also be used as a buffer.
Chen et al. [24] used an uncoated fused silica capillary with a 50 μm internal diameter and a total length of 70 cm. The separation was performed using a running buffer of 60 mmol/L borate at pH 8.5, with 13% (v/v) methanol as cosolvent. The electrophoretic separation was performed at a constant temperature of 25 °C, with an applied voltage of +20 kV. UV detection was performed at 200 nm. The time of the analysis was 16 min.
Dogrukol-Ak et al. [25] developed a CZE method for determining nimesulide in pharmaceutical tablets and serum. The technique utilized a fused silica capillary with a BGE of 10 mM borate buffer at pH 8.1, containing 10% ethanol with an applied voltage of +30 kV. This method, with a run time of over 10 min, was selected as the initial condition for this experiment.
We chose these starting conditions, significantly improved the method performance and validated some basic analytical characteristics on an Agilent HPCE model G1600 equipped with a DAD detector. Then, we applied the improved method to three different formulations available on the market to determine the average content of NIM in Aulin non-coated tablets, Aulin topical gel and to perform the uniformity content test (Ph. Eur) on sachets of Nimesil oral suspension.

2. Materials and Methods

2.1. Chemicals and Instruments

Nimesulide, methanol (HPLC grade), and ethanol (HPLC grade) were purchased from Sigma-Aldrich (St. Louis, MO, USA); boric acid and sodium tetraborate were from Lachema (Lachema, Brno, Czech Republic). Mesityl oxide was purchased from Fluka (Buchs, Switzerland); salicylic acid, sodium salicylate, and acetone were from Lach:ner (Neratovice, Czech Republic).
Experiments were conducted on a CZE model G1600 of Agilent CE 3D system (Agilent Technologies, Waldbronn, Germany) equipped with a DAD detector covering wavelengths from 190 to 600 nm. The high voltage can be set up to +30 kV, data output and system control are managed via Chemstation software, version B04.03.
Two untreated fused silica capillaries were used with ID 75 or 50 μm, both with total lengths of 33 cm, and effective lengths of 23.5 cm.

2.2. Samples

The following samples in Table 1 were analyzed by the optimized method.

3. Results and Discussion

3.1. Method Development

Our method for nimesulide determination was based on the CZE method described by Dogrukol-Ak et al. [25]. The authors designed their method for nimesulide in pharmaceutical tablet formulations and serum. They used the Spectrophoresis 100 system with a Spectra FOCUS ultraviolet–visible detector (Thermo Separation Products, San Jose, CA, USA) controlled by a PC 1000 software (Version 2.6). Their setup included a fused silica capillary tube (Phenomenex, Torrance, CA, USA) with an inner diameter of 75 µm, a total length of 87.5 cm, and a length to the detector of 57.5 cm. In the method, they used 10 mM borate buffer containing 10% ethanol at pH 8.1 as BGE and applied a voltage of +30 kV. Sample injection was performed for 1 s via vacuum. Salicylic acid (SA) served as an internal standard; the detection was performed at 200 nm. Nimesulide and the internal standard exhibited average migration times of 7.2 min (RSD = 0.75%) and 10.4 min (RSD = 0.91%), respectively. The limit of detection (S/N = 3) for nimesulide was 2.2 × 10⁻⁶ M, while the limit of quantitation (S/N = 10) was reported as 6.7 × 10⁻⁶ M. This method was applied to Mesulid tablet formulations, each containing 100 mg of NIM.
Here, similarly to the original paper, the capillary ID was chosen as 75 µm but with a shorter length of 33/24.5 cm. The applied voltage +12 kV was adjusted according to the capillary shortened length (keeping the same potential gradient); the injection time was carried out for 1 s at 50 mbar, and DAD detection was set at 200 nm. NIM and SA as an internal standard were injected (concentration 0.5 mg/mL), and the resolution between these two compounds, NIM-SA, was evaluated.

3.1.1. BGE Optimization

To improve the separation system performance, we tested various pH, concentrations of BGE, and the applied voltage. Although ethanol as an additive was originally used by Dogrukol-Ak et al. [25], no noticeable difference was observed between using 10% ethanol and 10% methanol. Therefore, methanol was chosen for the starting experiments.
Initially, boric acid was selected as the buffering agent (BGE), similar to the original paper. With pH adjustments made by 0.1 M NaOH or 0.5 M HCl, resp., in a pH range of 7.5–9.0 with buffer concentrations of 5 or 20 mM, the BGE was tested to map the migration behavior and compare it to the initial conditions. Figure 2 shows the results.
The dashed line with full squares in Figure 2 shows that at 5 mM borate buffer, both the parameters remained practically constant across the pH range; resolution NIM–SA was around 4 (right y-axis); and efficiency was around 6000 (the right y-axis). Such low efficiency suggests that the conditions across all tested pH levels does not provide an optimum for separation. The solid line with open circles in Figure 2 evaluates the relationship in a 20 mM borate buffer (with 10% methanol) between NIM efficiency and resolution NIM-SA across pH levels of 7.5, 8.0, 8.5, and 9.0. The efficiency trace N (full circles, left y-axis) exhibits a sharp increase at higher pH 8.5 and 9.0, with the number of theoretical plates increasing significantly from 5000 to 16,000. The highest resolution is achieved at pH 9.0 (up to 14), whereas the resolution across all measured pH levels 7.5–9.0 with the 5 mM buffer remains consistently between 4–5.
The results shown in Figure 2 suggest that one should increase pH and buffer concentration to reach better separation. Higher borate concentrations would also increase the buffer capacity: it is well known that buffer capacity is maximized at pH = pKa, so one may expect the highest buffer capacity of borate buffer at its pKa (pKa = 9.25) rather than at pH = 8.1.
Further evaluation of the experiments at 5 mM BGE shows that electroosmotic flow (EOF) mobility was around +65 × 10−9 m2/Vs, effective electrophoretic mobility was around −20 × 10−9 m2/Vs in the whole pH range; for 20 mM BGE, EOF mobility exhibits a slight decrease from +70 to +50 × 10−9 m2/Vs across the pH range, while the effective electrophoretic mobility remains constant around −20 × 10−9 m2/Vs. The effective mobility keeps practically constant, perhaps due to borate complexation of NIM.
Additional experiments were focused on the methanol addition to the BGE. Usually, methanol is added to BGE when analyzing sparingly water-soluble compounds. During our experiments, we noted that methanol decreases the current (due to lower conductivity of BGE), but also contributes to peak tailing. Consequently, it was omitted in the following experiments to improve efficiency. Further, to enhance Joule heat dissipation and improve efficiency, the 75 µm capillary was replaced with a 50 µm capillary (of the same length 33/24.5 cm). Finally, the boric acid buffer was replaced with a tetraborate buffer (prepared from sodium tetraborate decahydrate). The advantage of sodium tetraborate over boric acid is that sodium tetraborate buffer keeps pH 9.25 after dissolution which eliminates a time-consuming step of pH adjustment by titration and improves the method robustness.
Therefore, sodium tetraborate buffer at pH 9.25 (not adjusted, no methanol addition) of concentrations ranging from 2.5 mM to 25 mM (equivalent to 10–100 mM borate) was selected for subsequent experiments. The following series of experiments were conducted to evaluate resolution, peak area repeatability, and efficiency to further determine the optimal experimental conditions. Experiments were performed at four different applied voltages of +8, +12, +16, and +20 kV. Several evaluation parameters were calculated, including resolution between NIM and SA, efficiency of NIM, and repeatability of peak area ratio (ANIM/ASA).

3.1.2. Resolution Rs and Efficiency N

Since it was observed that dependencies Rs or N vs. voltage (+8/+12/+16/+20 kV) at a given BGE concentration exhibited more or less a monotonous course (they were constant or slightly decreasing with increasing voltage), in Figure 3 there are plotted graphs of resolution Rs and efficiency N vs. BGE concentration only at +12 kV where the dependencies Rs or N vs. voltage reached the highest values—graphs at other voltages would look similar.
The dashed line with open squares (right y-axis) in Figure 3 demonstrates the resolution of NIM–SA under varying BGE concentrations of borate buffer (10–100 mM). Although resolution higher than 2 is usually sufficient for separation of closely migrated analytes, here a higher resolution could potentially prevent an overlap of contingent peaks (e.g., from a sample matrix) and the course is also useful for comparison: one can see that the resolution is maximized for 60–100 mM borate buffer. This, again, proves that the higher buffer concentration is beneficial for the separation.
Figure 3 (solid line, close circles, left axis) clearly shows that observed efficiency of NIM peaks for BGE concentrations between (10 mM and 100 mM). One can see that the maximum efficiency was achieved at 60–80 mM. At 10 mM and 20 mM, the number of theoretical plates is around 30,000; the maximum of almost 120,000 is reached at 60–80 mM. It is noticeable that the highest BGE concentration (100 mM) exhibited a significant decrease, perhaps due to extensive Joule heat. Based on this graph, 60 mM was chosen as the optimum for the highest efficiency.

3.1.3. Peak Area Repeatability

The role of an internal standard in CZE is to improve hydrodynamic injection repeatability and, thus, precision. Then, the y-axis of a calibration plot registers a ratio of the analyte’s peak area to the internal standard’s peak area. Therefore, the relative standard deviation (RSD) of peak area ratios for repeated experiments with NIM and SA (area of NIM/area of SA) was calculated to evaluate the method precision. The experiments were carried out at different buffer concentrations of 10–100 mM, across the voltage range of +8 kV, +12 kV, +16 kV, and +20 kV. It was observed that concentrations 10–60 mM exhibit RSDs of 1–2%, i.e., consistently low RSD values across all tested voltages which came from randomness influence (experimental random error). However, 100 mM buffer exhibited a significant increase in RSD, with an increase exceeding 15% at +12 kV. Although the RSD then decreased at higher voltages, it still remained above 10%, indicating lower repeatability at this buffer concentration. This behavior was likely due to excessive current generation and Joule heating due to high ionic strength, which adversely affect separation repeatability.
These results demonstrate that 60 mM buffer concentration achieved superior resolution and efficiency while maintaining stable peak area ratios at pH = 9.25 and high buffer capacity. These findings led to the selection of 60 mM buffer concentration as the optimal condition for following experiments.

3.1.4. Voltage Optimization

The number of theoretical plates, or efficiency, in capillary electrophoresis is directly proportional to the voltage applied. However, high currents in electrophoretic systems can lead to excessive Joule heat and inefficient dissipation within the capillary causing convectional flow that disrupts sample zones and reduces the efficiency. Therefore, the voltage selected (in combination with the buffer concentration) should optimized. Optimal voltage was assessed using an Ohm’s law plot, which relates the current observed as a function of applied voltage. The plot evaluates the effects of Joule heating and system stability during electrophoresis. A linear relationship in the plot indicates a stable electrolyte behavior, i.e., when the current linearly proportional to the voltage applied. The Ohm’s law plot experiments were conducted by recording the current at continuously varying voltages (5–25 kV) with a buffer concentration of 60 mM at pH 9.25. It was found that voltage of +12 kV was the highest where the dependence current vs. voltage is linear with a current of 25 µA.

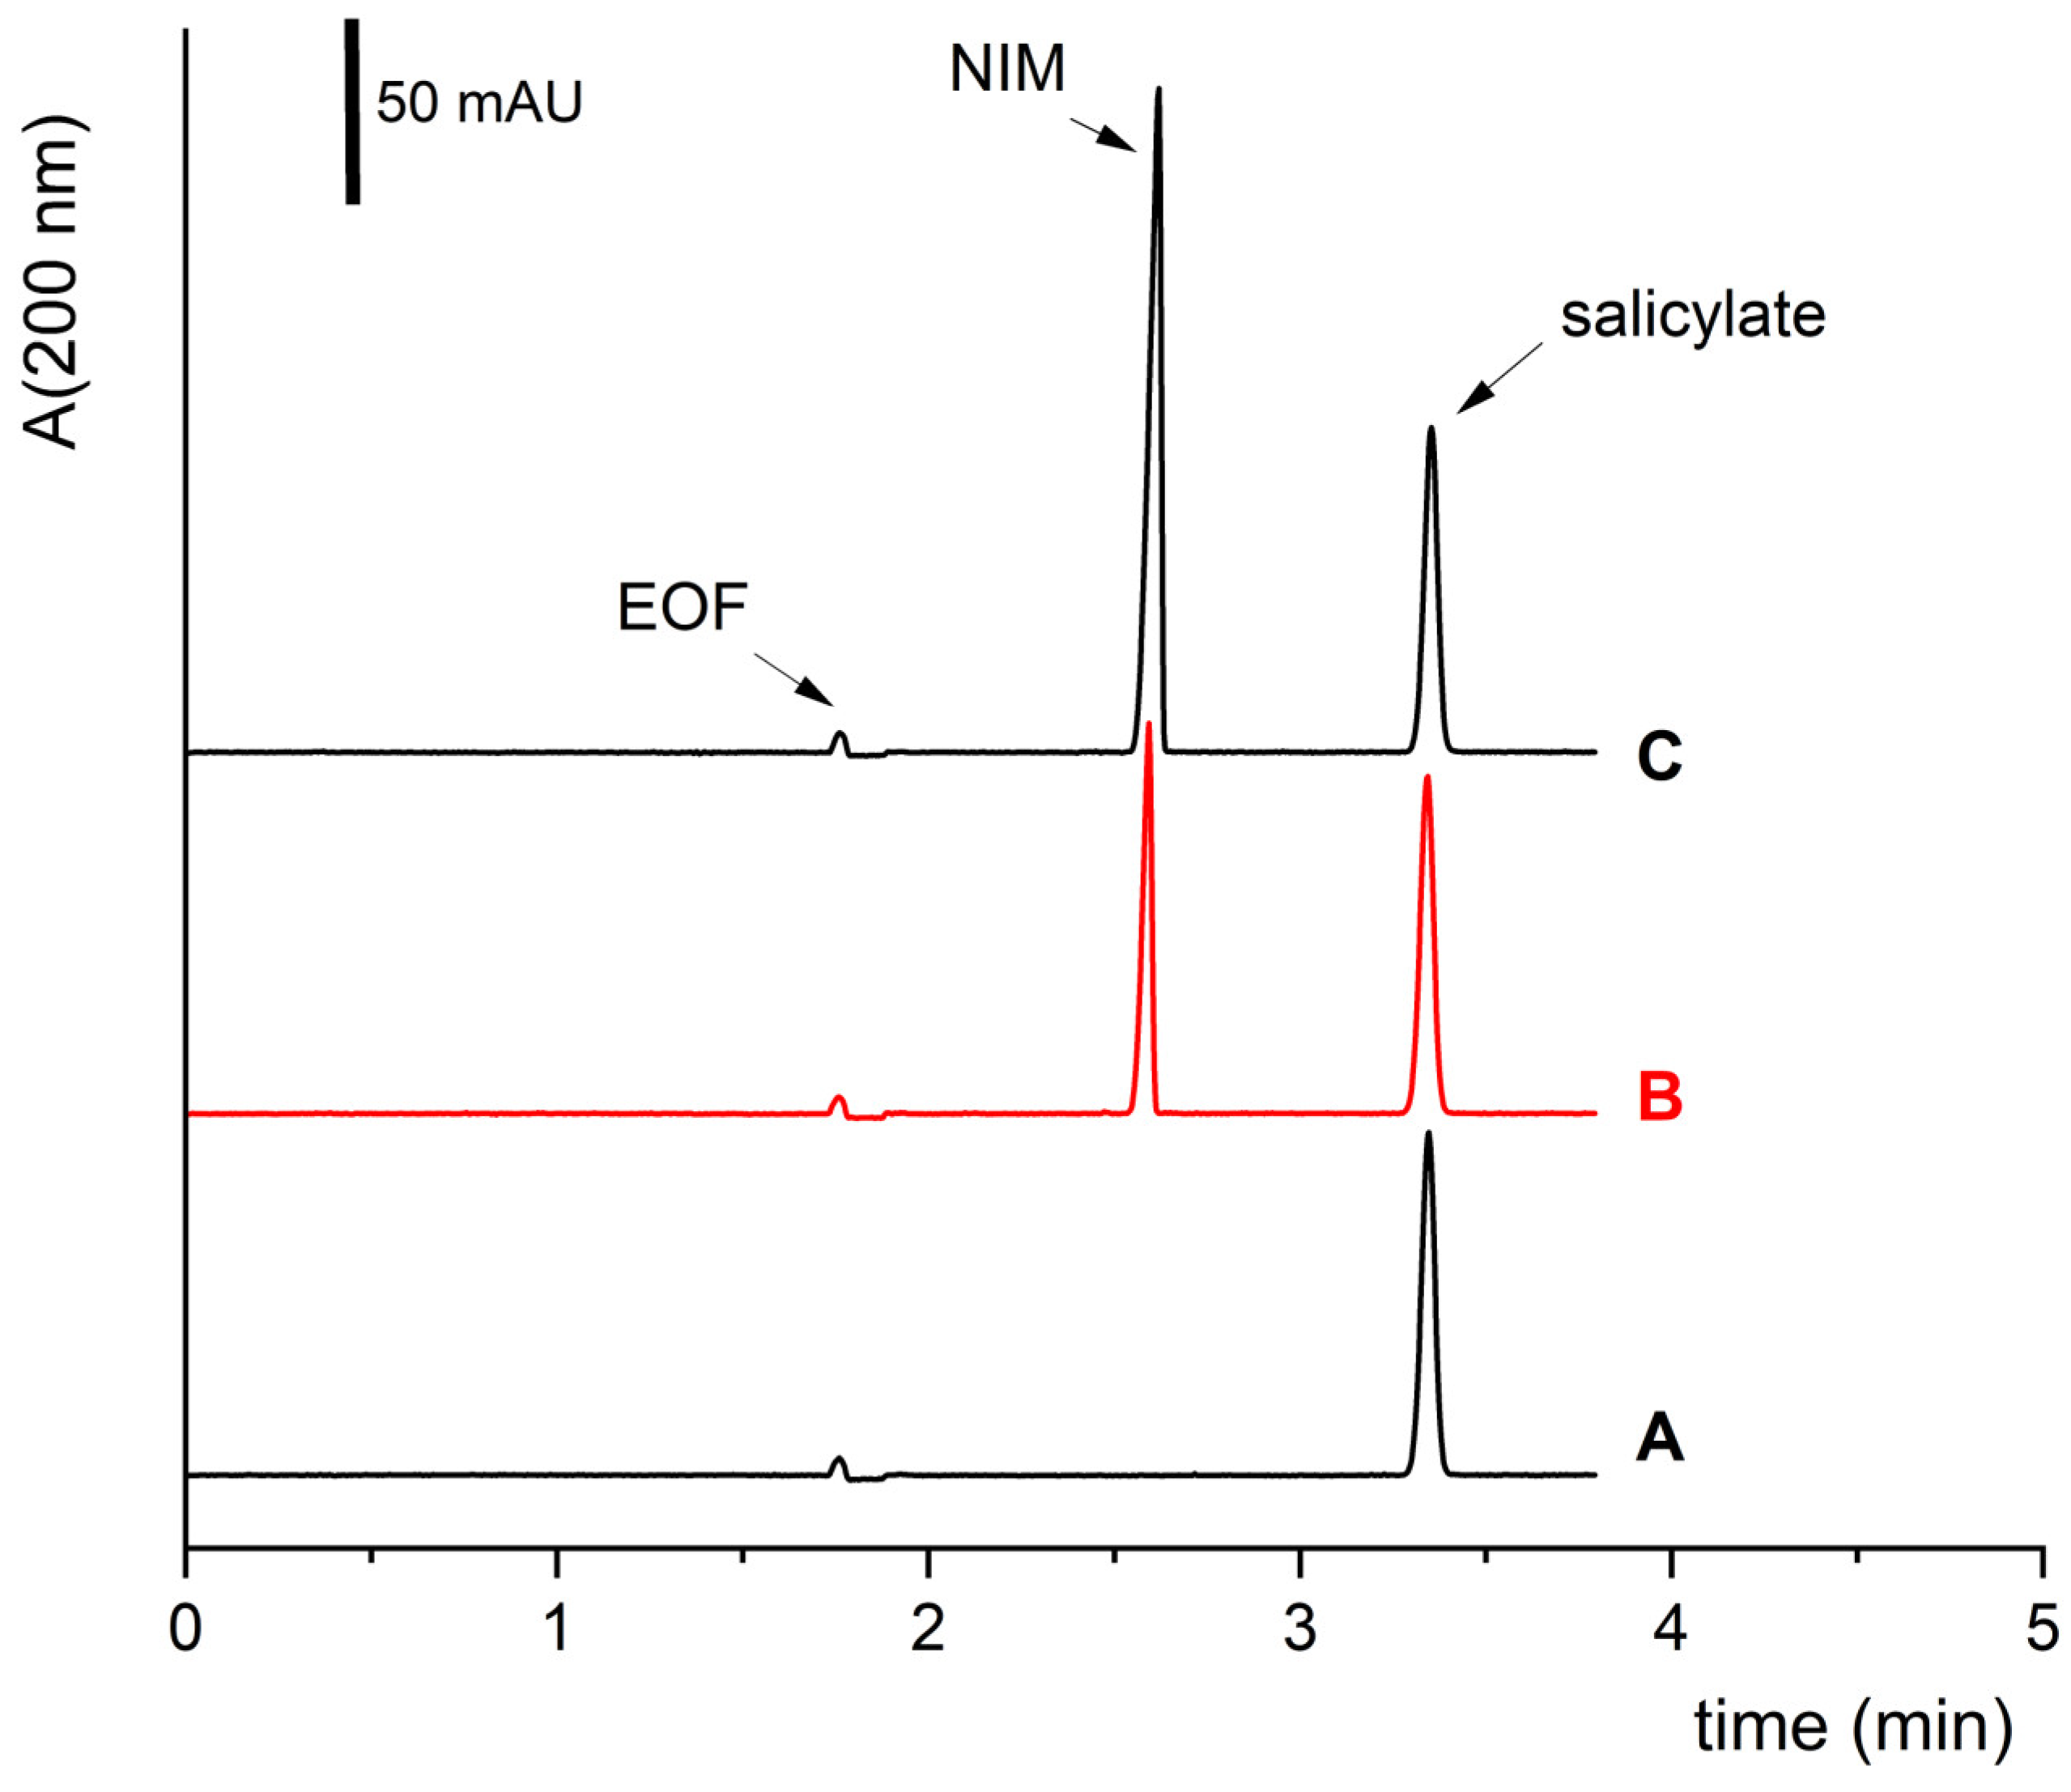
3.1.5. Internal Standard Modification: Sodium Salicylate

As mentioned above, the role of internal standard in CZE is to increase the precision of the hydrodynamic injection for quantitative analysis. Instead of reading the peak area of the analyte, which is strongly dependent on the overpressure/vacuum generated by the instrument and its variation directly affects the determination precision, one evaluates a ratio of the analyte peak area to the internal standard peak area instead. Originally, the authors [25] have suggested salicylic acid as an internal standard because of similarity of pKa and good absorbing chromophore; here, however, we replaced the salicylic acid with its sodium salt (NaSA) in order to not consume the buffer capacity operating in alkaline range, since we optimized pH of the running BGE to 9.25.
Based on these experiments and results discussed, the subsequent experiments (validation and determination) were conducted using 15 mM tetraborate buffer (corresponding to 60 mM borate buffer) at pH 9.25, a 50 µm ID capillary, at voltage +12 kV, and without the addition of methanol. These conditions are summarized in Table 2.
These optimized conditions were applied to carry out all the following experiments. Figure 4 shows typical electropherograms obtained by the developed method under the optimized parameters. Under these conditions, the calibration curve and validation the method was performed, and the samples were analyzed.

3.2. Calibration

For the calibration, concentration levels of 0.04, 0.1, 0.2, 0.3, and 0.4 mg/mL of NIM were chosen. Each experiment was performed in triplicate. These levels were selected according to the expected concentration of 0.2 mg/mL.
A stock solution of NIM was prepared by dissolving NIM in methanol, resulting in a final stock 4.0 g/L. Five calibrants were then prepared using this stock solution with final concentrations of 0.04, 0.10, 0.20, 0.30, and 0.40 mg/mL, respectively. Sodium salicylate was prepared with 10 g/L and mixed with methanol and water. The internal standard solution was added to each calibrant (0.1 mL of NaSA per 10 mL). All solutions were placed in the ultrasonic bath for 10 min to ensure NIM was fully dissolved.

3.3. Validation of the Method

Several validation parameters were evaluated under the optimal conditions: migration time and peak area measurement repeatability, quality of the calibration curve, and detection limits.
For the expected concentration c = 0.2 mg/mL, the migration time repeatability of NIM was calculated as RSD = 0.62% (n = 10).
The relative standard deviation (RSD%) of peak areas measured A(NIM)/A(NaSA) were calculated from triplicate measurements at each calibration concentration. RSD% values ranged from 0.4% to 1.1% for the selected concentration range (0.04 to 0.4 mg/mL).
Peak area intermediate precision was measured within three series of measurements of a sample during a week (n = 3 × 10) with repeatedly prepared BGE and different operators; RSD = 0.61%, which is less than 1%.
Evaluation of the date of calibration curve revealed that the y-intercept was not statistically significant and was set to 0. Then, the slope was calculated as 4.0115 ± 0.026 mL/mg; the coefficient of determination (R2) of calibration curve was found to be 0.9994, which is close to 1, proving a strong linearity.
The limit of quantification (LOQ) is the lowest concentration at which the performance of a method or measurement system is acceptable for a specified use [26]. Limits of detection and quantification were calculated from the regression line of the calibration data as LOD = 3.3 × Syx/slope and LOQ = 3 × LOD, where Syx is the standard error of the estimate. The values calculated were as follows: LOD = 0.04 mg/mL, and LOQ = 0.12 mg/mL. It should be noted that the value of LOD = 40 mg/L is not a handicapping factor for the method since the method was designed for pharmaceutical formulations with relatively high NIM content—the expected value is 200 mg/L (the center of calibration curve).

3.4. Sample Analysis

The calibration curve was designed for an expected concentration of 0.2 mg/mL. The following paragraphs describe the sample preparations of three different drug formulations, always resulting in a solution that can be directly injected from a vial.

3.4.1. Sample Preparation of Non-Coated Tablets

Each tablet (~0.4 g) was individually weighed, pulverized, and homogenized into a fine powder. Then, 0.1 g of each tablet powder was precisely weighed and quantitatively flushed into a 100 mL volumetric flask. Next, 60 mL of methanol was added, followed by 1 mL of sodium salicylate solution 10 g/L (the internal standard). The flask was then filled to the mark with HPLC-grade water. The flask was placed in an ultrasonic bath for 10 min to ensure complete dissolution of the sample. The solutions were subsequently filtered through a disposable 0.45 µm nylon filter before analysis. This process was replicated three times for each tablet.

3.4.2. Sample Preparation of Topical Gel

The required sample amount for each run ranged between 0.3 and 0.4 g (declared concentration 30 mg/g). A sample of 300–400 mg of gel was weighed into a 20 mL glass sealable container, followed by the addition of 1 mL of acetone and 1 mL of the sodium salicylate (internal standard). Acetone was added to ensure the full dissolution of NIM. The mixture was shaken and placed in the ultrasonic bath for 1 min until the gel was fully dissolved into transparent solution (homogenized). Then, the solution was quantitatively transferred into a 50 mL volumetric flask and diluted to the mark with methanol. Due to the viscosity of the gel matrix additives, filtration through a disposable filter was not performed.

3.4.3. Sample Preparation of Sachets (Powder)

The weight of each sachet content was recorded (~2 g), and the powder was homogenized. Then, 0.2 g of the homogenized powder for each sample was weighed and transferred into a 50 mL volumetric flask. Subsequently, 0.5 mL of NaSA solution 10 g/L (the internal standard) was added, and the flask was filled to the mark with methanol. The flasks were placed in an ultrasonic bath for 5 min to ensure complete dissolution. The prepared solutions were then filtered through a 0.45 µm nylon filter and transferred into vials for analysis. This process was repeated in triplicate for each dose (sachet).

3.4.4. Analysis of Sachets. Uniformity of Content of Single-Dose Preparations

Uniformity of content of single-dose preparations was assessed following the procedure from the European Pharmacopoeia [27]. This test evaluates the individual content of the active substance in a series of single-dose units, ensuring that the percentage content lies within the specified limits of 85% to 115% of the total average value determined of the active substance.
For this experiment, 10 sachets were randomly selected from a box of 30 sachets of Nimesil oral suspension (see Table 1). Each sachet was prepared as previously described.
First, six Aulin non-coated tablets were analyzed in triplicate. The results are graphically presented in Figure 5. In the non-coated tablets, the average value determined was 104.2 mg of NIM per a tablet. The calculated average RSD of the determined mass was 2.6%, which reflects not only the method precision but also content variability of the active compound in the tablets. Nevertheless, all the values fit 85–115% of the average content.
Second, Aulin topical gel (30 mg/g) from a single 50 g tube was repeatedly analyzed; the results are shown in Table 3. The average value of four samples taken from the tube was 1.504 g per a tube, which is in a good agreement with the value declared (=1.5 g/tube).
Finally, the content uniformity test was carried out. Figure 6 illustrates the measured nimesulide (NIM) content in 10 sachets randomly selected from a batch of 30 Nimesil oral suspension sachets (according to the content uniformity test, Test A [27]).
The RSD% values range from 0.42% (Sachet 4), with the highest variability observed in Sachet 6 (7.81%). The composite sample of the remaining powder exhibits an RSD% of 2.1%. The horizontal dashed line represents the average NIM content determined, which was 101.9 mg. The lower and upper limits for the content uniformity test are set at 86.6 mg and 117.2 mg, respectively, corresponding to 85% and 115% of the average content, which confirms that all the sachets fall within the limits and comply with Pharm. Eur. standards for the content uniformity test.

4. Conclusions

A rapid capillary zone electrophoresis method was developed by optimizing experimental parameters critical for the technique of capillary zone electrophoresis. The quantitative precision of the method was improved by an internal standard (sodium salicylate). The run time of the method is less than four minutes. Therefore, the advantage of the method for application to real samples is the simple sample preparation and rapidness.
The method can be easily adapted for various formulations supposing the final sample solution concentration is around 0.2 mg/mL; only the sample preparation procedure must be adjusted.

Author Contributions

Conceptualization, J.P.; methodology, J.P.; investigation, C.V.H.; resources, C.V.H.; data curation, C.V.H.; writing—original draft preparation, C.V.H. and J.P.; writing—review and editing, J.P.; supervision, J.P. All authors have read and agreed to the published version of the manuscript.

Funding

This research received no external funding.

Data Availability Statement

The data presented in this study are available on request from the corresponding author due to practical constraints.

Acknowledgments

This article is a revised and expanded version of a poster entitled Rapid Determination of Nimesulide in Pharmaceutical Formulations by CZE, which was presented at 52nd Conference Synthesis and Analysis, Hradec Králové, Czech Republic, 19–20 September 2024 [28].

Conflicts of Interest

The authors declare no conflict of interest.

Abbreviations

The following abbreviations are used in this manuscript:
BGEbackground electrolyte
COX-2cyclooxygenase-2
DADDiode Array Detector
EMAEuropean Medicines Agency
EOFelectroosmotic flow
ESI-MSelectrospray ionization mass spectrometry
HPLChigh-performance liquid chromatography
LODlimit of detection
LOQlimit of quantification
MEKCMicellar Electrokinetic Capillary Chromatography
NaSAsodium salicylate
NIMnimesulide
NSAIDnon-steroidal anti-inflammatory drug
Ph.Eur.(Pharmacopoeia Europaea) European Pharmacopoeia
SAsalicylic acid
Syxstandard error of the estimate (linear regression)
UVultraviolet

References

  1. Caiazzo, E.; Ialenti, A.; Cicala, C. The relatively selective cyclooxygenase-2 inhibitor nimesulide: What’s going on? Eur. J. Pharmacol. 2019, 848, 105–111. [Google Scholar] [CrossRef] [PubMed]
  2. Rainsford, K. Current status of the therapeutic uses and actions of the preferential cyclooxygenase-2 NSAID, nimesulide. Inflammopharmacology 2006, 14, 120–137. [Google Scholar] [CrossRef] [PubMed]
  3. Tavares, I.A.; Bennett, A. COX-2 inhibitors compared and contrasted. Expert Opin. Pharmacother. 2001, 2, 1859–1876. [Google Scholar] [CrossRef] [PubMed]
  4. Agúndez, J.A.; Lucena, M.I.; Martínez, C.; Andrade, R.J.; Blanca, M.; Ayuso, P.; García-Martín, E. Assessment of nonsteroidal anti-inflammatory drug-induced hepatotoxicity. Expert Opin. Drug Metab. Toxicol. 2011, 7, 817–828. [Google Scholar] [CrossRef] [PubMed]
  5. Kress, H.G.; Baltov, A.; Basiński, A.; Berghea, F.; Castellsague, J.; Codreanu, C.; Copaciu, E.; Giamberardino, M.A.; Hakl, M.; Hrazdira, L.; et al. Acute pain: A multifaceted challenge—The role of nimesulide. Curr. Med. Res. Opin. 2016, 32, 23–36. [Google Scholar] [CrossRef] [PubMed]
  6. Nimesulide—Referral Agency; European Medicines Agency: Amsterdam, The Netherlands, 2004; Volume CPMP/1724/04.
  7. Nimesulide—Referral (review). In EMEA/H/A-31/001261; European Medicines Agency: Amsterdam, The Netherlands, 2012; Volume EMA/382884/2011.
  8. Rainsford, K. (Ed.) Nimesulide—Actions and Uses; Birkhäuser: Basel, Switzerland, 2005. [Google Scholar]
  9. Drug Safety Newsletter, 17th ed.; Irish Medicines Board: Dublin, Ireland, 2003.
  10. Amazon.uk. Nimesil Sachets. Available online: https://www.amazon.co.uk/Generic-Nimesil-30-Sa-chets/dp/B0C5FXX8ZG (accessed on 22 December 2024).
  11. Amazon.be. Nimesil Sachets. Available online: https://www.amazon.com.be/-/en/Nimesil-30-x-2g-Sa-chets/dp/B09K6KS37P (accessed on 22 December 2024).
  12. Nimesulide—Article 107 Procedures—Annex I; European Medicines Agency: Amsterdam, The Netherlands, 2010.
  13. Tůma, P. Monitoring of biologically active substances in clinical samples by capillary and microchip electrophoresis with contactless conductivity detection: A review. Anal. Chim. Acta 2022, 1225, 340161. [Google Scholar] [CrossRef] [PubMed]
  14. Starek, M.; Krzek, J. A review of analytical techniques for determination of oxicams, nimesulide and nabumetone. Talanta 2009, 77, 925–942. [Google Scholar] [CrossRef] [PubMed]
  15. EDQM. Nimesulide European Pharmacopoeia, 11th ed.; Council of Europe: Strasbourg, France, 2024. [Google Scholar]
  16. ANVISA. Brazilian Health Regulatory Agency, Brazilian Pharmacopoeia, 6th ed.; Ministry of Health of Brasilia: Brasilia, Brazil, 2019; p. IF264-00. [Google Scholar]
  17. Santos, B.W.L.; Caldas, E.D.; Da Silva, M.V. Nimesulide: Dissolution profile, validation of analytical methods for capsules, and assessment of product quality. Int. J. Pharm. Pharmaceut. Sci. 2016, 8, 27–32. [Google Scholar]
  18. Ferrario, P.; Bianchi, M. Simultaneous determination of nimesulide and hydroxynimesulide in rat plasma, cerebrospinal fluid and brain by liquid chromatography using solid-phase extraction. J. Chromatogr. B 2003, 785, 227–236. [Google Scholar] [CrossRef] [PubMed]
  19. Panusa, A.; Multari, G.; Incarnato, G.; Gagliardi, L. High-performance liquid chromatography analysis of anti-inflammatory pharmaceuticals with ultraviolet and electrospray-mass spectrometry detection in suspected counterfeit homeopathic medicinal products. J. Pharm. Biomed. Anal. 2007, 43, 1221–1227. [Google Scholar] [CrossRef]
  20. Voeten, R.L.C.; Ventouri, I.K.; Haselberg, R.; Somsen, G.W. Capillary Electrophoresis: Trends and Recent Advances. Anal. Chem. 2018, 90, 1464–1481. [Google Scholar] [CrossRef]
  21. Krait, S.; Konjaria, M.-L.; Scriba, G.K.E. Advances of capillary electrophoresis enantioseparations in pharmaceutical analysis (2017–2020). Electrophoresis 2021, 42, 1709–1725. [Google Scholar] [CrossRef]
  22. Dalmora, S.L.; Fronza, M.; Nogueira, D.R.; Souto, R.B.; Bernardi, R.M. Simultaneous determination of nimesulide and valdecoxib by micellar electrokinetic capillary chromatography method. J. Liq. Chromatogr. Relat. Technol. 2007, 30, 2863–2877. [Google Scholar] [CrossRef]
  23. Zacharis, C.K.; Tzanavaras, P.D.; Notou, M.; Zotou, A.; Themelis, D.G. Separation and determination of nimesulide related substances for quality control purposes by micellar electrokinetic chromatography. J. Pharm. Biomed. Anal. 2009, 49, 201–206. [Google Scholar] [CrossRef] [PubMed]
  24. Chen, Y.L.; Wu, S.M. Capillary zone electrophoresis for simultaneous determination of seven nonsteroidal anti-inflammatory drugs in pharmaceuticals. Anal. Bioanal. Chem. 2005, 381, 907–912. [Google Scholar] [CrossRef] [PubMed]
  25. Dogrukol-Ak, D.; Tuncel, M.; Aboul-Enein, H.Y. A capillary zone electrophoretic method for the determination of nimesulide in pharmaceutical preparation and serum. J. Sep. Sci. 2001, 24, 743–748. [Google Scholar] [CrossRef]
  26. ICH Guideline Q2(R2) on Validation of Analytical Procedures; International Council for Harmonisation of Technical Requirements for Pharmaceuticals for Human Use; European Medicines Agency: Amsterdam, The Netherlands, 2024.
  27. EDQM. European Pharmacopoeia (Ph.Eur.), Section 2.9.6., 11th ed.; Council of Europe: Strasbourg, France, 2024. [Google Scholar]
  28. Ho, C.V.; Pazourek, J. Rapid Determination of Nimesulide in Pharmaceutical Formulations by CZE. In Proceedings of the Conference Synthesis and Analysis of Drugs, Hradec Králové, Czech Republic, 19–20 September 2024. [Google Scholar]
Figure 1. Chemical formulas of acid–base forms of nimesulide (pKa = 6.5).
Separations 12 00132 g001
Figure 2. NIM efficiency and resolution NIM–SA in 5 mM (dashed trace, squares) and 20 mM (solid trace, circles) borate BGE across the measured pH range (10% of methanol added, capillary ID 75 μm). The circles indicate the efficiency and resolution in 20 mM, and the squares show efficiency and resolution of NIM-SA in 5 mM buffer. The resolution (open squares, open circles) relates to the secondary y-axis (right), while efficiency (full squares, full circles) is plotted with the primary y-axis (left). The vertical dotted line marks the original pH = 8.1 suggested by Dogrukol-ak [25]. Efficiency was calculated as 5.545 × (t/w)2; resolution as 1.18 × (t2 − t1)/(w2 + w1), where t is the migration time; w is the peak width at its half-maximum. Because the capillary effective length was 24.5 cm, efficiency per 1 m can be calculated as N × 4.08.
Separations 12 00132 g002
Figure 3. Graph of dependence of NIM peak efficiency (solid line, full circles) and resolution NIM-SA (dashed line, open squares), resp., on sodium tetraborate (BGE) concentration. Other experimental conditions: injection 50 mbar/1 s, voltage = +12 kV, and t = 25 °C.
Separations 12 00132 g003
Figure 4. The selectivity of the method under optimized experimental conditions (Table 2). The run time is less than 4 min. Electropherogram (A) shows a blank (a sample with internal standard of NaSA); electropherogram (B) is a typical electropherogram of a sample containing NIM; and electropherogram (C) shows the sample (B) spiked with a standard of NIM. The concentration of sodium salicylate was always 0.1 mg/mL, and the concentration of NIM was 0 (A), 0.1 (B), and 0.4 (C) mg/mL, resp.
Separations 12 00132 g004
Figure 5. Determined NIM content of Aulin in six tablets. The y-axis scale corresponds to the limits 85–115% of the average value shown by the dashed line in the center.
Separations 12 00132 g005
Figure 6. The results of the content uniformity tests for NIM sachets (powder). The y-axis scale corresponds to the limits 85–115% of the average content determined.
Separations 12 00132 g006
Table 1. Analyzed samples with nimesulide as the active compound.
Marketed NameNimesilAulinAulin (Topical Use)
Dosage formGranules/powder
(sachet)
Non-coated tabletsGel (50 g tube)
ProducerLaboratori Guidotti S.p.A., Pisa-La Vettola, ItalyMedicom International s.r.o, Brno, Czech RepublicAngelini Pharma Česká republika s.r.o., Brno,
Czech Republic
NIM content
(a dose)
100 mg100 mg30 mg/g
Weight
(a dose)
2 g0.4 gAround 3 g
Primary
packaging
SachetBlisterTube
Table 2. Summary of optimized experimental conditions.
ParameterConditions
CapillaryID 50 μm, 33/24.5 cm (uncoated fused silica)
BGE60 mM sodium borate buffer (15 mM sodium tetraborate buffer), pH = 9.25 (no adjustment), no methanol
Voltage+12 kV (current 25 μA)
Temperature25 °C
Injectionhydrodynamic injection 2 s/50 mbar
Internal standardsodium salicylate (c = 0.1 g/L)
DetectionDAD 200 nm
Table 3. Results of analysis of topical gel Aulin (single 50 g tube).
m (g/Tube)RSD (n = 5)
1.49200.4%
1.49080.5%
1.51470.5%
1.51761.0%
Disclaimer/Publisher’s Note: The statements, opinions and data contained in all publications are solely those of the individual author(s) and contributor(s) and not of MDPI and/or the editor(s). MDPI and/or the editor(s) disclaim responsibility for any injury to people or property resulting from any ideas, methods, instructions or products referred to in the content.

