Abstract
Circulating tumor cell enrichment and enumeration are advancing early detection of cancer, monitoring of therapy response, and even next-generation therapies. Efficiently capturing rare cells from complex biological fluids is essential in both diagnostic and therapeutic applications. EpCAM-positive tumor cells are specifically captured by utilizing covalently immobilized anti-EpCAM monoclonal antibodies onto the surface of chemically modified glass microbeads. To maximize the capture efficiency, bead geometry, immobilization conditions, flow rate, and anticoagulant dosage were systematically optimized. An in vitro flow-capture system was designed and used to evaluate the capture efficiency of the proposed technology by utilizing HTC116 colon cancer cell-spiked model media. The effect of substrate surface pretreatment was characterized by goniometry, while the capture performance was monitored by flow cytometry and fluorescent microscopy. The specific capture ability of the bioactive microbead substrate reached over 130,000 cells in the laboratory-scale cartridge (V(cartridge) = 2.6 cm3; m(bead) = 4 g). This capture efficiency suggests a promising rare-cell capture utilization of the proposed technology and may be used for research, diagnostic, and therapeutic purposes. In this paper, we reported on the development and feasibility test of a high-performance bioactive glass-microbead cell capture substrate. Due to the relevance and novelty of the reported results, with further development, the versatile platform technology presented could be readily implemented to capture tumor cells from complex biological samples and represent an additional complementary tool to existing cancer diagnostics and therapies.
1. Introduction
Effective circulating tumor cell (CTC) capture is in the spotlight of rare cell capture and analysis-related technologies research. CTCs are cancer cells that have detached from a primary tumor and entered the bloodstream and/or the lymphatic system. These cells can travel to and colonize distant organs, leading to the formation of secondary tumors during the metastatic process [1,2,3,4]. The presence of these circulating malignant cells is highly associated with poor prognosis in many types of cancer, including breast, prostate, lung, and colorectal cancer [5,6,7,8,9,10,11]. Utilizing liquid biopsy tests as a less invasive alternative for cancer diagnostics, these cells are important indicators of progression, metastasis, and response to therapy and provide insight into the genetic and molecular characteristics of tumors without the need for tissue biopsies [11,12,13,14,15,16]. Isolating CTCs from relatively small blood volumes presents several challenges that can impact the effectiveness of liquid biopsy methods. In other words, current technologies may lack the sensitivity required to reliably detect and enumerate CTCs from blood samples due to their rarity and heterogeneity [12,17,18,19,20,21].
Several technologies have been developed to capture and analyze CTCs from patient blood samples, each with varying efficiencies and throughput capabilities. The CellSearch system, FDA-approved for certain cancers, utilizes immunomagnetic separation targeting EpCAM-positive cells. Despite improvements, the sensitivity of the CellSearch system is still not always adequate, especially in cancers with low CTC counts [22,23], and requires diagnostic leukapheresis (DLA) to process blood volumes larger than 7.5 mL [24]. For the time being, the only FDA-approved CTC enrichment technology that is able to process blood samples up to 40 mL is the Parsortix system. The Parsortix PC1 employs size- and deformability-based microfluidic separation, capturing a broader range of CTC phenotypes, including those lacking EpCAM expression. However, the Parsortix PC1 system, which is currently used in clinics, is also optimized for 7.5 mL blood samples [25,26]. GenoCTC, a technology recently approved by the FDA for breast cancer prognosis [27], and ClearCell FX1 [28], which is also FDA-approved for diagnostic purposes, are able to process 7.5 mL of whole blood. ClearCell FX1 utilizes inertial microfluidics for label-free CTC enrichment [29,30,31]. The GILUPI CellCollector® is an in vivo device inserted into a vein, exposing it to approximately 1.5–3 L of blood over 30 min. This approach enhances the likelihood of capturing rare CTCs, but it is clearly more invasive compared to other liquid biopsy methods [32].
In this paper, we report on the development and implementation of a novel glass microbead-based platform with efficient specific cell capture capability, proved in an in vitro model flow-capture system. Soda–lime glass is a widely used material in various applications, including biomedical devices, due to its biocompatibility and ease of functionalization. When combined with innovative functionalization, it offers a simple, cost-effective, and efficient solution [33].
2. Materials and Methods
GFP-HCT116 and native (i.e., non-labeled) HCT116 colorectal cancer cell lines were supplied by the National Institute of Oncology (Budapest, Hungary) and the Hungarian Academy of Sciences (Budapest, Hungary). Furthermore, 2-picoline-borane, RPMI 1640 cell culture media, and phosphate buffered saline (PBS, pH 7.4) were purchased from Sigma-Aldrich (St. Louis, MO, USA). Fetal bovine serum (FBS), 3-aminopropyltriethoxysilane (APTES), calcein-AM, fluorescein isothiocyanate (FITC)-labeled anti-EpCAM antibodies, anti-EpCAM antibodies, 10× trypsin-EDTA, and penicillin–streptomycin were sourced from Thermo Fisher Scientific (Waltham, MA, USA). Methanol and absolute ethanol were obtained from VWR (Radnor, PA, USA). Hydrochloric acid, sulfuric acid, trisodium citrate dihydrate, dry toluene, and glutaraldehyde were purchased from Molar Chemicals Ltd. (Halasztelek, Hungary). Polyethylene glycol was obtained from Merck (Kenilworth, NJ, USA). FlowCount Fluorospheres were purchased from Beckman Coulter (Brea, CA, USA). Heparibene Na 25,000 IU solution for injection was obtained from TEVA (Debrecen, Hungary). The FTA32 software 2.1 was kindly contributed by Professor Gyula Kiss of the Soós Ernő Research and Development Center, University of Pannonia (Veszprem, Hungary). The Kaluza software was kindly provided by Szabolcs Tamás Nagy of Hungarian University of Agriculture and Life Sciences (Keszthely, Hungary). The CellProfiler software (version 4.2.8.) was downloaded from their official website: https://cellprofiler.org/ (accessed on 13 January 2025).
2.1. Chemical Cleaning and Silanization of Glass Surfaces
Commercially available monodisperse 400 and 800 µm soda–lime glass beads were purchased from Glass Sphere (Jablonec nad Nisou, Czech Republic). Glass microscope slides were obtained from VWR (Radnor, PA, USA). Glass surfaces were pretreated with a 1:1 mixture of cc. hydrochloric acid and MeOH for 30 min at room temperature, followed by rinsing with HPLC-grade water. After the washing step, the beads were soaked in cc. sulfuric acid for 30 min at room temperature, rinsed again, and boiled in HPLC-grade water for 30 min [34]. The beads were oven-dried completely at 100 °C after boiling. Subsequently, the beads were shaken in 3% APTES in dry toluene for 2 h [35]. After rinsing the excess reagents with dry toluene, the beads were incubated again at 100 °C until complete drying. The effectiveness of the chemical cleaning and uniformity of silanization were evaluated by contact angle measurements on glass slides, which were prepared the same way as the beads. The slides were specifically prepared for goniometry measurements, as described in [31]. The contact angles were measured after each chemical cleaning and silanization step. The glass slides were dried under a laminar hood prior to each measurement to avoid further contamination of their surface.
2.2. Antibody Immobilization
Anti-EpCAM antibodies were immobilized onto glass beads and microscope slides as follows. Silanized glass beads were shaken in 2% glutaraldehyde in HPLC-grade water for 1 h at room temperature [36]. The beads were washed with HPLC-grade water to remove the excess glutaraldehyde. Then, 1 µg/µL non-labeled anti-EpCAM (EpCAM Monoclonal Antibody (VU-1D9) MA1-10195) antibody solution was added to the coupling buffer of 1 mg/mL 2-picoline-borane in 5% EtOH (v/v) in HPLC-grade water (pH 7.0) to achieve a final antibody concentration of 0.78 µg/mL [37]. The beads were transferred to a centrifuge tube, and the coupling buffer was added. The beads were shaken overnight in the coupling buffer at 4 °C. Control beads were prepared in the same way, containing only linkers on their surface. Finally, the beads were washed with PBS (pH 7.4), and the excess non-specific binding sites were blocked by the addition of 2.5 mL of 10 mg/mL PEGmw8000 in PBS per 4 g bead, for both the active and control beads. The immobilization process was evaluated using FITC-conjugated anti-EpCAM and fluorescent microscopy.
2.3. Cell Culturing and Evaluation of EpCAM Expression
HCT116 cells were cultured in complete RPMI media containing 10% fetal bovine serum and 1% penicillin–streptomycin at 37 °C in 5% CO2 atmosphere. The cultured cells were detached from the flask walls with 1× trypsin-EDTA in PBS solution. The detached cells were resuspended in RPMI medium containing 10% FBS and 1% penicillin–streptomycin and stored in Eppendorf tubes at 37 °C in 5% CO2 atmosphere. The cells were incubated for 1 h prior to further use; thus, the surface of the cells could regenerate before the actual capture experiments and antibody conjugation. Colorectal cancer cells were reportedly EpCAM-positive [38,39], but the EpCAM expression of the cells was investigated using FITC-labeled anti-EpCAM conjugation. To study the over-expression of EpCAM, 20 µL of FITC-labeled antibody solution was added to the cell suspension per 1 × 10⁶ cells as recommended by the manufacturer. The cells were incubated in the dark at 37 °C for 15 min. Finally, the cells were centrifuged at 1800 rpm and resuspended in PBS to remove excess antibodies. The washing step was repeated 3 times. Fluorescent emission of the antibody–cell conjugates was measured by flow cytometry.
2.4. Cell Capture
Laboratory-scale test cartridges (2.6 cm3) were filled with anti-EpCAM antibody immobilized glass beads (3.6 g of id = 800 µm or 4 g of id = 400 µm) for the cell capture experiments. HCT116 cells, at an average concentration of 18 pcs/µL, were spiked into 30 mL of 1% (w/v) PEGMW8000 in PBS. The model solution was rinsed through the laboratory-scale test system using a LeadFluid peristaltic pump (Baoding Lead Fluid Technology Co Ltd., Baoding, China), ensuring continuous flow. The experimental setup and its schematics are shown in Figure 1. Two laboratory-scale cartridges were filled with activated and control beads, respectively. Open-lid tanks were filled with the cell-buffer suspension, ensuring bubble-free flow, and used as admission/sampling points as well. Cell suspension homogeneity was maintained by continuous stirring using a magnetic stirrer. Since the non-specific binding of adhesive cells cannot be avoided, control experiments were performed to establish a reference point for accurate estimation of specific cell capture. The setup of the control experiments was identical, as described above, except that the control beads contained only linkers and the blocking agent on their surface. HCT116 cells containing buffer model solutions were run through the cartridge in a way that the total volume was recirculated continuously for 2 h. The cartridges were then washed with PBS, and the beads were transferred to 15 mL falcon tubes. The captured cells were detached from the beads by rinsing them with 1 mL of 1× trypsin-EDTA solution at 37 °C for 5 min, then 2 mL PBS was added to each tube followed by incubation for another 5 min at the same temperature. The final volume of the cell suspensions washed from the beads was 3 mL in each tube. After the second incubation step, the bead–cell suspensions were vortexed thoroughly. Then the beads were allowed to sink to the bottom of the falcon tube, and the supernatants were sampled. The cell concentrations were measured using flow cytometry, as described above. Calcein AM staining was used to determine the viability of the captured cells. After the capture experiments, the beads were transferred to centrifuge tubes. Membrane-permeable calcein AM dye was used as a staining solution (5 µM in PBS, pH 7.4). Then, 1 mL of staining solution was added to the beads, and the bead-staining solution mixture was incubated in the dark at 37 °C for 15 min. After incubation, the staining solution was discarded, and the beads were placed onto microscope slides for fluorescent microscopy.

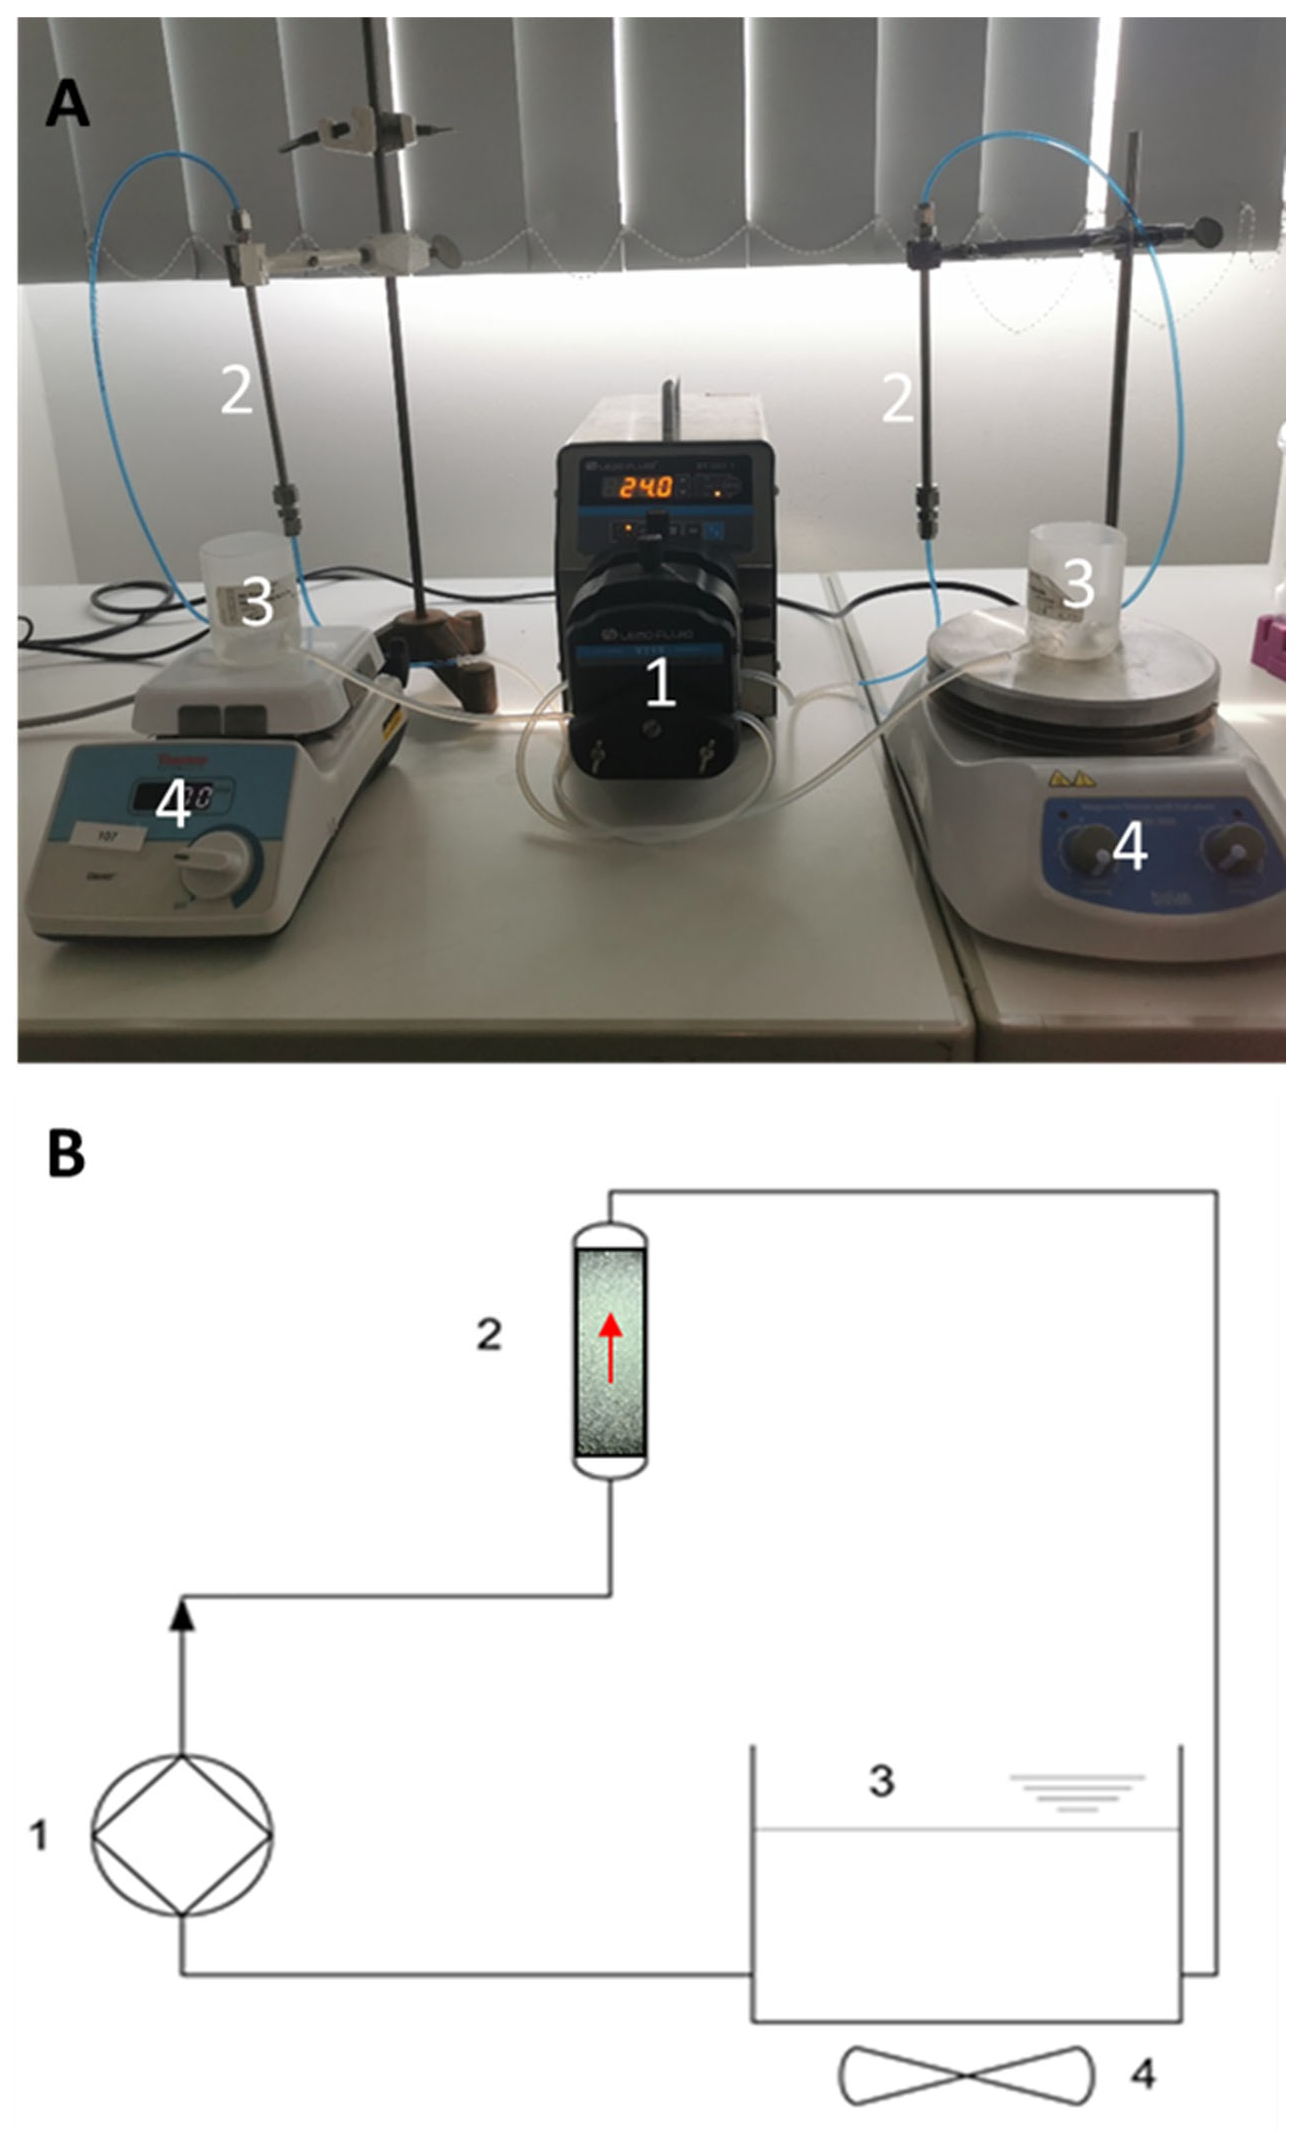
Figure 1.
Experimental setup of the flow-capture system (Panel (A)) and its schematic representation (Panel (B)). Stable circulation was maintained using a peristaltic pump (1). The laboratory-scale cartridges (2) were filled with activated (right side) and control (left side) beads, and the tanks (3) were filled with the cell suspension in buffer. The peristaltic pump drives the circulating model fluid in a bottom-up direction (red arrow) through the bead-filled cartridge (2), where the cells are captured on the surface of the beads. Homogenous distribution of the cells was ensured by continuous stirring (4). The test system components were connected by polyethylene tubing. In the case of activated microscope slides, the setup was identical; only the slides were placed in 3D-printed, closed-design cases enabling continuous flow on the surface of the slide, and the tank volumes were 15 mL instead of 30 mL.
2.5. Cell Capture from Blood by Active Glass Slides
To ensure easier visualization and microscopy evaluation with immunohistochemistry, the cells were captured from human total blood by bioactive glass slides in a continuous flow experimental setup. The blood sample of a healthy volunteer was collected into sodium citrate anticoagulant-containing tubes. The collected blood was spiked with non-GFP HCT116 cells at an average concentration of 18 pcs/µL, as described above in the bead-capture experiments. Standard microscope slides were pretreated, and anti-EpCAM antibodies were immobilized onto them, as described earlier. The slides were then incubated in PBS containing 1% w/v PEGmw8000 at 4 °C for 4 h. HCT116 cells were captured on the prepared slides using the in vitro flow-capture system. The slides were then placed in a 3D printed polymer case, and the capacity of the tank was 15 mL. The flow rate was maintained at 5 mL/min (vlin = 78.26 cm/min) by the peristaltic pump. Even the distribution of the cells was maintained by a magnetic stirrer. After 30 min, the slides were washed by discarding the spiked blood and rinsing the system with 15 mL PBS 3 times. After the last washing step, the PBS was completely drained from the system, and the slides were placed in freshly prepared 2.5% v/v glutaraldehyde in PBS for fixation of the captured cells. Finally, the captured cells were labeled with FITC-conjugated anti-EpCAM antibodies. All steps were carried out under a BSL2 laminar hood. Captured cell count was accomplished by microscopy and CellProfiler software [40]. Photos of the captured FITC-anti-EpCAM labeled cells were taken with a Nikon Eclipse Ni microscope equipped with a FITC filter cube and a Nikon d5600 DSLR camera.
2.6. Anticoagulation
The capture efficiency of the activated beads was investigated in combination with different, commonly used anticoagulants. Low molecular weight heparin (LMWH) and Na-citrate were reported to be safely applicable in the case of cancer patients [41,42]; therefore, these anticoagulants were taken into consideration. The dosage of anticoagulants was calculated according to the recommendations used in clinical practice [43], and the biological half-life of heparin was also taken into consideration during the experiments. Prior to all citrate anticoagulation and certain LMWH anticoagulation experiments, the hardware parts of the experimental setup were pretreated with 10,000 IU/L Heparibene Na solution in PBS (priming) to assist local anticoagulation within the system. The anticoagulants were added directly to the carrier medium, and their effect on the specific capture was evaluated by flow cytometry.
2.7. Flow Cytometry
A 100 µL cell suspension was sampled three times from the supernatant of the capture experiment. Each sample was injected into the flow cytometer (Gallios, Beckman Coulter, Brea, CA, USA) in triplicate. To increase the accuracy of quantitative cell count measurements in PBS-cell suspensions, 100 µL of FlowCount Fluorospheres internal standard (Beckman Coulter) was added to each sample (1:1). In this way, absolute cell counts were measured by using forward scatter (FSC), side scatter (SSC), and FL1 (green fluorescent) detectors.
2.8. Captured Cell Identification on Microscope Slides
During thorough examination of the entire surface of microscope slides, images of the captured FITC-anti-EpCAM-labeled cells were taken. The adhered cells were identified based on fluorescence, and size utilizing the CellProfiler software, employing the ColorToGray and IdentifyPrimaryObjects modules. The ColorToGray module in CellProfiler converted color images to grayscale, which was essential for the subsequent object identification steps. Next, the Gaussian filter in the Smooth module was applied to reduce noise. Additionally, the IdentifyPrimaryObjects module was used to detect objects in grayscale images based on their characteristics. Initially, the captured HCT116 cells were manually identified, and their diameters were determined in pixels (average 65 pxls at 20× magnification). This information enabled the IdentifyPrimaryObjects module to recognize the HCT116 cells on all pictures based on their size. Accuracy of the given size range was verified by the use of calibration beads of known size with a 20× objective. To verify the average measured diameter of HCT116 cells in pixels, the average diameter of calibration beads in micrometers (400 µm) and pixels (~1583 pxls), as well as the average diameter of the HCT116 cells in micrometers, were taken into account [44].
3. Results and Discussion
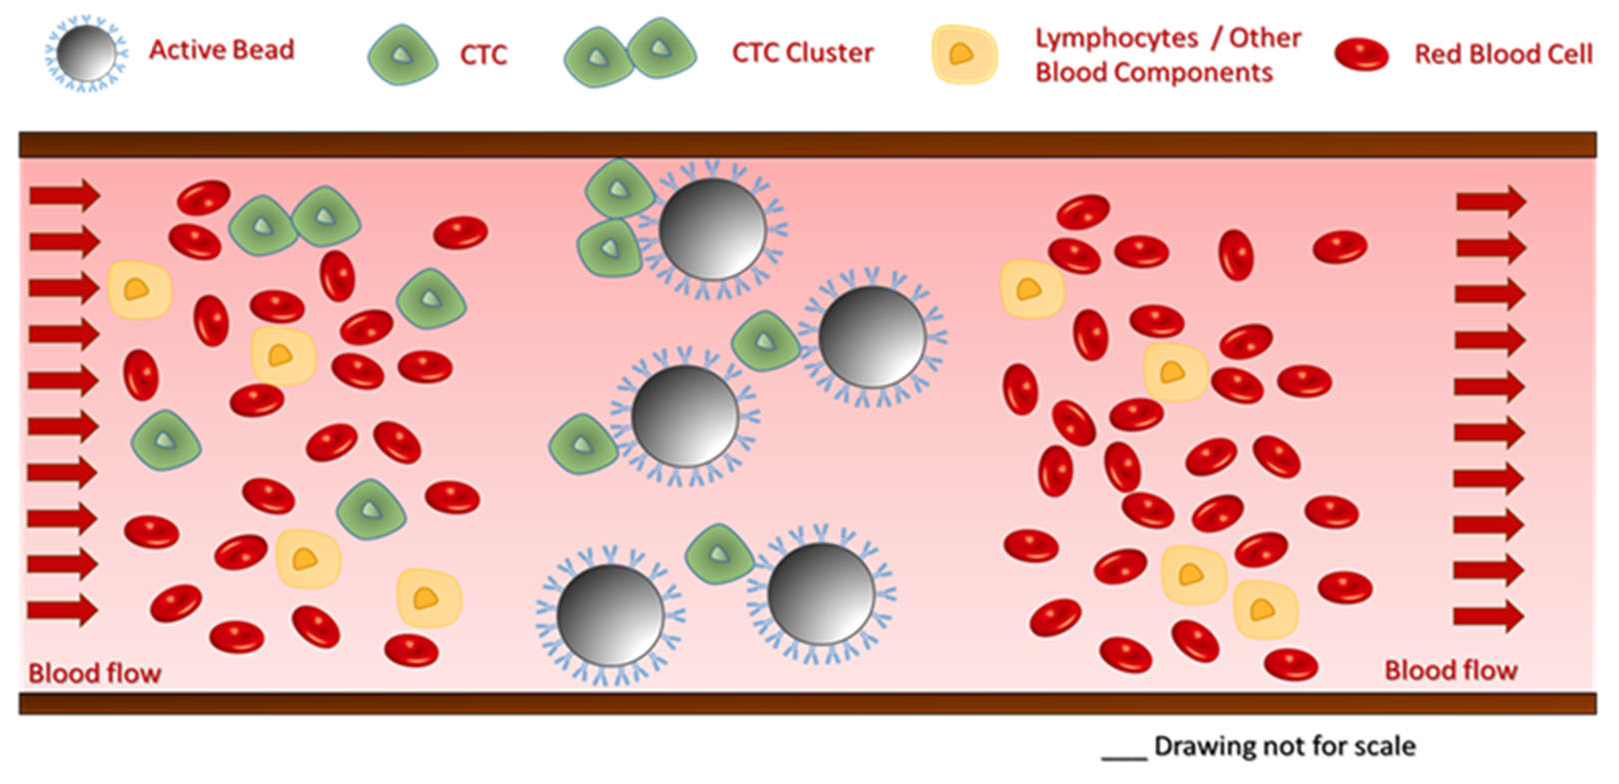
In this study, a laboratory-scale test system was developed and utilized for the feasibility testing of a high-performance immunoaffinity-based cancer cell capture approach. Cell capture was performed by spiking the tumor cells into a peristaltic pump-driven buffer solution circulation. The working mechanism of the proposed technology is shown in Figure 2. Please note that during the actual capture process, blood would flow through the cartridge for selective targeted cell removal from the circulation by the active glass beads. The filtered blood is returned to the tank of the flow-capture system.
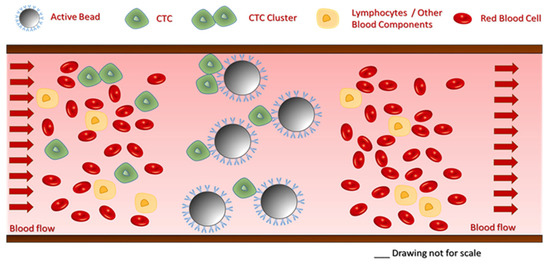
Figure 2.
Schematics of the proposed cell capture mechanism. The beads selectively capture CTCs, while all cellular and molecular blood components pass through the cartridge.
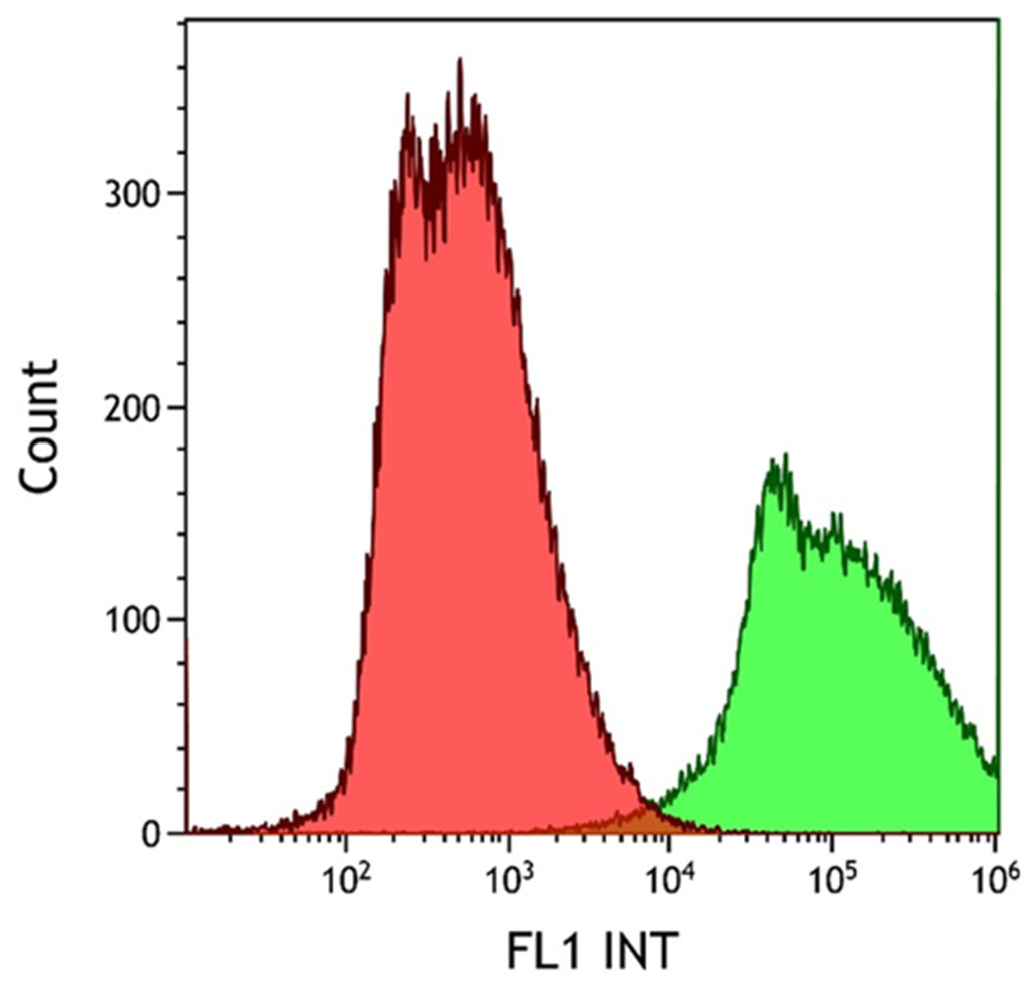
The degree of EpCAM expression in the HCT116 cell line was confirmed using FITC-labeled anti-EpCAM antibody conjugation. The emitted fluorescence signal of the HCT116 cell–antibody conjugates was evaluated using flow cytometry. The non-labeled (red histogram) and the fluorescent antibody-labeled cell population (green histogram) were observed during the cytometry measurements, as shown in Figure 3. Measurements were evaluated using the Kaluza software. Following successful antibody conjugation, the uniform green fluorescence of the labeled cells clearly demonstrates the high level of EpCAM expression in the HCT116 cell line used.

Figure 3.
Histogram overlay of the flow cytometry evaluation of HCT116 cell EpCAM expression. HCT116 cells were resuspended in RPMI medium containing 11% FBS, 1% penicillin–streptomycin, and 20 µL of 30 µg/mL FITC-conjugated anti-EpCAM mAb solution/1 × 106 cells, according to the manufacturer’s recommendation for flow cytometry. The green fluorescence of the labeled cells was clearly detectable (green histogram). The lower cell count of the labeled sample was due to cell loss during the washing step after antibody conjugation.
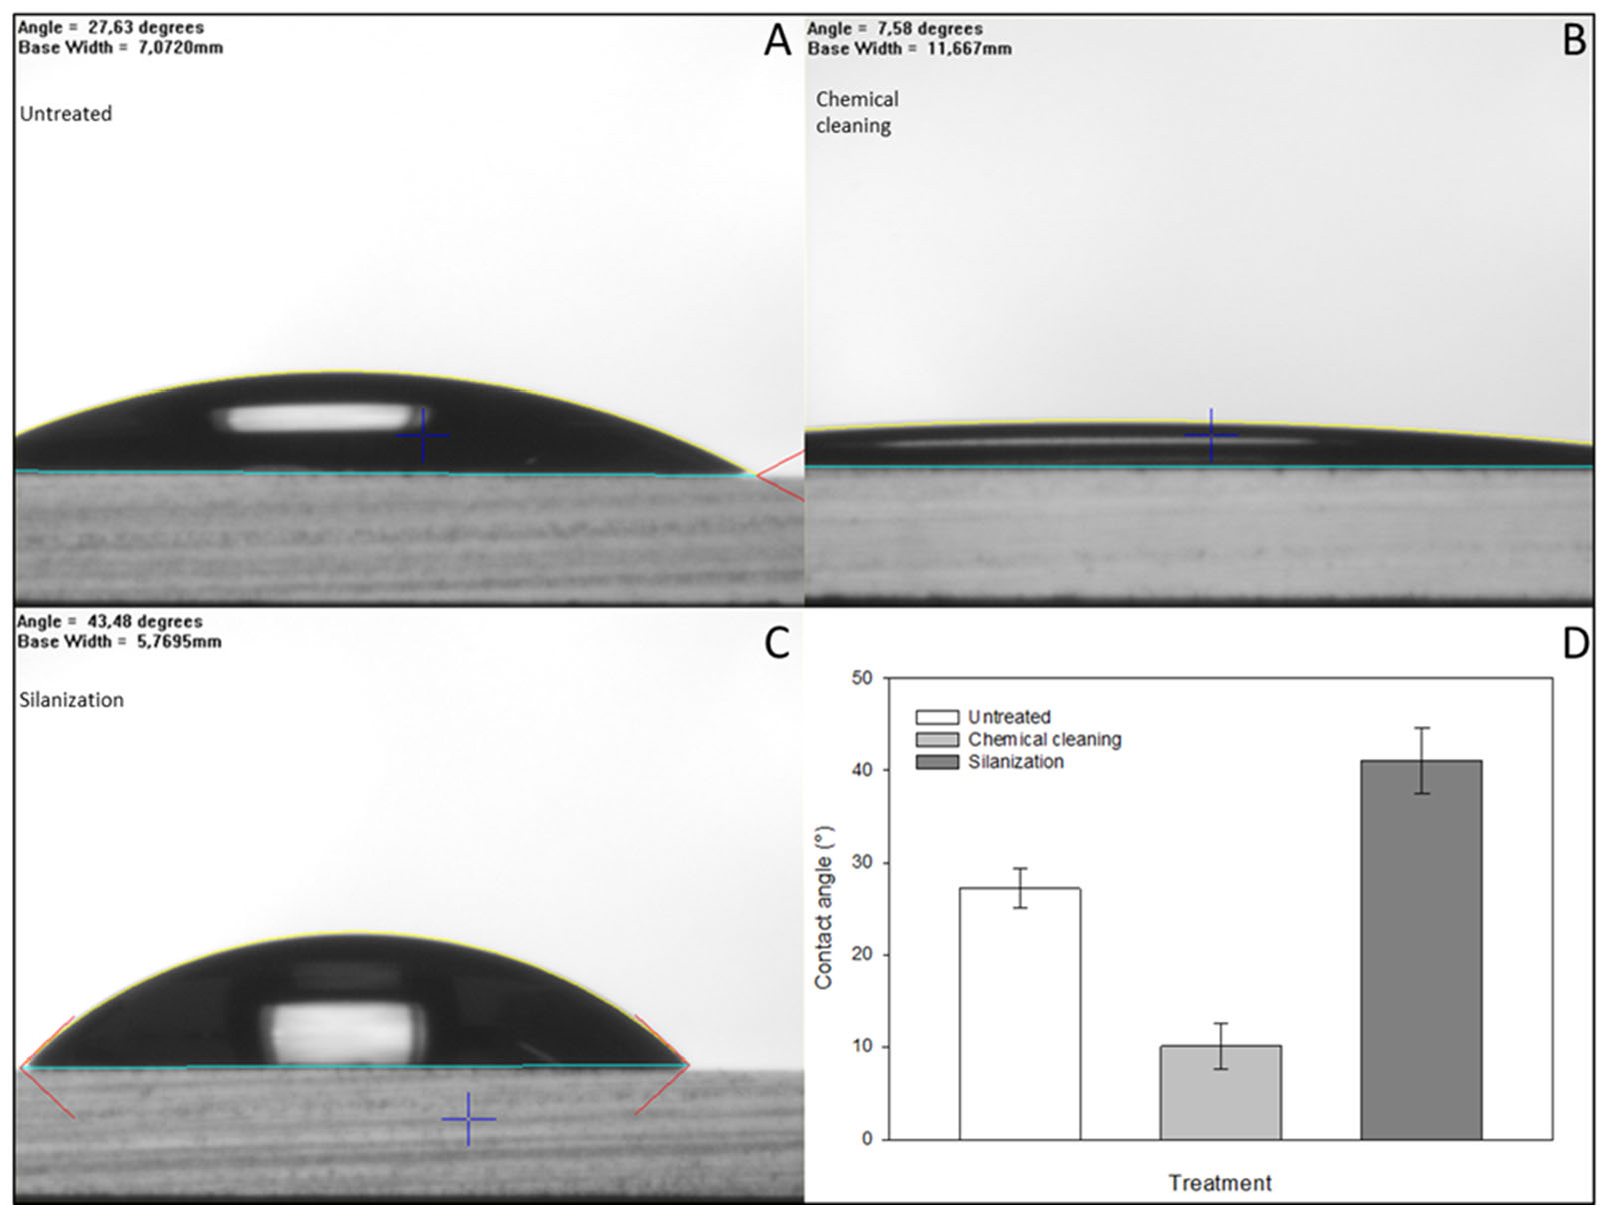
To achieve effective immobilization, the surface of the glass microbeads was pretreated to increase the number of the required reactive hydroxyl groups. Goniometry was used to determine the effect of the pretreatment by contact angle measurements of the hydrophobicity using flat-surface standard microscope slides. The results were evaluated using the FTA32 software. After incubating in a 1:1 cc. hydrochloric acid and methanol mixture for 30 min at room temperature to degrease their surface, the glass slides were treated with cc. sulfuric acid at room temperature for another 30 min. As the result of this two-step acidic treatment, the number of hydroxyl groups on the glass surface increased, proven by their higher hydrophilicity and significant decrease in the contact angle compared to the initial (untreated) state, as shown in Figure 4. The APTES molecules bind covalently to hydroxyl groups, increasing the hydrophobicity of the surface, resulting in higher contact angles compared to the chemically cleaned glass substrates. After each step of the chemical cleaning and silanization, the glass slides were air-dried under a laminar flow hood at room temperature to prevent further contamination prior to each contact angle measurement.
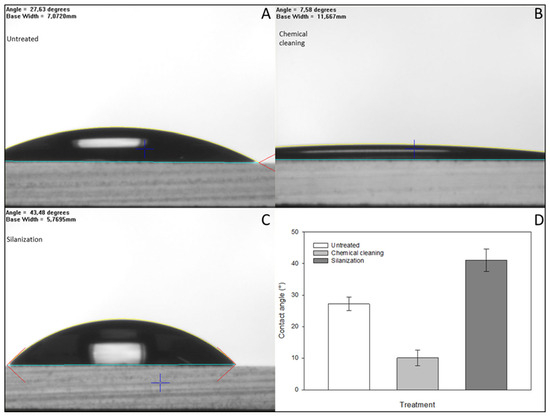
Figure 4.
Contact angle measurements were carried out to investigate the quality of the treated glass surface using standard microscope glass slides prepared specifically for goniometry. As a result of chemical cleaning, the number of hydroxyl groups increased on the surface, resulting in a significant decrease in the contact angles (Panels (A,B,D)). Subsequently, due to the hydrophobic property of the APTES molecules bound to the surface (Panel (C)), higher contact angles were observed compared to the initial state and chemically cleaned surfaces (Panels (C,D)). The error bars represent the standard deviations of triplicate experiments.
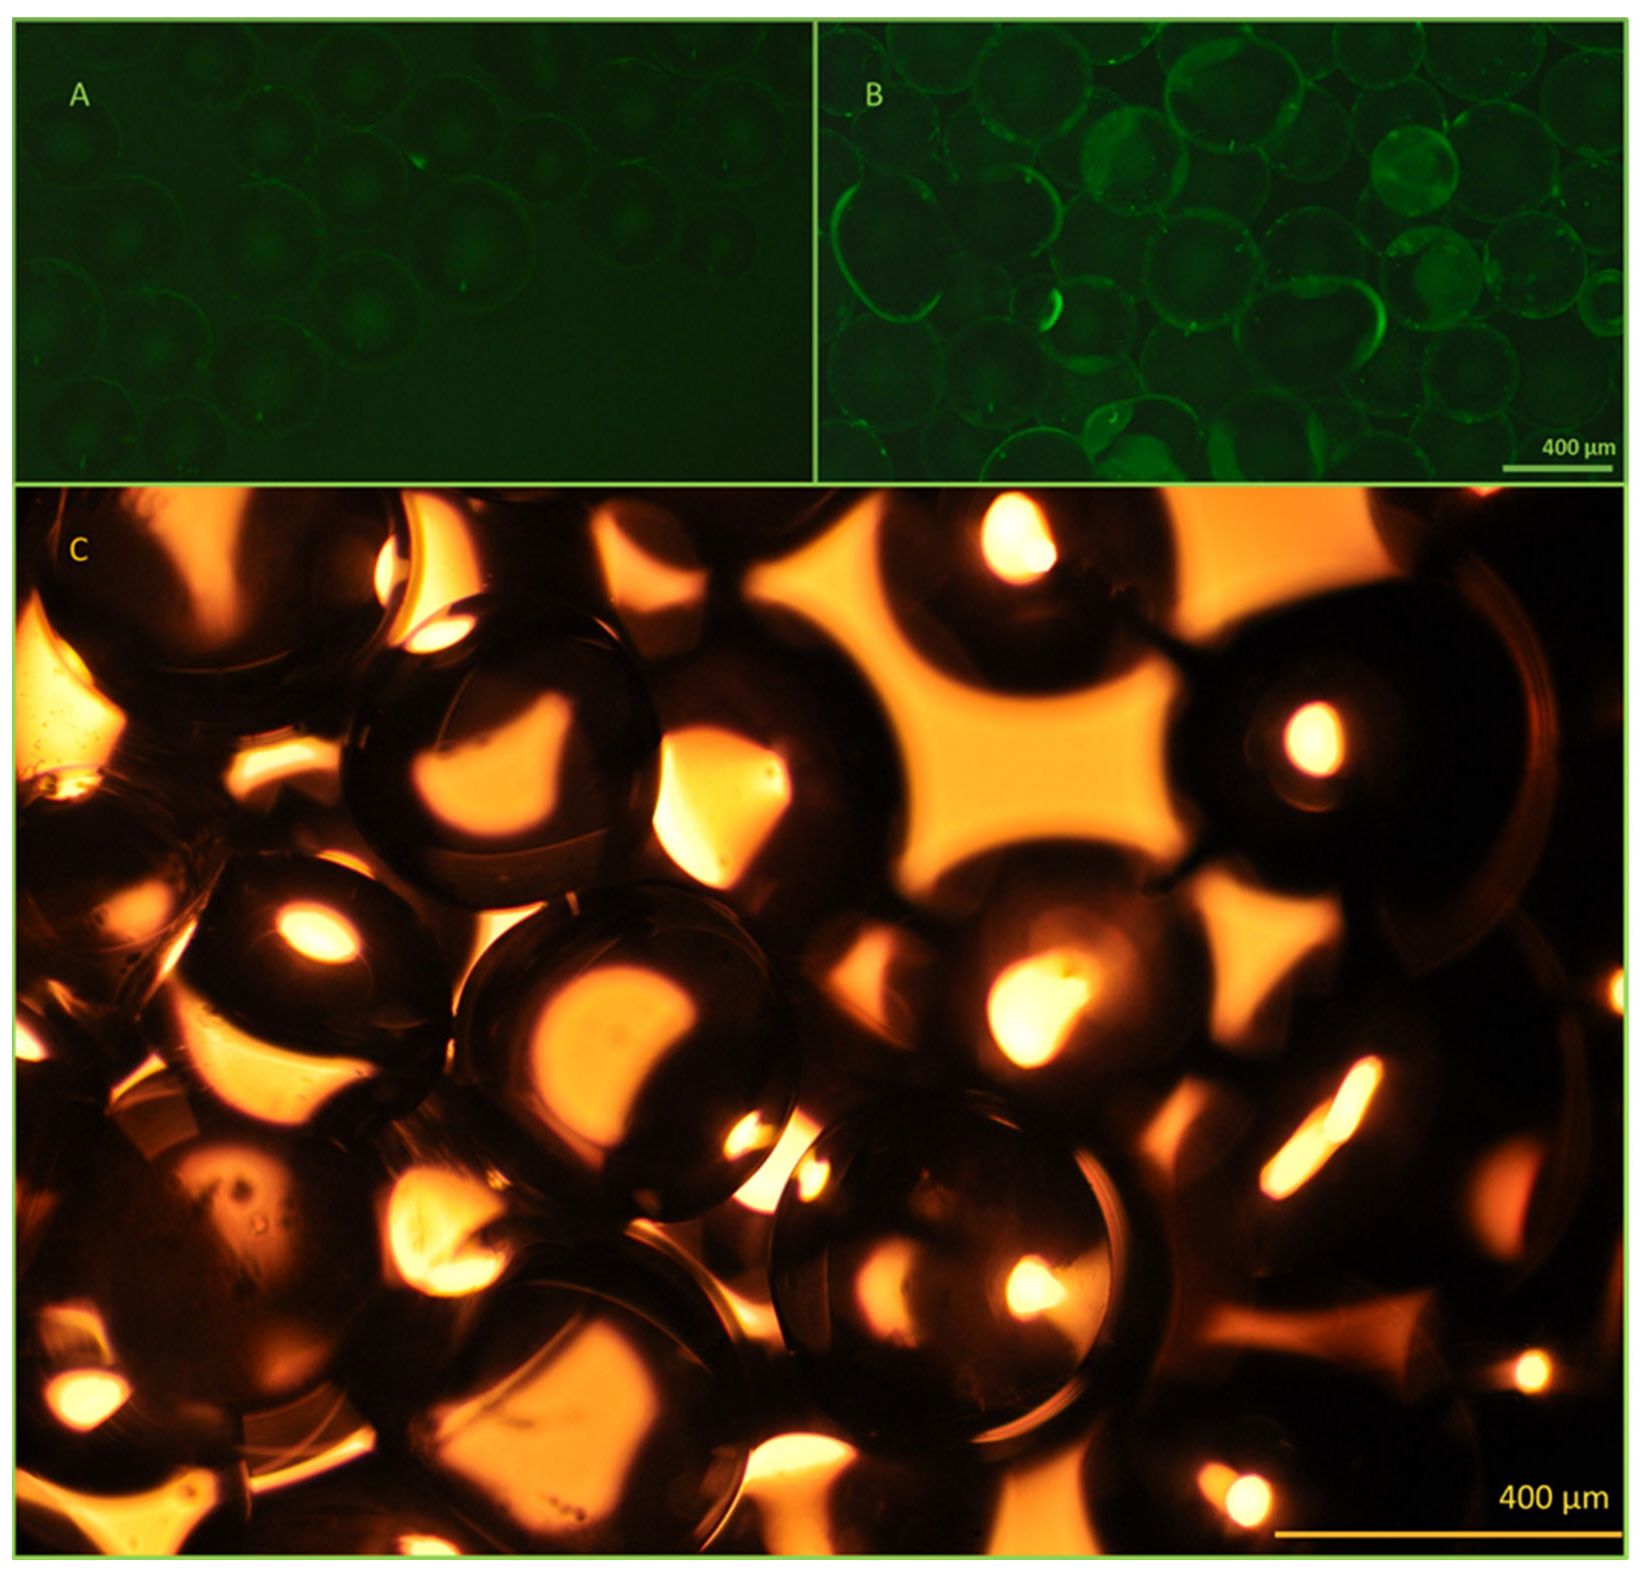
The antibody immobilization efficiency and bead functionality were investigated using fluorescent microscopy (Figure 5). Successful immobilization was confirmed using FITC-labeled anti-EpCAM antibodies. Fluorescence emission of the activated beads was clearly detectable compared to the control beads, containing only linkers on their surface.
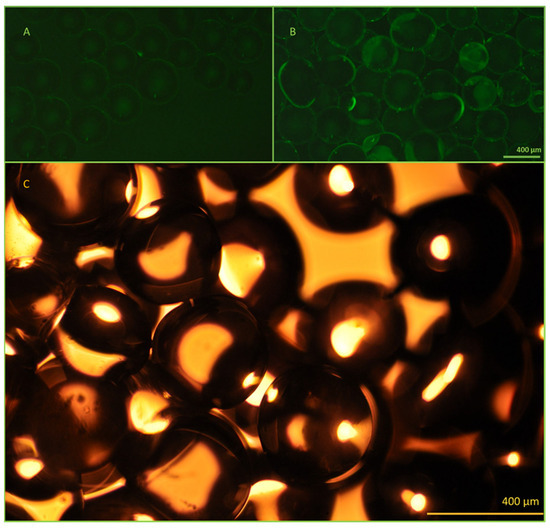
Figure 5.
Microscopic image evaluation of the active and control beads. The effectiveness of the immobilization method was evaluated using fluorescently labeled antibodies and fluorescent microscopy. The control beads (A), which contain only the linkers, do not show any fluorescence, while the activated beads (B) exhibit uniform fluorescence after the successful immobilization of FITC-conjugated anti-EpCAM mAbs. Panel (C): Bright field image of the 400 µm diameter beads utilized. All images were taken using a Nikon Eclipse Ni microscope with 10× lenses, equipped with an FITC (ex.: 475 nm/em.: 530 nm) band-pass filter cube and a Nikon d5600 DSLR camera.
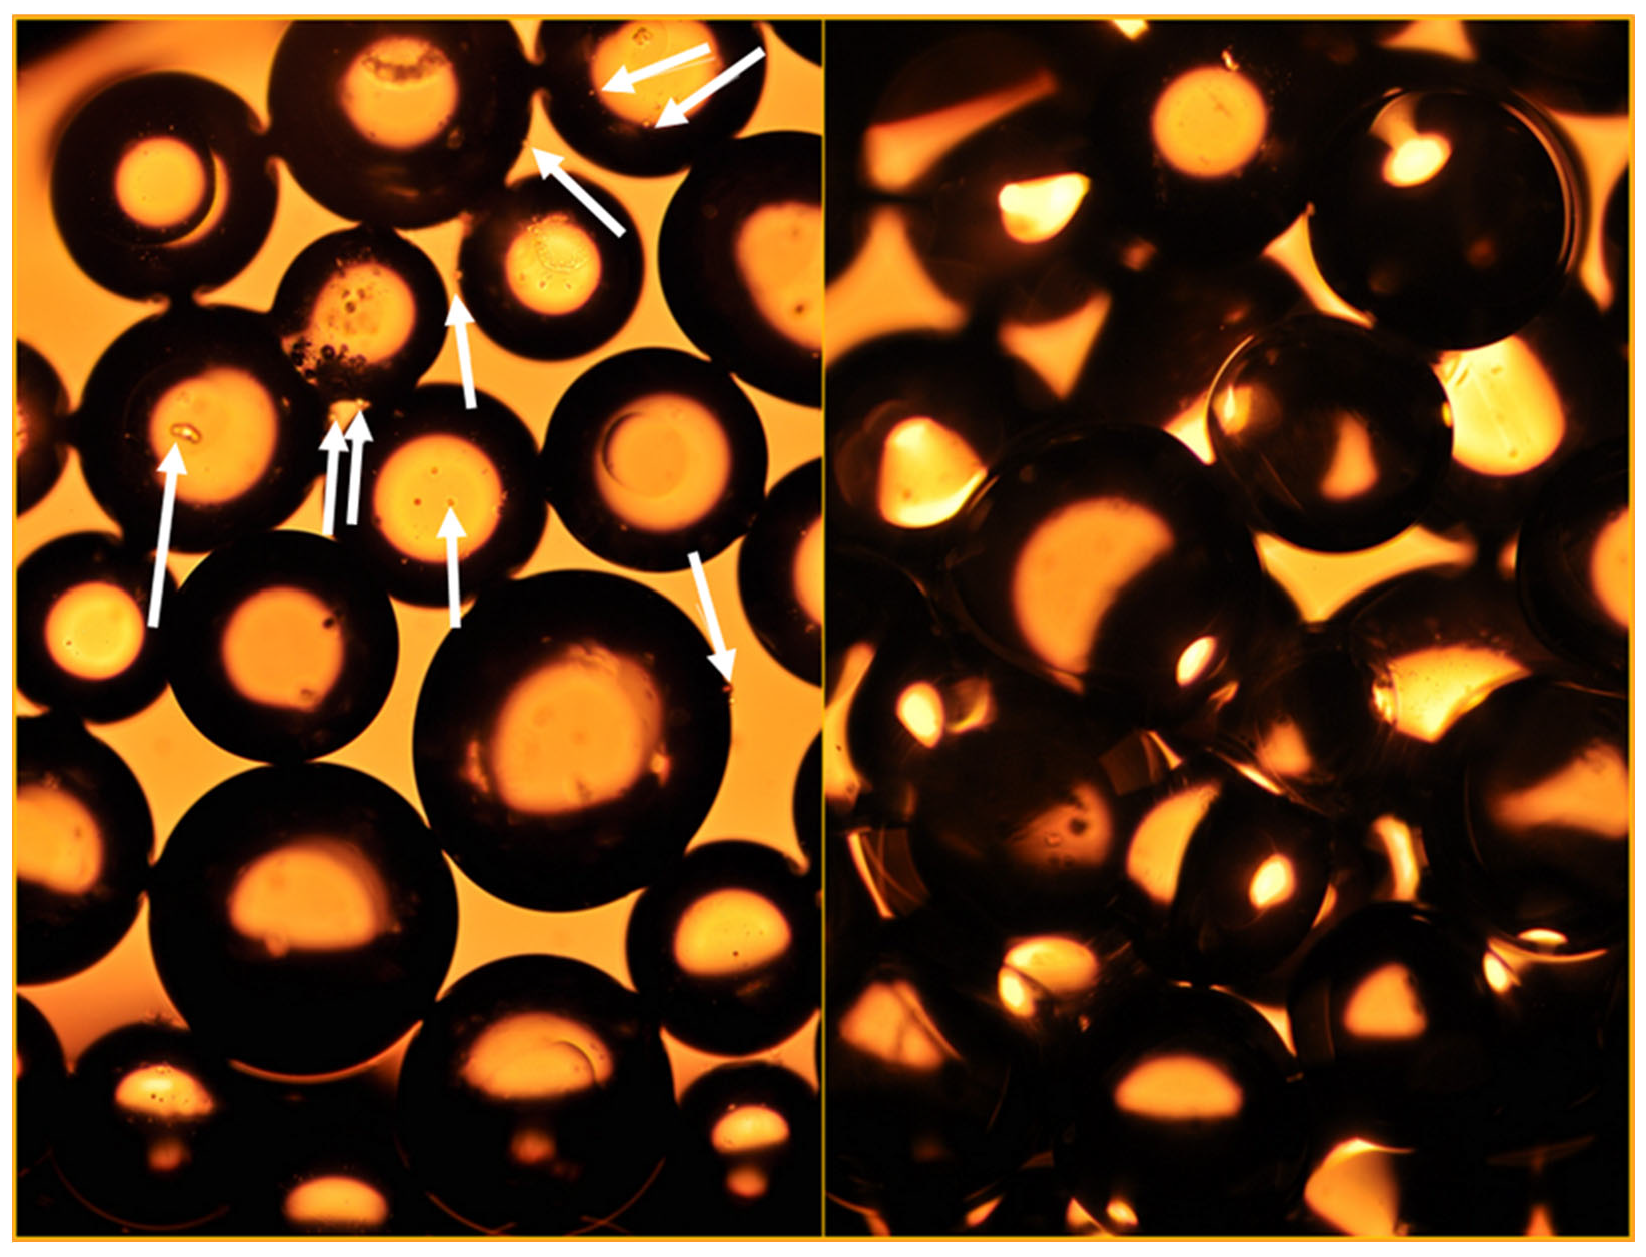
Trypsin-EDTA (1×) was used to release the captured cells from the active and control beads. Due to the compact size of the laboratory-scale cartridges, it was possible to elute all cells from the entire bead surface area; thus, the absolute cell count of the cartridges was readily determined (Figure 6).

Figure 6.
Bead surfaces were characterized by microscopy before (left) and after (right) incubation with 1× trypsin-EDTA to prove detachment of the captured cells. Bright field images were taken with a Nikon Eclipse Ni microscope, equipped with a Nikon d5600 DSLR camera, in 10× lenses. The arrows depict the captured cells.
The absolute cell count of the samples, obtained after the trypsin-EDTA wash of beads, was measured using flow cytometry, utilizing the FlowCount Fluorospheres internal standard. In this way, the specific capture of cells could be determined and used to characterize capture efficiency, calculated as follows. The difference in the number of cells released by the trypsin-EDTA wash of the antibody-containing and control beads refers to the number of cells specifically captured by the immobilized anti-EpCAM antibodies [captured cells (activated beads) − nonspecific capture (control beads)]. Cell counts were expressed in cells/g bead.
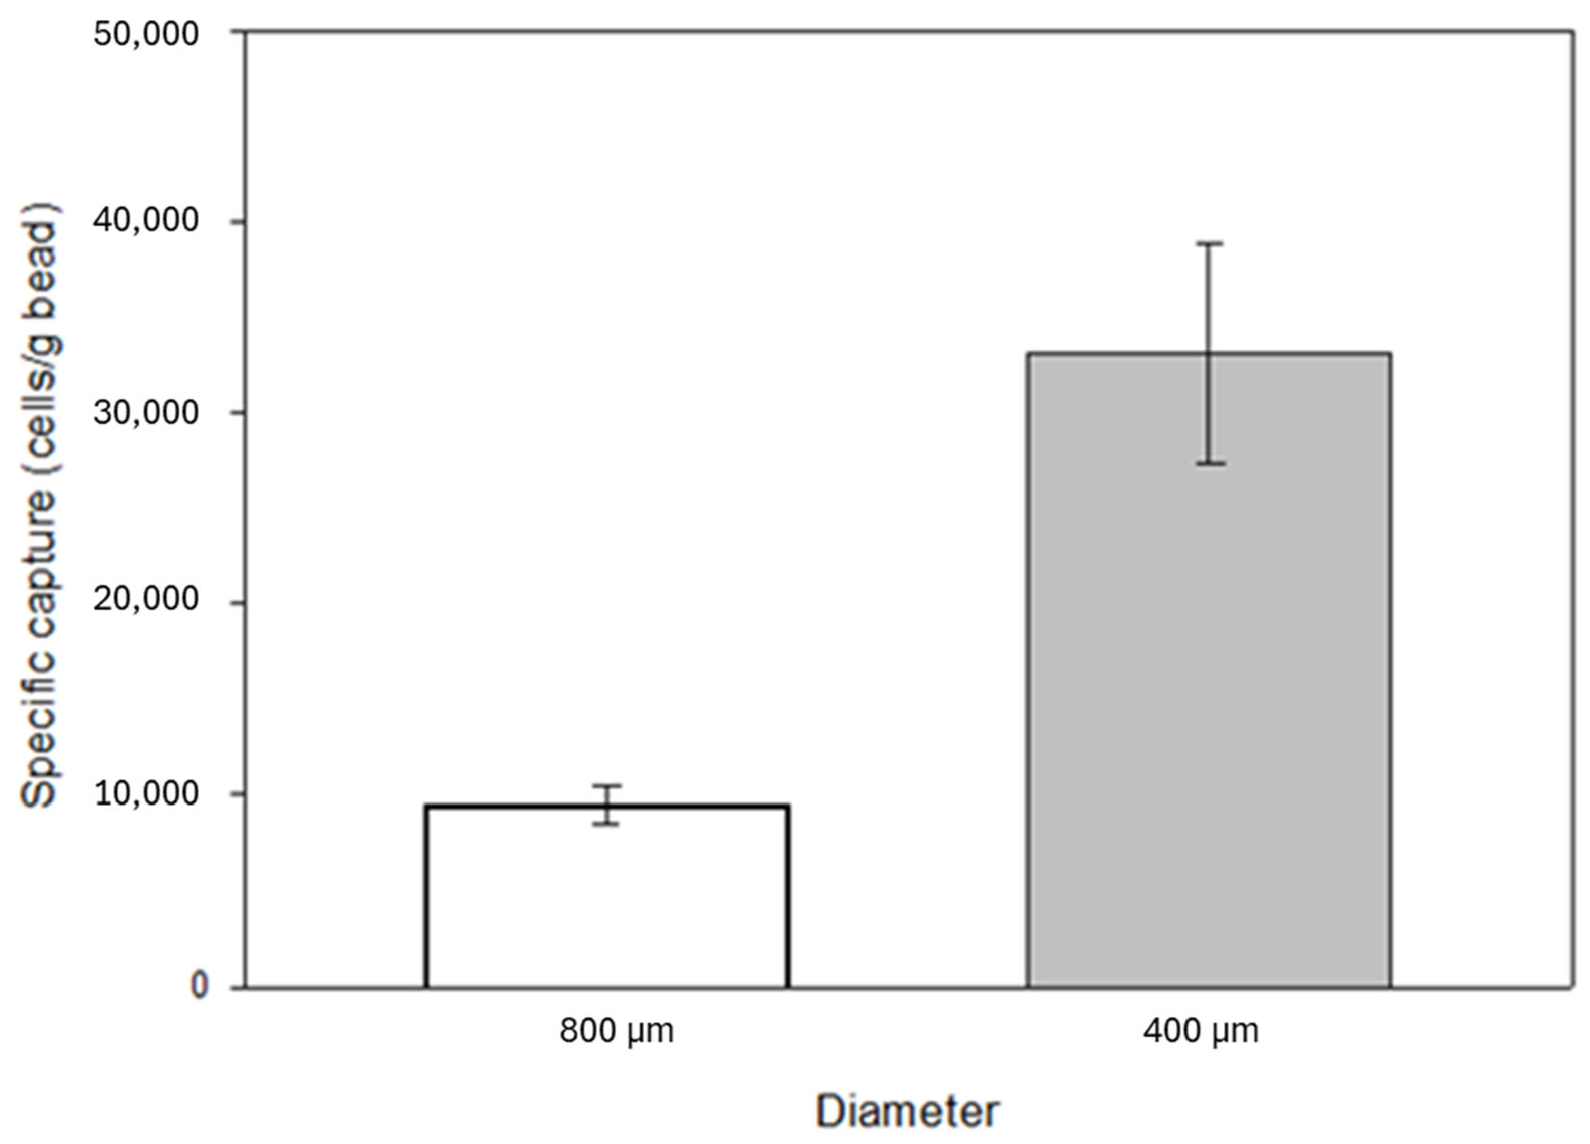
The surface-to-volume ratio of the substrates affects the degree of both specific and non-specific binding. A decrease in bead size, i.e., an increase in surface-to-volume ratio, was also investigated by capture experiments. The filling weight of the identical laboratory scale cartridges was 3.5 g in the case of 800 µm diameter beads and 4 g in the case of 400 µm diameter beads. A significant increase in specific capture was observed with increased surface area, from an average of 34,000 cells to over 130,000 cells with a 5 mL/min flow rate. The laboratory-scale cartridge contained approximately 2.6 cm3 glass beads (the effective volume of the beads is 58% of the total cartridge volume). It is important to note that 7.5 mL blood of an average cancer patient contains ~5 CTCs in case of a poor prognosis [45,46,47], which is significantly lower than the expected capturing capability of the anti-EpCAM mAb immobilized glass beads reported above. Based on the cell concentration in the eluted samples, the percentage of captured cells relative to the total number of cells introduced into the model system was 6% and 24% when using 800 μm and 400 μm beads, respectively. Based on these results, the experiments were further continued with 400 µm diameter beads (Figure 7).
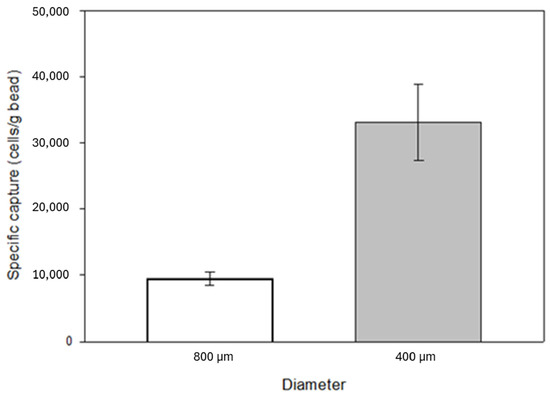
Figure 7.
Effect of the increased specific surface area due to the reduction in the grain size of the glass beads on the number of specifically captured cells from the model system. The decrease in bead size, i.e., the increase in the surface-to-volume ratio, showed a positive effect on specific capture, which increased by about 74%. The error bars represent the standard deviation of triplicate experiments.
For the verification of the utilized control samples, additional experiments employing control beads coated with human IgG (HuIgG) were carried out. The specific capture rate was ~36,665 cells per gram of beads, which did not show a significant difference compared to the cell counts observed in experiments utilizing linker-only beads. Based on these findings, it was concluded that control beads containing only linkers were suitable for determining specific cell capture.
The shear stress caused by increasing fluid flow rates can also affect the cell capture ability of the glass substrate; thus, specific capture of the activated beads was investigated at different linear flow velocities. The calculated linear velocities and flow rates are shown in Figure 8. Please note that the specific capture was elevated with increasing linear flow velocity, most likely caused by the reduction of non-specific binding of cells due to weaker stringency [48,49]. Cells were still able to specifically (immuno-affinity) bind to the immobilized anti-EpCAM mAb molecules at higher flow rates.
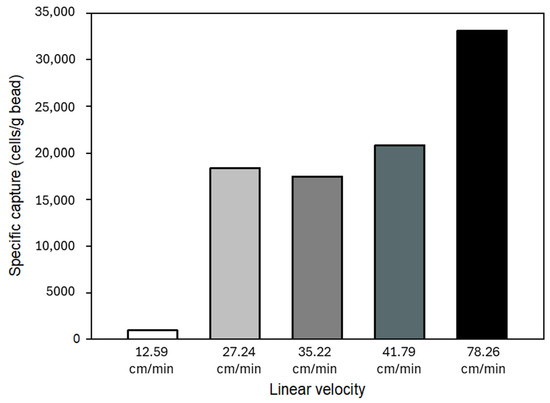
Figure 8.
Effect of linear flow velocity on specific (immunoaffinity) capture in the model system. Increasing the flow rate reduced non-specific binding; thus, higher specific capture was achieved.
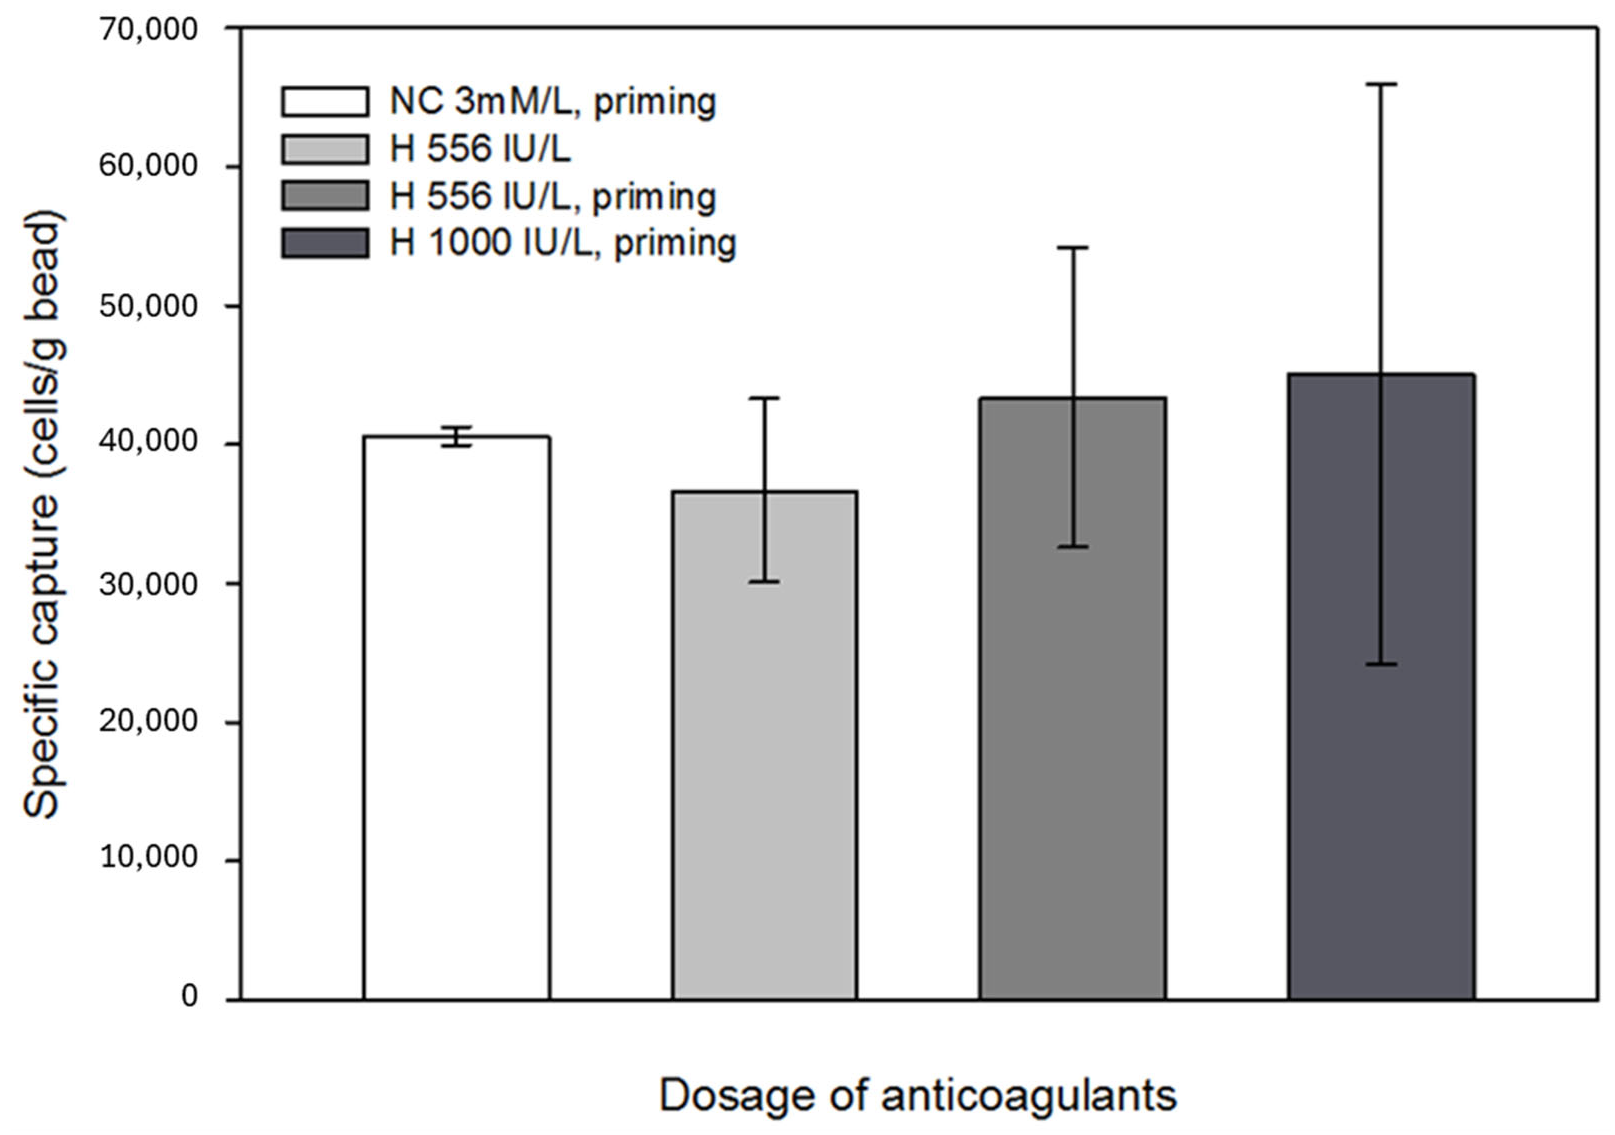
Anticoagulants, such as heparin, might affect antigen-antibody binding; thus, the possible interaction between the immobilized antibodies and anticoagulants was also investigated [50,51]. It was concluded that anticoagulants did not unfavorably affect the specific capture efficiency; however, with increasing heparin concentration, the results of parallel capture experiments showed a large variance. Since the beads still captured a sufficient number of cells from the in vitro circulation system, this phenomenon was considered negligible in terms of the efficiency of the technology. No significant effects were observed when Na-citrate with heparin pretreatment was applied (Figure 9). Based on the results of the eluted samples obtained during the experiments, where the effect of anticoagulants on specific cell capture was investigated, the percentage of captured cells relative to the total number of cells introduced into the model system was 27–30%.
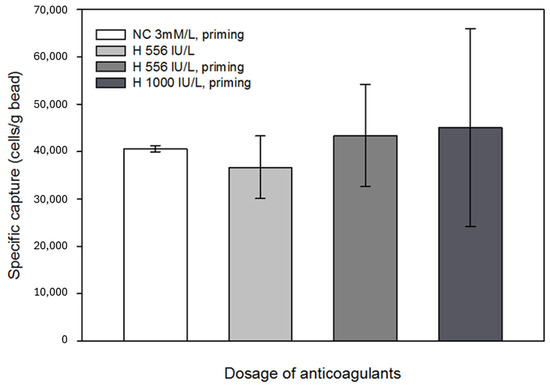
Figure 9.
Effect of the anticoagulants administered to the laboratory-scale model system on cell capture. Anticoagulation experiments confirmed that the use of Na-citrate and LMWH did not adversely affect the function of the beads. The error bars represent the standard deviation of triplicate experiments.
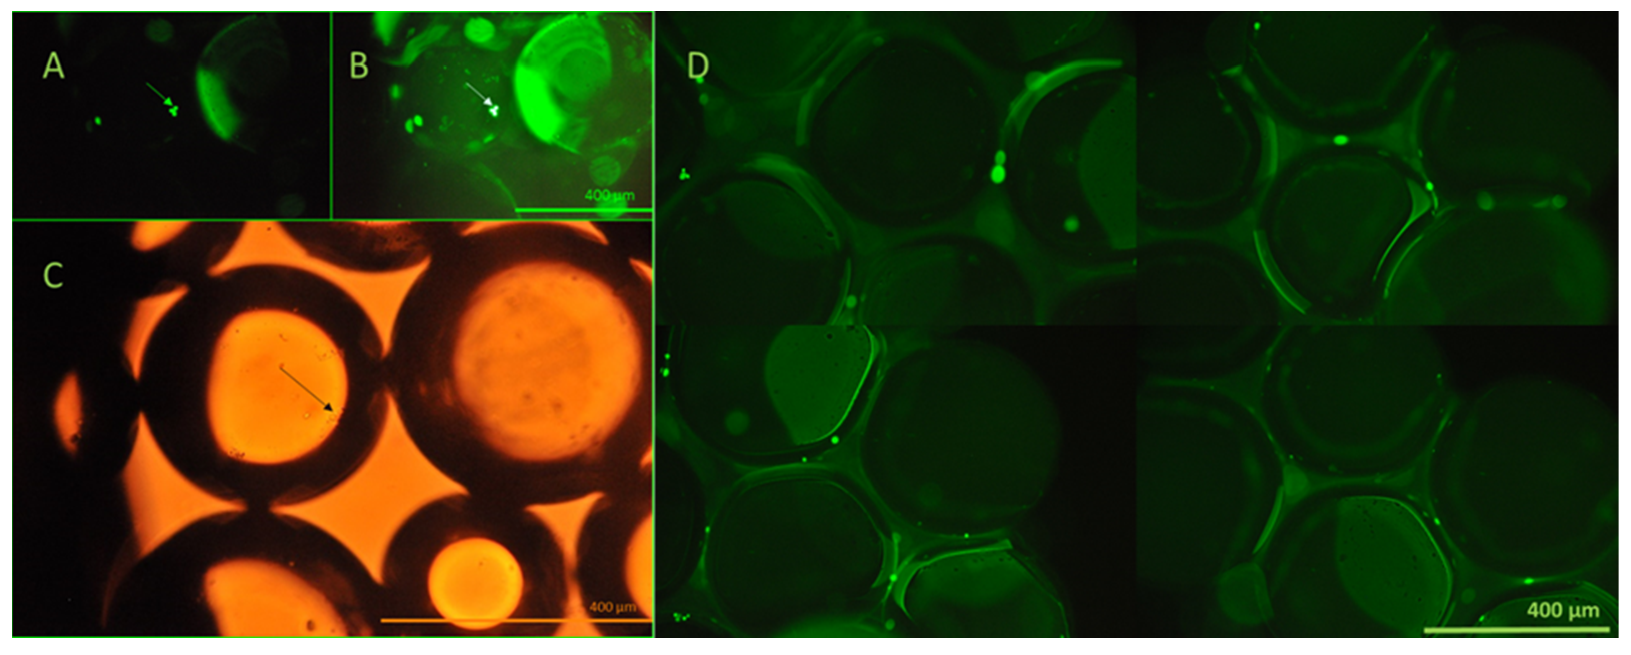
The viability of the captured cells was investigated using calcein AM assay and fluorescent microscopy. Viable cells transform membrane-permeable, non-fluorescent calcein AM to fluorescent calcein by their esterase activity. The viability of the captured cells is clearly demonstrated by their emitted fluorescence, as shown in Figure 10.

Figure 10.
Fluorescent and brightfield microscopy evaluation of the viability of the captured cells. Non-labeled HCT116 cells, which did not express GFP, were utilized for this experiment, concerning the similar green fluorescence of calcein. In panels (A–C), the arrows depict the same group of captured cells visualized using both fluorescence and brightfield microscopy following calcein AM staining. Panel (D) illustrates viable cells retained on the bead surface, as evidenced by green fluorescence resulting from intracellular esterase activity. Calcein AM staining was performed directly on the beads immediately after cell capture from the continuous-flow stream. Based on this method, the results demonstrated the preservation of cell viability during the process. All images were taken using a Nikon Eclipse Ni microscope in 20× lenses, equipped with an FITC (ex.: 475 nm/em.: 530 nm) band-pass filter cube.
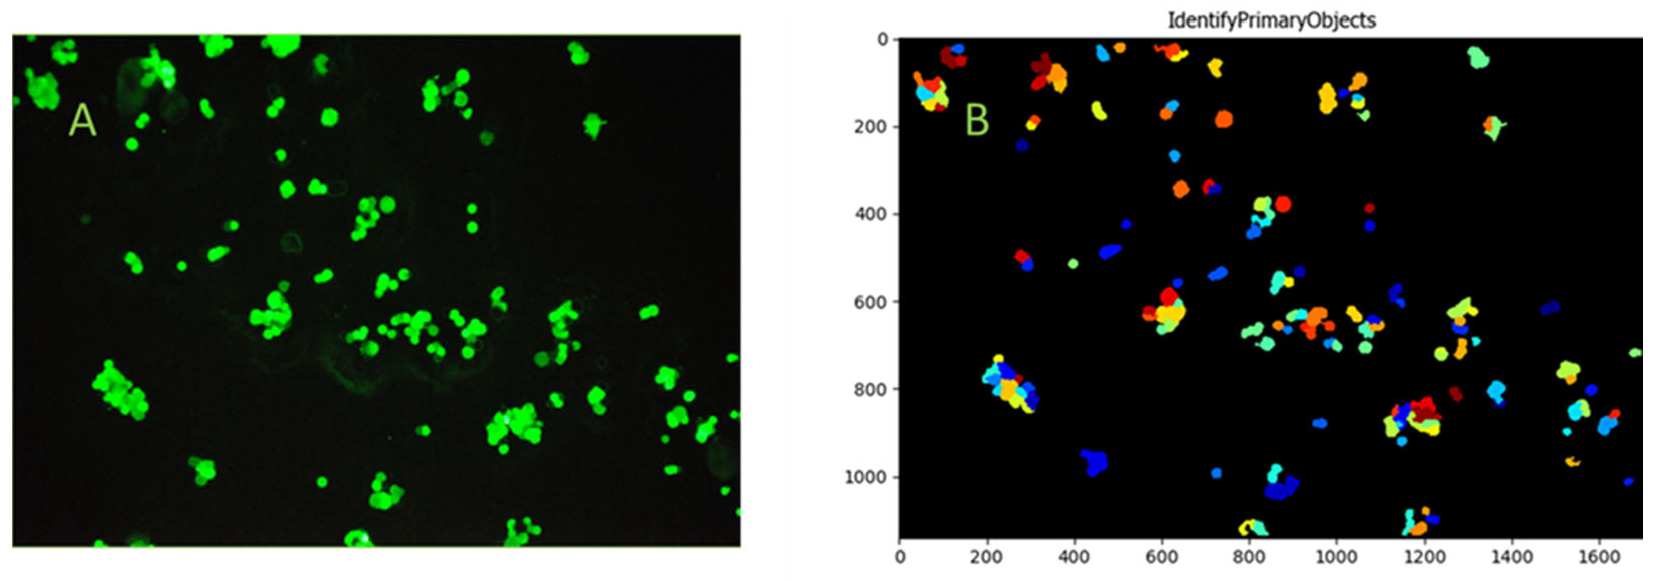
To enable visualization and microscopy evaluation of the HCT116 cells captured from blood and the non-specific binding of blood cellular elements on bioactive glass surfaces, cells were captured utilizing bioactive glass slides within the continuous flow system. Fifteen milliliters of blood from a healthy volunteer was spiked with HCT116 cells at an average concentration of 18 cells/µL, consistent with the bead capture experiments. Images of the captured FITC-anti-EpCAM-labeled cells were taken after thorough microscopic examination of the entire active slide surface. The CellProfiler software was used to identify the adhered HCT116 cells, captured from whole blood. Based on the images taken during microscopic evaluation, the capture of single HCT116 cells and HCT116 cell clusters from whole blood were observed (Figure 11). More importantly, no significant non-specific binding of blood cellular elements was detected during microscopic evaluation.

Figure 11.
Identification of the adhered cells and cell clusters on the microscope slide surface using FITC-anti-EpCAM labeling and microscope photography (Panel (A)). HCT116 cells were identified using the CellProfiler software. The ColorToGray module was used to convert color images to grayscale, followed by Gaussian smoothing to reduce noise. The IdentifyPrimaryObjects module detected cells based on their size (Panel (B)). The different colors displayed in the IdentifyPrimaryObjects module of the CellProfiler on Panel (B) are primarily for visualization purposes and to help identify and differentiate each particular object.
4. Conclusions
In this study, we demonstrated the feasibility of immobilizing human anti-EpCAM antibodies onto the surface of glass beads for selective capture of circulating tumor cells, with the goal of further developing an approach to remove CTCs from complex biological samples. It was demonstrated that the in vitro circulation model setup using EpCAM-positive HCT116 cell-spiked model fluid was appropriate for testing and proving the functional feasibility of the proposed technology. Combining the high surface-to-volume ratio of microfluidic devices and appropriate flow conditions enabled the processing of larger blood volumes along with efficient capture of target cells. This technology, which incorporated bioactive bead-filled cartridges into a flow-capture system, ensured that the entire volume of fluid interacted with the available surface area. In this way, the technique effectively addressed the challenges associated with limited sample volumes and the heterogeneous distribution of circulating tumor cells (CTCs) in the bloodstream. By scaling up to volumes comparable to standard blood donations and considering an estimated concentration of 5 CTCs per 7.5 mL, the method may yield a 50-fold increase in the number of CTCs available for analysis. Following cell capture, enzymatic detachment yielded a concentrated suspension of eluted cells in a minimal volume, thereby significantly increasing the concentration of CTCs in the final sample. In combination with widely used analytic methods, such as FACS or ddPCR, after further development, this technique could later be easily applied in clinical settings.
Microscopic evaluation of bioactive glass slides proves the feasibility of cell capture from human whole blood in continuous flow. No significant binding of the cellular elements in blood was observed in the microscopic examination, due to polyethylene glycol treatment of the active surface. Based on these findings, it can be concluded that the samples are likely to require minimal preparation before application. Therefore, after further development, the method will probably be easily automatable, which will facilitate its introduction into cancer research and clinical settings.
Based on the contact angle measurements results, it was proven that chemical cleaning with 1:1 hydrochloric acid and methanol mixture and cc. sulfuric acid significantly increased the hydrophilicity of the glass surfaces, and the pretreated substrates contained an appropriate amount of hydroxyl groups on their surface, making them suitable for high silanization rate and protein immobilization. FITC-conjugated anti-EpCAM mAb molecules were successfully utilized to test the immobilization method. Emitted green fluorescence of the active glass surfaces, observed during fluorescent microscopy, demonstrated successful covalent immobilization of the antibodies. The capture ability of the bioactive glass surface in the model system reached over 130,000 cells/cartridge at an optimized flow rate of 5 mL/min.
The capture performance obtained with the use of bioactive glass microbeads was significantly higher than that required in the case of any cell isolation method currently applied in clinical practice. Our experiments also demonstrated that commonly applied anticoagulants did not adversely affect the efficiency of cell capture. All experimental parameters, including the dimensions of the laboratory-scale cartridge, linear flow velocities, and the dosage of anticoagulants, were determined according to clinical recommendations; thus, the results can be readily applied to design a device for diagnostic purposes. Alternatively, for additional treatment in combination with systemic therapy, the substrate can be used in hemoperfusion devices that are fully compatible with currently used hospital equipment and drugs. In addition, the substrate is produced by using a very simple covalent immobilization method; therefore, its industrial-scale production could be easily implemented. Glass is biocompatible, chemically resistant, and cost-effective, properties that make it particularly advantageous in the pharmaceutical and biotechnology sectors, where there is a growing demand for cost-effective and biocompatible materials. It is important to emphasize that the anti-EpCAM antibodies used in this study can be substituted with a wide range of immune-affinity molecules, such as other specific antibodies, nanobodies, aptamers, lectins, nucleotides, peptides, or a combination of these, making this platform technology adaptable and customizable for various applications. This flexibility allows the substrate to be tailored for personalized diagnostics and precision medicine, depending on specific clinical or research needs. Additionally, the captured cells remain viable throughout the process and can be efficiently detached from the surface of the beads using trypsin-EDTA treatment. This enables the cells to be further analyzed through various omics techniques, including genomic, transcriptomic, proteomic, glycomic, etc., assays, as well as pathology studies, thereby offering a valuable tool for in-depth investigation into cellular behavior, disease mechanisms, and potential therapeutic interventions. In the next phase of our research, we plan to develop analytical methods that focus on capturing target cells at lower cell concentrations, aiming to accurately quantify the number of captured cells with enhanced sensitivity and precision.
During the design of the immunoaffinity-based capture device, high-throughput processing was prioritized while ensuring the preservation of cellular integrity. The selected bead size, combined with an optimized flow rate of 78.26 cm/min, enables the efficient handling of substantial volumes of whole blood without necessitating prior sample preparation. This configuration not only enhances processing efficiency but also maintains cell viability, making it suitable for applications requiring gentle treatment of blood components. Furthermore, the device’s design allows for its integration into hemoperfusion systems, effectively serving as a filling material within hemoperfusion cartridges for extracorporeal blood purification therapies. This adaptability underscores its potential utility in clinical settings, where rapid and safe blood processing is essential.
In summary, a novel, high-capacity microbead-based separation method was developed, which combined the high surface-to-volume ratio of glass bead substrates with optimized flow dynamics to facilitate the efficient capture of target cells from larger blood volumes. This design alleviated the limitations of small sample volumes and the heterogeneous distribution of circulating tumor cells (CTCs) in the bloodstream, enhancing the likelihood of detecting rare cells. The simplicity of the platform requires minimal sample preparation, making it well suited for clinical applications. Glass beads, known for their biocompatibility and cost-effectiveness, serve as the foundation of this system, aligning with the pressing needs in biomedical engineering for scalable and affordable solutions. Moreover, the compatibility of the platform with various binding molecules allows for easy customization to target different cell types. Importantly, the captured cells remain viable post-capture, enabling a range of downstream analyses, including molecular profiling and functional assays. This viability ensures that the platform can be integrated into existing diagnostic workflows, offering a versatile tool for both research and clinical settings.
Author Contributions
D.S. designed and performed the experiments and analyzed the data. A.G. and L.T. conceived the presented idea. D.S. took the lead in writing the manuscript. J.T., L.T. and A.G. provided critical feedback and helped shape the manuscript. A.G. and P.S. supervised the project. All authors have read and agreed to the published version of the manuscript.
Funding
The authors gratefully acknowledge the grants of the National Research, Development, and Innovation Office #2021-1.1.4-GYORSÍTÓSÁV-2022-00038, National Laboratories Excellence program, under the National Tumor Biology Laboratory Project #NLP-17, 2022-2.1.1-NL-2022-00010, the Hungarian Thematic Excellence Program project #TKP2021-EGA-44, and the ATBG Korea V4 joint project #2023-1.2.1-ERA_NET-2023-00015. This work was also supported by the University of Debrecen Program for Scientific Publications.
Institutional Review Board Statement
The study was conducted according to the guidelines of the Declaration of Helsinki and approved by the Ethics Committee of Medical Research Council of University of Debrecen (protocol code 6152-2024 approved on 19 October 2024).
Informed Consent Statement
Informed consent was obtained from all individual participants included in the study.
Data Availability Statement
The datasets analyzed during the current study are available from the corresponding author on reasonable request.
Acknowledgments
The kind help of Szabolcs Tamás Nagy of the Hungarian University of Agriculture and Life Sciences with the evaluation of the flow cytometry measurements is gratefully recognized. This is contribution #207 of the Horváth Csaba Memorial Laboratory of Bioseparation Sciences.
Conflicts of Interest
P.S. and A.G. are shareholders of CAPTEC Medical Ltd. CAPTEC did not have any specific role in the conceptualization, design, data collection, analysis, decision to publish, or preparation of the manuscript.
Abbreviations
The following abbreviations are used in this manuscript:
| CTC | Circulating tumor cell |
| PBS | Phosphate buffered saline |
| FBS | Fetal bovine serum |
| APTES | 3-Aminopropyltriethoxysilane |
| FITC | Fluorescein isothiocyanate |
| MeOH | Methanol |
| EtOH | Ethanol |
| PEG | Polyethylene glycol |
| LMWH | Low molecular weight heparin |
| FSC | Forward scatter |
| SSC | Side scatter |
| mAb | Monoclonal antibody |
References
- Eddy, K.; Shah, R.; Chen, S. Decoding Melanoma Development and Progression: Identification of Therapeutic Vulnerabilities. Front. Oncol. 2021, 10, 626129. [Google Scholar] [CrossRef] [PubMed]
- Schuster, E.; Taftaf, R.; Reduzzi, C.; Albert, M.K.; Romero-Calvo, I.; Liu, H. Better together: Circulating tumor cell clustering in metastatic cancer. Trends Cancer 2021, 7, 1020–1032. [Google Scholar] [CrossRef] [PubMed]
- Deng, Z.; Wu, S.; Wang, Y.; Shi, D. Circulating tumor cell isolation for cancer diagnosis and prognosis. eBioMedicine 2022, 83, 104237. [Google Scholar] [CrossRef] [PubMed]
- Aceto, N. Bring along your friends: Homotypic and heterotypic circulating tumor cell clustering to accelerate metastasis. Biomed. J. 2020, 43, 18–23. [Google Scholar] [CrossRef]
- Pouyiourou, M.; Bochtler, T.; Coith, C.; Wikman, H.; Kraft, B.; Hielscher, T.; Stenzinger, A.; Riethdorf, S.; Pantel, K.; Krämer, A. Frequency and Prognostic Value of Circulating Tumor Cells in Cancer of Unknown Primary. Clin. Chem. 2024, 70, 297–306. [Google Scholar] [CrossRef]
- Kapeleris, J.; Kulasinghe, A.; Warkiani, M.E.; Vela, I.; Kenny, L.; O’Byrne, K.; Punyadeera, C. The Prognostic Role of Circulating Tumor Cells (CTCs) in Lung Cancer. Front. Oncol. 2018, 8, 311. [Google Scholar] [CrossRef]
- Jansson, S.; Bendahl, P.-O.; Larsson, A.-M.; Aaltonen, K.E.; Rydén, L. Prognostic impact of circulating tumor cell apoptosis and clusters in serial blood samples from patients with metastatic breast cancer in a prospective observational cohort. BMC Cancer 2016, 16, 433. [Google Scholar] [CrossRef]
- Papadaki, M.A.; Koutsopoulos, A.V.; Tsoulfas, P.G.; Lagoudaki, E.; Aggouraki, D.; Monastirioti, A.; Koutoulaki, C.; Apostolopoulou, C.A.; Merodoulaki, A.C.; Papadaki, C.; et al. Clinical Relevance of Immune Checkpoints on Circulating Tumor Cells in Breast Cancer. Cancers 2020, 12, 376. [Google Scholar] [CrossRef]
- Murlidhar, V.; Reddy, R.M.; Fouladdel, S.; Zhao, L.; Ishikawa, M.K.; Grabauskiene, S.; Zhang, Z.; Lin, J.; Chang, A.C.; Carrott, P.; et al. Poor Prognosis Indicated by Venous Circulating Tumor Cell Clusters in Early-Stage Lung Cancers. Cancer Res. 2017, 77, 5194–5206. [Google Scholar] [CrossRef]
- Vasseur, A.; Kiavue, N.; Bidard, F.-C.; Pierga, J.-Y.; Cabel, L. Clinical utility of circulating tumor cells: An update. Mol. Oncol. 2021, 15, 1647–1666. [Google Scholar] [CrossRef]
- Ignatiadis, M.; Sledge, G.W.; Jeffrey, S.S. Liquid biopsy enters the clinic—Implementation issues and future challenges. Nat. Rev. Clin. Oncol. 2021, 18, 297–312. [Google Scholar] [CrossRef] [PubMed]
- Castro-Giner, F.; Aceto, N. Tracking cancer progression: From circulating tumor cells to metastasis. Genome Med. 2020, 12, 31. [Google Scholar] [CrossRef]
- Ring, A.; Nguyen-Sträuli, B.D.; Wicki, A.; Aceto, N. Biology, vulnerabilities and clinical applications of circulating tumour cells. Nat. Rev. Cancer 2023, 23, 95–111. [Google Scholar] [CrossRef]
- Zhang, H.; Lin, X.; Huang, Y.; Wang, M.; Cen, C.; Tang, S.; Dique, M.R.; Cai, L.; Luis, M.A.; Smollar, J.; et al. Detection Methods and Clinical Applications of Circulating Tumor Cells in Breast Cancer. Front. Oncol. 2021, 11, 652253. [Google Scholar] [CrossRef]
- Habli, Z.; AlChamaa, W.; Saab, R.; Kadara, H.; Khraiche, M.L. Circulating Tumor Cell Detection Technologies and Clinical Utility: Challenges and Opportunities. Cancers 2020, 12, 1930. [Google Scholar] [CrossRef]
- Heidrich, I.; Ačkar, L.; Mossahebi Mohammadi, P.; Pantel, K. Liquid biopsies: Potential and challenges. Int. J. Cancer 2021, 148, 528–545. [Google Scholar] [CrossRef] [PubMed]
- Alix-Panabières, C.; Pantel, K. Circulating Tumor Cells: Liquid Biopsy of Cancer. Clin. Chem. 2013, 59, 110–118. [Google Scholar] [CrossRef] [PubMed]
- Russano, M.; Napolitano, A.; Ribelli, G.; Iuliani, M.; Simonetti, S.; Citarella, F.; Pantano, F.; Dell’Aquila, E.; Anesi, C.; Silvestris, N.; et al. Liquid biopsy and tumor heterogeneity in metastatic solid tumors: The potentiality of blood samples. J. Exp. Clin. Cancer Res. 2020, 39, 95. [Google Scholar] [CrossRef]
- Gilson, P.; Merlin, J.-L.; Harlé, A. Deciphering Tumour Heterogeneity: From Tissue to Liquid Biopsy. Cancers 2022, 14, 1384. [Google Scholar] [CrossRef]
- Crocetto, F.; Russo, G.; Di Zazzo, E.; Pisapia, P.; Mirto, B.F.; Palmieri, A.; Pepe, F.; Bellevicine, C.; Russo, A.; La Civita, E.; et al. Liquid Biopsy in Prostate Cancer Management—Current Challenges and Future Perspectives. Cancers 2022, 14, 3272. [Google Scholar] [CrossRef]
- Alba-Bernal, A.; Lavado-Valenzuela, R.; Domínguez-Recio, M.E.; Jiménez-Rodriguez, B.; Queipo-Ortuño, M.I.; Alba, E.; Comino-Méndez, I. Challenges and achievements of liquid biopsy technologies employed in early breast cancer. eBioMedicine 2020, 62, 103100. [Google Scholar] [CrossRef] [PubMed]
- Pinzani, P.; D’Argenio, V.; Re, M.D.; Pellegrini, C.; Cucchiara, F.; Salvianti, F.; Galbiati, S. Updates on liquid biopsy: Current trends and future perspectives for clinical application in solid tumors. Clin. Chem. Lab. Med. (CCLM) 2021, 59, 1181–1200. [Google Scholar] [CrossRef] [PubMed]
- Lone, S.N.; Nisar, S.; Masoodi, T.; Singh, M.; Rizwan, A.; Hashem, S.; El-Rifai, W.; Bedognetti, D.; Batra, S.K.; Haris, M.; et al. Liquid biopsy: A step closer to transform diagnosis, prognosis and future of cancer treatments. Mol. Cancer 2022, 21, 79. [Google Scholar] [CrossRef] [PubMed]
- Stoecklein, N.H.; Fluegen, G.; Guglielmi, R.; Neves, R.P.L.; Hackert, T.; Birgin, E.; Cieslik, S.A.; Sudarsanam, M.; Driemel, C.; van Dalum, G.; et al. Ultra-sensitive CTC-based liquid biopsy for pancreatic cancer enabled by large blood volume analysis. Mol. Cancer 2023, 22, 181. [Google Scholar] [CrossRef]
- Stevens, M.; Oomens, L.; Broekmaat, J.; Weersink, J.; Abali, F.; Swennenhuis, J.; Tibbe, A. VyCAP’s puncher technology for single cell identification, isolation, and analysis. Cytom. Part A 2018, 93, 1255–1259. [Google Scholar] [CrossRef]
- Xu, L.; Mao, X.; Imrali, A.; Syed, F.; Mutsvangwa, K.; Berney, D.; Cathcart, P.; Hines, J.; Shamash, J.; Lu, Y.-J. Optimization and Evaluation of a Novel Size Based Circulating Tumor Cell Isolation System. PLoS ONE 2015, 10, e0138032. [Google Scholar] [CrossRef]
- Park, J.; Chang, E.S.; Kim, J.-Y.; Chelakkot, C.; Sung, M.; Song, J.-Y.; Jung, K.; Lee, J.H.; Choi, J.Y.; Kim, N.Y.; et al. Correction: C-MET-positive circulating tumor cells and cell-free DNA as independent prognostic factors in hormone receptor-positive/HER2-negative metastatic breast cancer. Breast Cancer Res. 2025, 27, 3. [Google Scholar] [CrossRef]
- Wu, A.; Bhagat, A.A.; Leong, M.C.; Lim, C.T. ClearCell FX: A microfluidic system for label-free circulating tumor cell enrichment. J. Clin. Oncol. 2014, 32, e22023. [Google Scholar] [CrossRef]
- Alexandrou, G.; Mantikas, K.-T.; Allsopp, R.; Yapeter, C.A.; Jahin, M.; Melnick, T.; Ali, S.; Coombes, R.C.; Toumazou, C.; Shaw, J.A.; et al. The Evolution of Affordable Technologies in Liquid Biopsy Diagnostics: The Key to Clinical Implementation. Cancers 2023, 15, 5434. [Google Scholar] [CrossRef]
- Tan, J.K.H.; Menon, N.V.; Tan, P.S.; Pan, T.L.T.; Bonney, G.K.; Shridhar, I.G.; Madhavan, K.; Lim, C.T.; Kow, A.W.C. Presence of tumor cells in intra-operative blood salvage autotransfusion samples from hepatocellular carcinoma liver transplantation: Analysis using highly sensitive microfluidics technology. HPB 2021, 23, 1700–1707. [Google Scholar] [CrossRef]
- Martel, A.; Mograbi, B.; Romeo, B.; Gastaud, L.; Lalvee, S.; Zahaf, K.; Fayada, J.; Nahon-Esteve, S.; Bonnetaud, C.; Salah, M.; et al. Assessment of Different Circulating Tumor Cell Platforms for Uveal Melanoma: Potential Impact for Future Routine Clinical Practice. Int. J. Mol. Sci. 2023, 24, 11075. [Google Scholar] [CrossRef]
- He, Y.; Shi, J.; Shi, G.; Xu, X.; Liu, Q.; Liu, C.; Gao, Z.; Bai, J.; Shan, B. Using the New CellCollector to Capture Circulating Tumor Cells from Blood in Different Groups of Pulmonary Disease: A Cohort Study. Sci. Rep. 2017, 7, 9542. [Google Scholar] [CrossRef] [PubMed]
- Aymerich, M.; Vázquez de Aldana, J.R.; Canteli, D.; Molpeceres, C.; Alvarez, E.; Almengló, C.; Flores-Arias, M.T. Soda-lime glass as biocompatible material to fabricate capillary-model devices by laser technologies. Opt. Mater. Express 2022, 12, 1790–1806. [Google Scholar] [CrossRef]
- Cras, J.J.; Rowe-Taitt, C.A.; Nivens, D.A.; Ligler, F.S. Comparison of chemical cleaning methods of glass in preparation for silanization. Biosens. Bioelectron. 1999, 14, 683–688. [Google Scholar] [CrossRef]
- Stark, M.-B.; Holmberg, K. Covalent immobilization of lipase in organic solvents. Biotechnol. Bioeng. 1989, 34, 942–950. [Google Scholar] [CrossRef] [PubMed]
- López-Gallego, F.; Guisán, J.M.; Betancor, L. Glutaraldehyde-Mediated Protein Immobilization. In Immobilization of Enzymes and Cells, 3rd ed.; Guisan, J.M., Ed.; Humana Press: Totowa, NJ, USA, 2013; pp. 33–41. [Google Scholar]
- Wang, T.; Ma, W.; Chen, Y.; Liu, L. Methods to Detect and Treat Diseases. U.S. Patent US20150283318A1, 8 October 2015. [Google Scholar]
- Maetzel, D.; Denzel, S.; Mack, B.; Canis, M.; Went, P.; Benk, M.; Kieu, C.; Papior, P.; Baeuerle, P.A.; Munz, M.; et al. Nuclear signalling by tumour-associated antigen EpCAM. Nat. Cell Biol. 2009, 11, 162–171. [Google Scholar] [CrossRef]
- Lugli, A.; Iezzi, G.; Hostettler, I.; Muraro, M.G.; Mele, V.; Tornillo, L.; Carafa, V.; Spagnoli, G.; Terracciano, L.; Zlobec, I. Prognostic impact of the expression of putative cancer stem cell markers CD133, CD166, CD44s, EpCAM, and ALDH1 in colorectal cancer. Br. J. Cancer 2010, 103, 382–390. [Google Scholar] [CrossRef]
- Stirling, D.R.; Swain-Bowden, M.J.; Lucas, A.M.; Carpenter, A.E.; Cimini, B.A.; Goodman, A. CellProfiler 4: Improvements in speed, utility and usability. BMC Bioinform. 2021, 22, 433. [Google Scholar] [CrossRef]
- Moura, E.I.M.; de Brito, G.A.; Alves, J.A.; Imanishe, M.H.; Baptista, A.L.; Andrade, L.A.S.; Pereira, B.J. Efficacy and Safety of Regional Anticoagulation with 4% Trisodium Citrate Versus Heparin in Extended Hemodialysis among Critical Patients with Cancer and Acute Kidney Injury. Blood Purif. 2021, 50, 50–56. [Google Scholar] [CrossRef]
- Wojtukiewicz, M.Z.; Skalij, P.; Tokajuk, P.; Politynska, B.; Wojtukiewicz, A.M.; Tucker, S.C.; Honn, K.V. Direct Oral Anticoagulants in Cancer Patients. Time for a Change in Paradigm. Cancers 2020, 12, 1144. [Google Scholar] [CrossRef]
- Kato, C.; Oakes, M.; Kim, M.; Desai, A.; Olson, S.R.; Raghunathan, V.; Shatzel, J.J. Anticoagulation strategies in extracorporeal circulatory devices in adult populations. Eur. J. Haematol. 2021, 106, 19–31. [Google Scholar] [CrossRef] [PubMed]
- Jiang, X.; Li, H.; Xie, J.; McKinley, E.T.; Zhao, P.; Gore, J.C.; Xu, J. In vivo imaging of cancer cell size and cellularity using temporal diffusion spectroscopy. Magn. Reson. Med. 2017, 78, 156–164. [Google Scholar] [CrossRef] [PubMed]
- Hayes, D.F.; Cristofanilli, M.; Budd, G.T.; Ellis, M.J.; Stopeck, A.; Miller, M.C.; Matera, J.; Allard, W.J.; Doyle, G.V.; Terstappen, L.W.W.M. Circulating Tumor Cells at Each Follow-up Time Point during Therapy of Metastatic Breast Cancer Patients Predict Progression-Free and Overall Survival. Clin. Cancer Res. 2006, 12, 4218–4224. [Google Scholar] [CrossRef]
- Bidard, F.-C.; Peeters, D.J.; Fehm, T.; Nolé, F.; Gisbert-Criado, R.; Mavroudis, D.; Grisanti, S.; Generali, D.; Garcia-Saenz, J.A.; Stebbing, J.; et al. Clinical validity of circulating tumour cells in patients with metastatic breast cancer: A pooled analysis of individual patient data. Lancet Oncol. 2014, 15, 406–414. [Google Scholar] [CrossRef] [PubMed]
- Cristofanilli, M.; Budd, G.T.; Ellis, M.J.; Stopeck, A.; Matera, J.; Miller, M.C.; Reuben, J.M.; Doyle, G.V.; Allard, W.J.; Terstappen, L.W.; et al. Circulating tumor cells, disease progression, and survival in metastatic breast cancer. N. Engl. J. Med. 2004, 351, 781–791. [Google Scholar] [CrossRef]
- Gräslund, S.; Falk, R.; Brundell, E.; Höög, C.; Ståhl, S. A high-stringency proteomics concept aimed for generation of antibodies specific for cDNA-encoded proteins. Biotechnol. Appl. Biochem. 2002, 35, 75–82. [Google Scholar] [CrossRef]
- Tiller, K.E.; Li, L.; Kumar, S.; Julian, M.C.; Garde, S.; Tessier, P.M. Arginine mutations in antibody complementarity-determining regions display context-dependent affinity/specificity trade-offs. J. Biol. Chem. 2017, 292, 16638–16652. [Google Scholar] [CrossRef]
- Datta-Mannan, A.; Lu, J.; Witcher, D.R.; Leung, D.; Tang, Y.; Wroblewski, V.J. The interplay of non-specific binding, target-mediated clearance and FcRn interactions on the pharmacokinetics of humanized antibodies. mAbs 2015, 7, 1084–1093. [Google Scholar] [CrossRef]
- Kraft, T.E.; Richter, W.F.; Emrich, T. Heparin chromatography as an in vitro predictor for antibody clearance rate through pinocytosis. mAbs 2020, 12, 1683432. [Google Scholar] [CrossRef]

Disclaimer/Publisher’s Note: The statements, opinions and data contained in all publications are solely those of the individual author(s) and contributor(s) and not of MDPI and/or the editor(s). MDPI and/or the editor(s) disclaim responsibility for any injury to people or property resulting from any ideas, methods, instructions or products referred to in the content. |
© 2025 by the authors. Licensee MDPI, Basel, Switzerland. This article is an open access article distributed under the terms and conditions of the Creative Commons Attribution (CC BY) license (https://creativecommons.org/licenses/by/4.0/).