Article

Simultaneous Determination and Quantification of NineNitrosamine Impurities in Semi-Solid Forms Using a GC–MS/MS Method

1
Department of BiohealthRegulatory Science, Graduate School of Pharmacy, Ajou University, 206 World cup-ro, Yeongtong-gu, Suwon-si 16499, Gyeonggi-do, Republic of Korea
2
Pharmaentech, Inc. #1501, Building A, Heungdeok IT Valley, 13 Heungdeok 1-ro, Giheung-gu, Yongin-si 16954, Gyeonggi-do, Republic of Korea
*
Author to whom correspondence should be addressed.
Separations 2025, 12(5), 120; https://doi.org/10.3390/separations12050120
Submission received: 6 April 2025 / Revised: 30 April 2025 / Accepted: 3 May 2025 / Published: 11 May 2025

Abstract

:
Many studies are being conducted on the detection of nitrosamine impurities in solid formulations. However, research on semi-solid formulations such as gels, ointments and creams is not common. In particular, excipients used to increase viscosity and add fragrance can significantly impact the sample preparation. Volatile compounds derived from natural fragrances are composed of a wide variety of complex components, making them very difficult to handle and completely separate from the analytes. Due to the complex composition of these formulations, an analytical method was developed to accurately separate and analyze nine nitrosamine impurities (NDMA, NDEA, NMEA, NDPA, NDBA, NPIP, NMOR, DIPNA and EIPNA) simultaneously. To overcome challenges in the sample preparation of excipients with physical and chemical properties, the sample was prepared using solvents such as methanol, hexane, water and dichloromethane. The target analytes were extracted with dichloromethane for the final preparation for GC–MS/MS and the optimal conditions were established. While multiple GC columns were tested, peak overlapping interferences were observed, leading to the use of a 60m-long column to overcome peak overlap. The GC–MS/MS condition was set for optimal performance and ionization energy, with parameters adjusted for each analyte. The developed method was validated in accordance with guidelines to ensure its reliability and suitability. As a result, all nine nitrosamine impurities were simultaneously analyzed, confirming excellent performance. The sample preparation method and procedure, column specification and GC–MS/MS conditions have the potential to be adapted not only for semi-solid formulations of pharmaceuticals and cosmetics but also for other formulations such as solid and liquid samples, rendering them suitable for the analysis of nitrosamine impurities.

1. Introduction

Nitrosamine impurities are found in many fields such as food, cosmetics, pharmaceuticals and household products. In particular, trace amounts of impurities found in pharmaceuticals have become a major concern for many regulatory authorities. N-nitrosamines have been classified as “probable human carcinogens” by the International Agency for Research on Cancer [1] and were listed as a representative “cohort of concern” of mutagenic carcinogens (in addition to aflatoxin-like compounds and alkyl azoxy compounds) in the International Council for Harmonization (ICH) of Technical Requirements for Pharmaceuticals for Human Use Guidance for Industry M7 (R1) [2].
The nitrosamine impurity analytical methods published by regulatory authorities are primarily focused on raw materials, tablets, capsules and liquid formulations [3,4,5,6]. Most of these methods are single-component analyses, reflecting the difficulties of simultaneous analysis due to the characteristics of the matrix. No official analytical methods have been announced for semi-solid formulations, such as ointments, creams and gels. Methods for analyzing nitrosamine impurities in the form of highly viscous semi-solids are not common. Hydroxypropylmethylcellulose or carbomer swells to form a white colloidal solution with a certain viscosity. It can undergo a sol–gel phase transition due to temperature changes in a specific concentration of the solution. Polyethyleneglycol (PEG) was used as a non-volatile sticky liquid for viscosity as well as lubrication. Also, volatile compounds derived from natural fragrances are composed of a wide variety of complex components, making them very difficult to handle and completely separate them from the analytes. In cases where preparation is not adequate, column clogging may occur [7]. In particular, the analysis of nitrosamine impurities with amphiphilic properties that dissolve in both specific organic solvents and aqueous solvents is very challenging due to the difficulty in extraction. When various excipients such as fragrance and colorants are added, it significantly influences the separation of each component. Particularly in simultaneous analysis methods, issues may arise, such as poor peak separation and asymmetry. Among similar types of cosmetics, such as cream, gel, lotion and shampoo, there is some information on the analysis of nitrosamines but it is from a paper [8] published a long time ago. Since then, with the advancement of many analytical techniques, a new method was sought to find a new, cutting-edge analysis. In addition, simultaneous analysis methods [9] for nitrosamine impurities found in specific reagents have been introduced but many reports introduced analyses of relatively simple matrices or liquid samples. Developing an analytical method that can simultaneously analyze nine nitrosamine impurities (NDMA, NDEA, NMEA, NDPA, NDBA, NPIP, NMOR, DIPNA and EIPNA) from semi-solid pharmaceuticals with complex compositions will greatly contribute to the improvement of pharmaceutical quality, and enable rapid and accurate analysis.

2. Materials and Methods

2.1. Material and Reagents

All reagents used were of analytical grade with the highest purity of >99.8%. GC–MS grade methanol (Honeywell (Charlotte, NC, USA), lot no. Y2AG1H), hexane (Honeywell, lot no. XBIM1H) and dichloromethane (Supelco (Bellefonte, PA, USA), lot no. JA125654) were procured from Duksan Pure Chemicals (Ansan-si, Gyeonggi-do, Republic of Korea). Ultra-purified water was used (Pall, reverse osmosis system (Cascada I, III, (Port Washington, NY, USA), Q71X341HJ)). NDMA, NDMA-d6, NDEA, NDEA-d10, NMEA, NMEA-d3, NDPA, NDPA-d14, NDBA, NDBA-d18, NPIP, NMOR, NMOR-d8, DIPNA and EIPNA were procured from AccuStandard (New Haven, CT, USA) and CHIRON (Trondheim, Norway). The oral anesthetic gel for dental use, provided by Shinwondental, was selected as the sample because its complex composition as an intraoral formulation presents significant analytical challenges due to fragrances or flavoring agents.

2.2. Preparation of Standard Stock Solutions and Internal Standard Stock Solutions

NDMA, NDEA, NMEA, NDPA, NDBA, NPIP, NMOR, DIPNA and EIPNA standard stock solutions were prepared by dissolving the standard substance in methanol to achieve a concentration of 500 ng/mL.
Each isotope of the above standards, NDMA-d6, NDEA-d10, NMEA-d3, NDPA-d14, NDBA-d18 and NMOR-d8 internal standard stock solutions were prepared by dissolving the internal standard substance in methanol to achieve a concentration of 500 ng/mL, respectively. EIPNA-d12, DIPNA-d14 and NPIP-d10 were not used due to peak overlapping with matrix. NDEA-d10 and NDPA-d14 were used instead of these isotopes.

2.3. Preparation of Sample Solutions

A sample consists of lidocaine, cetrimide, PEG, saccharin and essential oil (limonene, cineole, menthone, menthofuran, isomenthone, methyl acetate, menthol, pulegone and carvone). It is a highly viscous, colorless, translucent gel with a specific scent. The composition originates from various components derived from PEG, saccharin and essential oil constituents. Particularly in the case of essential oil, which was composed of complex components [10], it was expected to pose challenges in the quantification of nine nitrosamine impurities. Considering the solubility properties of the nine nitrosamine impurities and other constituents, the samples were dissolved and extracted with organic solvent and water, and dichloromethane was used as the final extract solvent for the GC analysis.
Sample solution: Approximately 1 g of the sample was accurately weighed and dissolved in 5 mL of methanol. A total of 100 µL of internal standard stock solution (500 ng/mL) and 5 mL of hexane were added and the mixture was thoroughly shaken. The hexane layer was discarded. After that, 5 mL of water and 5 mL of dichloromethane were added. After thorough shaking, the mixture was centrifuged at 4000 rpm for 10 min. Carefully, 3 mL of the dichloromethane layer was taken and filtered through a 0.22 µm PTFE membrane filter, and the first 1 mL of the filtrate was discarded to prevent any possible contamination from filters and other sources.
50 ng/mL spiked sample solution: Approximately 1 g of the sample was accurately weighed and dissolved in 5 mL of methanol. A total of 100 µL of internal standard stock solution (500 ng/mL), 500 µL of standard stock solution (500 ng/mL) and 5 mL of hexane were added and the mixture was thoroughly shaken. The subsequent procedure was identical to that described above. The volume of the standard stock solution to be added was adjusted according to the concentration of the specific spiked standard.

2.4. Operating Conditions of GC–MS/MS

Analysis was carried out on an Agilent 7890B GC System, 7000D GC/TQ system, 7693A Auto-sampler. Separations were carried out on an HP-INNOWAX column (60 m × 0.25 mm I.D × coated with 0.25 µm film) from Agilent Technologies (Santa Clara, CA, USA). Helium was used as the carrier gas with a constant flow rate of 1.5 mL/min. Splitless injection mode was used. The injection volume was 2 μL. The oven temperature program included an initial hold at 40 °C for 1min, increased to 75 °C at 5 °C/min, increased to 95 °C at 2.5 °C/min, increased to 170 °C at 5 °C/min and increased to 200 °C at 10 °C/min, and then was subsequently run for 4 min. The temperature of the injection port, transfer and the MS source were 240 °C, 250 °C and 230 °C, respectively. A solvent delay time of 5 min was used for analysis. The MS analysis was conducted in positive electron ionization (EI) mode. Nitrogen gas was used as collision-induced dissociation (CID) gas. The total run time was 44 min. The system was operated using GS–MS/MS software (MassHunter GC/MS Acquisition Software, Version 10.0.368) from Agilent. Quantification was performed using multiple reaction monitoring (MRM) mode. The optimum collision energies (CE) and specific transitions of all nitrosamines are listed in Table 1.

2.5. Method Validation

The developed method was validated in terms of system suitability, selectivity, linearity, accuracy, precision (repeatability), limit of quantification, limit of detection and robustness (solution stability). Method validation and evaluation for nine nitrosamine impurities were conducted following ICH guidelines [11]. When preparing spiked samples, an appropriate amount of standard stock solution (500 ng/mL) and internal standard stock solution (500 ng/mL) were accurately spiked prior to extraction. Other sample preparation procedures were the same as the “Preparation of Sample Solutions” with different concentrations.
System suitability: The concentration of each of the nine nitrosamine impurities and the internal standard solution were prepared at 50 ng/mL and at 10 ng/mL, respectively using dichloromethane as the solvent (blank solution), which were utilized as system suitability verification solutions.
Selectivity: Dichloromethane (as the blank), 50 ng/mL standard solution, sample solution and 50 ng/mL spiked sample solution were used for selectivity.
Linearity: Linearity solutions in the range of 2.0, 5.0, 10.0, 20.0 and 50.0 ng/mL with 10 ng/mL internal standard solutions were prepared using the standard stock solution (40, 100, 200, 400 and 1000 µL of the standard stock solution were added in 10 mL of the final volume with 200 µL of the internal standard stock solution). Three sets of linearity solutions were prepared and analyzed. The range was established without a separate test, ensuring precision, linearity and accuracy within the determined concentration.
Accuracy: Accuracy was assessed by accurately preparing and analyzing nine spiked test solutions at three different concentrations (5, 10 and 50 ng/mL) for each nitrosamine impurity, confirming the recovery rates.
Precision (Repeatability): Precision was evaluated by preparing six spiked test solutions at a concentration of 20 ng/mL and determining the relative standard deviation (RSD %) of the peak area.
Limit of Quantification (LOQ) and Limit of Detection (LOD): LOQ and LOD were determined by diluting the standard solution based on visual evaluation [11]. The solutions at these concentrations were then prepared and measured six times for LOQ (2 ng/mL) and three times for LOD (1 ng/mL). The relative standard deviation (RSD %) of the area ratio and signal-to-noise ratio (S/N) were determined.
Robustness (Solution stability): The stability of the standard solution and sample solution was examined by leaving them at room temperature. The solutions (50 ng/mL standard solution, sample solution, and 50 ng/mL spiked sample solution) were analyzed after 24 h and 48 h to observe any changes compared to the initial value.

3. Results

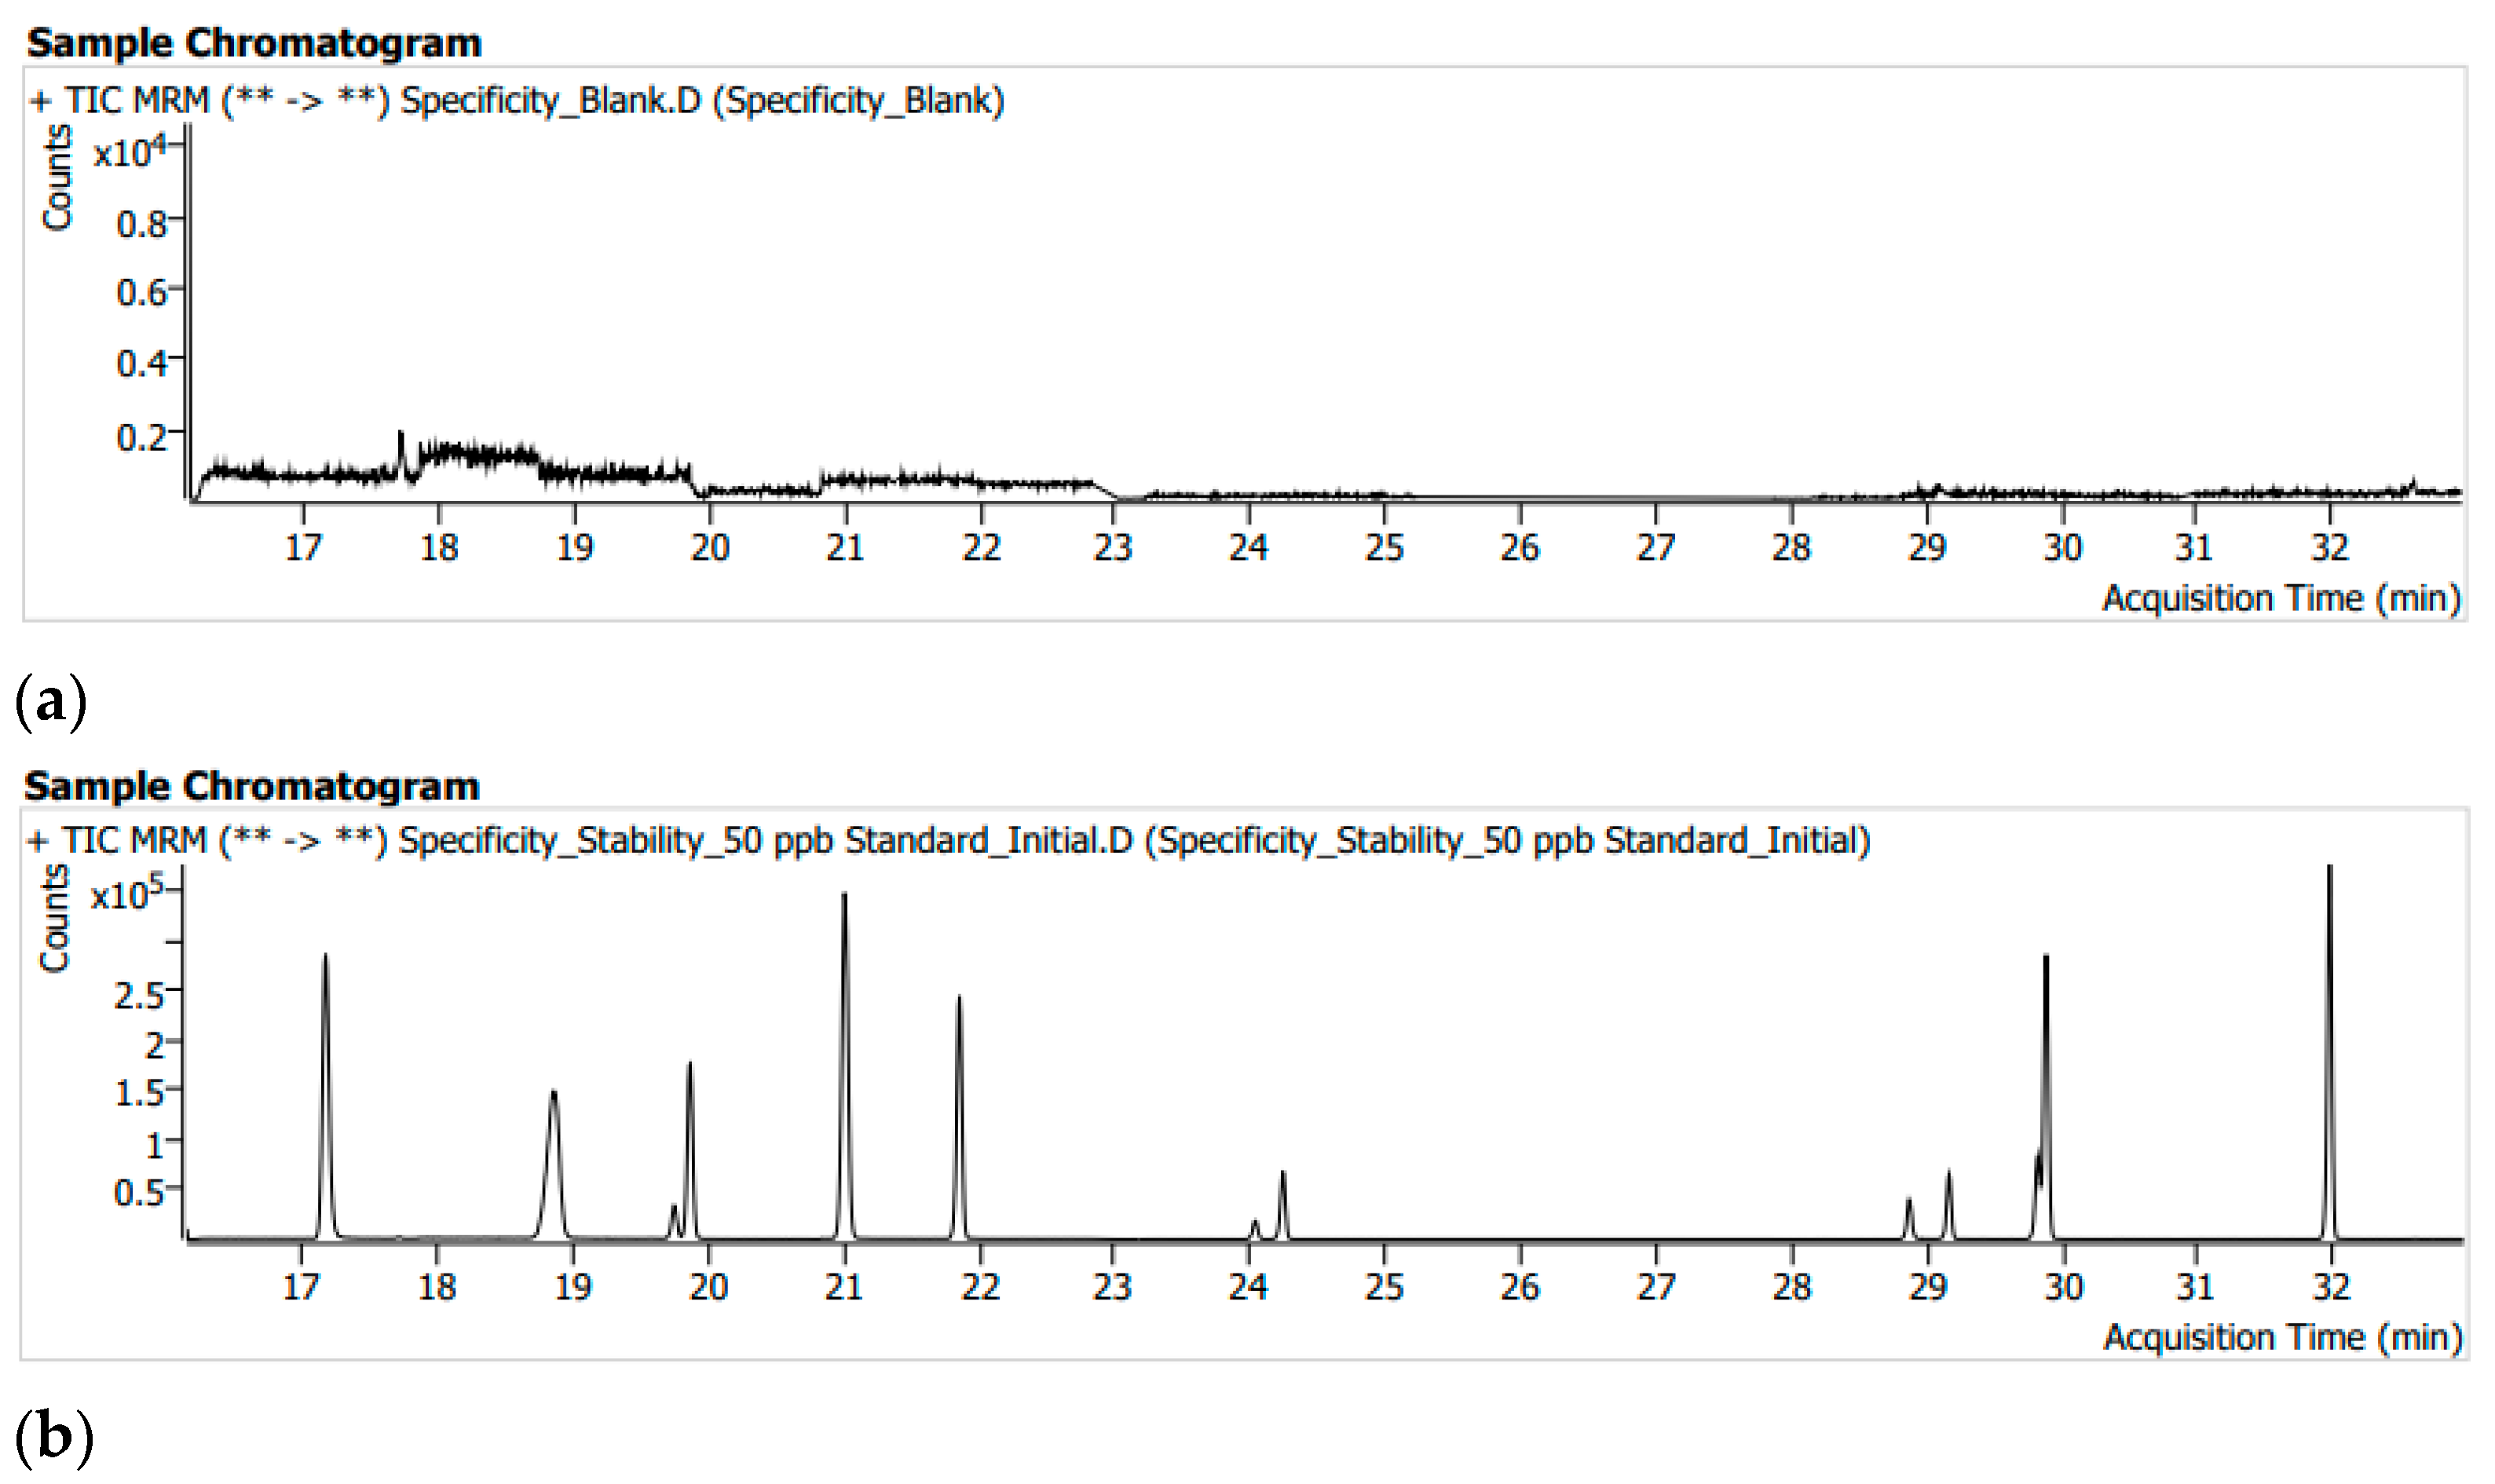
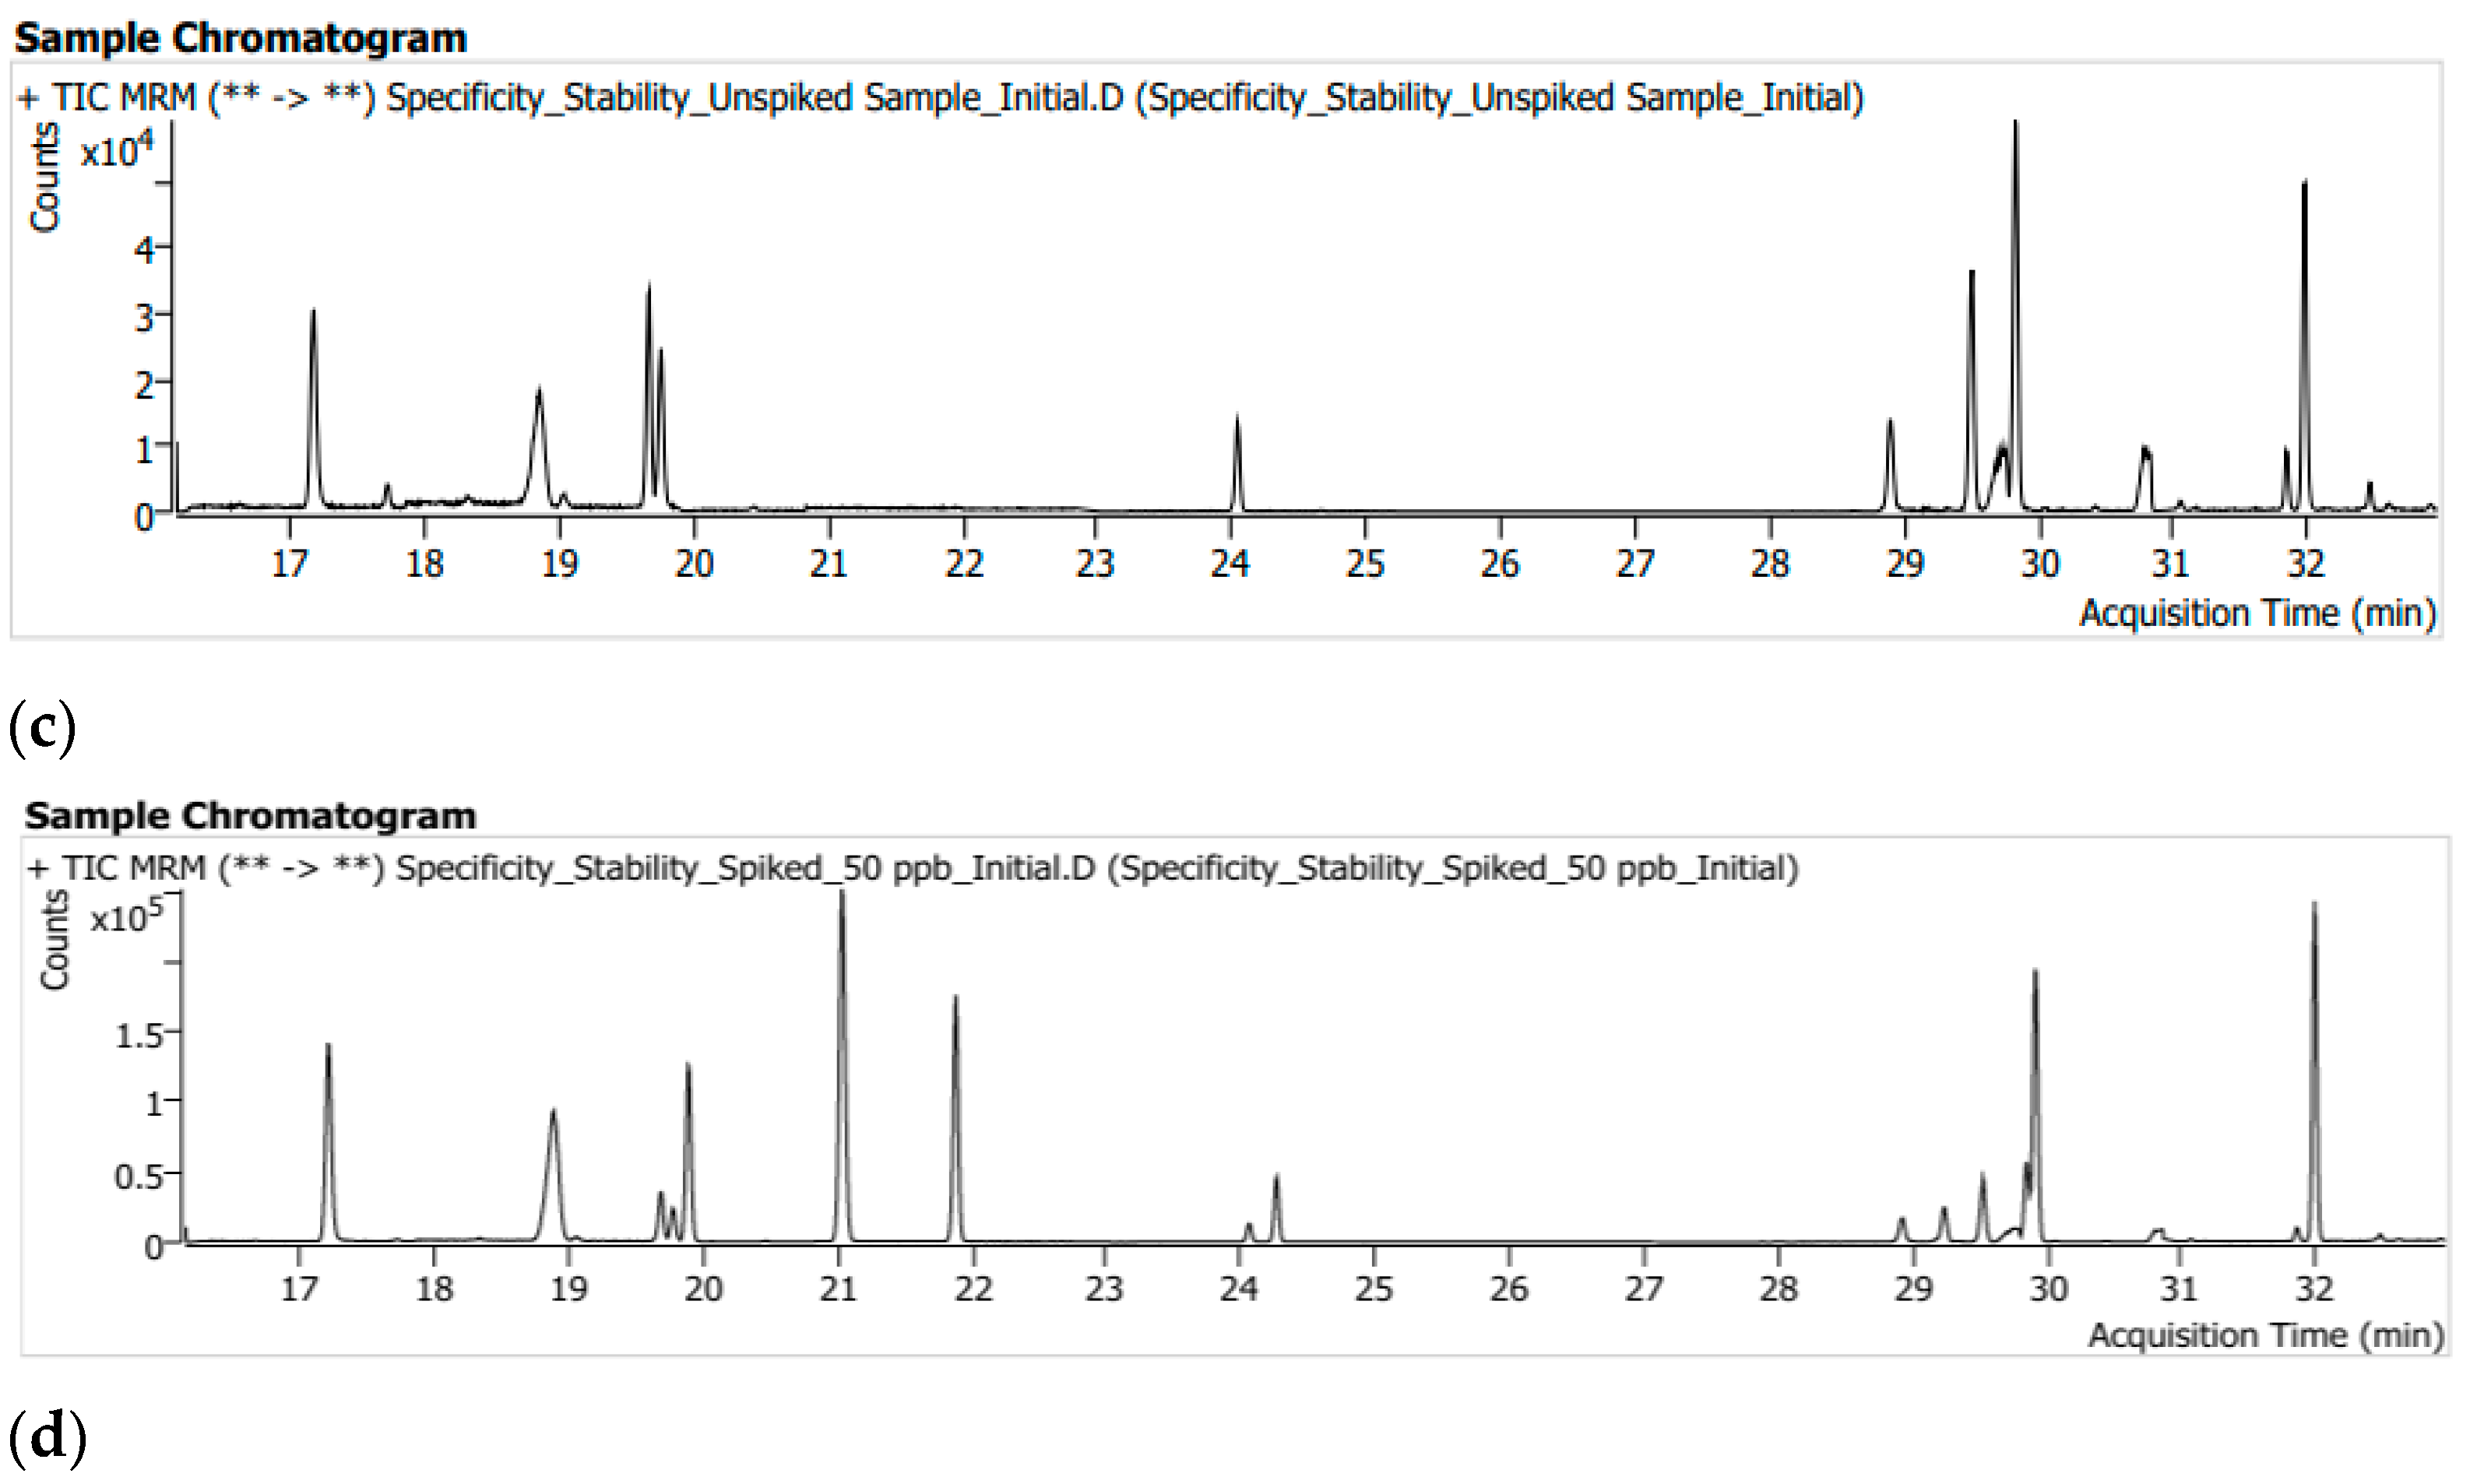
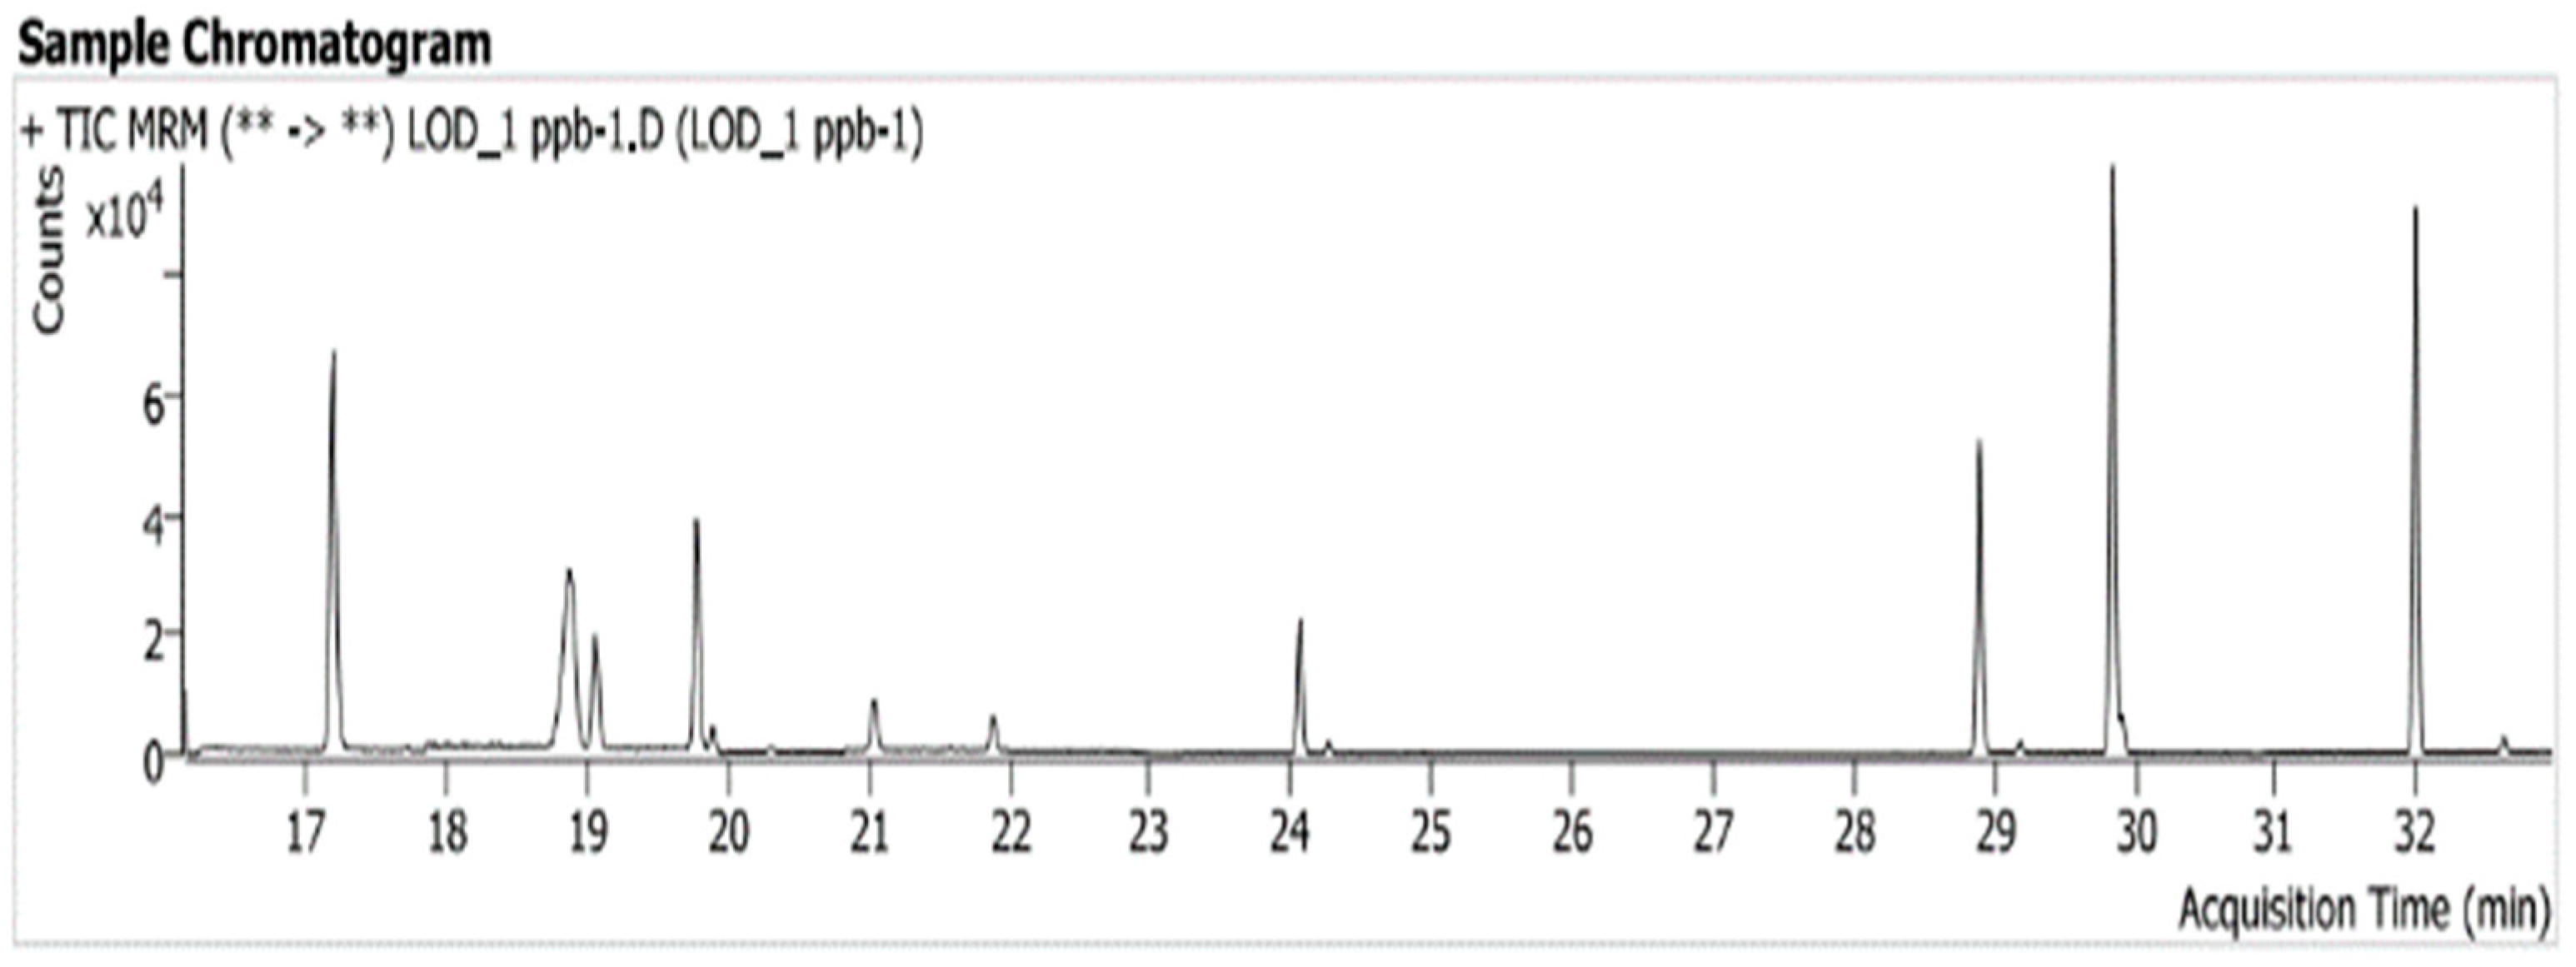
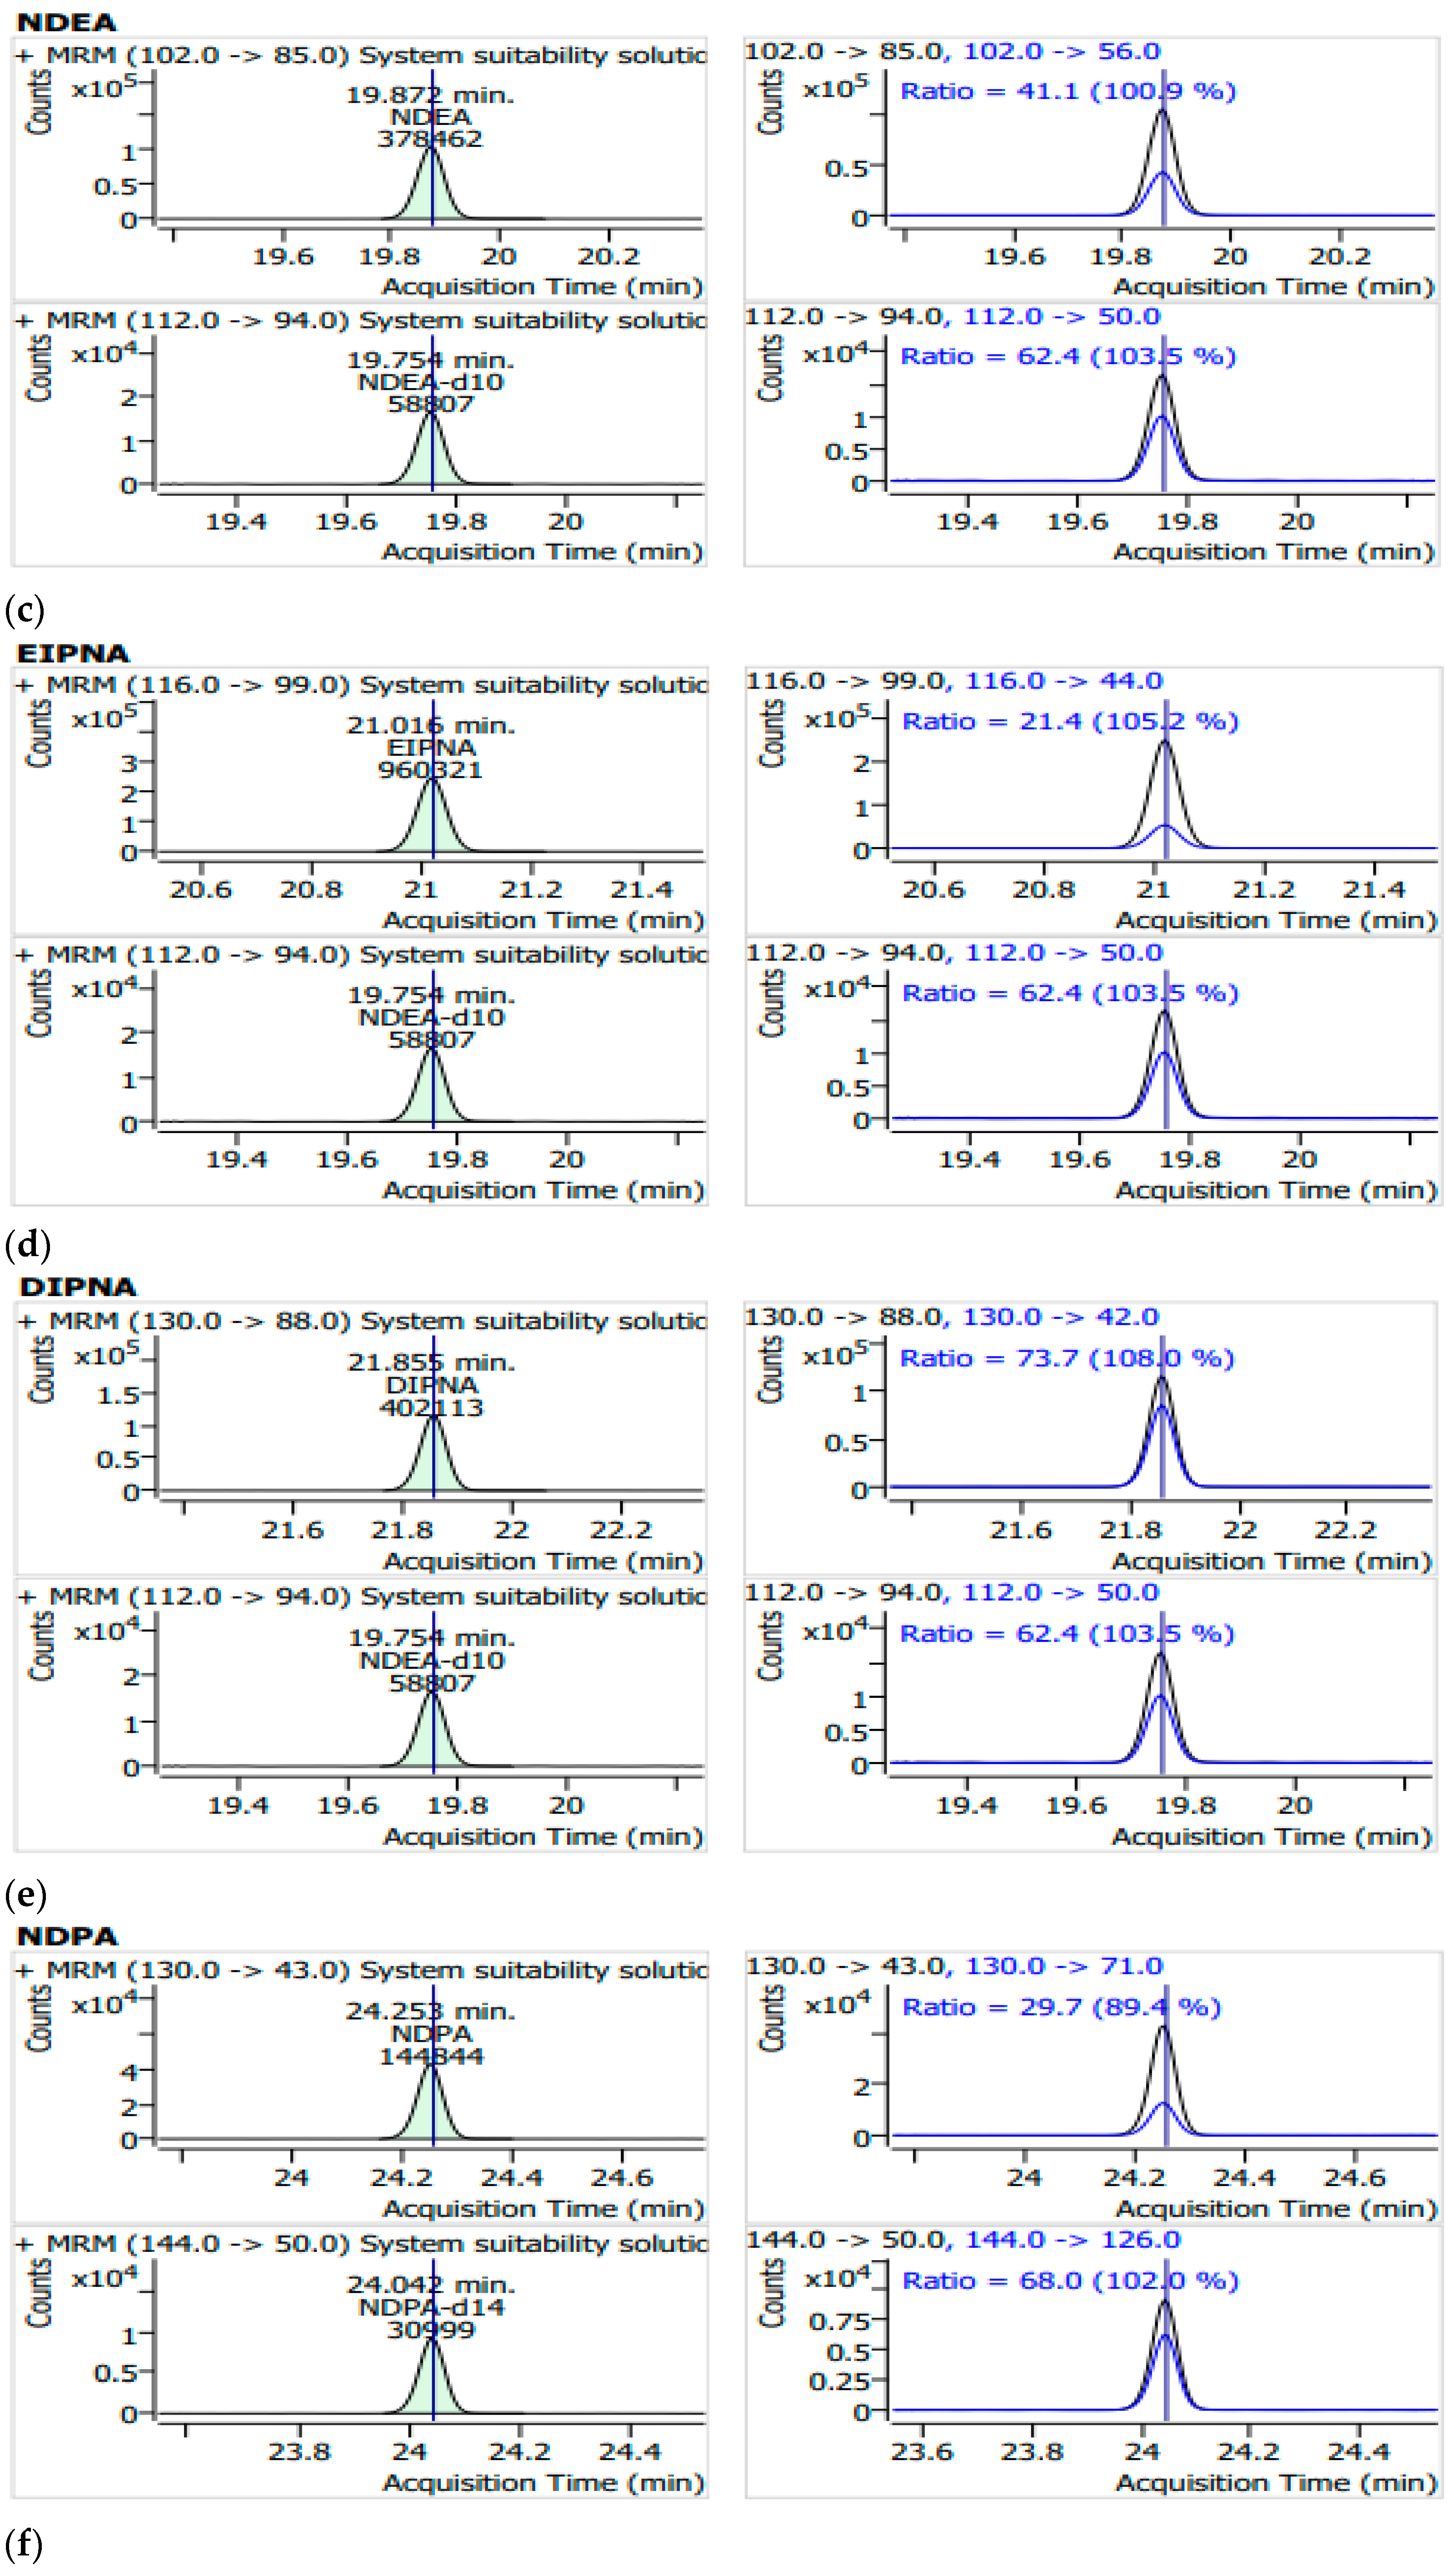
3.1. System Suitability and Selectivity

System suitability was confirmed (refer to ESI01.docx, S1. System suitability summary for details). No interfering peaks were observed at the retention times of the analytes, confirming the selectivity of the method.
In the sample solution (Figure 1c), the internal standards were detected (refer to Table 1 for each peak identification and retention time), but no nitrosamine impurities were observed. In the 50 ng/mL spiked sample solution, both the internal standards and all nine nitrosamine impurities were detected without interference. The absence of nitrosamine impurities in the sample solutions confirmed that the method was free from false positives. The clear detection in the spiked sample confirmed the method’s selectivity for these compounds at trace levels. It was confirmed that there were no issues with peak separation, which occurred when using shorter GC columns (30 m), nor were there any interferences observed with the other sample preparation methods.

3.2. Linearity

When calibration curves were constructed ranging from 2 ng/mL to 50 ng/mL, thecoefficient of determination showed good results, as seen in Table 2. The slope, y-intercept, residuals (R2), standard deviations and relative standard deviations for each concentration can be found in the supporting information (refer to the ESI01.docx, S3~S11 Linearity summary table for details). Calibration curves for each target analyte are presented in ESI03, and extended calibration data beyond the validated range are provided in ESI04. ESI05 is a summary for clarity and ease of interpretation (refer to ESI05.docx, S1~S9)

3.3. Accuracy

Recovery results at three concentration levels for each target analyte were within the acceptable range, confirming the accuracy of the method. The results obtained from the spiked samples met the acceptance criteria [12], confirming that impurities can be detected accurately (recovery rate: 99.15~114.68%), as seen in Table 3.

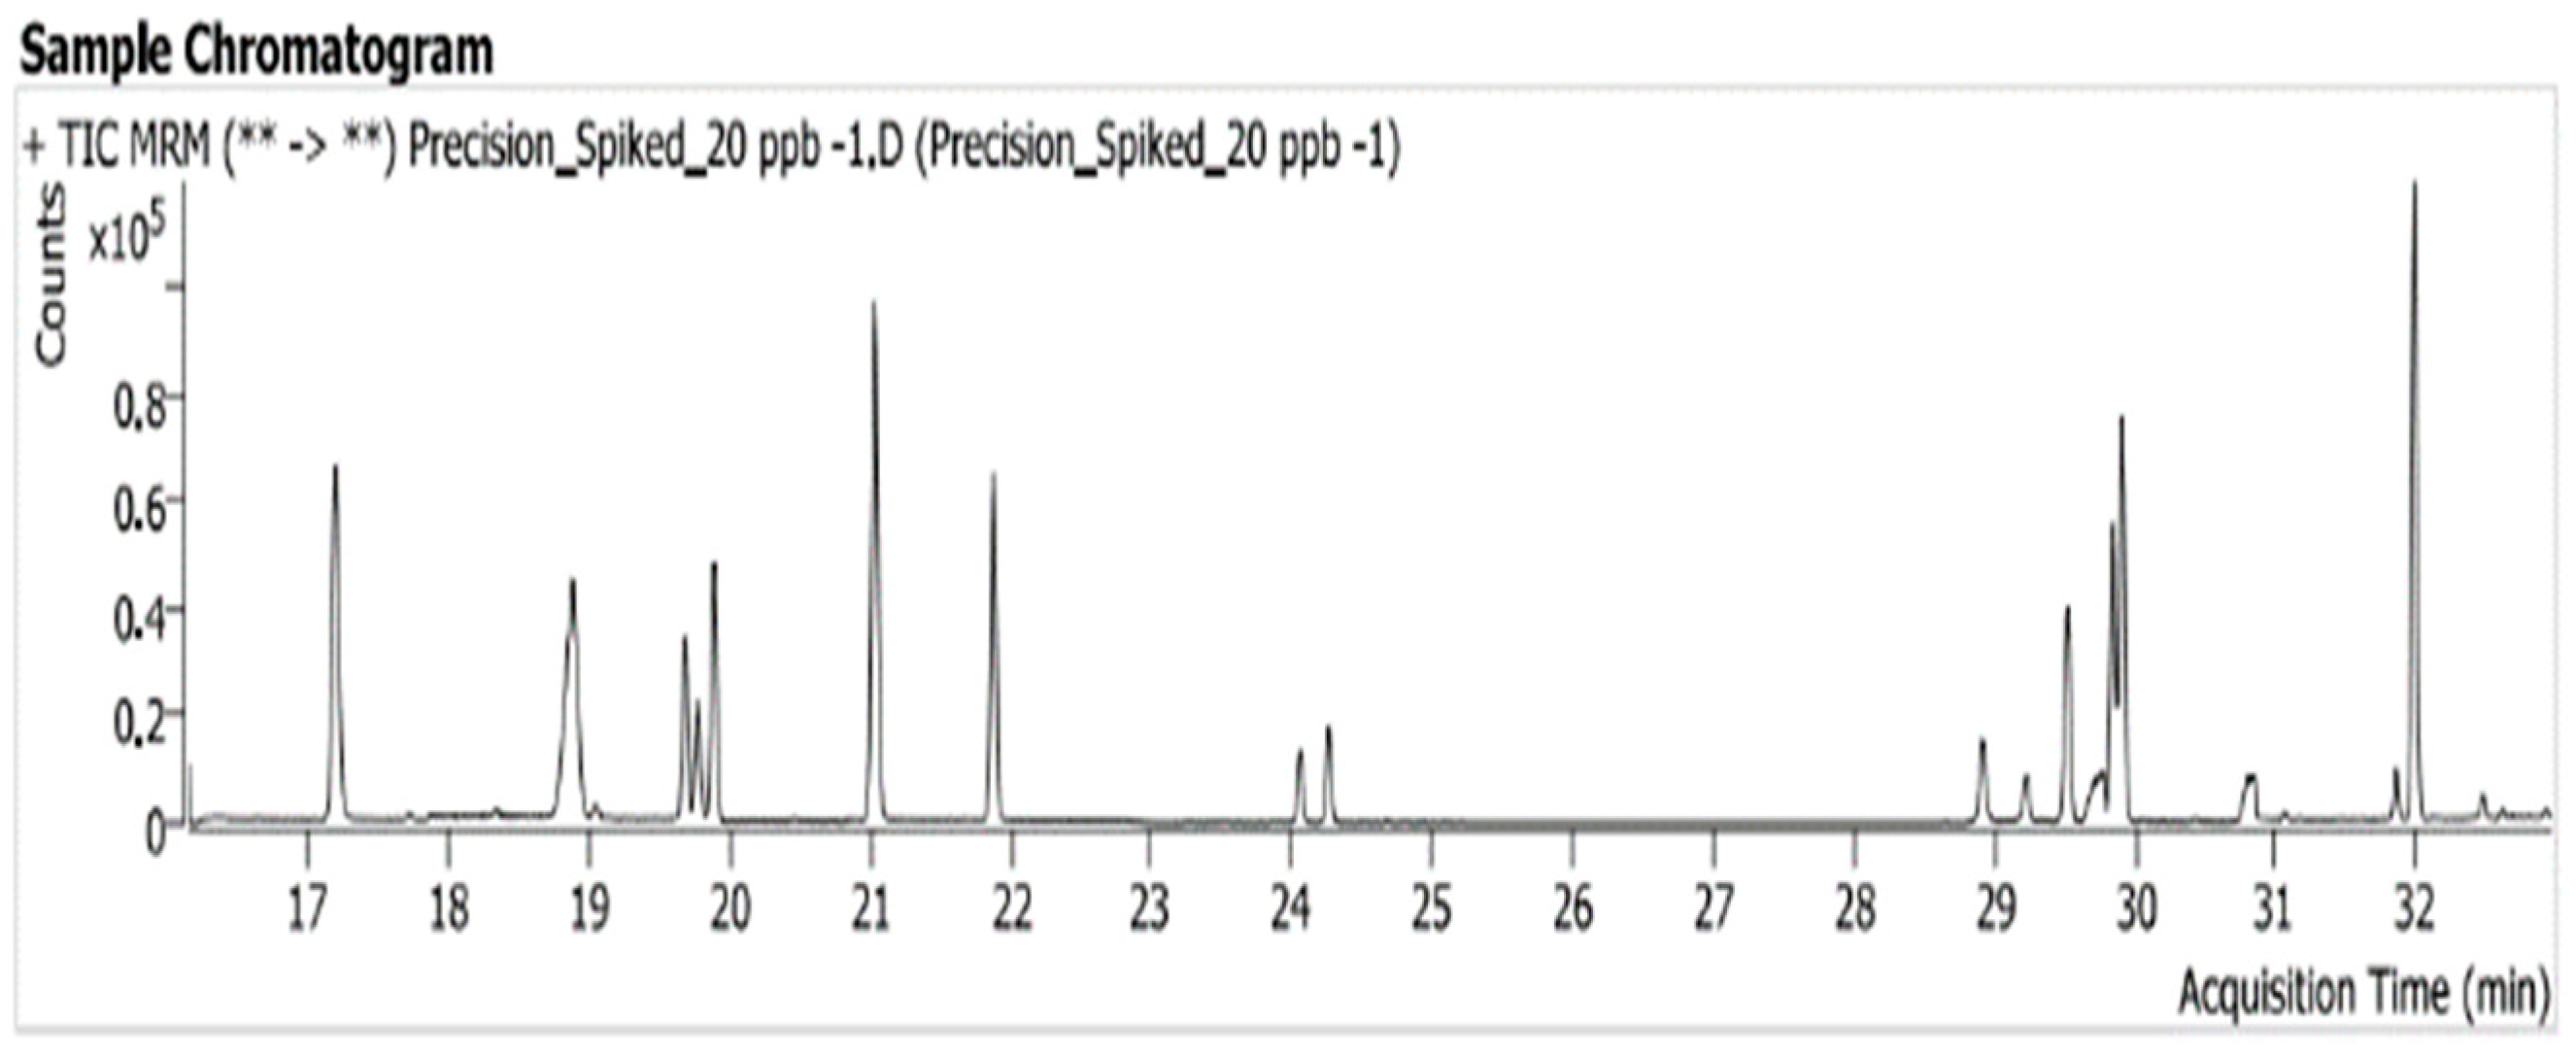
3.4. Precision (Repeatability)

The standard deviation (RSD %) complied with the established acceptance criteria, demonstrating that the analysis can be performed with precision (RSD: 3.6~5.6%), as seen in Table 4 and Figure 2.

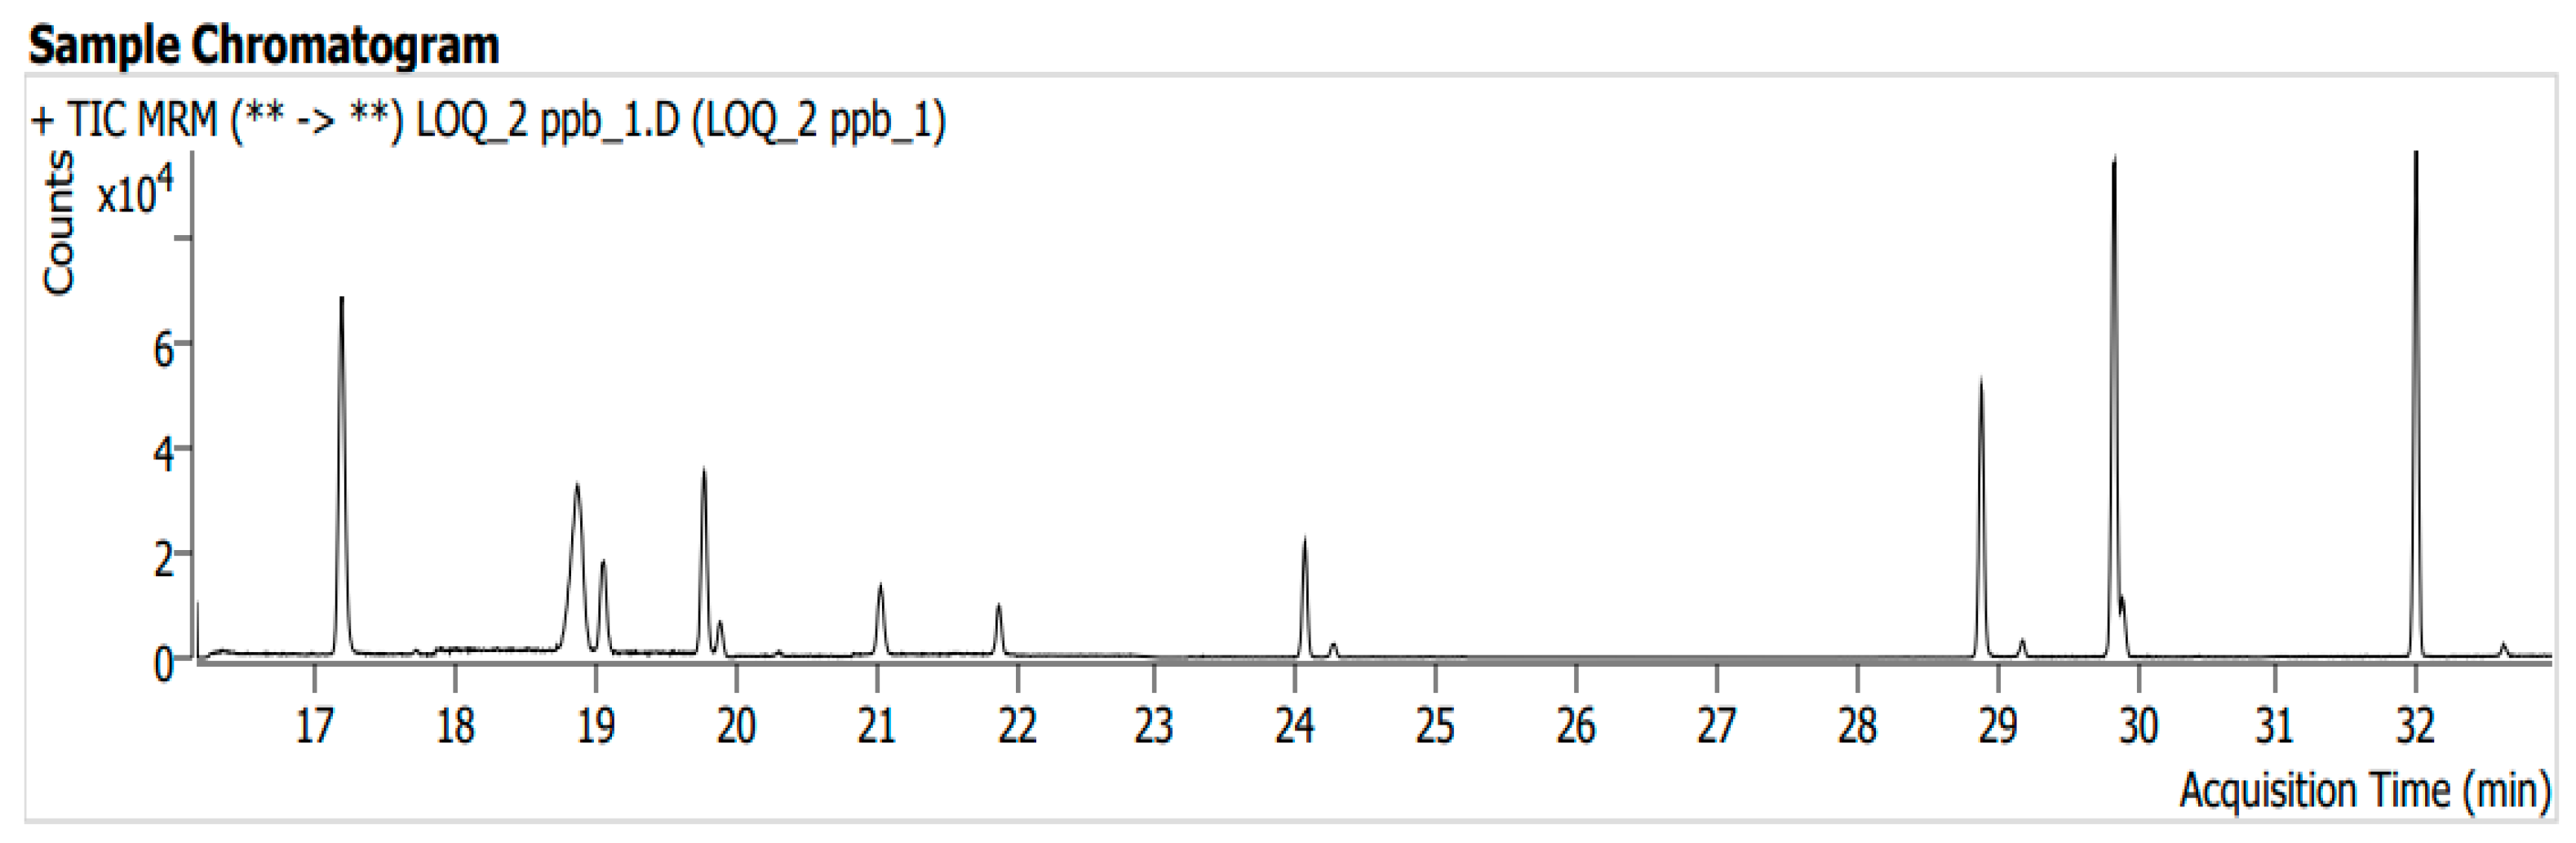
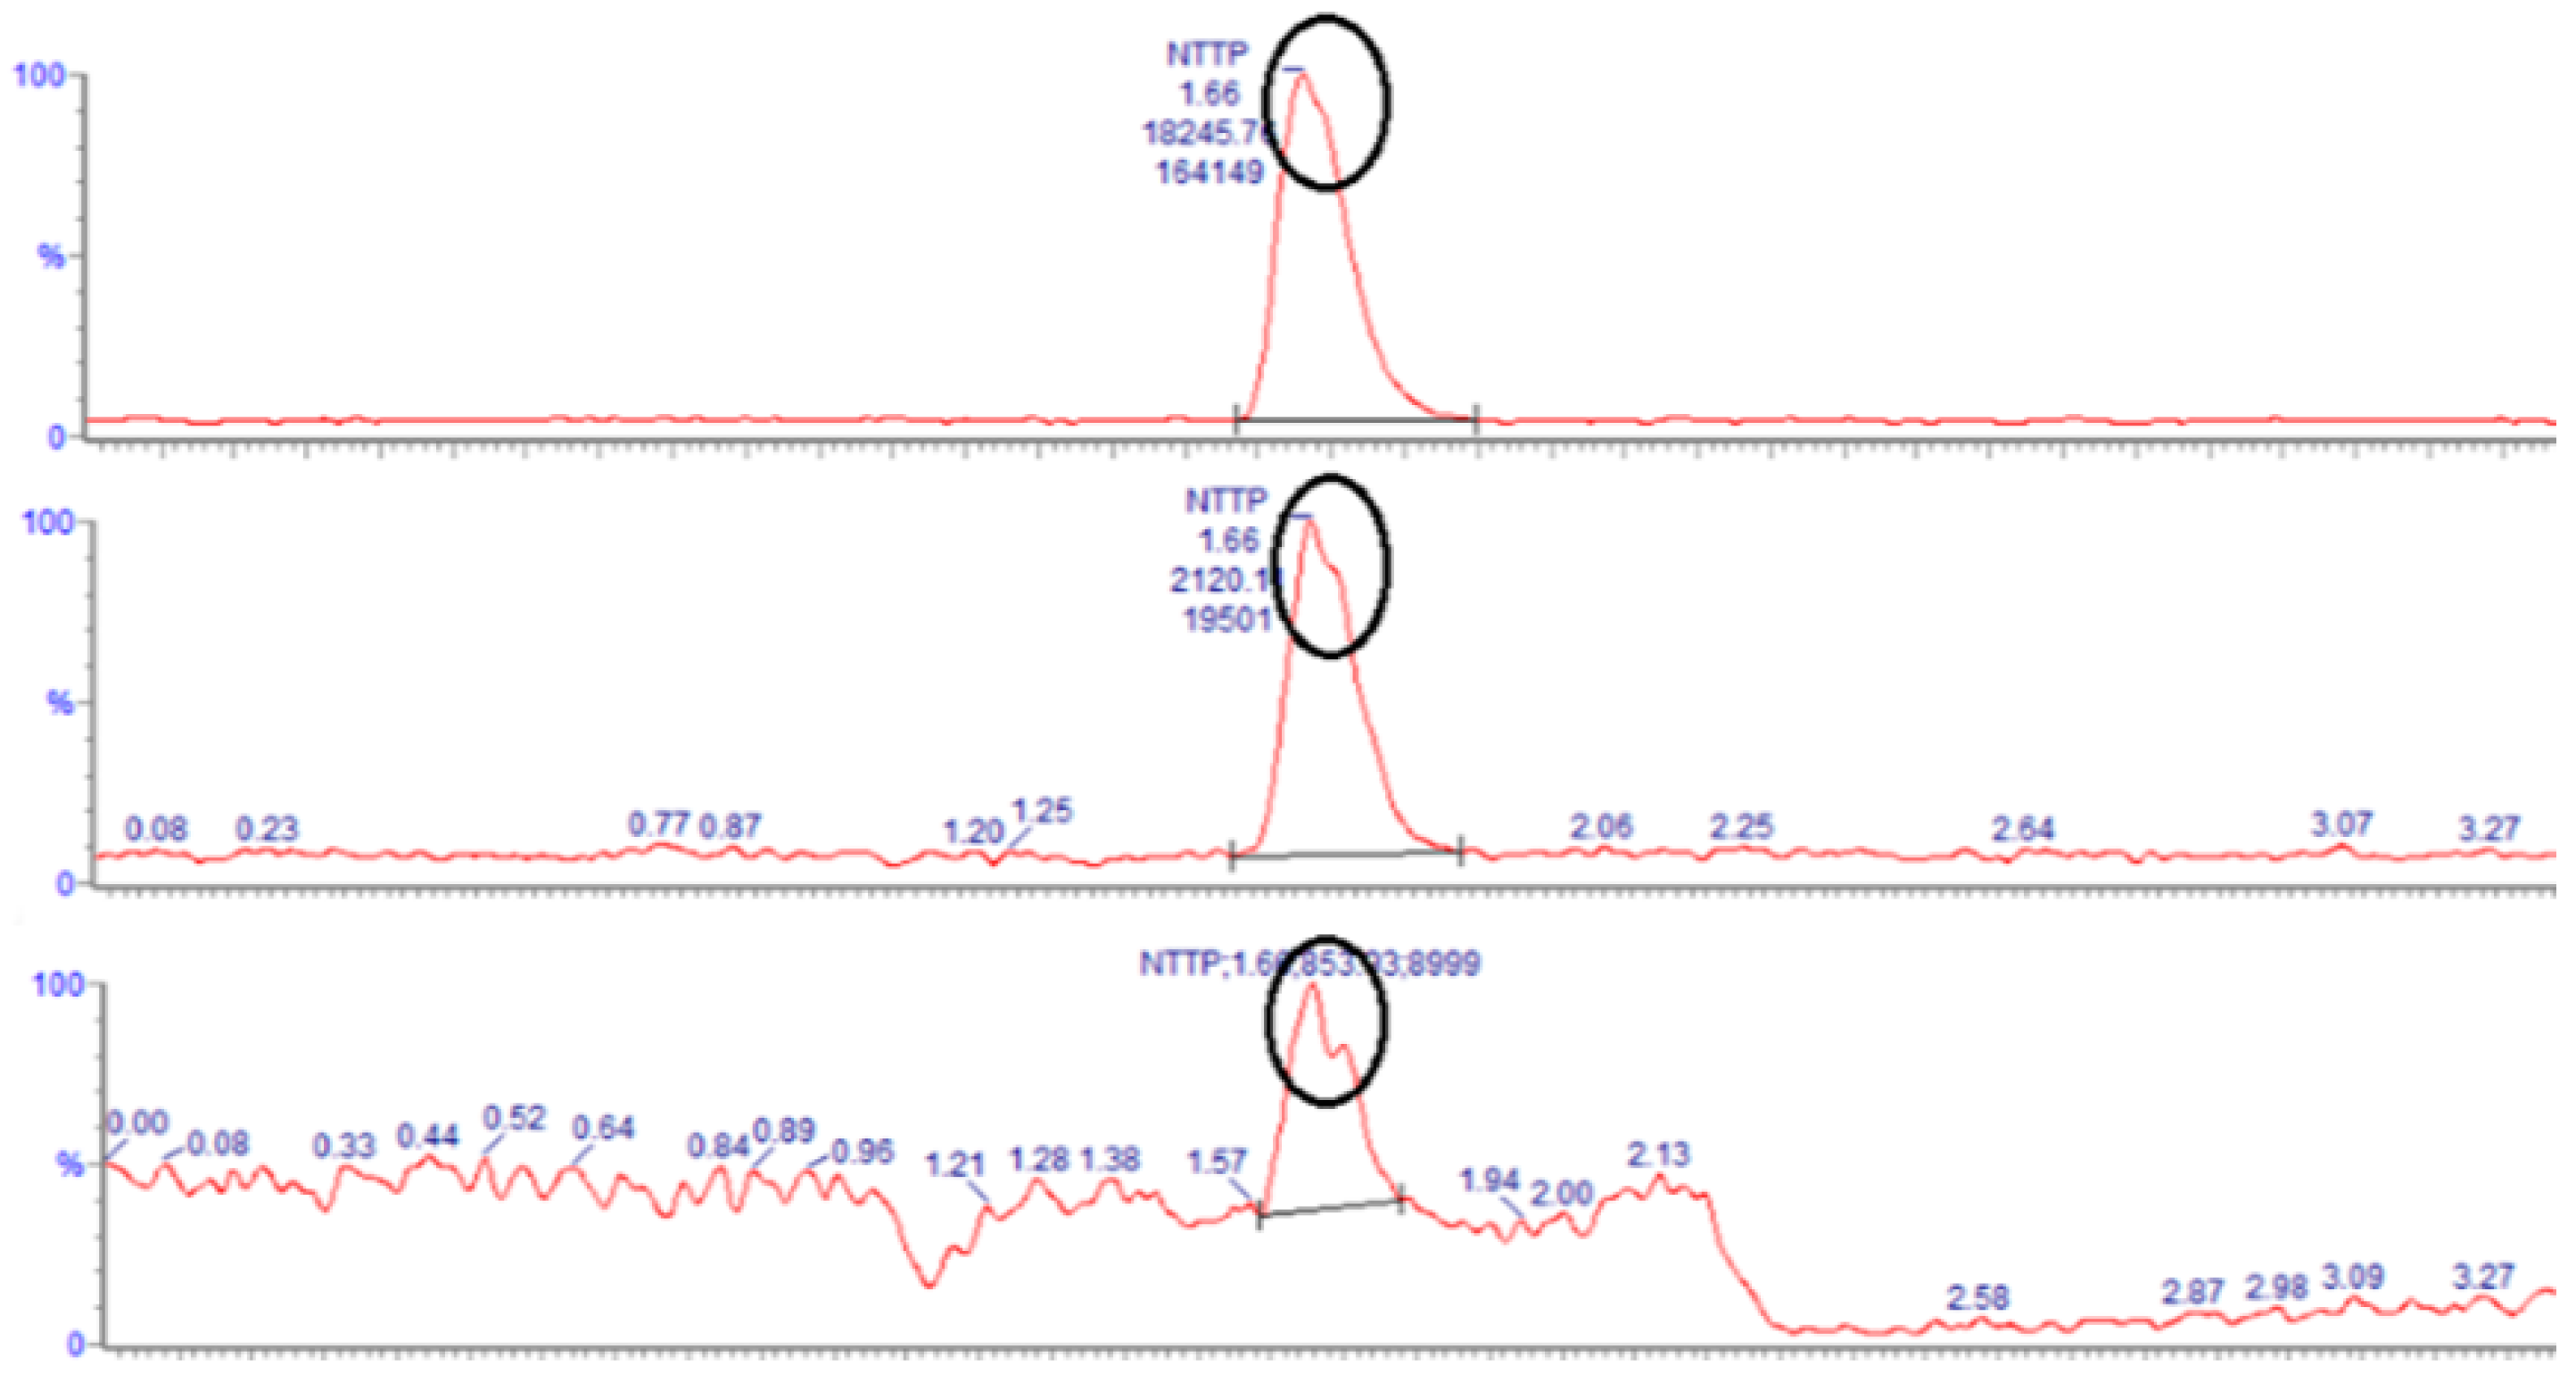
3.5. Limit of Quantification (LOQ) and Limit of Detection (LOD)

The limits of quantification (LOQ) and detection (LOD) were determined by serial dilution of the known concentrations (visual evaluation method) [11]. Concentrations of 2 ng/mL and 1 ng/mL, which yielded signal-to-noise (S/N) ratios of ≥10 and ≥3, respectively, were established as the LOQ and LOD. The LOQ level was analyzed in six replicates and the LOD level in three replicates. The resulting standard deviations and S/N ratios confirmed that both levels met the predefined acceptance criteria. Refer to Table 5 and Table 6, Figure 3 and Figure 4.

3.6. Robustness (Solution Stability)

It was confirmed that all test solutions remained stable at room temperature for up to 48 h, and the change rate was within the acceptance criteria. Refer to Table 7.
The following are representative MRM chromatograms of nine nitrosamine impurities with internal standards (Figure 5). (refer to ESI02.pdf for details).
For some internal standards (EIPNA-d12, DIPNA-d14 and NPIP-d10), peak overlapping occurred with the matrix, so different substances (NDEA-d10, NDPA-d14) were used instead of the isotopes.

4. Exploratory Evaluation of Method Applicability

To assess the broader applicability of the developed method, it was preliminarily applied to additional pharmaceutical samples, including ointment, injection and solid powder formulations beyond the validated oral anesthetic gel. Although detailed formulation information could not be disclosed due to sourcing limitations, the method well detected the target nitrosamines without significant matrix interference.
Notably, the method demonstrated consistent recovery in the presence of diverse excipients such as sodium alginate, chitosan, mannitol, plastibase (a mixture of paraffin and polyethylene), hypromellose, carbomer, poly(lactic-co-glycolic acid), polysorbate and carboxymethylcellulose sodium. Recovery tests were conducted using samples verified to be nitrosamine-free and spiked with 10 ng/mL of each nitrosamine standard. The observed recovery rates ranged from 77.2% to 94.8% across the sample types (Table 8. and refer to ESI03 and ESI04.pdf for detailed results). These preliminary results suggest that the developed method may be applicable to the analysis of samples with diverse formulations, complex excipient compositions and various dosage forms.

5. Discussion

Before developing this analytical method, published analytical methods [13,14,15,16] using HPLC, GC designed for tablets, capsules and injections were applied to analyze the gel formulation. However, issues such as poor peak separation or non-detection were identified. It was important to note that the method applied was not designed for the simultaneous analysis of multiple impurities, as it was susceptible to matrix effects. This challenge was further compounded when analyzing samples with a high content of volatile compounds, as these led to poor resolution or interference in quantification.
The high presence of volatile compounds in the sample could impact the chromatographic separation, causing co-elution or saturation of the detector, ultimately leading to inaccurate quantification. Additionally, the matrix composition, particularly in semi-solid formulations, introduced further complexity due to the interactions of the excipients and active ingredients. In addition, when analyzing semi-solid formulations that contain PEG, fragrances as masking agents and cellulose derivatives, it was observed that performing repeated analyses (approx. over 100 injections) using HPLC led to deterioration in column performance. This resulted in increased pressure, which either prevented peak separation or caused distortion in peak symmetry.
Other announced liquid–liquid extraction methods were also attempted but the existing analytical methods for solid formulations could not achieve the desired results.
Unfortunately, none of the announced methods and trials yielded satisfactory results for semi-solid dosage forms due to the sensitivity and separation at the ppb level, hence, ppb levels of nitrosamine impurities from semi-solid samples could not be quantified simultaneously. In addition, many attempts were made to analyze nine impurities using the HPLC method but column clogging occurred due to the properties of the excipients that form a gel, micro-particle and high-viscosity texture. To overcome the column-clogging issue using HPLC methods, attempts were made using a minimal amount of water and a large amount of organic solvent, but the column-clogging issue persisted (Figure 6).
Fragrances used as masking agents in semi-solid samples were composed of complex ingredients. Due to this matrix, analysis methods using HPLC and GC faced issues with poor separation or overlapping. To resolve these issues, the liquid–liquid extraction (LLE) method, which allows for the selective dissolution and separation of volatile and non-volatile components, was chosen as the sample preparation method and GC–MS/MS was selected to separate and detect complex components.
In accordance with nitrosamine impurity management guidelines [17,18,19] issued by regulatory authorities such as the FDA, EMA and MFDS, we demonstrated the linearity of the analytical method at trace levels, a key requirement for ensuring the accurate detection of nitrosamines. The method’s calibration curve showed excellent linearity across the relevant concentration ranges (2.0~50.0 ng/mL), ensuring compliance with the regulatory limits set for nitrosamine impurities (typically in the ppb range). This trace level sensitivity is critical for meeting the stringent acceptable intake levels defined by the authorities, such as the 26.5~96 ng/day range for various nitrosamines [20,21,22].
Furthermore, while the method’s initial calibration curve covered the necessary range for regulatory compliance, it has been shown that the range can be expanded for other applications, such as for products with higher impurity levels. The calibration curve range was extended up to 3000 ppb. It was observed that the residuals above 2000 ppb increased, although the coefficient of determination met the criteria. The range from 1 ppb to 1000 ppb is sufficient for detecting trace amounts of impurities in pharmaceuticals with the best linearity and coefficient of determination (R2: 0.9998~1.0000) (refer to ESI03, ESI04.pdf for details).
When using 30 m-long columns, inadequate separation or poor symmetry in the results were observed. An HP-INNOWAX column (60 m × 0.25 mm I.D × coated with 0.25 µm film, Agilent) was found to be suitable for peak shape and separation, as well as the response of nine nitrosamine impurities. When analyzing various real samples following the same procedure, the recovery rates met the established criteria (70–130%), suggesting applicability for general use.
All validation parameters, including system suitability, selectivity, linearity, accuracy, precision, LOD and LOQ, met the acceptance criteria recommended by ICH Q2 (R2) [11]. For example, the precision (expressed as %RSD) of nine impurities was below 5.6% across all analytes, indicating good repeatability. The linearity range (2.0–50.0 ng/mL) showed coefficients of determination (R2) from 0.99745 to 0.99981. Furthermore, the LOD (1 ng/mL) and LOQ (2 ng/mL) values, respectively, demonstrated high sensitivity, supporting their suitability for regulatory compliance at ppb-level detection [20,21,22]. It was also confirmed that the ion ratio tolerances within ±30% and the absence of interference confirmed the method’s selectivity, fulfilling the criteria set by regulatory guidelines [23].

6. Conclusions

In this study, we developed a highly accurate and precise GC–MS/MS method that can simultaneously analyze nine nitrosamine impurities (NDMA, NDEA, NMEA, NDPA, NDBA, NPIP, NMOR, DIPNA and EIPNA) in formulations containing high viscosity, emulsifying agents and volatile fragrance. For gel or ointment formulations, caution is required during sample preparation due to the inclusion of excipients that increase viscosity and exhibit amphiphilic properties, as well as fragrance. The presence of these characteristics necessitates the development of a sample preparation procedure to avoid the overlapping of nine nitrosamine impurity peaks and other peaks from excipients. This highly sensitive GC–MS/MS method is capable of quantifying nine nitrosamine impurities using the positive ionization mode with multiple reaction monitoring (MRM) and has been validated in accordance with ICH guidelines.
This analytical method demonstrated accuracy and precision in detecting impurities at very low concentrations. Although it was not feasible to validate the method for all types of samples, this study aimed to establish a fundamental analytical method that holds the potential for adaptation to other formulations through product-specific validation studies. As outlined in Section 4, the preliminary findings suggest that the method may be applicable to the analysis of nitrosamines in various dosage forms.

Supplementary Materials

The following supporting information can be downloaded at: https://www.mdpi.com/article/10.3390/separations12050120/s1. Supporting information can be found online in the Supporting Information section. The file named ESI01 summarizes the detailed results table obtained for each parameter (system suitability, selectivity, linearity, accuracy, precision (Repeatability), limit of quantification, limit of detection, solution stability) in the validation. ESI02 contains detailed GC–MS/MS data and chromatograms obtained during the method validation. ESI03 contains GC–MS/MS data and chromatograms obtained by applying this developed analytical method to other formulations, and the detailed calculation results are included in ESI04. ESI05 presents the calibration curves and residual plots observed in the linearity verification test of the method validation.

Author Contributions

Conceptualization, Methodology, Project administration, Validation, Investigation, Visualization, Writing—original draft, Writing—review and editing: N.L. Data curation, Formal analysis: N.L. and H.G. Project administration, Supervision: Y.-j.P. All authors have read and agreed to the published version of the manuscript.

Funding

This research was supported by a grant (21153MFDS602) from the Ministry of Food and Drug Safety.

Data Availability Statement

The data that support the findings of this study are available in the Supplementary Materials of this article.

Conflicts of Interest

Author Hyejin Go was employed by the company Pharmaentech, Inc. The remaining authors declare that the research was conducted in the absence of any commercial or financial relationships that could be construed as a potential conflict of interest.

Abbreviations

The following abbreviations are used in this manuscript:
NDMAN-nitrosodimethylamine
NDEAN-nitrosodiethylamine
NMEAN-nitrosomethylethylamine
NDPAN-nitrosodipropylamine
NDBAN-nitrosodi-n-butylamine
NPIPN-nitrosopiperidine
NMORN-nitrosomorpholine
DIPNAN-nitrosodiisopropylamine
EIPNAN-nitrosoethylisopropylamine
PEGPolyethyleneglycol
ESIElectronic Supporting Information (Supplementary Materials)
FDAFood and Drug Administration
EMAEuropean Medicines Agency
MFDSMinistry of Food and Drug Safety
RSDRelative Standard Deviation

References

  1. International Agency for Research on Cancer (IARC). IARC Monographs on the Evaluation of Carcinogenic Risks to Humans, Volume 17: Some N-Nitroso Compounds; IARC: Lyon, France, 1978. [Google Scholar]
  2. International Council for Harmonisation (ICH). Assessment and Control of DNA Reactive (Mutagenic) Impurities in Pharmaceuticals to Limit Potential Carcinogenic Risk M7(R1); ICH: Geneva, Switzerland, 2018. [Google Scholar]
  3. U.S. Food and Drug Administration (FDA). FDA Updates and Press Announcements on Angiotensin II Receptor Blocker (ARB) Recalls: Valsartan, Losartan. Available online: https://www.fda.gov/drugs/drug-safety-and-availability/fda-updates-and-press-announcements-angiotensin-ii-receptor-blocker-arb-recalls-valsartan-losartan (accessed on 24 April 2025).
  4. European Directorate for the Quality of Medicines; HealthCare (EDQM). Nitrosamine Testing Activities of the OMCL Network. Available online: https://www.edqm.eu/en/nitrosamine-testing-activities-of-the-omcl-network (accessed on 24 April 2025).
  5. Health Canada. Information Update—Angiotensin II Receptor Blockers (ARBs). Available online: https://www.canada.ca/en/health-canada/services/drugs-health-products/compliance-enforcement/information-health-product/drugs/angiotensin-receptor-blocker.html (accessed on 24 April 2025).
  6. Taiwan Food and Drug Administration (TFDA). Nitrosamines. Available online: https://www.fda.gov.tw/ENG/siteList.aspx?sid=10360 (accessed on 24 April 2025).
  7. Sehajpal, J.; Swann, T. Sample Preparation of Semi-Solid Pharmaceutical Formulations: Solid-Phase Extractions (SPE) of Hydrocortisone Valerate Ointment; Waters: Milford, MA, USA, 2018. [Google Scholar]
  8. Ikeda, K.; Migliorese, K.G.; Curtis, H. Analysis of nitrosamines in cosmetic. J. Soc. Cosmet. Chem. 1990, 41, 283–333. [Google Scholar]
  9. Kosure, E.R.; Bhanti, M.; Jaywant, M.A.; Han, M.; Wang, X.; Obeng, M. A GC-MS/MS Method for Trace Level Quantification of Six Nitrosamine Impurities (NDMA, NDEA, NEIPA, NDIPA, NDPA, and NDBA) in Commercially Used Organic Solvents: Dichloromethane, Ethyl Acetate, Toluene, and O-xylene. J. Pharm. Sci. 2023, 112, 1225–1230. [Google Scholar] [CrossRef] [PubMed]
  10. Schmidt, E.; Bail, S.; Buchbauer, G.; Stoilova, I.; Atanasova, T.; Krastanov, A.; Jirovetz, L. Chemical Composition, Olfactory Evaluation and Antioxidant Effects of the Essential Oil from Mentha x piperita. Nat. Prod. Commun. 2009, 4, 1107–1112. [Google Scholar] [CrossRef] [PubMed]
  11. International Council for Harmonisation of Technical Requirements for Pharmaceuticals for Human Use (ICH). Q2 (R2) Validation of Analytical Procedures; Adopted on 1 November 2023. Available online: https://database.ich.org/sites/default/files/ICH_Q2-R2_Document_Step2_Guideline_2022_0324.pdf (accessed on 2 May 2025).
  12. United States Pharmacopeia (USP). General Chapter <1469>: Nitrosamine Impurities; United States Pharmacopeial Convention: Rockville, MD, USA, 2021. [Google Scholar]
  13. Moser, J.; Ashworth, I.W.; Harris, L.; Hillier, M.C.; Nanda, K.K.; Scrivens, G. N-Nitrosamine Formation in Pharmaceutical Solid Drug Products: Experimental Observations. J. Pharm. Sci. 2023, 112, 1255–1267. [Google Scholar] [CrossRef] [PubMed]
  14. Moser, J.; Schlingemann, J.; Saal, C. N-Nitrosamines Impurities in Pharmaceuticals: The Abrupt Challenges that Resulted, the Evolving Science, and the Regulatory Framework. J. Pharm. Sci. 2023, 112, 1161–1162. [Google Scholar] [CrossRef] [PubMed]
  15. Rose, U. European Pharmacopoeia Activities on Control of Nitrosamines and Other DNA-Reactive Impurities. J. Pharm. Sci. 2023, 112, 1163–1165. [Google Scholar] [CrossRef] [PubMed]
  16. Wang, Z.; Hu, S.; Wu, X.; He, Z.; Ke, C.; Hu, M. A Highly Sensitive LC-MS/MS Method for the Determination and Quantification of a Recently Identified N-Nitrosamine Impurity in the Sitagliptin Phosphate Monohydrate Active Pharmaceutical Ingredient. Anal. Methods 2023, 15, 256–260. [Google Scholar] [CrossRef] [PubMed]
  17. U.S. Food and Drug Administration (FDA); Center for Drug Evaluation and Research (CDER). Control of Nitrosamine Impurities in Human Drugs Guidance for Industry; FDA: Silver Spring, MD, USA, 2024. Available online: https://www.fda.gov/media/141720/download (accessed on 2 May 2025).
  18. European Medicines Agency (EMA). Lessons Learnt from Presence of N-Nitrosamine Impurities in Sartan Medicines; EMA: Amsterdam, The Netherlands, 23 June 2020; Available online: https://www.ema.europa.eu/en/documents/report/lessons-learnt-presence-n-nitrosamine-impurities-sartan-medicines_en.pdf (accessed on 2 May 2025).
  19. Ministry of Food and Drug Safety (MFDS). Guideline on the Safe Management of Mutagenic and Carcinogenic Impurities in Pharmaceuticals [User Guide for Applicants]—Focusing on Nitrosamines among Impurities; MFDS: Osong, Republic of Korea, 26 September 2024. Available online: https://www.mfds.go.kr/brd/m_1060/down.do?brd_id=data0011&data_tp=A&file_seq=1&seq=15344 (accessed on 2 May 2025).
  20. European Medicines Agency (EMA). Nitrosamine Impurities. Available online: https://www.ema.europa.eu/en/human-regulatory-overview/post-authorisation/pharmacovigilance-post-authorisation/referral-procedures-human-medicines/nitrosamine-impurities (accessed on 24 April 2025).
  21. Ministry of Food and Drug Safety (MFDS). Guideline on Nitrosamine Impurities in Pharmaceuticals; Ministry of Food and Drug Safety: Cheongju, Republic of Korea, 2025. Available online: https://www.mfds.go.kr/brd/m_218/view.do?seq=33599 (accessed on 24 April 2025).
  22. U.S. Food and Drug Administration (FDA). Information About Nitrosamine Impurities in Medications. Available online: https://www.fda.gov/drugs/drug-safety-and-availability/information-about-nitrosamine-impurities-medications (accessed on 24 April 2025).
  23. European Commission Directorate-General for Health and Food Safety. SANTE/12682/2019: Analytical Quality Control and Method Validation Procedures for Pesticide Residues Analysis in Food and Feed; European Commission: Brussels, Belgium, 2019; Available online: https://food.ec.europa.eu/system/files/2020-01/pesticides_mrl_guidelines_wrkdoc_2019-12682.pdf (accessed on 2 May 2025).
Figure 1. (a) Blank solution; (b) 50 ng/mL standard solution; (c) sample solution; (d) 50 ng/mL spiked sample solution (refer to ESI02.pdf for details).
Separations 12 00120 g001aSeparations 12 00120 g001b
Figure 2. Representative chromatogram of precision verification solution (20 ng/mL of nine nitrosamine impurities with 10 ng/mL internal standards, respectively. Refer to Table 1 for each peak identification and retention time).
Separations 12 00120 g002
Figure 3. Representative chromatogram of LOQ verification solution (2 ng/mL of nine nitrosamine impurities with 10 ng/mL internal standards, respectively. Refer to Table 1 for each peak identification and retention time).
Separations 12 00120 g003
Figure 4. Representative chromatogram of LOD verification solution (1 ng/mL of nine nitrosamine impurities with 10 ng/mL internal standards, respectively. Refer to Table 1 for each peak identification and retention time).
Separations 12 00120 g004
Figure 5. (a) Chromatograms of NDMA and NDMA-d6; (b) chromatograms of NMEA and NMEA-d3; (c) chromatograms of NDEA and NDEA-d10; (d) chromatograms of EIPNA and NDEA-d10; (e) chromatograms of DIPNA and NDEA-d10; (f) chromatograms of NDPA and NDPA-d14; (g) chromatograms of NDBA and NDBA-d18; (h) chromatograms of NPIP and NDPA-d14; (i) chromatograms of NMOR and NMOR-d8.
Separations 12 00120 g005aSeparations 12 00120 g005bSeparations 12 00120 g005c
Figure 6. Peak distortion occurred due to excipient effects during HPLC method after repeated injections.
Separations 12 00120 g006
Table 1. Mass spectrometer conditions.
Name of Nitrosamines and Internal StandardsRetention Time
(min)
Quantifier
(MRM/Collision Energies (V))
Qualifier
(MRM/Collision Energies (V))
NDMA17.274 → 44/474 → 42/22
NDMA-d617.280 → 50/680 → 46/20
NMEA18.988 → 71/588 → 42/20
NMEA-d318.991 → 74/391 → 46/5
NDEA19.9102 → 85/5102 → 56/20
NDEA-d1019.8112 → 94/5112 → 50/10
EIPNA21.0116 → 99/5116 → 44/15
NDEA-d10 *19.8112 → 94/5112 → 50/10
DIPNA21.9130 → 88/5130 → 42/10
NDEA-d10 *19.8112 → 94/5112 → 50/10
NDPA24.3130 → 43/10130 → 71/10
NDPA-d1424.0144 → 50/20144 → 126/10
NDBA29.2158 → 99/5158 → 84/20
NDBA-d1828.994 → 62/2094 → 46/20
NPIP29.9114 → 84/10114 → 97/5
NDPA-d14 *24.0144 → 50/20144 → 126/10
NMOR32.0116 → 86/5116 → 56/25
NMOR-d832.0124 → 94/5124 → 62/15
* Due to peak overlap with the matrix, NDEA-d10 and NDPA-d14 were used instead of the isotopes.
Table 2. Linearity summary.
Test SolutionSpecificationNameMin.Max.
2.0~50.0 ng/mL for
nine impurity solutions
Coefficient of determination
R2 ≥ 0.99
NDMA0.998990.99936
NDEA0.998310.99959
NMEA0.999490.99981
NDPA0.998800.99939
NDBA0.997450.99812
NPIP0.998700.99894
NMOR0.998380.99874
DIPNA0.998450.99976
EIPNA0.998200.99955
Table 3. Accuracy summary (average recovery rate of three test solutions. Refer to ESI01.docx, S12~S20 for nine nitrosamine impurities for details).
Test SolutionSpecificationNameAverage/RSD (%)
5, 10 and 50 ng/mL spiked sampleRecovery rate: 70.0~130.0%NDMA114.23/5.27
NDEA110.75/4.98
NMEA110.47/4.09
NDPA108.35/5.73
NDBA111.62/9.34
NPIP113.34/5.10
NMOR99.15/6.28
DIPNA112.16/4.95
EIPNA114.68/4.76
Table 4. Precision summary.
Test SolutionSpecificationNameRSD (%)
Six replicates
(20 ng/mL)
RSD ≤ 20.0%NDMA4.7
NDEA3.8
NMEA5.1
NDPA3.8
NDBA5.0
NPIP5.6
NMOR4.9
DIPNA4.3
EIPNA3.6
Table 5. LOQ summary (RSD of six replicates and S/N. Refer to ESI01.docx, S22~S30 for nine nitrosamine impurities for details).
Test SolutionSpecificationNameRSD (%)S/N
Min, Max
2 ng/mL solutionRSD ≤ 20.0%
Signal-to-noise (S/N) ≥ 10
NDMA2.22226.1,   36.3
NDEA2.50519.3,   25.2
NMEA4.36623.6,   38.6
NDPA2.96828.8,   54.2
NDBA7.88928.2,   56.7
NPIP0.71211.6,   17.1
NMOR1.49317.0,   30.9
DIPNA1.44429.3,   40.0
EIPNA1.60520.0,   27.4
Table 6. LOD (RSD of three replicates and S/N. Refer to ESI01.docx, S31~S39 for nine nitrosamine impurities for details).
Test SolutionSpecificationNameRSD (%)S/N
Min, Max
1 ng/mL solutionSignal-to-noise (S/N) ≥ 3NDMA2.04016.3,   27.0
NDEA5.54210.1,   13.5
NMEA2.15617.5,   25.6
NDPA0.77817.0,   43.8
NDBA6.23015.8,   19.4
NPIP4.2777.5,  11.1
NMOR1.69510.9,   16.1
DIPNA0.74116.5,   20.4
EIPNA1.46513.1,   18.1
Table 7. Robustness summary (change rate after 24 h, 48 h. Refer to ESI01.docx, S40~S48 for nine nitrosamine impurities for details).
Test SolutionSpecificationNameChange Rate
(24 h, 48 h (%))
50 ng/mL spiked sampleChange rate after 24 and 48 h (%) ≤ 20.0%NDMA0.75, 0.26
NDEA0.61, 3.07
NMEA0.55, 2.18
NDPA1.72, 3.19
NDBA0.93, 1.32
NPIP4.01, 6.38
NMOR2.39, 0.82
DIPNA4.14, 5.95
EIPNA2.21, 4.13
Table 8. Summary of recovery rate (%) (no.1: ointment, no.2: injection, no.3: solid powder).
No.NDMANDEANMEANDPANDBANPIPNMORDIPNAEIPNA
181.790.789.686.393.489.088.784.980.0
287.183.983.377.285.380.582.983.682.4
394.885.882.389.088.382.685.579.678.5
Disclaimer/Publisher’s Note: The statements, opinions and data contained in all publications are solely those of the individual author(s) and contributor(s) and not of MDPI and/or the editor(s). MDPI and/or the editor(s) disclaim responsibility for any injury to people or property resulting from any ideas, methods, instructions or products referred to in the content.

