Abstract
The efficient separation and removal of carbon dioxide () from its mixtures is an important technological challenge to limit effects resulting from the increase of the carbon dioxide concentration in the atmosphere. Membrane technology is an environmentally friendly approach, highly scalable and less energy-consuming than conventional methods such as adsorption, absorption and cryogenic separation. Hybrid membrane materials incorporating inorganic filler nanostructures in polymer matrices having polyethylene glycol (PEG) as a plasticized additive are promising membrane materials given the presence of -philic polar functional groups of PEGs and the structural refinements on the blend matrix consequent to the filler distribution. In this review, literature information on hybrid polymer/PEG membranes are critically reviewed to discuss how filler dispersion in the blend matrix gives rise to enhanced separation performances with respect to those obtained with traditional mixed matrix membranes where filler nanostructures are dispersed in the neat polymer. The discussion will be focused on the correlation between the transport properties, membrane structural properties and defect resulting from the polymer-filler incompatibility. It is shown that hybrid polymer/PEG membranes with dispersed filler nanostructures simultaneously offer improved separation performances and enhanced mechanical properties compared with nanocomposite ones where filler particles are dispersed in the neat polymer matrix. PEG addition enhances the filler-matrix compatibility, delays filler aggregation and limits the formation of filler-matrix interface defects.
1. Introduction
Carbon Capture, Utilization and Storage (CCUS) technologies have emerged as critical components in the effort to limit global warming consequent to emissions from industrial processes and power plants [1]. CCUS technologies are designed to capture directily from the emission sources, thus preventing its release into the atmosphere: the captured carbon dioxide can then be stored in deep geological formations or employed for various applications such as the production of chemicals or fuels using renewable energies, thus offering additional incentives for industries to adopt them [2].
Different capture/separation technologies are industrially employed: absorption (water, physical and chemical scrubbing), adsorption and cryogenic separation [3]. In the adsorption process, gas mixture separation occurs after preferential absorption of components of a gas mixture by a liquid or a solvent: in the water scrubbing process, is absorbed by water, and in the chemical absorption process, by amines [4]. Adsorption involves the physical adsorption of gas components to the surface of an adsorbent solid [5]. Cryogenic separation takes advantage of the different liquefaction points of the gas mixture components under specific pressure and temperature conditions [6]. Each method possesses its proper advantages and disadvantages. Water scrubbing, for example, is a simple but slow process that requires low investment costs but also pre-treatments of the gas mixture to remove contaminants ( and siloxanes); moreover, it needs huge amounts of fresh water. Chemical scrubbing is a fast process but requires high investment costs, is energy-consuming and needs harmful and expensive absorbing substances: research is, in fact, focusing on the preparation of eco-friendly and cheap sorbent materials [7,8,9,10]. Adsorption does not require high investment capital but a complex set-up. Cryogenic separation does not use harmful substances but has high operating costs and, needing compressors and heat exchangers, requires high operative costs [11].
Gas separation by membrane techniques is of great applicative interest because it permits the development of compact systems with high energy efficiency and operational simplicity [12] to contribute to the “Process Intensification” strategy based on the improvement of the manufacturing process through the minimization of equipment volume, energy consumption, waste production and environmental impact [13,14].
Efficient membrane-separation systems have been developed and routinely employed for separation from , and purge gases in ammonia and chemical plants and in oil refineries [15], for purification in synthesis gas [16] and in natural gas treatment [17].
Considering global warming and climate changes, research efforts are nowadays directed to the development of innovative membranes for separation and capture. The challenge is to develop effective membrane materials to be employed in large-scale stationary plants, which can be industrially manufactured at affordable costs; for this application, polymers are the most attractive materials, given their simple and cost-effective fabrication methods [18]. Different applications are envisaged for separation with polymer membranes, which require physical and chemical refinement of the commercial polymeric materials structure to tailor their operative properties [19,20,21].
separation from post-combustion flue gases. Flue gases are discharged at ambient conditions and contain 11 to 14% when their sources are coal-fired power plants and 4 to 8% from natural gas combined cycle power plants [22,23]. Given the low partial pressure, the separation process requires highly permeable and selective membranes [24]. To separate gases with similar molecular sizes and improve the membrane performances, the chemical properties of the polymeric material are changed to improve the solubility by introducing Lewis bases such as, for example, ether and carbonyl oxygen [25] or by -matrix chemical interactions introducing amines [26].
separation in natural gas and biogas sweetening (pre-combustion). Natural gas contains 5 to 70% depending on the geographical location of the source. Carbon dioxide separation is carried out at ambient temperature with gas mixtures at high pressure, 30 to 60 atm. The membrane material should thus offer good mechanical properties and plasticization resistance caused by the high partial pressure and the presence of hydrocarbon species [27]. Plasticization and swelling give rise, in fact, to an increase in the interchain spacing and consequently drastically reduce the sieving selectivity: research is thus focused on the synthesis of shape persisting polymers with high chain rigidity [28]. These high-pressure-related properties are not required for biogas purification as the gas mixture is produced at ambient conditions, with content typically of 38 to 40% and content of 55 to 60% and water vapor of 1 to 2% [29].
separation in syngas processing. Syngas composition is typically 40% , 56% with a balance of water and . Membranes for separation operate at 240 °C temperature and 50 atm pressure [30]: the high transmembrane pressure reduced the requirement of high permeability, but thermally stable membranes with high and selectivity at high temperatures are required [31]. Research activity for the development of more performing membranes for syngas processing is focused on tuning the polymer chain configuration to obtain size-sieving selective membranes [23].
separation in plasma reformed mixtures. The separation and removal of from mixtures containing is gaining increasing interest due to the development of novel processes for utilization using renewable energy such as non-thermal plasma-activated reactions for splitting [32].
Currently, 90% of separation membranes that are used in the commercial module configurations are made of polymer: cellulose acetate (CA), polysulfone (PSf), polyethersulfone (PES) and polyimides (Matrimid®5218) are used at an industrial level, offering at 30 °C acceptable permeability values (from 5.6 Barrer for PES to 10.7 Barrer for Matrimid®5218), selectivity values (from 22 for PES to 44 for Matrimid®5218) and selectivity values (from 22 for PES to 33 for Matrimid®5128) [33,34].
The preferred route to develop innovative polymer membranes with improved separation performance is the modification of commercial materials, as it requires lower costs and an easier approach than the development of new polymeric materials [35]. Improved membrane separation performances are obtained by tailoring the membrane structure to improve the solubility, as, for example, by introducing affine functional groups or developing block copolymer with higher affinity, or to improve the diffusivity by modifying the polymer free volume structure or by combining polymers with nano-dimensional dense or porous filler structures [18,21].
This review describes the operative performances of polymer and polymer nanocomposite membranes modified by blending with poly(ethylene oxide). The PEO macromolecular chain structure contains —philic etheric groups, and PEOs have been widely studied as polymer additives for common polymeric membranes such as polysulfones, polyimides and polycarbonates to enhance their separation properties [36,37]. This plasticizer polymer additive is of great interest as a blending agent for commercial polymers, as it is cheap, available, non-toxic and can be easily combined with different polymers [38].
The novelty of this review is that reported experimental data are discussed to understand how enhanced functional properties are correlated with the membrane structural properties after PEG and filler addition rather than focusing on the obtained separation performances. To this task, separate discussions are carried out on the examined polymeric membrane materials, considering the relation between membrane structure and performances of the nanocomposites (neat polymer with dispersed filler nanoparticles) and then considering the structure-performance relation of the hybrid ones (polymer/PEG blend with dispersed filler nanoparticles). The aim is to underline how the PEG additive enhances the performance of the hybrid membrane with respect to the nanocomposite one. The analysis will focus on polymeric membranes for applications in separation from post-combustion flue gases and in separation in natural gas and biogas sweetening (pre-combustion).
2. Notes on the Gas Transport in Polymeric Membranes
2.1. Solution-Diffusion Model
Gas permeation through dense polymer membranes obeys the solution-diffusion mechanism, which assumes that gas transport follows three steps: (i) Gas phase molecules are absorbed in the near-surface layers of the membrane side exposed to high-pressure feed gas or feed gas mixture (high-pressure side), (ii) absorbed gas molecules diffuse down to their concentration gradient to the membrane side exposed to gas at low pressure (low-pressure side), generally negligible compared with the feed pressure and (iii) here their desorption occurs [39]. Gas molecules absorbed in the polymer membrane are hosted in void-like structures called free volume elements, which are formed by the irregular packing of the polymer chains and by the local thermal fluctuation of chain segments. Free-volume elements have the sub-nanometric size and control the transport of gas molecules because their migration from the high-to the low-pressure side takes place by successive jumps between randomly-formed free volume elements [40].
Two parameters control the gas permeation process: the penetrant solubility which is expressed in cm3 (STP)/cm3 cmHg practical units, and the penetrant diffusivity , which is expressed in cm2/s units. Penetrant sorption is a two-step process involving penetrants’ condensation to a liquid-like density followed by their mixing with the polymer chains [41].
The penetrant solubility depends on temperature as
where the sorption enthalpy is given by the sum of two terms: the condensation enthalpy and the mixing enthalpy of absorbed penetrants with the polymer matrix [41]. In the previous relation, is the pre-exponential solubility factor, and the universal gas constant.
Gas diffusion in polymers is a thermally activated process, and the diffusion constant exhibits an Arrhenius behavior:
where is the effective activation energy for diffusion, and is the pre-exponential factor [41]. Experimental reports indicate interesting regularities. Concerning the solution process, it was observed that in most gas-polymer couples , a strong correlation exists between parameters measuring the gas condensability (the critical temperature or the Lennard-Jones parameter ) and the condensation enthalpy empirically expressed as
where is the Boltzmann constant, while and are constant [41].
The quantity in the Lennard–Jones parameter in Equation (3) is the bond energy of the Lennard–Jones () pair potential , which models the weak van der Waals interaction between molecules: is the distance between molecules, and is the bond length. The and parameters are empirically determined, fitting known properties of the gas [42].
Concerning the diffusion process, it was observed that the diffusion constant increases, decreasing the gas molecular size with the square of a characteristic molecular size as a scaling parameter, thus suggesting that is proportional to the effective cross-sectional area of the gas molecule [41]. Molecular weight, kinetic diameter and Lennard–Jones parameters for , and are reported in Table 1.

Table 1.
Physical and chemical properties of gases involved in carbon dioxide separation [43].
2.2. Operative Membrane Parameters
The product between gas solubility and diffusivity defines the membrane permeability , which is generally reported in Barrer practical units: 1 Barrer = 10−10 cm3 (STP) cm/cm2 s cmHg = 3.35 × 10⁻¹⁶ mol/m s Pa [41]. The permeability value depends on the specific polymer-gas couple spanning over orders of magnitude, and its value changes with the membrane temperature and feed gas pressure . The permeability value is experimentally obtained by measuring the permeation flux through the membrane in stationary transport conditions, which is given by the following relation:
where is the membrane thickness, and is the trans-membrane pressure gradient.
For a given gas couple (), the membrane selectivity is given by the relation , where is the most permeable gas [41]. The selectivity values are mostly determined from permeability measured in single gas tests, and the obtained selectivity is referred to as “ideal”. It is given by
And can be thus portioned into diffusivity-selectivity and solubility-selectivity . Independent determination of the gas diffusivity values and and/or solubility values and allows for the separate evaluation of the and values and permits evincing which is the mechanism responsible for the membrane’s selective properties [41].
2.3. Robeson Limit
Membrane separation requires membranes with high permeability to a specific gas species A and high selectivity to obtain high purity of the separated gas. The large amount of scientific literature on polymer membranes for gas separation provides evidence that an empirical trade-off exists between permeability and selectivity for any gas couple: polymers exhibiting high selectivity values for gas are generally less permeable to this gas, and vice-versa [44]. Such a trade-off, called the Robeson limit, can be described as an upper bound where all permeability-selectivity data in a log-log scale are below an empirical line.
This upper bound is quantitatively described by a line:
Which reports the evidence that as the permeability for a gas increases, the selectivity of a polymer membrane toward the gas pair decreases. Freeman introduced a semi-quantitative model to predict the values of the and parameters for a given gas pair [45]. The model considered that the parameter depends on the kinetic diameters of the gas molecules and , while the parameter is related to their solubility values and :
where and and are numerical parameters. The parameter depends on the polymer class (e.g., rubbery or glassy), while is universal for all polymers. The parameter changes with the equilibrium inter-chain spacing increasing from rubbery to glassy polymers [45].
The recently proposed and upper bounds lines [44] are reported in Section 11, “Discussion”, and will be presented with experimental data on the membrane systems reviewed in the next sections of this manuscript.
3. Polyethylene Oxide as Polymeric Additive
Polyethylene oxide (PEO) is a family of synthetic water-soluble polymers made of repeated oxyethylene segments forming chemically stable, non-toxic and biodegradable compounds: when the PEO molecular weight is lower than 20,000 PEOs are generally called polyethylene glycol (PEG) [46]. The PEGs’ physical properties depend on the value: the glass transition temperature , for example, and the melting temperature increase with the molecular weight; see Table 2. At ambient conditions, PEGs with < 600 are liquids, PEGs with > 3000 PEGs are solids, and their crystalline degree increases with , while at intermediate values, PEGs are low melting, waxy and partially crystalline solids [47]. PEGs are of great interest for the development of innovative separation membranes because the presence of polar ether groups (, where and are alkyl or aryl groups) in the main chain enhances their affinity with carbon dioxide, increasing the carbon dioxide solubility [47]: the symmetric molecule, in fact, has a permanent quadrupole moment and aligns its oxygen atom near the positively charged carbon region of the ether-containing polymer while the carbon atoms are accommodated near the negatively charged oxygen atoms of the ether group. Their use as additives is widely investigated to improve the operative performances of common polymeric membranes [48].
Table 2.
Physical properties of some PEG [47]. : molecular weight, : mass density, : glass transition temperature, : melting temperature, : crystalline degree.
The use of PEG as an additive in polymeric membranes raises many challenges. Experimental permeation tests have shown that the gas permeability of pure PEG membranes decreases by increasing the PEG molecular weight because increasing the PEG molecular weight increases the crystalline degree of the PEG membrane. The addition of high molecular weight PEG to the polymer matrix can thus worsen the membrane transport properties because dispersed PEG crystals are impermeable to penetrant molecules; consequently, their presence in the matrix increases the tortuosity of the penetrant diffusion path and reduces the membrane free volume [47]. Low molecular weight PEGs are, on the contrary, liquid, do not form crystalline domains in the polymer matrix, and are thus of major interest for the preparation of blend membranes: issues such as their effects on the membrane mechanical properties must be considered as well as their low value ranging from −77 °C to −81 °C for PEG200 and PEG1000, respectively, which raises compatibility issues with the membrane operative conditions [47].
4. Polymer Blends
Polymer blending consists of the physical mixing of two or more polymers (in binary mixtures, generally glassy and rubbery) to fabricate new materials with enhanced and tailored properties in a cost-effective manner by recycling plastic waste. In membrane separation, polymer blends are of interest because they permit the improvement of separation properties together with the possibility of suppressing plasticization and improving mechanical strength [48]. Blends can have a homogeneous or heterogeneous nature (often defined as miscible or immiscible polymers): their miscibility occurs when the following relations hold:
where is the free energy of mixing, and are the enthalpy and entropy of mixing, respectively, and is the temperature. The term is generally negligible compared with because the number of possible configurations of the macromolecular chains is restricted. The value thus controls the sign, which is negative when intermolecular attractive interactions between the two components exist [49,50,51]. In addition to the above-mentioned criterion, for blend miscibility, the following relation must hold:
where represents the volume fraction of a component, and the temperature and pressure; for a polymer blend thus varies with its composition [49,50,51].
Favorable interactions for macromolecular chains mixing of the two polymers, such as hydrogen bonding, form homogeneous blends with single-phase properties. Well-mixed polymer blends exhibit uniform thermal and mechanical properties and offer stable operative performances and, therefore, have high potential interest for commercial production [49,50,51].
The structure of polymer blends and the miscibility of their components are studied by combining different analytical techniques, and, on a laboratory scale, the most employed are Scanning Electron Microscopy (SEM), Differential Scanning Calorimetry (DSC), Fourier Transform Infrared Spectroscopy (FTIR) and X-ray Diffraction (XRD) [52,53].
SEM analysis permits us to examine the polymer blend surface and cross-sectional morphology and reveals good mixing when clear, homogeneous single-phase images appear. On the contrary, immiscible polymers are shown by morphologies such as, for example, dispersion of minor phase into major constituent phase (shown by droplets/domains formation with size and distribution depending on the blend composition) or by the presence of planar alternating phases (lamellae morphology) [54].
The glass transition temperature () value is a thermodynamic parameter describing the temperature at which the polymer undergoes a transition from a glassy, hard and rigid state to a rubbery, soft state. The most used technique to evaluate the value is DSC with scan temperatures from −150 to 700 °C. In DSC testing, the sample will run with two consecutive scans of heating and cooling at a specific heating rate: the first run is used to cancel the thermal history of the sample, while the second one permits determining temperatures where thermal transformation processes occur in the polymer sample: glass transition, crystallization and melting. DSC analysis permits us to obtain information on the mixing degree. In neat and homogeneous well-mixed blend polymers, in fact, a single value is found, while in immiscible polymers, two distinct values are observed, each pertinent to the original polymer. In partially miscible polymers, two values appear that shift to each other depending on the components’ loading [55].
FTIR spectroscopy is widely used for the characterization of polymer blends and the study of the interactions between the macromolecular chains of the blend components. The most common interactions between blend components are hydrogen bonding and dipole-dipole bonds. Their presence in the blend is indicated by variations in the IR absorption bands’ intensity and position after blending, which generally induces miscibility of the blend components, while charge transfer interactions are revealed by the formation of new, distinct absorption bands [56].
Polymers exhibit crystalline, semi-crystalline and amorphous structures. Highly crystalline polyethylene (PE), for example, presents XRD patterns with sharp, well-defined reflection peaks, while amorphous polymers such as polycarbonate present very broad features, often called diffraction halos, not defined by any crystalline model. Semi-crystalline polymers such as polypropylene (PPE) present XRD patterns that are a mix of them. Diffraction patterns are additive: when a polymer is mixed with another polymer, the resulting blend pattern shows contributions from both constituents. The analysis of the blend peaks, namely intensity peak position variation as a function of the additive content, provides information about the variation of the crystalline degree and interchain distance (-parameter) using Bragg’s law [57].
5. Polymer/PEG Blend Membranes for Separation
5.1. Polycarbonate (PC)
Polycarbonate (PC) are glassy thermoplastics containing carbonate groups widely used for industrial and domestic applications: PC membranes are studied for gas separation, offering good thermal resistance and mechanical properties [58].
Hamrahi et al. prepared PC blend membranes with PEG300 at contents up to 5 wt. % and observed that the mass density of the blend samples increased with the additive content from 1.140 g/cm3 for the neat material to 1.223 g/cm3 for the blend with 5 wt. % PEG300 content [59]. SEM micrographs of the pristine PC membrane sample as well as those of blend samples containing 1 and 3 wt. % PEG300 showed homogenous morphology without visible cracks or voids, while at 5 wt.% PEG300 content, and small, liquid PEG300 aggregates were observed, indicating partial phase separation. FTIR absorption spectra suggested the formation of hydrogen bonds between the carbonyl group of the PC chains and the terminal group of PEGs, which explained the good miscibility of the polymer components. DSC analysis showed a single value decreasing from 135 °C for the neat PC membrane to 126, 117 and 105 °C at 1, 3 and 5 wt.%, respectively, thus confirming the good mixing of the polymer components. The XRD pattern of the neat PC membrane showed a broad XRD peak at = 17.63°, indicating the -spacing value of 5.038 Å. This reflection peak shifted to larger angles with the addition of 1 and 3 wt. % PEG, indicating a decrease in the -spacings to 4.582 and 3.619 Å, respectively, while at 5 wt.% PEG300 content increased to 4.065, but a new reflection peak appeared at 2 = 5.91°, confirming partial phase separation at this additive content as suggested by SEM analysis. Results of characterization tests are reported in Table 3.
Table 3.
permeability and selectivity of neat and PC/PEG300 blend membranes with different additive content measured in single gas tests at 25 °C and 3 bar feed pressure. The membrane mass density, the -spacing and the values are also reported (CA average = 21,000 g/mol; Khuzestan Petrochemical, Iran) [59].
and transport tests were carried out by the variable pressure—constant volume method at 3 bar and 25 °C: results showed that increasing the PEG300 content, the permeability slightly decreased while the selectivity slightly increased. The authors suggested that the decrease in the permeability accompanied by the selectivity enhancement was a consequence of the increase in the polymer chain packing, as also suggested by an increase in the mass density, enhancing the selectivity but reducing the blend free volume and thus the membrane permeability.
5.2. Cellulose Acetate (CA)
Cellulose acetate (CA) is a biodegradable cellulose ester commercially produced in the form of thin films for packaging applications given its good mechanical properties, transparency and affordable cost. This biopolymer is of interest for the development of separation membranes for carbon dioxide removal from natural gas, offering acceptable separation properties due to the high solubility [60].
Li et al. prepared CA/PEG blends with different PEG formulations at 10 wt. % content and tested the gas separation performances by the constant volume—variable pressure method at 35 °C and 0.26 bar feed pressure [61]. Results showed that the permeability and selectivity increased with the PEG molecular weight while the , and transport rates decreased; see Figure 1. The optimal separation performances were obtained with the PEG20000 additive: the permeability increased, in fact, from 5.96 Barrer for the neat CA membrane to 7.49 Barrer, the ideal selectivity was ~30 as in the neat membrane, and the ideal selectivity increased from 25.8 to 36.2. Changing the PEG20000 content from 10 to 50 wt. % the permeability showed negligible variation accompanied by a decrease in the and selectivity values. The analysis of the permeation curves evidenced that the improved transport rates were caused by an enhanced diffusivity, which increased from 0.56 × 10⁻⁸ cm2/s in the neat sample to 1.00 × 10⁻⁸ cm2/s with 10 wt. % PEG 20000; the solubility, on the contrary, decreased from 106.4 × 103 cm3 (STP)/cm3 cmHg to 74.9 × 103 cm3 (STP)/cm3 cmHg. Structural characterization tests were carried out on the neat CA and on the CA/PEG20000 blend membrane. XRD tests indicated that the -spacing reduced from 5.2 nm for the neat sample to 5.0 nm with 10 wt. % PEG20000 and that the chain packing increase was accompanied by a small increase in the membrane mass density. DSC measurements of the neat membrane showed a single value at 185.5, while in the blend membrane with 10 wt. % PEG20000, it was 183.7 °C, evidence of component mixing. At larger contents, a second value was observed at temperatures between −54 and −51 °C, suggesting phase separation between the polymer components. It was suggested that the improved separation properties were connected to the high diffusivity selectivity caused by the increased polymer chain packing.
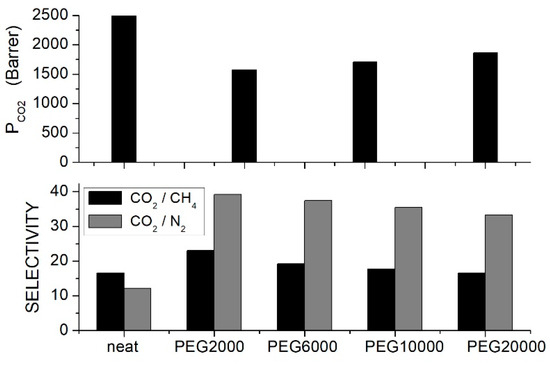
Figure 1.
permeability (upper panel), and selectivity (lower panel) of CA/PEG blend membranes with different PEG formulations (10 wt. % content) measured in single gas tests at 35 °C and 0.25 bar feed pressure [61].
5.3. Matrimid®5218
Matrimid®5218 (3,3′,4,4′-benzophenone tetracarboxylic dianhydride and diaminophenylindane) is a semi-crystalline commercial polyimide that exhibits good thermal and mechanical properties and is highly soluble in organic solvents; it is deeply investigated for the preparation of separation membranes as it offers reasonable separation properties despite low transport rates [62].
To improve the permeability of Matrimid® membranes, Castro-Munoz et al. prepared Matrimid®5218/PEG200 blend membranes with additive content up to 5 wt. % [63]. DSC analysis showed that PEG addition slightly increased the value from 310 °C for neat Matrimid®5218 to 315 °C for the blend with 5 wt. % PEG content, evidencing good mixing of the two components as a consequence of hydrogen bonding between nitrogen atoms in imide groups of Matrimid and hydrogen atoms in terminal hydroxyl groups of PEG chains, as suggested by FTIR analysis. As a consequence of good component mixing, similar TGAs were observed for the neat and blend samples: the neat membranes showed thermal stability from 300 to 470 °C and slightly better for the blend ones up to 500 °C. SEM analysis showed homogeneous cross-sectional and surface morphology, suggesting partial phase separation at 5 wt. % PEG200 content. Permeation tests were carried out at 25 °C and 8 bar feed pressure with equimolar gas mixtures. Results demonstrated that the PEG200 addition improved the permeability of the Matrimid®5218 matrix and the best performances were obtained with the Matrimid/PEG200 blend containing 4 wt. % additive; see Figure 2. The permeability increased, in fact, from 7.2 to 27.59 Barrer, but the selectivity slightly changed. The authors attributed the improved membrane permeability to the high solubility in PEG due to the interaction between the additive and molecules.
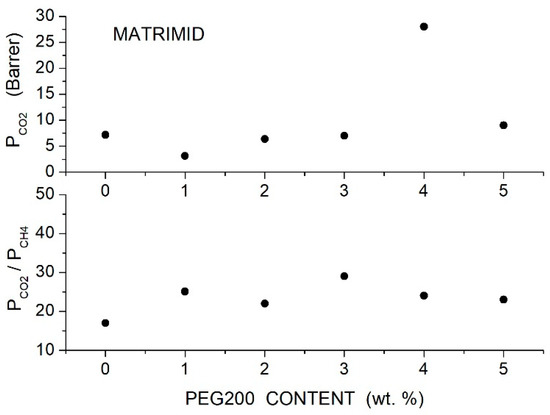
Figure 2.
permeability (upper panel) and and selectivity (lower panel) of Matrimid/PEG blend membranes as a function of PEG200 content measured with equimolar gas mixtures at 25 °C and 8 bar feed pressure [63].
Loloei et al. also prepared Matrimid/PEG200 blend membranes with larger additive content [64]: DSC analysis showed a single value decreasing from 310 °C for the neat membrane to 297 °C at 5 wt. % content, suggesting a good mixing of the polymer components. At larger PEG200 contents, a second value appeared at −30 °C, suggesting phase separation and the formation of PEG200 domains; see Table 4. The good mixing of the polymer components was a consequence of hydrogen bonding interactions between PEG and Matrimid, as suggested by the shift of the Matrimid stretching bands toward lower frequencies with PEG addition. XRD analysis showed that PEG200 addition: (i) reduced the intensity of the broad Matrimid® diffraction peaks at ≅ 14 and 17°, indicating an increase in the blend amorphous fraction, and (ii) shifted the XRD peaks to lower angles, indicating an increase in the -spacing from 0.521 nm in neat Matrimid® to 0.553 nm in the blend with 5 wt. % additive content. SEM analysis of the sample cross-section revealed a dense and homogeneous structure up to 5 wt. % PEG200 content; at larger contents, macroscopic voids and pores formed. Single gas permeation tests were carried out at 35 °C and 10 bar feed pressure. Results revealed that the permeability increased with the additive content from 7.7 Barrers for the neat membrane to 22.0 Barrers for the blend with 20 wt. % PEG200 content, while the selectivity slightly increased from 35 for the neat membrane to 40 for the blend with 5 wt. % PEG200 content and decreased at larger contents; see Table 4. This enhancement was attributed to the strong affinity of with the polar ether segments of PEG by dipole-quadrupole interactions, while the selectivity decrease was observed with 10 to 20 wt. % additive content was attributed to the non-selective voids shown by SEM in the blend membrane; see Table 4.
Table 4.
permeability and selectivity of Matrimid/PEG200 blend membranes as a function of the PEG200 content as obtained in single gas tests at 35 °C and 10 bar feed pressure. The glass transition temperature () and the melting temperature () are also reported [64].
5.4. Polysulfones (PSF) and Polyethersulfones (PES)
Polysulfones (PSF) and Polyethersulfones (PES) are high-performance amorphous thermoplastics that contain aryl--aryl subunits responsible for their mechanical toughness and chemical and thermal stability over a wide temperature range from −100 °C to 160 °C. Thanks to these properties and their low cost, polysulfones are widely used for the fabrication of commercial separation membranes [65].
Nasarian et al. prepared polysulfone/PEG blend membranes with PEG4000, PEG6000 and PEG10000 with a homogeneous and defect-free structure [66]. XRD tests showed the amorphous structure of the neat and blend with the broad halo between = 15 and 25°, shifting to lower angles increasing the additive content: the spacing increased from 2.11 Å for the neat membrane to 3.87 Å for the PSF blend with 20 wt. % PEG10000. No interaction between PSE and PEG chains was shown by the FTIR spectra. DSC tests of the neat PSF and PEG10000 samples showed values of 178.9 and −40.2 °C, respectively. The blend membrane with low molecular weight PEG4000 at 10 wt. % content exhibited two glass transition temperatures, the first one at = 28.3 °C and the second one at 133.1 °C, evidence of partial component mixing. Increasing the PEG molecular weight and content, the miscibility between the two components increased, and the blend with PEG10000 at 20 wt. % presented a single value at 161.1 °C; see Table 5.
Table 5.
The -spacing value, tensile strength and Young’s modulus of the PSF/PEG blend membranes with different additive types and content [66].
Single gas permeation tests were carried out at 30 °C and 10 bar feed pressure, and results indicated that the permeability increased with PEG content and molecular weight; see Figure 3. Optimal performances were observed with the PEG10000 blend membrane: the permeability increased from 5.61 Barrer for the neat PSF membrane to 7.12 and 7.64 Barrer at 10 and 20 wt. % additive content, respectively. The selectivity of the neat PSF membrane was 27, and negligible variations were observed after blending, while the selectivity slightly increased from 26 for the neat sample to 32 for the blend with 20 wt. % PEG10000 content. The improved penetrant permeability was attributed to the larger interchain spacing increasing the fractional free volume, while the small increase in the selectivity was attributed to the interaction with polyether polar bonds of PEG. The authors observed that component mixing also influenced the blend’s mechanical properties: adding low molecular weight PEG4000 and PEG6000, there was, in fact, a worsening of the blend’s mechanical properties as a consequence of immiscibility between the two components while adding high molecular weight PEG10000 molecularly, the Young’s modulus and the tensile strength were improved with respect to the neat membrane; see Table 5.
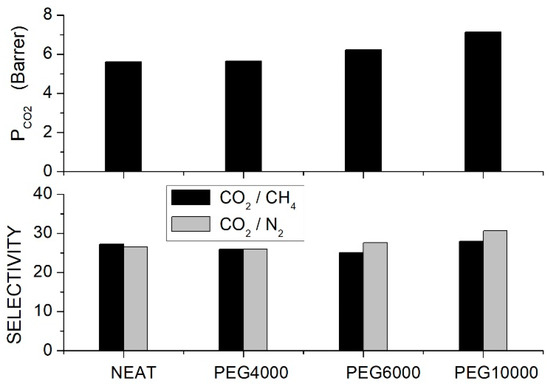
Figure 3.
permeability (upper panel) and ideal selectivity (lower panel) of PSF/PEG blend membranes with different PEG formulations (10 wt. % content) as measured in single gas tests at 30 °C and 10 bar feed pressure [66].
5.5. Polymers of Intrinsic Microporosity (PIMs)
Polymers of Intrinsic Microporosity (PIMs) are glassy, organic microporous materials that contain a continuous network of interconnected pores with a size smaller than 2 nm: PIMs have high free volume, high internal surface area, and are thus widely investigated for membrane applications offering high gas permeability values [67].
PIM-1, the prototype PIM, is the most studied one given its excellent workability and solubility in common solvents, and different applications ranging from gas adsorption to nanofiltration are envisaged [68,69]. PIM-1 is of interest for the development of an innovative gas separation membrane offering 2300 Barrer permeability and selectivity value close to 25 [68,69]. PIM-1 is synthesized via polymerization of 5,5′,6,6′-tetrahydroxy-3,3,3′,3′-tetramethyl-1,1′-spirobisindane (TTSBI) and 2,3,5,6-tetrafluoroterephthalonitrile (TFTN) by a high-temperature route (120–180 °C) in short process times (from several minutes to few hours) or by a low-temperature route (50–70 °C) in longer process times (72 to 96 h). This is a versatile membrane material because the synthesis conditions strongly influence the structural properties that control the gas permeability and selectivity, such as the chain packing [68,69].
To improve the PIM-1 selective properties, Wu et al. prepared PIM-1 blend membranes with different PEG formulations [70]. SEM analysis showed that up to 2.5 wt. % content, the PEG additive was well distributed in the PIM-1 matrix, forming blends with a homogeneous and uniform structure, while at larger contents PEG, aggregates formed. XRD analysis of the blend samples with additive content not larger than 2.5 wt. % showed diffraction peaks pertinent to the PIM-1 structure with -spacing of 0.66 and 0.49 nm pertinent to loosely packed polymer sites surrounding the micro-pores and to more efficiently packed chains, respectively. PEG addition shifted the reflection peaks to larger diffraction angles, and the authors observed that the larger the PEG molecular weight, the larger the shift was. This indicates that short PEG chains more easily fill the gaps between the PIM-1 chains and increase the matrix packing. In fact, the mass density on the neat membrane, 1.122 g/cm3, increased to 1.152 g/cm3 by adding 2.5 wt. % PEG2000, while it decreased to 1.146, 1.135 and 1.132 g/cm3 with 2.5 wt. % PEG6000, PEG10000 and PEG20000, respectively. Single gas permeation tests were thus carried out at 30 °C and 4 bar feed pressure using blended homogeneous membranes containing PEGs at 2.5 wt. % content. Results showed that the addition of all PEG formulations decreased the permeability of the neat PIM-1 membrane but increased the and selectivity; see Figure 4.
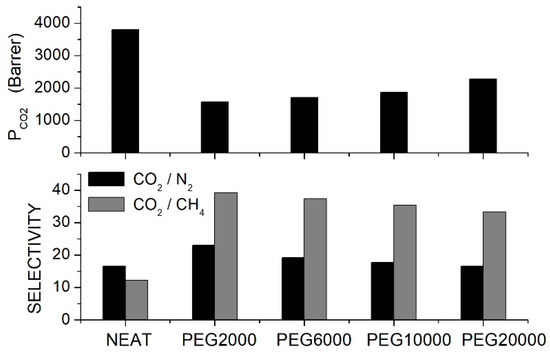
Figure 4.
permeability (upper panel) and selectivity (lower panel) of PIM-1/PEG blend membranes with different PEG formulations (10 wt. % content) as obtained in single gas tests at 4 bar and 30 °C [70].
The reduced permeability was attributed to a reduced fractional free volume, and the increased selectivity was due to the interactions between and the PEG ether oxygen groups. Results also showed that by increasing the PEG molecular weight, the permeability of the blend membrane increased while the selectivity decreased. The authors thus studied the gas transport properties of the membrane blend with PEG20000, changing the additive content from 0.5 to 3.5 wt. %. Results showed that the , and permeability values decreased; the selectivity increased while negligible variations were observed for the selectivity; see Table 6. This trend was attributed to the increased compactness of the blend chain structure, as suggested by the increase in the blend mass density with additive content; see Table 6. At 5 wt. % content, the two polymer components separated, the permeability increased, and the selectivity decreased: this worsening was attributed to the formation of faster and non-selective migration paths for penetrant molecules formed at the interface between the blend membrane and PEG20000 domains.
Table 6.
permeability and selectivity of the blend PIM-1/PEG20000 blend membranes with different additive content as measured in single gas tests at 4 bar and 30 °C. The membrane mass density at different additive contents is reported in the first column [70].
5.6. Polyether Block Amine (PEBA)
Polyether block amine (PEBA) is a family of thermoplastic block copolymers generally known by the commercial name of PEBAX® (Arkema, USA) having general chemical structure: is a rigid, carboxylic acid polyamide (PA6, PA11, PA12) and is an amorphous, soft polyether (PTMG, PTMO, PEG). PEBAs are deeply studied for the development of innovative gas separation membranes because the segments control the mechanical strength, chemical resistance and thermal stability of the matrix while the segments control the elasticity and the hydrophobicity and form the domains where gas transport takes place; see Table 7 [71]. PEBA membranes are of interest for and separation because the linear molecule has a smaller size and a higher affinity with the polar ether blocks than and and thus exhibits larger diffusivity and solubility [72].
Table 7.
Physical properties of Pebax with formulations of interest for the development of gas separation membranes [71].
Car et al. prepared Pebax®MH 1657 (Arkema, USA) blend membranes with PEG200 as an additive at different contents. SEM micrographs of the neat Pebax matrix showed two separated microphases: the crystalline PA phase indicated by oriented polymer lamellar and the amorphous phase formed by the PEO segments [73]. The authors observed that blending with PEG200 destroyed the lamellar structure, decreasing the blend crystalline degree. DSC measurements of the neat Pebax showed the value and two characteristic melting temperatures: the low melting temperature due to the melting of PEO domains, while the high melting one is due to the melting of the PA crystallites. Increasing the PEG content, the value decreased, indicating enhanced chain mobility, while and shifted to lower values, suggesting that the PEG200 addition deteriorated the crystal structure and promoted the formation of smaller and imperfect PA crystallites. The crystalline degree of the blend membrane decreased, in fact, from 38 wt. % for the neat Pebax to 2 wt. % by adding 40 wt. % PEG200. The results of characterization techniques are reported in Table 8. Permeability tests were carried out at 30 °C and 600 mbar feed pressure in single gas tests, and the gas diffusivity was evaluated by the time-lag method. Results showed that the permeability increased with the PEG200 content and that this increase was caused by enhanced diffusivity, while the solubility values did not show variations. The and selectivity values showed negligible variation, changing the additive content. The authors attributed this trend to the decreased crystallinity of the blend membrane and consequent increase in its fractional free volume, as suggested by the decrease in the blend mass density with additive content.
Table 8.
gas transport parameters and selectivity values of the blend Pebax®MH1657 membrane as a function of the PEG200 additive content as measured in single gas tests at 30 °C and 600 mbar feed pressure. units: 10−11 m2/s; units: 10−4 mol/m3 Pa. The glass transition temperature , the melting temperatures and and the crystalline fraction are reported in the first columns [73].
Azizi et al. prepared PEBAX/PEG blend membranes using Pebax1704, Pebax1657 and Pebax2533 and two PEG formulations, PEG400 and PEG1000 [74]. Cross-sectional SEM analysis of the neat PEBAX and PEBAX/PEG400 blend membranes showed a uniform and dense structure without defects such as voids or cracks, while micrographs of the PEBAX/PEG1000 blend membrane suggested partial phase separation. The XRD test evidenced strong diffraction peaks for the neat PEBAX membranes at = 22.5, 21.8 and 20.2°, respectively, attributed to PA crystallites. The PE regions of the neat PEBAX 1074 and PEBAX 1657 membranes provide weak diffraction peaks at = 10.9 and 9.8°, respectively, while the neat PEBAX 2533 membrane does not show any PE diffraction peak. The addition of low molecular mass PEG400 decreased the intensity of the XRD peak and shifted them to lower 2 values, evidence that the membrane crystalline degree is reduced and the -spacing increased. The addition of high molecular mass PEG1000, on the contrary, increased the blend crystalline degree and reduced the -spacing. The comparison between the FTIR spectra of the neat and blend membranes suggested that PEG addition disrupted interchain hydrogen bonds between the PA segments. Permeation tests were carried out in single gas tests at 25 °C and 2 bar feed pressure; results are reported in Figure 5 and Figure 6 for blends with PEG400 and PEG1000, respectively. It can be observed that in all Pebax, increasing the PEG400 content, the and permeability increased without significant variation of the ideal selectivity. The authors suggested that the addition of the PEG400 polar ether groups enhanced the affinity of for the blend membrane, giving rise to an enhanced solubility selectivity but also increased the chain spacing, thus decreasing the sieve property and reducing the diffusivity-selectivity without marked changes to the overall selectivity. On the contrary, increasing the PEG1000 content, there was a significant decrease in the and permeability accompanied by an increase in the ideal selectivity. The improved selectivity was due to the addition of the polar ether groups of PEG1000, enhancing the solubility but decreasing the polymer chain packing, thus enhancing the membrane molecular sieve properties.
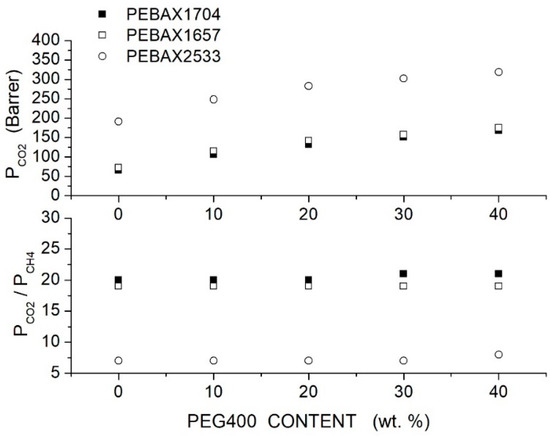
Figure 5.
permeability (upper panel) and ideal selectivity (lower panel) of Pebax®/PEG400 blend membranes with different additive contents measured in single gas tests at 25 °C and 2 bar feed pressure [74].
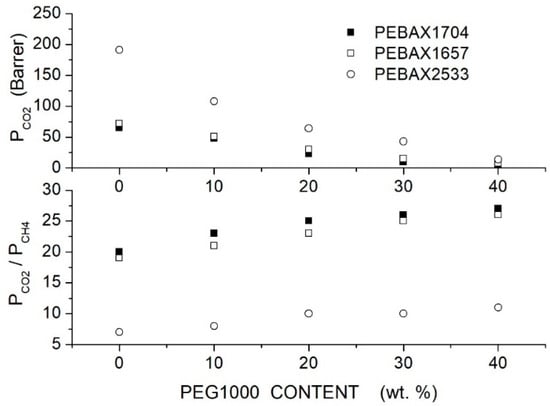
Figure 6.
permeability (upper panel) and ideal selectivity (lower panel) of Pebax®/PEG1000 blend membranes with different additive contents as measured in single gas tests at 25 °C and 2 bar feed pressure [74].
Taheri et al. prepared to blend Pebax®1657 membranes with PEG600, 1500 and 4000 at contents of 10, 20, 30 and 40 wt. % [75]. FTIR of the neat and blend membranes evidenced the interaction of the two blend components by hydrogen bonding between the Pebax carbonyl groups and terminal -OH groups of PEG. SEM analysis showed a dense and uniform structure of the neat membrane and of the blend membrane with PEG600, while phase separation was observed in the blend membranes containing PEG4000 and PEG1500. XRD analysis showed a broad halo at 2 = 20.7°, which became broader and exhibited reduced intensity, adding PEG600, thus suggesting an increase in the membrane amorphous fraction. Adding PEG1500 and 4000, the intensity of the crystalline peak at 2 = 20.7° increased, and the peak shifted to larger angles, indicating a higher crystalline degree and reduced inter-chain -spacing. Moreover, sharp PEG reflection peaks appeared. The crystalline degree of the neat and blend membrane samples was calculated considering the areas under the PEG crystalline peaks and the Pebax amorphous halo: results showed that increasing the PEG600 content, there is a monotonic decrease in the sample amorphous fraction while increasing the PEG1500 and 4000 content, there is a monotonic increase in the crystalline fraction. Permeation tests were carried out by constant volume—variable pressure at 25 °C and 3 to 7 bar feed pressure in single gas conditions; see Table 9. Results revealed that: (i) increasing the PEG600 content there was an increase in the permeability without a markable variation of the selectivity, while (ii) increasing the PEG1500 and 4000 content, the permeability decreased, the selectivity increased, and no significant variation was observed in the selectivity.
Table 9.
Crystalline degree (), permeability and , selectivity values of blend Pebax®1657/PEG membranes with different additives and contents as obtained in single gas tests at 25 °C and 3 bar [75].
6. Polymer/PEG Hybrid Membranes
Mixed Matrix Membranes (MMM) are an important class of organic-inorganic nanocomposites whose structure consists of nano-sized filler particles such as zeolites, silica, CNTs and MOFs dispersed in a continuous polymeric matrix [76]. These nanocomposite membranes are designed to overcome the separation performances of the neat polymeric matrix and to improve its mechanical properties and thermal/chemical stability, thus ensuring stable membrane operations [77]. Generally, MMMs exhibit improved selectivity with respect to the host matrix when they contain filler particles with tailored, size-selective pores, while changes in the polymer matrix permeability are obtained by adding non-porous nanoparticles, which increase the fractional free volume or act as physical obstacles for migrating gas molecules [78].
Here, we will focus the discussion on hybrid nanocomposite membranes consisting of a polymeric matrix with PEG additive and filler nanoparticles. The aim is to evidence the role of the PEG additive in the enhancement of the membrane performances, aiming to correlate variations of the permeability and selectivity with the membrane structural changes promoted by the additive. The following terms will be thoroughly used: neat membrane (NM) to indicate the membrane made of the matrix polymer, blend membrane (BM) to indicate the membrane made of the matrix polymer and PEG additive, nanocomposite membrane (NCM, also called Mixed Matrix Membranes) to indicate the membrane made of filler nanoparticles dispersed in the polymer matrix, and hybrid membrane (HM) to indicate the membrane made of polymer, PEG additive and dispersed filler nanoparticles.
6.1. Polycarbonate-Based Hybrid Membranes
Moghadassi et al. prepared polycarbonate (PC)-hybrid membranes using PEG1000 as a polymer additive and Multiwalled Carbon Nanotubes (MWCNTs) filler nanoparticles [79]. They used raw MWCNT (R-MWCNT) having 10 μm length, 16 nm diameter, 110 Å mean pore diameter and 133 m2/g specific surface area and -functionalized MWCNT (C-MWCNT) with 10 μm length, 8 nm diameter, 98 Å mean pore diameter and 110 m2/g specific surface area. Membrane structural characterization was carried out by SEM surface and cross-sectional analysis. Results showed a non-uniform distribution of raw MWCNTs in the CA matrix. Filler distribution was improved by CA blending and filler functionalization. SEM images showed that the homogeneous filler distribution at contents up to 5 to 10 wt. % was obtained by dispersing the functionalized filler nanoparticles in the blend matrix: the authors suggested that the presence of polar ether groups in the polymer matrix lead to physical interactions of carboxyl functionalized groups in the surface of modified MWCNTs with the blend matrix. Single gas permeation tests were carried out at room temperature with 2 bar feed pressure. The authors observed that the permeability of the neat PC membrane was improved by the dispersion of both raw and functionalized filler nanoparticles; it was also observed that the membrane performances improved with the filler content up to 5 wt. % without significant variations increasing the filler content to 10 wt. %. The optimal performances were offered by the C-MWCNT: at 5 wt. % the permeability was 10.80 Barrer and the and selectivity values were 25.42 and 27.38, respectively; see Figure 7. The blend PC/PEG1000 membrane with 10 wt. % additive exhibited better permeability and selectivity values than the neat PC one and filler dispersion improved its separation performances. It was observed that: (i) the permeability and selectivity increased with the filler content, (ii) at same filler content the blend membrane offered better performances that the neat one and (iii) the permeability and selectivity increased up to 10 wt. % filler content and was 20.32 Barrer with and selectivity values were 52.10 and 35.64; see Figure 7. The previous results suggested that the PEG addition not only improved the transport owing to the affinity between the polar ether links and the acid molecules but also favored the filler dispersion.
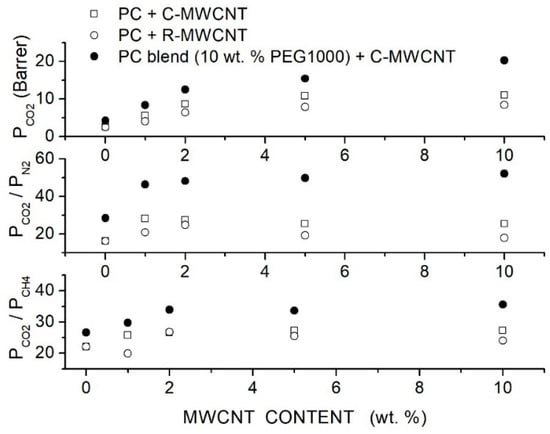
Figure 7.
permeability and selectivity of the neat PC, blend PC/PEG1000 (10 wt. %) and hybrid PC/PEG1000 (10 wt. %) membrane with different MWCNT filler contents measured in single gas tests at 25 °C and 2 bar feed pressure [79]. Open circles are pertinent to the nanocomposite membrane containing raw MWCNT, open squares to the nanocomposite membrane containing functionalized MWCNT filler particles, solid circles to the hybrid PC/PEG1000 (10 wt. %) membrane containing functionalized MWCNT.
In fact, the PEG addition was also beneficial for the membrane mechanical properties: the blend PC/PEG1000 membrane containing 5 wt. % C-MWCNT offered improved properties than those of the neat PC membrane and of the MMM containing same filler amount; see Table 10.
Table 10.
Mechanical properties of the neat, nanocomposite PC and hybrid PC/PEG1000 (10 wt. %) membrane [79].
Kausar et al. prepared polycarbonate (PC)-hybrid membranes using polycarbonate with = 50,000, poly(vinylidene fluoride-co-hexafluoropropylene (PVFHFP, = 130,000) and PEG400 used as a compatibilization agent at a composition of 60, 30 and 10 wt. %, respectively [80]. Purified (P-MWCNT) and acid-functionalized (A-MWCNT) multiwalled carbon nanotubes with a 13 nm outer diameter and 2.5 to 20 μm length were used as filler nanoparticles. SEM micrographs of the blend showed that PC formed a continuous phase with PEG acting as compatibilizer, favoring the PVFHFP dispersion. In the blend matrix, the P-MWCNT nanofiller formed large bundles of agglomerates wet by the polymer matrix, while A-MWCNT resulted well dispersed up to 5 wt. % content. FTIR spectra suggested that the improved dispersion of the functionalized nanofillers was a consequence of hydrogen bonding interactions with the matrix. Single gas permeation tests were carried out at 27 °C and 10 psi feed pressure. Results showed that the filler addition improved the permeability and selectivity of the PC/PVFHFP/PEG blend membrane, offering the functionalized filler particles better results, and that the permeability and selectivity increased with the filler content, resulting in 186.6 Barrer and 39.9 at 5 wt. % content; see Figure 8.
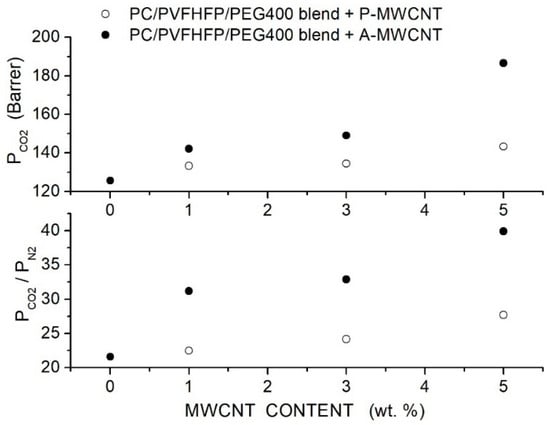
Figure 8.
permeability of the neat PC, PC/PVFHFP/PEG400 blend membrane with different P-MWCNT and A-MWCNT filler contents measured in single gas tests at 27 °C and 10 psi feed pressure [80]. Open and solid circles are pertinent to the hybrid membrane containing purified and acidfunctionalized MWCNT filler nanoparticles.
The authors observed that by increasing the A-MWCNT content in the blend matrix, there was no variation in the solubility, evidence that the improved membrane performances were due to improved diffusivity. Filler addition improved the tensile strength and modulus of the hybrid membranes up to 5 wt. % content, offering the A-MWCNT better performances than P-MWCNT, while a decrease in the elongation at break was observed; see Table 11.
Table 11.
Mechanical properties of the neat PC, PC/PVFHFP/PEG400 blend membrane with different P-MWCNT and A-MWCNT filler contents [80].
6.2. CA-Based Hybrid Membranes
Hussain et al. prepared CA-based hybrid membranes using CA with = 50,000 as matrix PEG1000 as polymer additive and MWCNTs with outer diameter = 8 15 nm and inner diameter = 3 5 nm as filler particles [81] and characterized them by SEM analysis and mechanical testing. The authors prepared blended CA/PEG membranes with 10, 20 and 30 wt. % PEG1000 content and hybrid CA/PEG1000 (10 wt. %) membranes containing 5, 10 and 15 wt. % MWCNT. Room temperature permeation tests were carried out in single gas conditions at 2 bar feed pressure using a mass flow controller. Results showed a decrease in the permeability from 38 Barrer for the neat CA membrane to 19.3 Barrer at 10 wt. % additive content without a markable variation at a larger PEG1000 content. The large permeability of the neat CA membrane was attributed to the presence of non-selective voids between the polymer chains, and results thus suggested that PEG addition promoted the formation of more compact and defect-free membrane structures this point was supported by SEM surface and cross-section analysis revealing the dense and uniform structure of the hybrid membrane. The selectivity, on the contrary, increased from 5 for the neat CA membrane to 39.5 at 10 wt. % PEG1000 and decreased at larger PEG1000 contents. SEM analysis of the hybrid membranes with 10 wt. % additive content evidenced that PEG1000 impeded filler aggregation up to 10 wt. % filler content and avoided the formation of polymer-filler non-selective interface voids. In the hybrid membrane with 10 wt. % PEG1000 content, MWCNTs dispersion increases in the permeability from 19.3 Barrer for the blend to 27 Barrer at 10 wt. % MWCNTs content with selectivity values of 49, respectively, which is a factor of 2 larger than in the blend membrane; see Figure 9. The enhanced membrane performances of the hybrid one were attributed to the formation of preferential diffusion paths for molecules resulting from the dispersed MWCNTs. The formation of MWCNTs agglomerates at 15 wt. % content increased the permeability at the cost of a complete loss of the selectivity. The authors also carried out permeation tests at 2.5 bar feed pressure in mixed gas conditions using a mixture (60 vol. %, 40 vol. %) and observed a decrease in the permeability and selectivity with respect to single gas tests in all examined membrane samples; see Table 12.
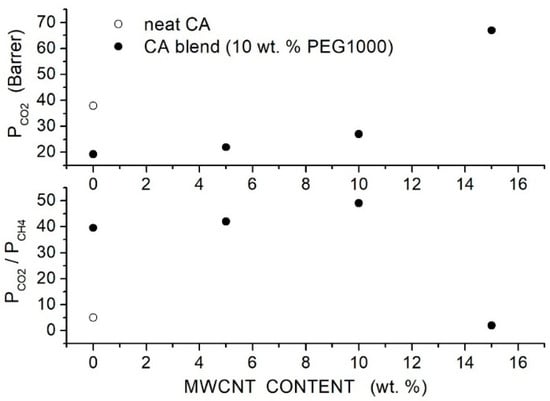
Figure 9.
Room temperature permeability (Barrer) (upper panel) and selectivity (lower panel) of neat CA, blend CA/PEG1000 and hybrid CA/PEG1000/MWCNT membranes at 2 bar feed pressure in single gas tests [81].
Table 12.
Room Temperature permeability (Barrer) and selectivity of neat CA, blend CA/PEG1000 and hybrid CA/PEG1000/MWCNT membranes at 2 bar feed pressure in single gas tests. Data marked by (**) were obtained at RT with 2.5 bar feed pressure using a 60:40 vol. % - gas mixture [81].
Mechanical tests showed that the addition of 10 wt. % PEG1000 produced a negligible variation of the membrane stress at break: MWCNT dispersion at 10 wt. % content increased the stress at the break of the hybrid membrane to 13 MPa, but its breakdown occurred at 30% strain, while in the blend membranes, it occurred beyond 40%.
Moghadassi et al. prepared CA-based hybrid membranes using PEG1000 as a polymer additive and raw (R-MWCNT) or carboxyl-functionalized (C-MWCNT) MWCNT as filler nanoparticles and characterized them by SEM analysis and mechanical testing. Single gas permeation tests were carried out at RT and 2 bar feed pressure [82]. Results, see Figure 10, showed that MWCNTs dispersion improved the permeability and selectivity of the neat CA matrix, offering the C-MWCNTs filler particles better performances than the R-MWCNT. The permeability value increased with the C-MWCNTs dispersion from 1.08 Barrer for the neat CA membrane to 13.74 Barrer at 0.65 wt. % without significant variations increasing the filler content up to 1 wt. %. The selectivity values of the neat CA membrane increased from 4.2 to 21.8, and the /N2 selectivity from 2.5 to 15.4. The better membrane performances were obtained with the functionalized MWCNT and were attributed to their higher dispersion degree, as shown by SEM images. PEG addition enhanced the filler dispersion and improved the membrane performances with respect to the MMM at the same filler content: the blend membrane with 10 wt. % PEG1000 addition and 1 wt. % C-MWCNT content, the permeability was 32.58 Barrer with and CO2/N2 selectivity values of 51.5 and 32.2, respectively. No significant variations were observed, increasing the filler content to 2 wt. %.
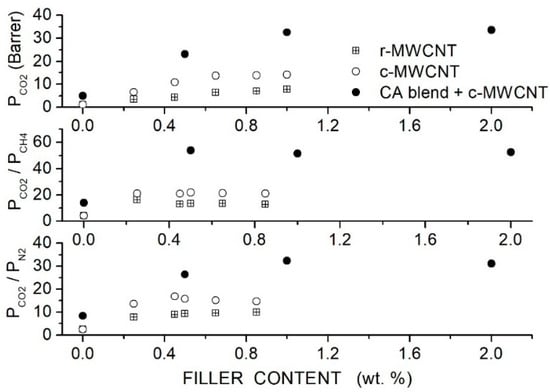
Figure 10.
Room temperature permeability (upper panel) and selectivity (central and lower panel) of neat CA, blend CA/PEG1000 and hybrid CA/PEG1000/MWCNT membranes at different filler contents obtained at 2 bar feed pressure in single gas tests [82]. Crossed squares and open circles are pertinent to the nanocomposite CA membrane containing raw- and carboxyl-functionalized MWCNT filler nanoparticles.
Filler addition at 1 wt. % to the blend matrix with 10 wt. % PEG1000 improved the mechanical properties of the CA matrix: the stress at break increased from 2.93 to 9.11 MPa and the tensile modulus from 1.22 MPa to 4.37 MPa; see Table 13.
Table 13.
Mechanical properties of neat CA membrane and of selected nanocomposite and hybrid CA/PEG1000/MWCNT membranes [82].
6.3. Matrimid-Based Hybrid Membranes
Castro-Munoz et al. prepared Matrimid-based hybrid membranes with 4 wt. % PEG200 as polymer additive and ZIF-8 nanoparticles with 33 nm average size [83]. SEM analysis revealed that filler particles are well dispersed up to 40 wt. % content well embedded in the neat and in the blend matrix without interface voids. PEG200 and ZIF-8 dispersion in Matrimid restricted the polymer chain mobility: DSC tests showed, in fact, that the value increased from 310 °C for the neat membrane to 314 °C for the blend membrane with 4 wt. % additive content and to 371 ÷ 373 °C in the nanocomposite and hybrid Matrimid/PEG200(4 wt. %) membrane with ZIF-8 contents between 10 and 40 wt. %; see Table 14. Permeation tests were carried out at 25 °C and 8 bar feed pressure with equimolar gas mixtures. Results showed that PEG200 addition improved the permeability and the selectivity with best performances obtained with 4 wt. % additive where the permeability raised from 7.2 to 28 Barrer and the selectivity from 17 to 24. The dispersion of the filler particle enhanced the permeability of the neat and blend Matrimid/PEG200 membranes; see Figure 11, but the selectivity of the nanocomposite Matrid/ZIF-8 hybrid Matrimid/PEG200/ZIF-8 membranes decreased anyway with respect to that of the neat one.
Table 14.
Glass transition temperature of the neat Matrimid®, blend Matrimid®/PEG200, nanocomposite Matrimid®/ZIF-8 and hybrid Matrimid®/PEG200/ZIF-8 membranes is reported in the last column [83].
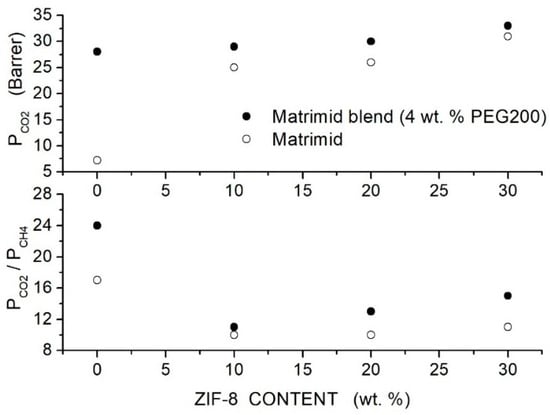
Figure 11.
permeability (upper panel) and selectivity (lower panel) of Matrimid-based membranes at different ZIF-8 filler content obtained at 25 °C and 8 bar with - equimolar gas mixtures [83]. Open circles are pertinent to the nanocomposite Matrimid membranes while solid symbols to the hybrid Matrimid/PEG200 (4 wt. %) membranes.
Loloei et al. prepared Matrimid®-based hybrid membranes with PEG200 as a polymer additive and ZSM-5 filler nanoparticles [84]. SEM analysis showed that in the neat Matrimid® membrane, the ZSM-5 nanoparticles are uniformly dispersed without forming interface voids at contents up to 3 wt. %. In blended Matrimid/PEG200 membranes, uniform filler dispersion without interface defects was observed; voids were up to 5 wt. % content, while at larger contents, their agglomeration occurs. FTIR spectra of the blend polymer indicated the formation of hydrogen bonding between PEG and Matrimid®: The improved filler dispersion in the blend membrane is favored by the absorption of PEG chains on the ZSM-5 filler surface. XRD patterns of the neat Matrimid® membrane showed two diffraction peaks at = 14° and 17°, evidence of its semi-crystalline structure: PEG200 addition decreased the Matrimid® crystalline degree and shifted the reflection peaks to lower angles, indicating an increase in the intersegmental distance from 5.21 for the neat membrane to 5.55 Å at 5 wt. % additive content. The addition of PEG200 and filler particles to the Matrimid® matrix transforms its structure from semicrystalline to fully amorphous.
Results of gas transport tests carried out in a single gas condition at 35 °C and 10 bar feed pressure showed that increasing the additive content up to 20 wt. % content monotonically improved the permeability from 7.68 Barrer for the neat membrane to 22.04 Barrer at 20 wt. %; see Table 15. The selectivity of the neat Matrimid® membrane, 34.91, increased to 40.08 at 5 wt. % additive content and then decreased: this behavior was due to the formation of non-selective voids at 10 wt. % additive content, as shown by SEM analysis.
Table 15.
permeability and selectivity of neat and blend Matrimid membranes as obtained in single gas tests at 35 °C and 10 bar feed pressure (values for hybrid membranes with large additive content are also reported; see text) [84].
Filler addition to the neat Matrimid® membrane slightly increased the permeability and selectivity from 8.4 Barrer and 47 at 3 wt. % content to 9.2 Barrer and 58 at 7 wt. % content. Hybrid Matrimid/PEG200/ZSM-5 membranes offered the best performances: the hybrid Matrimid/PEG200 (5 wt. %)/ZSM-5 (5 wt. %) membrane showed, for example, 11.5 Barrer permeability and selectivity of 60; see Figure 12. At PEG200 contents larger than 5 wt. %, the permeability slightly increased, and the selectivity strongly decreased due to the formation of non-selective voids and filler aggregates; see Table 16. The author concluded that the use of the PEG additive at low contents improved the membrane properties, favoring the filler dispersion and impeding the formation of non-selective interfacial voids between polymer layers and ZSM-5.
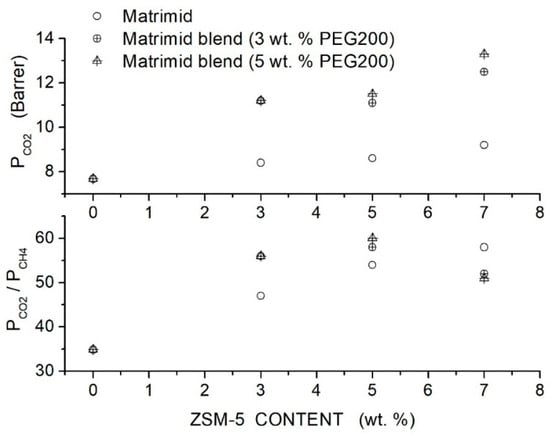
Figure 12.
permeability (upper panel) and selectivity (lower panel) of Matrimid membranes as a function of the ZSM-5 filler content as obtained in single gas tests at 35 °C and 10 bar feed pressure [84]. Open circles are pertinent to the nanocomposite Matrimid membranes; crossed circles and crossed triangles to the hybrid membranes with 3 and 5 wt. % PEG200 additive content, respectively.
Table 16.
Glass transition temperature values () of the PSF-based membranes as a function of their composition [85].
6.4. PSF-Based Membranes
Raouf et al. prepared polysulfone (PSF)-based hybrid membranes using PSF with = 35,000, PEG as a polymer additive, and graphene hydroxide () filler nanoparticles with a thickness < 35 nm [85]. FTIR spectra indicated that physical interaction between positively charged double groups of PEG and electron-withdrawing oxygen of groups of graphene occurred, which improved the filler-matrix interaction and prevented the formation of interface non-selective voids. SEM analysis of the blend membrane with 5 wt. % content showed well-dispersed nanoparticles embedded in the polymer layers. The value of the neat PSF membrane, 190 °C, decreased to 186 and 184 °C when blended with 5 and 10 wt. % PEG content, indicating polymer chain mixing and increased chain mobility; see Table 16. The addition of filler particles increased the value to 190 °C with the PSF/PEG(5 wt. %) membrane and to 186 °C in the PSF/PEG (5 wt. %) membrane, indicating that the interaction between polymer chains and fillers reduced the chain mobility. Single gas permeation tests were carried out at 35 °C and 2 bar feed pressure. Results showed that PEG addition at 5 and 10 wt. % content increased the permeability of the neat PSF membrane from 15.9 Barrer to 21.4 and 28.2 Barrer, respectively, without significant variation on the selectivity value ~13. The permeability value and the selectivity of the blend membranes monotonically increased with the filler content: the best membrane performances were obtained with the hybrid PSF membrane with 10 wt. % additive and 5 wt. % filler content, 28.5 Barrer permeability and 19.9 selectivity; see Figure 13.
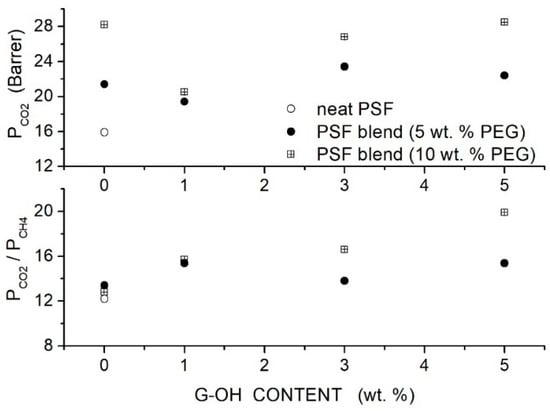
Figure 13.
permeability (upper panel) and selectivity (lower panel) of the PSFbased membranes for different G-OH contents at 35 °C and 2 bar feed pressure measured in single gas test [85]. Open circles are pertinent to the nanocomposite membrane, and solid circles and crossed squares were pertinent to the hybrid PSF/PEG membranes with 5 and 10 wt. % additive content, respectively.
Salahshoori et al. prepared polysulfone-based hybrid membranes (PSF, 442.53 g/mol, 185 °C) using different PEG formulations as polymer additives and filler nanoparticles with a 75 nm average size [86]. Preliminary permeation tests carried out on blend membranes showed that the PSF blend membrane with 20 wt. % PEG10000 content offered the best membrane performances, namely a permeability value of 7.63 Barrer and selectivity value of 27. SEM analysis of the hybrid PES/PEG10000 (20 wt. %) membrane showed that nanoparticles were homogeneously dispersed up to 20 wt. % content without forming interface defects: FTIR analysis suggested that the good filler dispersion was due to the formation of hydrogen bonds between O-H polar groups of silica nanoparticles and ether groups of the PEG additive. XRD patterns of the blend membrane showed a broad halo between 19° and 21°. Increasing the filler content: (i) the halo intensity decreased, and the peak became wider, suggesting an increase in the blend amorphous content, and (ii) the halo shifted to lower angles suggesting that the intersegmental chain spacing increased. DSC tests carried out on the blend membrane evidenced a single value at 135 °C, showing good PEG/PES mixing. Increasing the silica content in the PSF/PEG10000 blend, a slight increase in the value from 165 °C for the neat blend to 174 °C at 20 wt. % was observed, indicating restricted chain mobility; see Table 17. Single gas permeation tests were carried out at 35 °C and 10 bar feed. Results indicated that PEG addition improves the permeability and selectivity of the neat PSF membrane from 5.61 to 7.64 Barrer with a small increase in the from 27 to 29; see Figure 14. The blend of permeability and selectivity increased, adding SiO2 filler particles from 7.71 Barrer and 29 at 2.5 wt. % SiO2 content to 13.36 Barrer and 36 at 20 wt. % content and the selectivity increased from 32 to 46. Mechanical testing indicated increasing the filler content up to 10–15 wt. %; Young’s modulus of the hybrid membrane and the tensile strength simultaneously increased, suggesting good adhesion between the polymer matrix and filler particles and uniform distribution up to this filler loading; see Table 17.
Table 17.
-spacing, glass transition temperature (), tensile strength and Young’s modulus of the neat, PSF/PEG10000 (20 wt. %) and hybrid membranes [86].
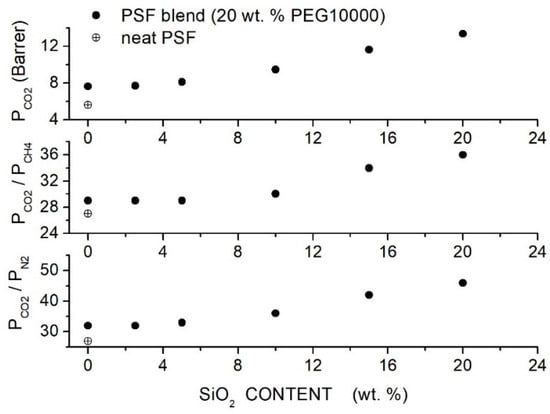
Figure 14.
permeability and selectivity values of the PSF-based membranes with different filler content at 30 °C and 10 bar feed pressure measured in single gas test [86]. The crossed circle is pertinent to the neat PSF membrane, and the solid circles are to the hybrid PSF/PEG10000 (20 wt. %) membrane.
Singh et al. prepared PES-based hybrid membranes with PEG-grafted carbon nanotube filler particles (PEG-g-CNTs, 324 m2/g surface area, 1.57 cm2/g total pore volume, 17.7 average pore size) [87]. SEM micrographs of the hybrid membranes showed good filler dispersion up to 5 wt. % content. The XRD pattern of the neat and PSF/PEG-g-CNT membrane samples showed CNT reflection peaks at 2 = 26.1° and 43.1° and the PSF halo at 18.15°. The intensity of the PSF halo decreased with the filler addition, and the peak shifted to larger 2 angles indicating increased amorphous content and reduction of the interchain -spacing. The FTIR spectrum of hybrid PEG-g-CNT/PES membranes only showed a decrease in the peak intensities with respect to the spectra of the neat PSF membrane and no shift of the peak position. The authors studied the selective properties at 25 °C with 1.5 and 2.5 bar feed pressure and evaluated the gas diffusivity by the time-lag method. The results showed that filler addition improved the permeability of the neat PES membrane as well as the and selectivity. At 5 wt. % loading and 1.5 bar feed pressure, for example, the permeability increases from 4.75 to 7.24 Barrer, the selectivity from 7.7 to 13.4, and the selectivity from 19.0 to 34.4; see Figure 15. The authors attributed the improved permeability to the reduced crystalline degree enhancing penetrant transport and to the PEG polar ether groups enhancing the solubility. Only minor variations in the gas transport properties were observed using gas mixtures.
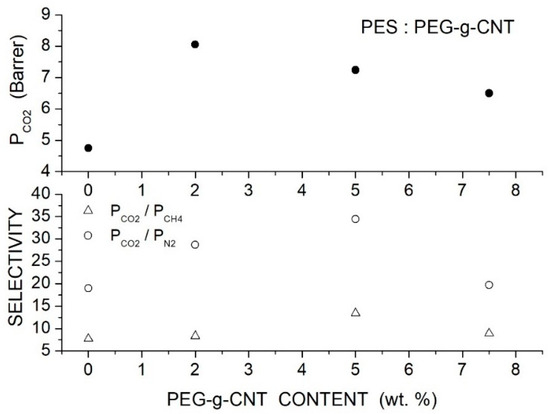
Figure 15.
permeability (upper panel) and selectivity (lower panel) of the PES membranes with different PEG-g-CNT contents measured at 25 °C and 1.5 and 2.5 bar [87].
Mechanical tests showed an improved tensile modulus and tensile strength with respect to the neat membrane; see Table 18. The elongation at break was anyway reduced due to hindered molecular elongation of the polymer chains by well-dispersed functionalized CNT.
Table 18.
Mechanical properties of the PES-based membranes with different PEG-g-CNT contents [87].
Ma et al. prepared hybrid membranes made of PES-g-PEG copolymer containing porous 2D MOF nanosheets (CuBDC, 5.2 Å pore size, 6 to 10 µm lateral size and few nm thickness) at contents up 7 wt. % [88]. XRD analysis of the hybrid membrane samples showed two narrow peaks MOF reflections at = 17.3° and 34.4° and a broad halo of the PES-g-PEG crystalline fraction centered at = 18.2° without variation of the peak intensity and position increasing the filler content. FTIR spectra showed peaks pertinent to the CuBDC filler particles and PES-g-PEG matrix without noticeable shifts of peak positions. DSC tests showed that decreased, increasing the filler content from 183.5 °C for the neat membrane to 142.6 °C for the hybrid membrane with 7 wt. % MOF content evidence of enhanced chain mobility. SEM analysis of the hybrid membrane evidenced uniform MOF distribution up to 5 wt. % filler content without interface defects showing good compatibility between filler and copolymer matrix. The authors studied the gas transport properties in single gas conditions at 35 °C with 1 bar feed pressures. They observed that the permeability increased with the filler content from 14.3 Barrer for the neat membrane to 58.1 Barrer at 5 wt. % MOF content accompanied by the increase in the and selectivity values; see Figure 16.
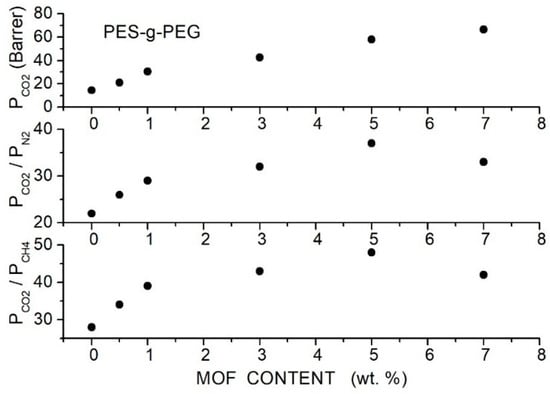
Figure 16.
permeability (upper panel) and selectivity (central and lower panel) of the PES-g-PEG hybrid membranes with different MOF filler content as obtained in single gas tests at 35 °C and 1 bar feed pressure [88].
It was observed that increasing the filler content: (i) the diffusivity of all penetrants increased, but this increase was more marked for and (ii) the solubility slightly increased while the and solubility values decreased; see Table 19. The enhanced diffusivity was attributed to the MOF porous structure increasing the membrane-free volume: the free volume increase preferentially enhanced the diffusivity, having a smaller size than the and penetrants. The increase in solubility was attributed to the affinity between the MOF-filled nanoparticles and the penetrant molecules.
Table 19.
diffusivity (units: 10−8 cm2/s) and solubility (units: 10−2 cm3 (STP)/cm3 cmHg) of the PEG-g-PES at different MOF contents. The and diffusive-selectivity and solubility-selectivity terms are also reported [88].
Khan et al. prepared PSF-based hybrid membranes (~35,000) with PEG1000 as a polymer additive, nickel oxide, copper oxide and Pyrazine-functionalized MOF filler particles [89]. The FTIR spectra of the hybrid membrane samples showed shifts of the PSF absorption peaks compared with the blend, suggesting hydrogen-type interactions between Pyrazine-MOF and polyethylene glycol. SEM cross-sectional micrographs of the hybrid membranes showed dense, homogeneous structures with well-dispersed filler particles without interface defects between the functionalized filler particles and the blend matrix. PSF membranes showed a broad XRD reflection peak at angles between 17° and 22° without significant variation, adding PEG and/or MOF. Permeation tests were carried out in single gas conditions at 25 °C and 2 bar feed pressure. Results indicated that the permeability and selectivity were improved by the filler addition; see Figure 17: at 0.2 wt. % MOF content, the permeability and selectivity increased from 6.8 Barrer and 9.8 for the neat membrane to 12.9 Barrer and 15.9. Results indicated that filler addition in the blend PSF/PEG improved separation performances at the same filler content: at 0.2 wt. %, the permeability increased to 17.1 Barrer and the selectivity to 20.2.
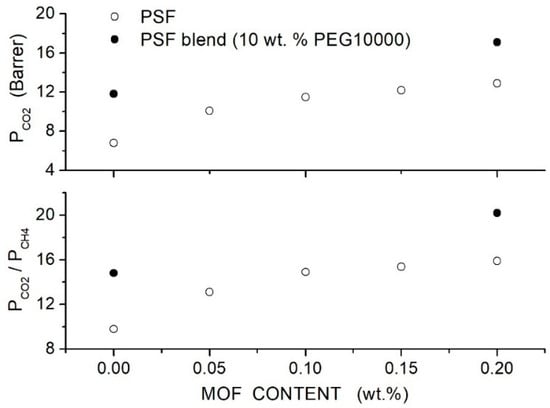
Figure 17.
permeability (Barrer) and selectivity (lower panel) of the PSF-based membranes at different MOF content as obtained in single gas tests at 25 °C and 2 bar feed pressure [89].
Mechanical tests showed that by adding filler particles to the PSF matrix, the tensile strength decreased, suggesting the formation of crystalline domains; see Table 20. The tensile strength increases; on the contrary, adding the filler particles to the PSF/PEG blend matrix suggests that PEG favors the compatibility between filler particles and the PSF matrix. A clear trend was, on the contrary, not observed for the strain at the break of all PSF-based membranes.
Table 20.
Tensile strength and strain at break of the PSF-based membranes at different MOF content [89].
6.5. PIM-1 Based Hybrid Membranes
Khan et al. prepared PIM-1 hybrid membranes with MWCNT filler nanoparticles (250 m2/g surface area, 12 to 15 nm diameter and 8 to 12 nm wall thickness) functionalized by covalent bonding with PEG200 polymer chains (f-MWCNT) [90]. SEM micrographs showed that the neat PIM-1 membrane exhibited a defect-free structure; here, pristine MWCNT produced the formation of filler agglomerates. f-MWCNTs resulted, on the contrary, in well-dispersed up to 2 wt. % content, and f-MWCNT aggregates surrounded by interface voids formed at 3 wt. % content. Single gas permeation tests were carried out at 30 °C, and the penetrant diffusivity was evaluated by the time-lag method. Results showed that the permeability of all examined gases increased with the f-MWCNT content up to 2 wt. % content and decreased at 3 wt. %. The selectivity slightly increased from 22 to 24, while the selectivity decreased from 15 to 11; see Table 21.
Table 21.
permeability and diffusivity values of neat and hybrid PIM_1 membranes with different f-MWCNT contents. The /N2 and permeability-selectivity and diffusivity-selectivity values are also reported. Data were obtained in single gas tests at 30 °C and 2 bar feed pressure [90].
The authors observed that the permeability increase was due to an enhancement of the gas diffusivity. In fact, no variation of the and solubility was observed changing the filler content (~3 and ~18 cm3 (STP)/cm3 cmHg for and , respectively), and a slight increase from ~80 for neat to ~90 cm3 (STP)/cm3 cmHg for was observed. It was observed that in the 283 to 333 K temperature interval, the and permeability slightly increased with temperature while the permeability slightly decreased with a consequent worsening of the and selectivity values. The activation energy values for and in the hybrid membranes with 2 wt. % functionalized filler content is lower than in the neat one, while the opposite occurs for . The authors measured Young’s modulus, tensile strength and elongation at break at different filler contents of the neat and hybrid membranes; obtained values are equivalent inside the experimental indeterminacy; see Table 22.
Table 22.
, and activation energy values for permeation (), Young’s modulus, tensile strength and elongation at break for PIM-1 hybrid membranes with different functionalized filler contents [90].
6.6. Pebax®-Based Hybrid Membranes
Wang et al. prepared Pebax®1657 hybrid membranes with different PEG formulations (PEG400, 600, 2000, 10000, 20000) and with two branched PEGs, namely PEGDME with = 500 and Triton X-100 (polyethylene glycol tertoctylpheny ether) with = 625 as polymer additive with MWCNTs as filler particles [91]. Cross-sectional SEM micrographs showed that the formation of micro-sized filler aggregates in the neat Pebax matrix occurred at 2 wt. % MWCNT content. The addition of 7 wt. % PEG improved the filler dispersion: no aggregates were observed up to 5 wt. % filler content, and no voids or defects formed at the filler-polymer interfaces. The good filler dispersion was attributed to hydrogen bonding interactions of filler particles with the EO segments, as suggested by FTIR analysis. The addition of 2 wt. % MWCNT decreased the crystallinity of the Pebax matrix and of all polymer blends, increased the intersegmental -spacing, and decreased the value, indicating that filler particles increased the polymer free volume and enhanced the chain mobility.
Permeation tests were carried out at 22 °C by the constant pressure—variable volume method, and the gas diffusivity was evaluated by the time-lag method. The authors observed that blending with high molecular weight PEG decreased the permeability of the neat Pebax membrane while blending with low molecular weight PEG increased PCO2, and thus the authors focused their analysis on the Pebax/PEG20000 and Pebax/PEGDME blend membranes, preparing hybrid membrane samples with 40 wt. % additive content. Both hybrid membranes exhibited enhanced permeability than the blend membrane because of improved diffusivity and solubility; see Table 23. This enhancement was attributed to the decreased crystallinity, increased free volume and higher chain mobility. Filler dispersion in the blend matrix produced minor variations of the selectivity as consequence of enhanced chain mobility as suggested by the reduced diffusivity-selectivity contribution. The selectivity was, on the contrary, a larger consequence of enhanced solubility-selectivity contribution. No significant difference was observed between the gas transport properties in tests carried out in single gas conditions and with gas mixtures.
Table 23.
diffusivity [units: 10−6 cm2/s] and solubility [units: 10−4 cm3 (STP)/cm3 cmHg] in the Pebax®1657 based membranes obtained at 2 bar and 25 °C. and diffusivity- and solubility-selectivity values are also reported [91].
Eljaddi et al. prepared Pebax®1657 hybrid membrane samples with PEG300, 600 and 1500 as additives at 30 wt. % content and Zeolitic Imidazolate Framework-8 (ZIF-8) as filler particles [92]. SEM cross-sectional micrographs of the neat Pebax and PEBAX/PEG blend membranes showed dense and homogeneous structure with small PEG domains in the Pebax/PEG1500 blend. Filler aggregates in the nanocomposite membranes were observed in the Pebax matrix at 13 wt. % content: PEG addition favored ZIF-8 filler dispersion, and no aggregates were observed in the hybrid membrane in the blend membrane, which presented a homogeneous structure without void-like interface defects.
DCS analysis showed filler addition at 7 wt. % to the neat Pebax membrane slightly increased the value from −49 to −47 °C and decreased the PEO crystalline fraction from 14 to 11 % without variation of the PA crystalline fraction. In blended membranes with 7 wt. % ZIF-8, the PEO crystalline fraction increased to 36%, decreased to 7 and 12 wt. % with 13 and 23 wt. % filler content—that is lower than in the neat matrix—without relevant variation for : this finding suggests that the ZIF-8 filler nanostructures interact with PEO segments of Pebax or PEG additive; see Table 24.
Table 24.
Glass transition temperature (), melting temperature () and crystalline fraction () of PA and PEO domains of the Pebax®1657-based membranes [92].
Permeability tests were carried out at 25 °C and 3 bar feed pressure in single gas tests. The permeability of the neat PEBAX® membrane was 52 Barrers, and the and selectivity values were 54 and 16, respectively. The addition of low molecular weight PEG300 and PEG600 at 30 wt. % to the Pebax matrix significantly increased the permeability and the selectivity but slightly reduced the selectivity: these variations were attributed to the interactions between ethylene oxide groups in PEG and Pebax with the polar molecule. On the contrary, the addition of high molecular weight PEG1500 at 30 wt. % drastically decreased the membrane permeability and selectivity owing to the high crystalline fraction of the membrane.
The authors thus focused their study on the neat Pebax and blend Pebax/PEG300 membranes: they observed that adding 7 wt. % ZIF-8, the permeability of the neat Pebax and Pebax/PEG300 blend matrices increased, but a marked enhancement occurred at larger filler contents; on the contrary, minor variations occurred in the and the selectivity values; see Table 25. The diffusivity values increased from 0.40 × 10⁻⁵ in the neat Pebax membrane to 0.84 × 10⁻⁵ cm2/s in the blend membrane containing 13 wt. % filler and the solubility from 10 × 10−3 to 15 × 10−3 cm3 (STP)/cm3 cmHg. The improved permeability accompanied by minor selectivity variations with filler dispersion was explained by an increased free volume at the matrix-filler interface layers. The authors observed that the permeability increased with temperature in the 25 to 40 °C temperature interval, while the selectivity decreased: the activation energy values for penetrant permeation are reported in Table 26.
Table 25.
permeability and selectivity values of the Pebax®1657-based membranes measured in single gas conditions at 25 °C and 3 bar feed pressure [92].
Table 26.
Activation energy values (kJ/mol) for permeation of selected Pebax-derived membranes [92].
Azizi et al. prepared Pebax®1074 hybrid membranes with PEG400 as an additive and titania ) filler nanoparticles having a 21 nm size, previously sonicated in water-PEG400 solutions to functionalize their surface and favor their dispersion in the Pebax matrix [93]. XRD tests of the neat Pebax®1074 membrane showed a broad diffraction halo at 11° and the PA crystalline peak at 22°: the addition of PEG400 decreases the intensity of this crystalline peak, indicating decreased crystalline content in the blend matrix. The hybrid membrane showed a characteristic diffraction peak at = 25°, and the intensity of the PA crystalline diffraction peak was lower than in the neat Pebax matrix. These results as well as FTIR spectra suggested that hydrogen bonding between the PA segments is disrupted by PEG400 addition as well as by the presence of the nanofiller. SEM cross-sectional micrographs of the blend membranes with 20 and 40 wt. % PEG400 content evidenced dense, defect-free morphology. SEM micrographs of the hybrid membrane samples showed that filler particles were uniformly distributed, and no aggregates formed up to 2 wt. % filler content. Gas permeation tests were carried out by the constant volume—variable pressure method in single gas conditions at 25° and 2 bar feed pressure. Results showed that blended membranes exhibited improved separation performances with respect to the neat membrane: the permeability increased from 65 Barrer for the neat membrane to 100 and 153 Barrer at 10 and 40 wt. % PEG400 content without variations of the selectivity value of 20; see Table 27. Filler dispersion in the Pebax/PEG400 blend membrane with 40 wt. % additive content showed an increase in the permeability from 155 Barrer at 2 wt. % content to 204 Barrer at 8 wt. % content with limited improvement of the selectivity from 21 to 24; see Figure 18. The authors attributed the enhanced permeability without significant selectivity variations to interface voids between polymer and fillers and to the reduced crystalline degree.
Table 27.
permeability and selectivity of the Pebax®1704 blend membranes measured in single gas tests at 25° and 2 bar feed pressure [93,94]. The additive type in the blend matrix (40 wt. % content) is also reported.
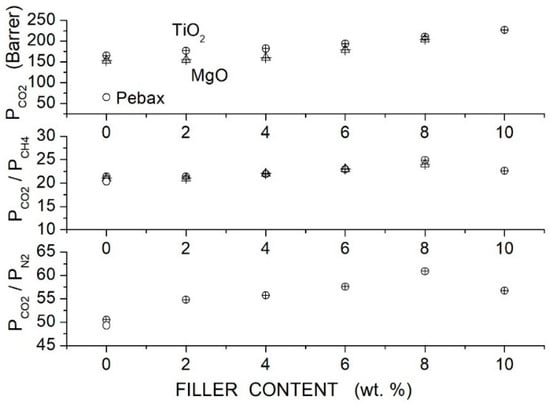
Figure 18.
permeability (upper panel) and selectivity (central and lower panels) of the Pebax®1704-hybrid membranes measured in single gas tests at 25° and 2 bar feed pressure [93,94]. Open circles are pertinent to the neat Pebax membrane. The crossed circles are pertinent to the hybrid membrane containing 40 wt. % PEG200 and filler nanoparticles; the crossed triangles are pertinent to the hybrid membrane containing 40 wt. % PEG400 and filler nanoparticles.
In a successive study, the authors prepared hybrid Pebax®1074 membranes with PEG200 additive using nanoparticles with 20 nm size and 60 m2/g specific surface area previously sonicated in water/PEG solutions [94]. XRD tests showed that the addition of PEG200 decreases the intensity of the crystalline peak by disruption of the hydrogen bonding between the PA chains in crystalline domains. The filler addition decreased the intensity of the crystalline diffraction peak, and a characteristic peak at 43° appeared. The Pebax®1704 peak at 22.4° shifted to 22.1° in the Pebax/PEG200 (401 wt. %) blend membrane and to 21.9° in the hybrid membrane with 8 wt. % filler addition, indicating that the -spacing increased from 3.96 to 4.02 and 4.06 Å, respectively. SEM analysis of the neat and the blend membranes evidences dense structures without voids, while micrographs of the hybrid membranes indicate uniform filler distribution up to 6 wt. % content without forming aggregates. Gas permeation tests were carried out in single gas conditions at 25° and 2 bar feed; results showed that increasing the PEG200 content to 40 wt. % the permeability increased from 65 to 165 Barrer while the ideal selectivity slightly increased from 49.3 to 52.6 and the selectivity from 20 to 22; see Table 27 . The authors studied the gas transport properties of the hybrid membrane with 40 wt. % PEG with filler contents up to 10 wt. %. It was observed that the permeability of all gases increased with the filler content with only minor variation of the selectivity. The permeability at 10 wt. % content was 226.4 Barrer, and the ideal and selectivity values slightly increased to 60.9 and 24.9, respectively; see Figure 18. The authors attributed the permeability increase without selectivity improvement to the presence of non-selective interfacial voids and the diminished crystallinity. The authors observed that by increasing the temperature from 25 to 55 °C, the gas permeability increases with all membrane samples, but the and selectivity values decreased.
Yu et al. prepared hybrid Pebax®2533 hybrid membranes with PEG800 as a polymer additive and hydrophilic amine-functionalized Zr-MOF (NH2-UiO-66) filler particles having 0.6 nm pore size, 150–200 nm size and 800 m2/g specific surface area [95]. NH2-UiO-66 filler particles were chosen given their affinity towards molecules, and to favor their dispersion in the host matrix, they were previously surface functionalized by magnetic stirring in PEG/EtOH or PEBAX/EtOH solutions. BET analysis showed that surface functionalization reduced the surface area and pore size of filler particles, indicating that the interaction between filler particles and polymer chains formed a nest layer around the NH2-UiO-66 nanostructure. The neat Pebax samples presented XRD reflection peaks at 5.7° and 11.1° pertinent to the crystalline and amorphous PTMO domains and at 22.3° pertinent to crystalline PA domains. The crystalline peaks at 5.7° and 22° disappeared after PEG blending indicating an increase in the blend matrix amorphous fraction. DMA analysis was used to evaluate the glass transition temperature: results indicated shifting from −65.9 °C for the neat Pebax to −62.5 °C for the blend membrane. The value increased to −62.2 °C with Pebax-NH2-UiO-66 at 20 wt. % suggesting restricted mobility of PEG chains and decreased at 30 wt. % content because of filler aggregation. Cross-sectional SEM analysis showed that nested filler particles exhibit better filler dispersion in the Pebax membrane than pristine ones: filler aggregates formed, in fact, at 30 wt. % content. Single gas permeation tests were carried out at 35 °C and 2 bar feed pressure. The neat Pebax®2533 membrane exhibited a permeability value of 120 Barrer and a selectivity of 41: PEG addition improved the permeability, reaching 188 Barrer at 20 wt. % content and a selectivity value of 87. Hybrid membranes were thus fabricated using a 20 wt. % PEG content; results are reported in Figure 19. In Pebax/NH2-UiO-66 (nested), the permeability slightly increased with the filler content up to 15 wt. % exhibiting 188 Barrer and 85 selectivity and sharply increased to 360 Barrer at 30 wt. % with a nearly complete loss of selectivity. In the hybrid Pebax/PEG/NH2-UiO-66 membranes, the permeability increased with respect to the neat and the Pebax/NH2-UiO-66 membranes, reaching at 15 wt. % content, a permeability value of 210 Barrer, and a selectivity of 130. permeability and selectivity decreased at 30 wt. % content to 120 Barrer and 80 selectivity, reasonably due to filler aggregation effects. Experimental permeation tests carried out in mixed gas conditions with equimolar mixtures at 35 °C and 2 bar did not reveal differences with respect to tests carried out in single gas conditions. The optimal results obtained with the Pebax/PEG/NH2-UiO-66 membranes were attributed to the improved dispersion of the nested filler particles.
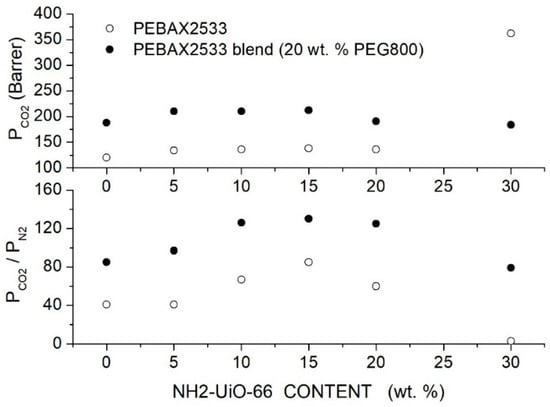
Figure 19.
permeability (upper panel) and selectivity (lower panel) of the Pebax® membranes for different NH2-UiO-66 filler content measured in single gas tests at 35 °C and 2 bar feed pressure [95]. Open circles are pertinent to the nanocomposite Pebax® membranes, and solid circles are pertinent to the hybrid Pebax®/PEG800 (20 wt. %) membranes.
Shin et al. prepared Pebax®1657 hybrid membranes with PEGMEA ( = 480 g/mol) and graphene oxide (GO) filler particles prepared by Hummers’s method. The authors carried out permeation tests at 35 °C and 1 bar feed pressure in single gas conditions and using - gas mixtures at 35 °C and 1 to 9 bar total feed pressure [96]. XRD analysis suggested that PEGMEA addition increased the PE crystalline fraction and shifted to lower angles the amorphous halo peak between 15° and 23°, indicating increased intersegmental chain spacing. DSC measurements showed that increasing the PEGMEA content, shifted from −53.3 °C for the neat membrane to −62.4 °C at 50 wt. % additive content, the PEO crystalline fraction increased from 9.1 to 28 %, and the PA crystalline fraction decreased from 11 % to 5 %. Permeation tests carried out on the blend membranes showed that the permeability increased from 84 Barrer for the neat Pebax to 198 Barrer at 10 wt. % PEG800 content. Increasing the additive content, the permeability monotonically increased, reaching the value of 900 Barrer at 70 wt. % content; see Table 28. No variations were observed in the selectivity value of 44. Diffusivity values of the blend membranes were obtained by a time-lag method and evidenced that increasing the additive content enhanced the diffusivity of all penetrant molecules, but the diffusivity selectivity decreased from 0.62 for the neat sample to 0.48 for the blend with 50 wt. % PEGMEA, the solubility selectivity increased due to the increased solubility owing to the increased amount of philic PEO groups.
Table 28.
permeability, diffusivity (units: ×10−6 cm2/s), solubility (units: cm3 (STP)/cm3 cmHg), selectivity, solubility-selectivity and diffusivity-selectivity terms of the neat Pebax membrane and of the blend Pebax/PEG-MEA membranes measured in single gas tests at 35 °C and 2 bar feed pressure [96].
The authors focused their study on the blend membrane containing PEG800 at 50 wt. % content. DSC and XRD analysis showed that filler dispersion decreased the PA crystalline fraction of the blend membranes without significant variations of the PEO crystalline fraction. The value of the hybrid membrane increased with the filler content, suggesting an interaction between the filler particles and the PA groups of the polymer matrix; see Table 29. SEM analysis of the hybrid samples indicated good dispersion of the filler particles up to 0.5 wt. % content, while at 0.75 wt. % content aggregates formed.
Table 29.
Glass transition temperature (, melting temperature () and crystalline degree () of PEO and PA groups in neat Pebax, Pebax/PEG-MEA blend and Pebax/PEG-MEA/GO hybrid membranes [96].
Changing the filler content, the authors observed three regimes for the permeability and selectivity: (i) up to 0.06 wt. %, content there was a permeability increase accompanied by a selectivity decrease; (ii) between 0.06 and 0.3 wt. % content, there was a permeability decrease and selectivity increase; and (iii) at larger filler contents, both permeability and selectivity strongly decreased; see Figure 20. The first regime is a consequence of the presence of non-selective interfacial voids favoring the penetrant diffusivity, the second regime is the formation of gas-impermeable filler agglomerates increasing the tortuosity of the penetrant molecules but improving the solubility by the interaction between molecules and O containing functional groups in the GO basal planes and the third regime was connected to the formation of large-size filler aggregates, strongly reducing the effective penetrant solubility values. The authors carried out permeation tests using the Pebax/PEGMEA(50 wt.%)/GO(0.3 wt.%) hybrid under mixed gas conditions and observed that the selectivity was slightly larger than in single gas tests while the permeability slightly decreased as a consequence of competitive sorption effects.
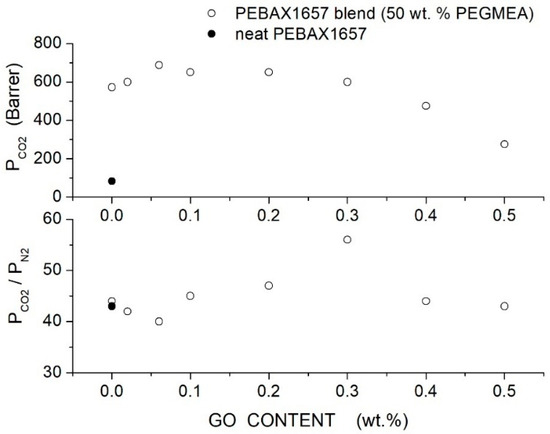
Figure 20.
permeability (upper panel) and selectivity values (lower panel) of the Pebax®1657-based membranes with different content as measured at 35 °C with 1 bar pressure [96]. The solid circle is pertinent to the neat Pebax®1657 membrane, while open circles are pertinent to the hybrid Pebax®1657/PEGMEA (50 wt. %) membranes.
Zhang et al. prepared hybrid Pebax®1704 membranes with PEG600 at 20 wt. % content as a polymeric additive and type zeolites filler particles with size 1.7 μm [97]. SEM analysis showed the formation of interface voids in Pebax/ membranes: images of the hybrid membrane suggested that the PEG additive formed interfacial buffer layers between the filler and the Pebax matrix, which impeded the formation of the non-selective void around filler particles and favored their dispersion without forming aggregates. XRD patterns of the neat Pebax membrane showed broad diffraction peaks at 5.6°, 11.1°, and 19.8° corresponding to amorphous PEO region and a sharp 22.5° peak corresponding to PA crystalline domains. After dispersion in the neat Pebax matrix, the characteristic filler diffraction peak appeared while the Pebax reflection peak almost disappeared, indicating that filler particles disrupt the semi-crystalline PEBAX® structure. Adding PEG only, the intensity of PEO diffraction peaks increased, and the intensity of crystalline PA peaks results much weaker. In the hybrid Pebax/PEG/ membrane with 10 wt. % , the peak at 5.6° corresponding to the amorphous PEO was observed, the PA crystalline peak resulted in weaker, and diffraction peaks corresponding to were also present. Increasing the filler content, the intensity diffraction peaks increased, the intensity of the PEO diffraction peaks was strongly reduced, and the intensity of the peak at 22.5° slightly increased, indicating a reduction of the membrane amorphous fraction. DSC analysis revealed that the PEO melting peak temperature of the neat Pebax at 8.5 °C increases to 9.1 °C, adding filler particles and to 14.4 °C adding PEG. In the hybrid matrix with 10 wt. % filler content, increased to 17.3 °C, to 19.7 °C at 20 wt. %, to 20.8 °C at 30 wt. %, and to 21.6 °C at 40 wt. % content, without significant variation in the PA melting temperature. Single gas permeation tests were carried out at 30 °C and 1.5 bar feed pressure and results are reported in Figure 21.
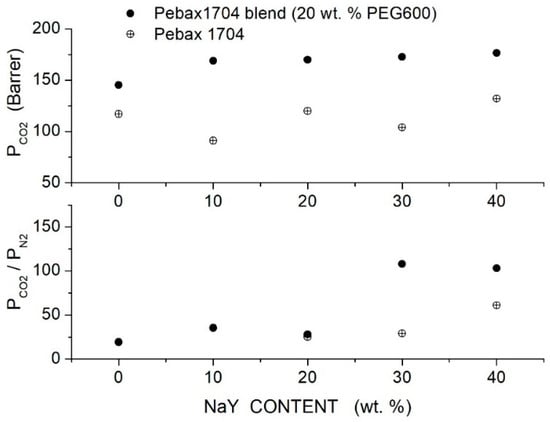
Figure 21.
permeability (upper panel) and selectivity values (lower panel) of the Pebax®1704 membranes with different content as measured at 30 °C with 1.5 bar total pressure [97]. Crossed circles are pertinent to the nanocomposite Pebax®1704 membranes, while solid circles are pertinent to the hybrid Pebax®1704/PEG600 (20 wt. %) membranes.
Results showed that dispersion in the Pebax1704 matrix does not produce a clear trend on the permeability while the selectivity is enhanced only at 40 wt. % filler content. PEG addition increased the permeability of the Pebax matrix from 117 to 145 Barrer without changing its selectivity value of 19. Filler addition in the blend matrix, on the contrary, monotonically increased the permeability from 145 Barrer to 177 Barrer at 40 wt. % content with a strongly enhanced selectivity reaching the value of 132 at 40 wt. % filler content. The permeability enhancement was attributed to the reduced crystalline content of the blend membrane caused by the disruption of hydrogen bonds linking the PA segments, while the selectivity enhancement was a consequence of the decreased permeability. Permeation tests were carried out increasing temperature from 30 to 60 °C; results showed an increase in the permeability. Minor differences were observed in the activation energy values for permeation in blend membranes with different filler contents, from 20.3 kJ/mol at 10 wt. % filler content to 17.1 kJ/mol at 40 wt. % filler content, very close to the value of the blend membrane, 19.2 kJ/mol, evidence that no rigidification of the polymer layers occurs by filler incorporation in the membrane; see Table 30. Experiments carried out using feed gas mixtures reveal that the permeability is lower than in single gas tests while the selectivity increased.
Table 30.
Activation energy values for permeation in neat and hybrid Pebax membranes [97].
He et al. prepared Pebax®1657 hybrid membranes with PEG400 as a polymer additive and porous organic polymers (POPs) as filler [98]. Mesoporous POPs nanoparticles with a size < 100 nm and 10 to 15 nm average pore diameter exhibited a 668 m2/g specific area and were rich in surface phenolic hydroxyl groups (). The groups are beneficial for hydrogen bonding with PEG400: SEM micrographs of the filler particles suggested, in fact, that the PEG400 chains adhere to the filler surface. The PEG400-POP filler nanostructures were thus well dispersed in the Pebax matrix without forming interface defects. XPS spectra of the PEG400/Pebax and PEG400-POP/Pebax membranes showed that the binding energies in the blend PEG 400/Pebax and in the hybrid PEG 400/Pebax membranes with 1.5 wt % POP content were 287.4 and 288.5 eV, respectively; this difference was attributed to the local electron interactions of the hydrogen bonds between the POPs and PEG 400. XRD analysis showed that the interchain spacing of neat Pebax increased from 0.412 nm to 0.436 nm, adding the filler particles and revealing a more open chain structure. Permeation tests were carried out in single gas conditions at 30 °C and 1 bar feed pressure, and the gas diffusivity was evaluated using the time-lag method. Results evidenced a strong increase in the permeability of the hybrid Pebax/PEG400-POP membranes with respect to the neat Pebax one; see Figure 22. The permeability value increased, in fact, from 94 to 392 Barrer in the membrane with 1.5 wt. % PEG400 content prepared using the POP solution with 1.0 mg POP/mL concentration but decreased to 292 Barrer at larger POP contents in the POP solution.
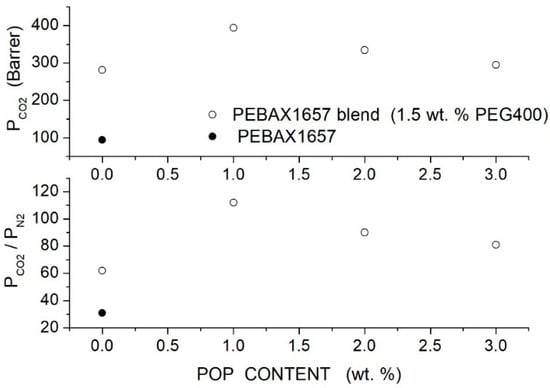
Figure 22.
permeability (upper panel) and selectivity (lower panel) of the Pebax®1657 for different POP contents as obtained in single gas tests at 30 °C and 1 bar feed pressure [98]. The solid circle is pertinent to the neat Pebax®1657 membrane; open circles to the hybrid Pebax®1657/PEG400 (1.5 wt. %) membranes.
The analysis of the permeation curves permitted the evaluation of the diffusivity and solubility values of the and penetrant molecules: obtained data permitted evidence that in all membrane samples, the dominant contribution to the selectivity arises from the higher solubility; see Table 31.
Table 31.
diffusivity (units: 10−6 cm2/s) and solubility (units: 10−2 cm3 (STP)/cm3 cmHg) values of the Pebax/PEG400/POP membranes. The solubility-selectivity () and diffusivity-selectivity () values are also reported. Values were obtained in single gas tests at 30 °C and 1 bar feed pressure [98].
Zhang et al. prepared Pebax®1657 hybrid gas separation membranes with PEGDMA (250 and 500 g/mol molecular weight) as a polymer additive and NH2-MIL-101 filler nanostructures prepared by the hydrothermal method and surface functionalized by PEI grafting (PEI-MIL-101) [99]. NH2-MIL-101 nanostructures have a size of 200 to 300 nm, a crystalline structure, a pore size of 0.8 to 1.1 nm, and a specific surface of 1300 m2/g, which decreased to 640 m2/g after surface functionalization, indicating that PEI chains occupy pore spaces in the PEI-MIL-101 nanostructures. SEM micrographs showed poor dispersion of the pristine NH2-MIL-101 nanostructures in the Pebax membrane with defects such as cracks and filler agglomeration. In the Pebax/PEGDMA blend membrane, NH2-MIL-101 nanoparticles are well distributed up to 2 wt. % content without forming aggregates: it was observed that PEGDMA layers well-wrapped NH2-MIL-101, and no interface defects were observed due to hydrogen bond interactions of PEGMA layers surrounding the filler with Pebax, as suggested by the FTIR analysis. Single gas permeation tests were carried out at 30 and 1 bar. Results showed that filler addition to the neat Pebax membrane increased the permeability from 60 to 83 Barrer at 6 wt. % content with negligible variations of the selectivity value of 46. The permeability of the neat Pebax membrane markedly increased, adding PEGDME, reaching the value of 314 and 372 Barrer at 40 wt. % PEGDME250 and PEGDME500 content, respectively, with minor variations of the selectivity, which was between 45 and 50; see Table 32.
Table 32.
permeability and selectivity of the Pebax/PEGDME membranes measured in single gas conditions at 30 °C and 1 bar feed pressure. The last row reports data pertinent to the Pebax/PEGDME membrane with the PEI-functionalized MIL-101 filler [99].
The authors focused their study on the blend membrane with 30 wt. % additive content. The addition of pristine and functionalized filler particles slightly increased the permeability and only small variations of the separation performances; see Figure 23. Measurements were carried out in the 30 to 55 °C temperature interval with the Pebax/PEGDME250/NH2-MIL-101 and Pebax/PEGDME500/NH2-MIL-101 at 6 wt. % filler content, showing that the and permeability values increased with temperature without significant variations of the selectivity. The following activation energy values for permeation were obtained in Pebax/PEGDME250/NH2-MIL-101: 9.9 and 11.9 kJ/mol for and , respectively, which decreased to 8.6 and 10.3 kJ/mol, respectively, in Pebax/PEGDME500/NH2-MIL-101.
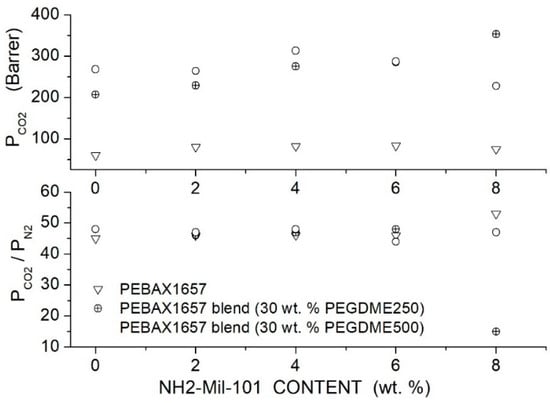
Figure 23.
permeability (upper panel) and selectivity (lower panel) of the Pebax®1657 membranes for different NH2-Mil-101 filler contents measured in single gas conditions at 30 °C and 1 bar feed pressure. Open triangles are pertinent to the nanocomposite Pebax®1657 membrane, crossed and open circles to the hybrid Pebax®1657/PEGDME250 (30 wt. %) and Pebax®1657/PEGDME500 (30 wt. %) membranes, respectively [99].
Wu et al. prepared a hybrid Pebax®1657 membrane with polyethylene glycol dimethyl ether (PEGDME) as a polymer additive and layered double hydroxide (LDH) filler nanoparticles [100]. Prior to the membrane preparation, the LDH filler particles were treated by sodium dodecyl sulfate (SDS) intercalation followed by 3-aminopropyltrimethoxysilane (APTMS) surface functionalization: functionalized filler particles (ALDH) showed 300 nm size, 100 nm thickness and showed 3.50 nm interlayer spacing, larger than in the not-intercalated filler where it was 0.67 nm. SEM micrographs showed that in the neat Pebax membrane, filler aggregation occurred at 4 wt. % content, while in the blend Pebax/PEGDME (50 wt. %) matrix, filler aggregation occurred at larger content, 6 wt. %. No interface defect, such as voids, was observed, evidencing the improved affinity between filler and matrix by the functional amino-silane groups. The dispersed filler particles showed 10 nm average thickness: this finding indicates that delamination of the ALDH nanostructures occurred within the membrane, possibly caused by PEGDMA chains penetrating cavities of the filler particles during the membrane preparation procedure. XRD spectra of the neat Pebax matrix exhibited a broad peak between 15° and 24° due to amorphous PEO domains and a sharp peak at 24° due to crystalline PA domains. ALDH incorporation in the neat Pebax and blend Pebax/PEGDME (50 wt. %) membrane increased the intensity and sharpened the PA crystalline peak, evidence of increased crystalline degree of the PA domains. DSC tests showed that 50 wt. % PEGDME addition to the Pebax matrix decreased the value, thus enhancing the chain mobility, decreasing the PA crystallinity, and increasing the PEO crystallinity. Filler dispersion in the blend membrane, on the contrary, increased the value, suggesting polymer chain rigidification and increased both the PA and PEO crystallinity, indicating a reduction of the membrane-free volume. FTIR spectra suggested hydrogen bond interaction between the PEGDMA additive and the filler nanostructures. The results of the structural analysis are reported in Table 33.
Table 33.
Glass transition temperature and crystalline fraction of blend Pebax/PEGDME membranes with different filler content [100].
Permeation tests were carried out at 25 °C and 2 bar feed pressure in single gas: results are reported in Figure 24. Results showed that PEGDME addition at 50 wt. % increased the permeability of the neat membrane from 91 to 339 Barrer without variation of the selectivity value of 52. Filler dispersion improved both permeability and selectivity of the blend membrane: optimal membrane performances were observed at 4 wt. % filler content, 460 Barrer and 63 selectivity.
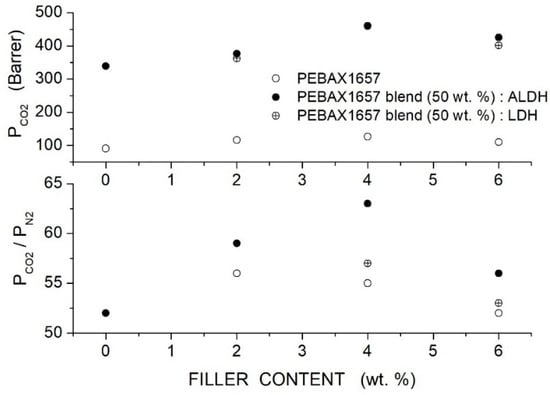
Figure 24.
permeability (upper panel) and selectivity (lower panel) of Pebax®1657 membranes as measured in single gas tests at 25 °C and 2 bar feed pressure. Open symbols are pertinent to the nanocomposite Pebax®1657 membrane; solid and crossed circles to the hybrid Pebax/PEGDMA (50 wt. %) membranes with ALDH and LDH filler nanoparticles, respectively [100].
This enhancement was attributed to the formation of preferential transport channels created by ALDH reasonably formed by size-selective interface cavities consequent to the interaction between polymer chains and filler particles. The permeability decrease at 6 wt. 5 filler content was explained by the restacking of LDH nanostructures forming impermeable domains with interfacial, non-selective voids. The authors found that the permeability of the Pebax/LDH nanocomposite was lower than that of the hybrid matrix, while the selectivity was comparable, and explained this finding considering a reduced free volume. The permeability of the hybrid Pebax/PEGDMA membrane with functionalized filler particles was comparable to that obtained with the hybrid Pebax/PEGDMA with non-functionalized filler particles, which however, showed slightly reduced selectivity due to aggregation phenomena. It was finally observed that the permeability of the hybrid Pebax/PEGDME (50 wt. %)/ALDH (4 wt. %) membrane increased with temperature, but its selectivity decreased: the authors attributed this result to a more open free-volume structure.
Wang et al. prepared Pebax®1657/PEGMEA blend membranes with high aspect ratio MXene nanostructures (~1 nm thickness and ~900 nm transversal size) as filler particles [101]. SEM micrographs of the hybrid membranes showed homogeneous membrane structures with well-dispersed MXenes without the formation of voids and interface defects up to 10 wt. % content: at 15 wt. % content filler aggregates formed and voids appeared in the membrane cross-section. FTIR analysis showed progressive redshift increasing the filler content of the absorption peak at 1638 cm−2 due to vibrations of the hydrogen bonded group of the polyamide (PA6) block of Pebax, suggesting the formation of hydrogen bonds between the MXene surface and polymer chains. The XRD pattern showed the broad halo between 2 = 16 and 23° by the amorphous phase of the membrane and a narrow peak at 2 = 23.8° due to crystalline Pebax and PEGMEA domains. The amorphous hale shifted to lower angles, increasing the filler content, indicating an increase in the -spacing, and thus a reduction of chain packing. The filler addition also resulted in a shift of the glass transition temperature from −59.6 °C to −63.1 °C, indicating increased mobility of the polymer chains; see Table 34.
Table 34.
-spacing and glass transition temperature () of Pebax/PEGMEA blend membrane containing different amount of MXene nanopartices. The permeability, selectivity, diffusivity (units: 10−6 cm2/s) and solubility (units: cm3 (STP)/cm3 cmHg) values are obtained in single gas tests at 35 °C and 3.5 feed pressure. The diffusivity- and solubility-selectivity terms are also reported [101].
Single gas permeation tests were carried out at 35 °C and 3.5 bar feed pressure; see Table 34. Filler dispersion improved the permeability and selectivity of the blend membrane: at 1 wt. % filler content, the authors measured 1265 Barrer permeability and 65 ideal selectivity, showing a strong enhancement with respect to the neat one having permeability of 621 Barrer and selectivity value of 45. The analysis of the permeation curve evidenced that enhanced performances were a consequence of increased diffusivity caused by increased fractional free volume as well as enhanced solubility due to affinity with the introduced nanosheets [101].
7. Pebax Membranes Containing PEG-Functionalized Filler Nanoparticles
Dai et al. prepared hybrid gas separation membranes by dispersing PEG-functionalized carbon nanotubes (CNT-PEG) in Pebax®1657 [102]. SEM analysis of the hybrid membranes evidenced that PEG grafting favored the filler dispersion in the polymer matrix, preventing the formation of aggregates, which were observed at 20 wt. % PEG-CNT content. No interactions of the functionalized filler particles with the polymeric matrix were shown by FTIR analysis. DSC analysis showed that incorporating CNT-PEG into the Pebax matrix reduced the heat of fusion of the PA domains, suggesting that the filler particles disrupt the hydrogen bonding between PA polymer chains in the PA crystalline domains. XRD analysis evidenced, in fact, a progressive decrease in the intensity of the diffraction peak at = 24°, increasing the filler content and indicating an increase in the Pebax amorphous fraction. Mixed gas permeation tests were carried out with 2 bar feed pressure using a 10–90% gas mixture. Results showed that the permeability increased from 91 Barrer for the neat membrane sample to 152 Barrer at 1 wt. % filler content and to 251 Barrer at 3 wt. % content. This improvement was accompanied by an increase in the selectivity from 37 for the neat Pebax membrane to 39 and 95 at 1 and 3 wt. % content, respectively; see Table 35. The permeability increase was attributed to a reduced membrane crystallinity, while the selectivity enhancement was attributed to the presence of preferential diffusion channels formed by the CNT-PEG fibers. At larger filler contents, the permeability, as well as the selectivity, decreased due to the increasing fraction of membrane occupied by the gas impermeable filler particles. The authors observed that wet gas mixtures enhanced the membrane separation properties: in fact, at 100 % RH, the permeability of the neat membrane reached 214 Barrer with a selectivity of 44, while the hybrid membrane with 3 wt. % filler content exhibited 369 Barrer permeability with a selectivity value of 110. This improvement was attributed to the formation of water clusters along the interface between filler particles and the matrix acting as fast diffusion channels.
Table 35.
permeability and selectivity of Pabax®1657 membranes as obtained in mixed gas permeation tests carried out with 2 bar feed pressure using a 10–90% gas mixture [102].
Liu et al. prepared Pebax®1657 hybrid membranes with dispersed hollow spherical COF nanofiller nanoparticles (COF) and with surface-modified COF by grafting with PEG200 (PEG200@COF) or PEG350 (PEG350@COF) to improve their interfacial compatibility with the Pebax matrix [103]. The as-prepared COFs have a diameter between 50 and 500 nm and a surface area of 1389 m2/g with pore size distribution peaked at 3.2 nm: after functionalization, the surface area reduced to 328 m2/g in PEG200@COF and to 517 m2/g in PEG350@COF, and the pore size distribution shifted to 1.35–1.42 nm, indicating PEG loading on the COF pore walls. SEM micrographs showed dense and defect-free microstructure for neat Pebax. Pristine COF form aggregates in Pebax at 3 wt. % content. PEG functionality of COF favors the filler-matrix compatibility: Pebax/PEG@COF hybrid membranes show, in fact, homogeneous filler distribution with well-dispersed filler at a content of up to 5 wt. %. XRD analysis showed that the Pebax chain spacing, 0.385 nm, decreases with filler dispersion to 0.367 nm in Pebax/PEG200-COF at 3 wt. % and to 0.371 nm in Pebax/PEG350-COF at 3 wt. %. DSC analysis of neat Pebax showed the glass transition temperature of −55.6 °C increased, adding PEG@COF to −53.6 °C with Pebax/COF, −52.6 °C with Pebax/PEG200-COF (3 wt. %) and to −52.4 °C with Pebax/PEG350-COF (3 wt. %), indicating that the interaction between filler and Pebax matrix inhibits the polymer chain mobility at the filler-matrix interface. Permeation tests were carried out at constant pressure—variable volume method using a humidified 30 vol. % –70 vol. % gas mixture at 30 °C and 2 bar feed pressure; see Figure 25.
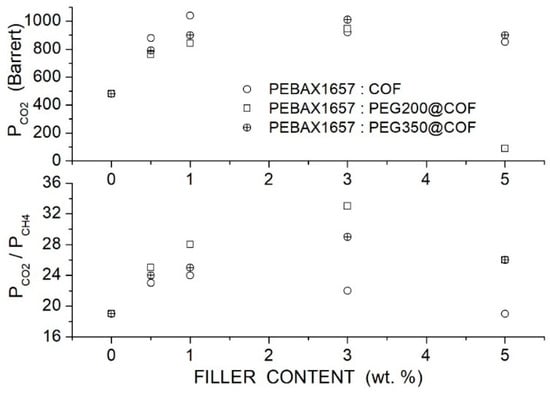
Figure 25.
permeability (upper panel) and selectivity (lower panel) of Pebax/PEG-COF membranes as obtained using a humidified 30 vol. % CO2–70 vol. % CH4 gas mixture at 30 °C and 2 bar feed pressure [103]. Open circles are pertinent to the nanocomposite Pebax®1657 membrane with pristine COF filler nanoparticles. Open squares and crossed circles to the nanocomposite Pebax®1657 membranes with COF nanoparticles surface functionalized with PEG200 and PEG350, respectively.
Results showed that pristine COF addition to the neat Pebax matrix increased the permeability and selectivity, and this enhancement was attributed to the presence of preferential pathways for penetrating molecules formed by pores of the hollow COF structure. The best membrane performances were obtained at 1 wt. %: at larger contents, the permeability decreased due to tortuous paths resulting from the formation of impermeable filler aggregates. PEG@COF filler dispersion improved the membrane performances, providing better selectivity than the Pebax/COF membranes: optimal results were found at 3 wt. % filler content both with Pebax/PEG200@COF and Pebax/PEG350@COF. The authors evaluated the penetrant diffusivity and solubility by the time-lag method, and results showed that the dominant contribution to the selectivity arose from the solubility-selectivity term ranging from 38.3 to 49.3, while the diffusivity-selectivity term was 0.43 to 0.51. The authors concluded that PEG functionalization of COF filler nanoparticles not only improves their dispersion degree but also provides preferential diffusion channels for molecules because it restricts the COF channel diameters, enhancing the diffusivity selectivity, and provides affinity for the molecules.
Li et al. prepared Pebax®1657 hybrid membranes with polyethylenimine (PEI) and polyethylene glycol (PEG)—polyethylenimine (PEI) functionalized GO nanosheets (PEI-GO and PEG-PEI-GO, respectively) [104]. AFM testing revealed that pristine GO nanoparticles have 80 to 250 mm size and 0.6 to 0.9 nm thickness. The PEI-GO nanoparticles exhibited no significant size variations while their thickness grew to 5 nm. The size of the PEG-PEI-GO nanoparticles increased to 800 nm and the thickness to 13 nm. FTIR indicated that in functionalized nanoparticles, PEI was covalently bonded to the carboxyl group of GO. SEM micrographs showed GO nanoparticle aggregates in the Pebax membrane; functionalization promoted their distribution, and no void-like defects were observed at the filler-matrix interface. DSC analysis revealed two endothermic peaks, the first at 10 °C due to the melting of PE and the second at 208 °C due to the melting of PA domains: no variation of the melting peaks position was observed after the dispersion of the functionalized GO. DSC analysis also showed that the values of the hybrid membranes are larger than that of the neat one, indicating restricted mobility of the Pebax chain and their rigidification at the filler-matrix interface. The XRD spectrum of the Pebax membranes showed the broad peak at = 23° given by the PA crystalline regions: the Pebax membrane containing pristine GO nanostructures showed a diffraction peak at 6.4° indicating that a fraction of GO particles form aggregates with a stacked structure, but this peak disappears in the hybrid membranes with functionalized GO, indicating that all functionalized filler particles are distributed in the Pebax matrix. The average interchain -spacing increased with filler content from 0.402 nm in neat Pebax to 0.431 nm in the Pebax/PEG-PEI-GO hybrid membrane with 10 wt. % filler content.
Gas permeation tests were carried out in single gas conditions by the constant pressure—variable volume method at 35 °C under dry and humidified conditions. The optimal membrane performances were obtained with the PEG-PEI-GO filler particles. The permeability and the and selectivity of the Pebax/PEG-PEI-GO membranes increased with the filler content up to 10 wt. % and decreased at larger contents. Test performances were offered by the hybrid Pebax membrane containing 10 wt. % PEG-PEI-GO: the permeability was 145 Barrer and the and selectivity values were 62 and 24, respectively; see Table 36. The authors then evaluated penetrant diffusivity and solubility by the time-lag method and obtained values~1.2 × 10⁻⁶ cm2/s with small variations of the diffusivity selectivity changing between 2.3 and 3.0, all examined samples showing that the dominant contribution to the improved permeability and selectivity was related to the improved solubility. The was 60 × 10−4 cm3 (STP)/cm3 cmHg in the neat Pebax membrane and in the Pebax membrane containing pristine filler nanoparticles. Its value increased to 100 × 10−4 cm3 (STP)/cm3 cmHg with the Pebax/PEI-GO and to 120 × 10−4 cm3 (STP)/cm3 cmHg with the Pebax/PEG-PEI-GO membrane. This finding evidenced that filler functionalization not only promoted filler dispersion in the Pebax matrix but also improved the solubility. The authors also observed that in humidified feed conditions, the permeability and selectivity values were larger than in dry conditions: with Pebax/PEG-PEI-GO, for example, they evaluated 1330 Barrer and , selectivity values of 45 and 120, respectively. The authors suggested that in humidified conditions, a facilitated transport mechanism for occurred based on the reversible reaction of with amine carriers in the presence of water while the and penetrants follow the usual solution-diffusion mechanism.
Table 36.
permeability and selectivity values of the hybrid Pebax/PEG-PEI-GO membranes as a function of the filler content measured in single gas tests at 35 °C [104].
8. PVA-Crosslinked Hybrid Membranes
Poly(vinyl) alcohol (PVA) is a linear semicrystalline polymer consisting of a backbone carbon chain and hydroxyl functional groups. It is a versatile polymer commonly used in industrial environments and of interest for membrane development given its low cost, biodegradability and film forming ability using water as a solvent [105].
Dilshan et al. prepared crosslinked PVA/PEG membranes using 90% hydrolyzed PVA ( = 30,000–70,000 g/mol) and PEG600 at different contents, changing the degree of crosslinking (DOC) [106]. The authors carried out single gas permeability tests at 25 °C and 1.5 bar feed pressure and observed that the best separation performances of the crosslinked membranes were obtained in the sample with 60 wt. % PEG at 60 mol. % DOC: the permeability was 53 Barrer and the selectivity was 26. Hybrid membranes were prepared dispersing particles with size < 45 μm at contents up to 4 wt. % in this PVA-PEG blend membrane. SEM analysis of the hybrid membranes revealed that filler particles were uniformly distributed in the dense crosslinked matrix without interface defects at contents lower than 4 wt. % where their agglomeration was observed. filler addition improved the membrane separation; see Figure 26: the hybrid membrane with 2 wt. % content showed permeability of 423 Barrer and ideal selectivity of 113.
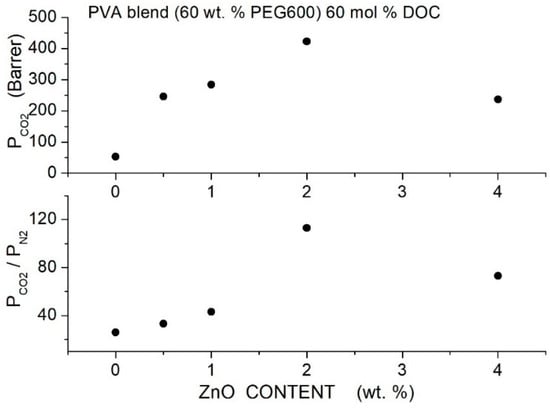
Figure 26.
permeability (upper panel) and selectivity (lower panel) of crosslinked PVA/PEG600 (60 wt. %) at 60 mol. % DOC for different ZnO filler content as obtained in single gas test at 25 °C and 1.5 bar feed pressure [106].
The enhanced performances were attributed to the interaction between and the quadrupolar molecule. The worsening of the membrane performance at 4 wt. % filler content was attributed to filler agglomeration forming gas impermeable domains in the membrane layers. The authors also observed that filler dispersion improved the membrane’s mechanical properties, with the best performances also obtained at 2 wt. % content; see Table 37.
Table 37.
Tensile strength and Young’s modulus of the PVA blend membranes with 60 wt. % PEG600 content at different DOC and filler contents [106].
In a successive study the authors prepared crosslinked PVA/PEG1000 crosslinked membranes (60 wt. % PEG1000 and 60 mol. % DOC) containing -functionalized MWCNT as filler particles (diameter 20–40 nm, length 5–10 μm, pore size < 1 nm) [107]. SEM analysis of the hybrid membranes with 0.25 and 0.5 wt. % -MWCNT revealed that filler particles were uniformly distributed in the dense, crosslinked membrane. At 0.75 wt. % content filler agglomerates were observed with MWCNT twisted together with uneven orientation and presence of interface voids. DSC analysis showed that the value increased with the filler content indicating progressive rigidification of the polymer chains; see Table 38. Single gas permeation tests were carried out at 25 °C and 1 bar feed pressure and results indicated that filler dispersion in the PVA/PEG crosslinked membrane improved the separation properties up to 0.5 wt. % content: the permeability of the neat, crosslinked membrane was 22.6 Barrer and and selectivity values of 13.2 and 20.9 increased to 116 Barrer and 82 and 203, respectively; see Figure 27, Figure 28 and Figure 29 (upper panels). Mechanical tests revealed that filler dispersion also improved the membrane mechanical properties with the storage modulus increasing from 296 to 606 MPa; see Table 38.
Table 38.
Glass transition temperature and storage modulus of PVA/PEG1000 crosslinked membranes with different -MWCNT filler content [107].
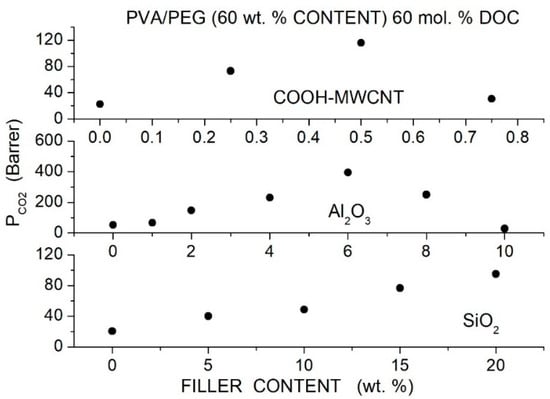
Figure 27.
permeability of crosslinked PVA/PEG (60 wt. %) at 60 mol % DOC for different filler content as obtained in single gas test at 25 °C and 1.5 bar feed pressure. Upper panel: PEG1000, -MWCNT [107], central panel: PEG600, [108], lower panel: PEG600, [109].
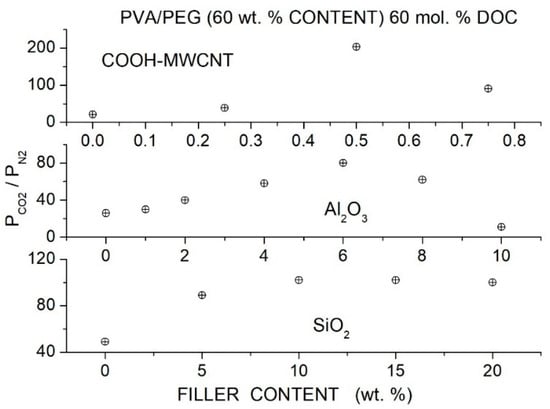
Figure 28.
/N2 selectivity of crosslinked PVA/PEG (60 wt. %) at 60 mol % DOC for different filler content as obtained in single gas test at 25 °C and 1.5 bar feed pressure. Upper panel: PEG1000, -MWCNT [107], central panel: PEG600, [108], lower panel: PEG600, [109].
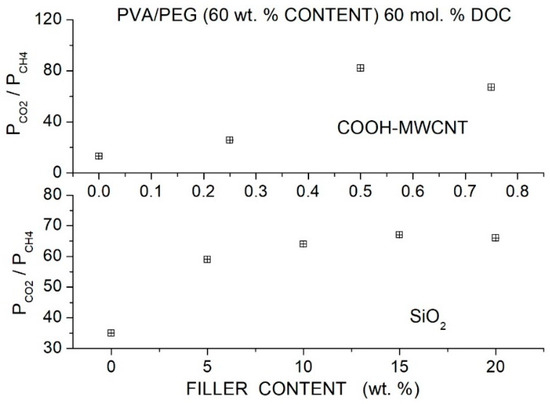
Figure 29.
selectivity of crosslinked PVA/PEG (60 wt. %) at 60 mol % DOC for different filler content as obtained in single gas test at 25 °C and 1.5 bar feed pressure. (Upper panel): PEG1000, -MWCNT [107], (lower panel): PEG600, [109].
The author prepared PVA/PEG600 crosslinked membranes (60 wt. % PEG600 and 60 mol % DOC) containing alumina () filler particles with size < 10 μm [108]. SEM micrographs showed dense structure with well dispersed filler particles without interface defects up to 10 wt. % content. DSC analysis showed that filler addition increased the position from 70 °C for the neat, crosslinked membrane to 83 °C at 10 wt.% content suggesting a decrease in the polymer chain mobility at the filler-matrix interface layers; see Table 39. Gas phase permeation test at 25 °C and 1.5 bar pressure showed that the permeability and ideal selectivity increased with the filler content up to 6 wt. % and decreased at larger contents evidence that the improvement of the membrane properties relates to the good filler dispersion state; see Figure 28 and Figure 29 (central panel). The authors attributed this enhancement to increased free volumes consequent to filler dispersion and to the preferential interaction of the migrating molecules with groups at the alumina surface. The permeability decrease was attributed to the blocking of penetrants migration paths due to filler agglomeration. Increasing temperature from 25 to 80 °C, the permeability of the hybrid PVA/PEG600 crosslinked membrane with 6 wt. % content increased (from 394 to 720 Barrer) but the selectivity decreased (from 80 to 50). Mechanical tests showed that filler dispersion up to 6 wt. % was beneficial for the membrane properties: dispersion without their agglomeration produced, in fact, an improvement of the membrane tensile strength and Young’s modulus; see Table 39, which worsened at larger filler content.
Table 39.
Glass transition (), melting () temperature and mechanical properties of PVA/PEG1000 crosslinked membranes (60 mol. % DOC) with different filler content [108].
The author finally prepared PVA/PEG600 crosslinked membranes (60 wt. % PEG600 and 60 mol % DOC) containing mesoporous silica particles with an average diameter of 200 nm at contents up to 20 wt. % [109]. FTIR spectra showed absorption peaks connected to the acetal ) and ether () linkages confirming the crosslinking reaction while after dispersion, silica peak also appeared and peaks related to stretching of silanol groups indicating the presence of groups on the filler surface. SEM micrographs showed dense membrane structure without pores and well dispersed silica particles at contents lower than 15 wt. %. DSC analysis evidenced that filler addition shifted the value from 70 °C for the neat, crosslinked membrane to 80 °C at 20 wt.% filler content suggesting a decrease in the polymer chain mobility in the filler-matrix interface layers; see Table 40. Gas phase permeation test at 25 °C and 1.5 bar pressure were carried out with samples containing up to 20 wt. % filler. Results showed a monotonic increase in the permeability with the filler content while the ideal selectivity increased up to 10 wt. % content without variations at larger contents; see Figure 28, Figure 29 and Figure 30 (lower panels). The authors attributed the enhancement of the membrane properties to an increase in the membrane-free volume. Increasing temperature, an increase in the permeability accompanied by a decrease in the selectivity was observed. Mechanical tests showed an enhancement of the membrane mechanical properties with filler content up to 10 wt. % content with a worsening at larger contents; see Table 40: the enhancement was attributed to interaction between filler particles and polymer matrix while the worsening was consequence of filler aggregation resulting in elasticity decrease.
Table 40.
Glass transition temperature () and tensile strength and elongation at break of PVA/PEG1000 crosslinked membranes (60 mol. % DOC) with different filler content [109].
Barooth et al. prepared by solution-casting method crosslinked PVA/PEG600 blend membranes with PVA/PEG ratio of 1:0.25 and 60% crosslinking degree using 99 mol % hydrolyzed PVA with = 130,000 and hybrid PVA/PEG membranes containing SiO2 nanoparticles at 3.34 and 6.68 wt. % content [110]. FTIR spectra showed the presence of Si-O-C bonds suggesting linkage between organic groups of the polymeric matrix and silica while SEM analysis evidenced the homogeneous dispersion of the filler particles in the crosslinked matrix. XRD tests showed the PVA/PEG membrane samples exhibited semicrystalline structure with a broad reflection peak at = 20°. Adding filler particles, the intensity of this peak strongly decreased and a shift to larger diffraction angles occurred evidence of a more open polymeric structure: the -spacing reduced, in fact, from 0.472 nm for the neat, crosslinked membrane to 0.423–0.424 at 6.68 wt. % filler addition. DSC tests indicated that the values of the neat, crosslinked membrane, 75 °C, increased to 80 °C and 85 °C, after 3.34 and 6.68 wt. % filler addition, respectively, indicating increase in the polymer chain rigidity. Permeation tests were carried out in crossflow configuration at 90 °C with a binary 20% –80% humidified gas mixtures using as sweep gas at 2.5 bar total pressure. Results showed that the permeability and selectivity of the crosslinked PVA/PEG membrane, 400 Barrer and 210 increased to 710 Barrer and 300 after 3.34 wt. % silica dispersion.
Xing et al. prepared crosslinked PVA/PEG (PVA 99% hydrolysis degree, PEG = 200 to 1000) membranes containing zeolite 5A filler particles with 3 to 5 μm average diameter and 0.5 nm average pore size [111]. SEM micrographs of crosslinked PVA/PEG blend membranes exhibit a homogeneous, dense and defect free structure. Permeation tests were carried out in crossflow configuration using 50% –50% gas mixtures at 30 °C and 1 bar feed pressure with as sweep gas, analyzing the permeated gas mixtures by gas chromatography. The authors carried out permeation tests with membranes at fixed additive content of 64 wt. % changing the PEG molecular weight: results showed that the use of PEG200 offered the largest permeability value, 80 Barrer while minor variations occurred in selectivity ranging from 30 with PEG1000 to 35 with PEG550. Permeation tests with the PVA/PEG200 crosslinked membranes changing the PEG200 content showed that the permeability decreased increasing the additive content while the selectivity increased: optimal performances were obtained with the crosslinked membrane containing 64 wt. % PEG200 with permeability of 80 Barrer and the selectivity of 32.9. Hybrid membranes were prepared using the crosslinked membrane with 64 wt. % content changing its filler content. SEM micrographs of the crosslinked PVA/PEG200 membrane with 32.2 wt. % filler particles showed homogeneous morphology with well distributed zeolite 5A particles and some interfacial cracking. At 58 wt. % content, filler particles were still well distributed but resulted connected to each other. Permeation tests showed that the permeability decreased from 80 for the neat blend membrane to 53 Barrer at 20 wt. % filler content; at larger filler contents the permeability monotonically increased reaching the value of 196 Barrer at 58 wt. % filler content; see Figure 30.
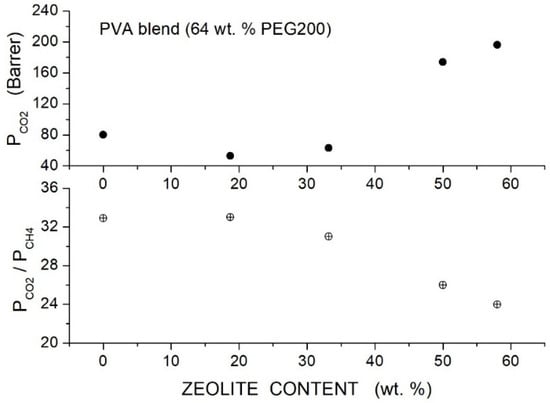
Figure 30.
permeability (upper panel) and selectivity (lower panel) values of crosslinked PVA/PEG200 (64 wt. %) membranes for different zeolite 5A filler content obtained at 30 °C and 1 bar feed pressure with - equimolar gas mixture [111].
The initial decrease in the permeability was attributed to zeolite pore blockage by polymer chains resulting in an increase in the effective diffusion length for penetrant molecules while the permeability increase at larger filler content was attributed to the formation of fast diffusion paths formed by open porosities of the interconnected filler particles. The selectivity decrease increasing the filler content was attributed to the formation of not selective interface voids caused by poor zeolite-polymer adhesion. Increasing temperature, the authors observed an increase in the and permeability and a decrease in the selectivity with the PVA/PEG200 (64 wt. %) crosslinked membrane as well as with the hybrid membrane containing 58 wt. % filler particles. By the Arrhenius plot of the measured permeability values the authors observed that the activation energy for permeation was larger for the penetrant than for in the crosslinked and in the hybrid membrane; see Table 41.
Table 41.
and pre-exponential factor () and activation energy for permeation () of PVA/PEG200 crosslinked membranes [111].
9. PEO-Based MMM
Li et al. prepared crosslinked poly(ethylene glycol) methyl ether arylate (PEGMEA, = 480 g/mol) and poly(ethylene glycol) diarylate (PEGDA, = 700 g/mol) membranes containing N-doped microporous carbon microparticles (NMCP, with 508 m2/g specific surface area, 0.220 cm3/g micro pores specific volume, 0.53 nm average pore size) [112]. SEM analysis showed well dispersed filler particles with good interfacial compatibility up to 2.5 wt. % content while at larger contents filler agglomeration occurred and interface defects formed. DSC analysis showed a value of—59.5 °C with crystallization peak at −10 °C for the neat, crosslinked membrane. The values slightly increased with filler addition up to 2.5 wt. % and then decreased due to filler agglomeration. The same trend was observed for the -spacing as evaluated by XRD analysis.
Single gas permeation tests were carried out at 30 °C and 3 bar feed pressure and results showed that the permeability and selectivity values increased with the filler content from 221 Barrer and 47 to 605 Barrer and 57 at 2.5 wt. % filler content; see Table 42. At filler contents larger than 2.5 wt. % the permeability increased but the selectivity decreased due to the presence of non-selective voids at the interface between filler agglomerates and polymer matrix. The authors observed that in the neat as well as in the hybrid membrane the dominant contribution to the selectivity was due to the much larger solubility. Increasing temperature, it was observed that in the neat and hybrid membrane with 2.5 wt. % filler content the and permeability values increased but the selectivity decreased. In the blend membrane the authors evaluated 13.2 and 28.1 kJ/mol for the and activation energy for permeation, respectively. In the hybrid membrane with 2.5 wt. % filler content minor differences were observed and the activation energy values were 14.3 and 25.9 kJ/mol for the and , respectively, indicating that penetrant permeability is limited by their transport through the polymer layers in both membrane samples.
Table 42.
permeability, solubility (units: 10−4 cm3 (STP)/cm3 cmHg) and diffusivity (units: 10−6 cm2/s) values of the neat and hybrid PEO-based crosslinked membranes at different filler contents, as obtained in single gas tests at 30 °C and 3 bar feed pressure [112].
Zhen et al. prepared crosslinked Jeffamine® ED-600 ( = 600) and PEGDGE ( = 526) membranes containing ZIF-8 (100 nm size and 0.34 nm pore size) and Zn-ATA (2D nanostructures with 50 nm size and pore size of 0.3 nm) MOFs nanostructures (CLM, C-ATA, C-ZIF) [113]. Hybrid membranes were also prepared immersing the CLM, C-ATA and C-ZIF membranes in liquid PEGDME solutions under ultrasonication treatment for impregnation with small size PEG (C-I, C-I-ATA and C-I-ZIF, 130 wt. % PEG uptake rate). The filler content of all hybrid membranes was 3 wt. % to ensure their uniform distribution and avoid aggregation and structural defects. XRD analysis showed amorphous structure with a broad halo centered at 22.5°: this halo shifted to lower angles in presence of PEGDME and fillers evidencing an increased -spacing due to chain packing disruption and free volume increase. DSC analysis showed a single value in all membranes indicating formation of uniform structure. The value of the control CLM, C-ATA and C-ZIF membranes was at −49.65 °C and decreased to −78.83, −80.10 and −80.17 °C for the C-I, C-I-ATA and C-I-ZIF membranes, inversely correlated with -spacing and free volume variation.
Permeation experiments were carried out at 35 °C and 3 bar feed pressure while gas sorption was studied by gravimetric methods. Results showed that ATA and ZIF-8 dispersion in the crosslinked membrane increased the permeability from 93 to 261 and 266 Barrer, respectively, due to enlarged -spacing and free volume increase without changing, in fact, the selectivity value of 40. PEGDME impregnation strongly increased the permeability to 1600, 2300 and 2600 Barrer with C-I, C-I-ATA and C-I-ZIF membrane samples accompanied by a decrease in the selectivity to 23 for C-I and C-I-ATA without variation for C-I-ZIF membrane. Results are reported in Table 43. The authors observed that the solubility was slightly affected by MOF dispersion while PEGDME impregnation increased by 50 % the solubility in all membranes as consequence of the interaction with PEGDME ethylene glycol units. Both MOF and PEGDME addition resulted, on the contrary, in an increase in the diffusivity consistent with the free volume increase.
Table 43.
-spacing, glass transition temperature (), permeability and selectivity values as obtained in single gas test at 35 °C and 3 bar of PEG-crosslinked membranes containing ZIF-8 filler nanostructures. [113].
Luo et al. prepared by vacuum filtration technique neat MXenes and composite MXenes/PEG membranes using different PEG formulations [114]. SEM analysis showed that the neat membranes were constituted by an assembly of 1.9 nm thick MXenes nanosheets with lamellar structure forming interlayer channels for diffusion of penetrant molecules. Cross-sectional micrographs of composite MXenes/PEG membranes showed that the flexible PEG chains encapsulated the MXenes nanostructures and filled the channels resulting from the MXenes lamellar structure. The authors carried out gas phase permeation tests at 25 °C and 1 bar feed pressure, results are reported in Table 44. Results showed that the composite MXene/PEG composite membrane show excellent separation properties given by the lamellar nanofluidic channels formed by the MXenes nanosheets and the affinity between the moleculaes and the PEG additive. Minor differences were observed in the transport rates and selectivity in mixed gas conditions
Table 44.
permeance and selectivity of MXene membranes containing 25 wt. % PEG plasticizer as obtained in single gas permeation tests at 25 °C and 1 bar feed pressure [114].
Checchetto et al. prepared nanocomposite membrane consisting of cellulose nanocrystals (CNCs) using PEG400 as plasticizer agent [115]. Structural analysis carried out by SEM and AFM indicated that membranes were constituted by CNCs with 80 to 250 nm length and 3 nm cross-section oriented with their long axis parallel to the surface forming a dense packed structure. PEG aggregates were not observed, indicating that the additive dispersed between the CNC nanostructures. Single gas permeation tests were carried out at 25 °C and sub-atmospheric feed pressure. Results indicated that PEG addition changes the gas impermeable properties of the CNC membrane which resulted selective. It was observed that the permeability of the nanocomposite membrane increased with PEG400 content from 0.42 Barrer at 14 wt. % to 2.5 Barrer at 21 wt. % content with selectivity slightly reducing from 20 to 16 with dominant contribution arising from the solubility-selectivity term. Their results suggested that the PEG well mixed with CNCs nanostructures increased the membrane-free volume thus allowing the penetrant transport and preferentially improved the solubility given the specific interaction between the quadrupolar penetrant and the dipolar ether group of the PEG additive.
10. Emerging Membrane Systems
The gas separation membranes market is nowadays dominated by polysulfones, polyimides and cellulose acetate which exhibit acceptable permeability values and separation performances [30,31]. Future membrane applications such as carbon capture from flue gas or processing of natural gas require membrane operating with huge gas volumes: to make the membrane separation process economically attractive, the polymeric membrane should not only exhibit excellent separation properties but also high permeabily values. This requires glassy polymers combining high free volume for enhanced permeability with high chain rigidity to maximize the penetrant selectivity. To face this challenge, research interest is thus focused on the development of microporous polymers having pore size smaller than 2 nm and maintaining the required operative properties under harsh conditions and over long-term operations. Superglassy microporous polymers such as thermally rearranged (TR) polymers and polymers of intrinsic microporosity (PIMs) and ionic liquid (IL) membranes are the most promising candidate materials.
Thermally rearranged polymers are heterocyclic polymers prepared by high temperature thermal rearrangements of orthohydroxy polyamides or polyimides to obtain dense membranes containing rigid aromatic rings, polybenzoxazoles (PBO) and polybenzothiazoles (PBT) [116]. Thermally rearranged membranes have microporous structure: their free volume properties can be finely tuned changing precursor molecules and heat treatment conditions to obtain enhanced separation performances with high permeability. Moreover, TR polymers show good corrosion resistance and high thermal stability, suggesting their use for separation applications in harsch conditions [117]. TR-1 is prepared from fluorinated diamine and dianhydride and is the most studied TR polymer: TR-1 membranes exhibit permeability value of 2000 barrer and selectivity value of 40 with plasticization resistance up to 15 bar feed pressure [118]. The limit of TR membrane is that high temperature conversion of imide to benzoxazole to produce PBOs can give rise to the partial thermal degradation of the TR membranes and degrade consequently the membrane mechanical properties. Research activity is now focusing on (i) the preparation of membranes requiring low thermal rearrangement temperature by, for example, using template molecules with low value and (ii) understanding the correlation between structure of template molecules and separation performances of the prepared TR membrane [119].
Polymer of Intrinsc Microporosity (PIMs) are amorphous microporous materials containing channels for fast penetrant transport formed by interconnected network of voids with size less than 2 nm [67,120,121]. This microporous structure is intrinsic in nature: in fact, the PIM backbone typically has a rigid “spiro-type” structure which prevents the free rotation along the backbone of the macromolecular components, their efficient packing and rearrangement [122]. PIMs show high chemical and thermal stability, large free volume exceeding 20 vol. %, high internal surface area between 300 and 1760 m2/g and good processability because they are soluble in common organic solvents including CHCl3, DCN, THF. These properties have thus stimulated the interest of PIMs for membrane separation applications: at present PIMs show better permeability/selectivity combination than all other existing membrane materials [69,123,124]. PIM-1 is the archetypal PIM: it is a ladder polymer prepared by the polycondensation reaction of 5,5,6,6-tetrahydroxy-3,3,3,3-tetramethyl-1,1′-spirobisindane with tetra -fluorophalonitrile leading to the formation of dibenzodioxane. It is a glassy, contorted polymer with high fractional free volume close to 0.25, not observable value and BET surface area close to 800 m2/g. Given its excellent workability it is the most studied PIM for membrane applications [121]. PIM-1 exhibits permeability values ranging from 6500 Barrer with and selectivity values of 15.1 and 19.1 [121,122,123] to 2300 Barrer with and selectivity values of 18.1 and 25 [121,122,123]. Different studies have shown that PIM-1 membranes lack long-term operational stability due to physical aging: in fact, after membrane forming the molecular chains will gradually relax to equilibrium configuration. Therefore, most studies on PIM-1 are aimed at improving its physical aging resistance by: (i) modifying the internal chemical strucure via chemical reactions such as functionalization of the -CN backbone and self-crosslinking under thermal or UV treatment or (ii) incorporating porous organic and inorganic nanofillers which are supposed to restrict the movement of the macromolecular chains [121,122,123]. Different PIMs have been developed having different backbones such as polyimide-based PIMS, prepared via derivatizing the aromatic tetrol into bis carboxylic anhydride, Tröger’s Base (TB)-based PIMs, prepared via TB polymerization such as PIM-ethanoanthracene (EA)-TB, PIM-Triptycene(trip)-TB, and PIM-benzotriptycene (Btrip)-TB. The commercial availability and practical application of PIMs is anyway limited due to the precursor molecules cost and disposal lack [124,125,126].
Ionic Liquid Membranes (ILMs). Ionic liquids (ILs) are organic/inorganic salts in liquid state at temperatures below the water boiling temperature, largely consisting of cations and anions in absence of any molecular solvent [127,128,129,130]. ILs exhibit unique properties such as high thermal stability, low vapor pressure and high solubility over a wide range of organic and inorganic compounds. Their physicochemical properties can be taiolored to satisfy specific tasks by the appropriate selection of its constituents [127,128,129,130]. Supported Ionic Liquid Membranes (SILMs) are the most common IL membrane: SILMs consist of a porous support material containing and immobilizing the IL [130,131]. They can be easility fabricated by soaking the porous support into the IL: membrane formation takes place by impregnation of the pores through capillarity forces [132,133]. Gas transport through SILMs takes place through the ILs phase and obeys the solution-diffusion mechanism. Penetrant diffusivity is a fast process owing to the liquid IL condition, the membrane selectivity is controlled by the different penetrant solubility values in the IL phase [131]. Porous PVDF and PES are the most common polymer support as they are well wet by the IL phase but other supports such as nanoporous alumina and graphene-like strutures have been tested [131]. Using porous PVDF support impregnated by [ENIM][Ac] Santos et al. obtained a permeability value of 880 Barrer with selectivity of 34 [132]; Zhang et al. using a porous PES support with [BMIM][PhO] obtained SILMs showing permeability value of 2540 Barrer with selectivity of 127 [133]. Chichowska-Kopczynska et al. prepared SILMs membranes using porous PP support impregnated by [EMIM][Tf2N] and obtained a permeability of 636 Barrer with selectivity of 40 [134] while Tome et al. used PTFE support impregnated by [Ch][Lev] and obtained a permeability of 18 Barrer with selectivity of 20 [135]. SILMs provide relatively high permeability and selectivity but their commercial use for gas separation processes is limited by the leaching of the functional ILs from the membrane support at high temperature and for transmembrane pressure exceeding the capillarity force and by the poor adhesion of the IL to the support [131]. Research activity in the ILMs is focused to the development of IL self-supporting formulations: (i) polymer/IL blends where the IL phase is embedded into a tighter polymer matrix using PIM, semi-crystalline fluoropolymers and thermoplastic elastomers such as Pebax® and (ii) Polymeric Ionic Liquids (PILs) obtained by polymerization of IL monomers thus combining the favorable properties of polymers and ILs [136].
11. Discussion
Some general conclusions can be drawn from the above discussed data on the separation properties of homogeneous, non-porous blend polymer/PEG membranes. The permeability of the neat polymer membrane is generally enhanced by PEG addition and the permeability of the blend increases with the additive molecular weight and content. The improved permeability is attributed to the enhanced affinity of the penetrant molecule to the blend membrane layers due to physical interaction between the quadrupolar molecule and the PEG polar ether groups enhancing the solubility [47,48]. An exception to this trend is shown by the PC/PEG300 blend membrane: here increasing the additive content a permeability reduction is observed which was attributed to the increasing polymer chain packing [59]. Non-selective contributions to the membrane permeability result from structural effects consequent to PEG addition and changing the penetrant transport rates such as variation of the membrane crystalline degree or of the polymer chain mobility. In porous polymers such as PIM-1 [70], PEG chains occupy pores with consequent reduction of the membrane-free volume: the permeability of the blend membrane for all penetrants thus results lower than that of the neat one but the selectivity is improved owing to the reduced pore density where the non-selective transport of all penetrant molecules occurs. The and selectivity of the neat polymer only shows minor variations by PEG addition mostly resulting from variation of the polymer chain packing: enhanced selectivity is observed when PEG addition increases the chain packing and arises from diffusivity-selectivity enhancement having the and penetrants larger molecular size [66,79].
Looking at Table 4 [64] and Table 6 [70] it can be observed that when the additive content is large enough to give rise to phase separation as indicated, for example, by a double value in the DSC thermograms or by SEM micrographs, the permeability value increases but the selectivity decreases. The selectivity worsens because interface defects form non-selectively enhancing the transport rates of penetrant gas molecules.
Let us consider now the transport properties of nanocomposite and homogeneous hybrid membranes with filler content below the aggregation limit. The and separation factors as a function of the permeability are reported in Figure 31 and Figure 32, respectively, for selected polymer/additive/filler systems. In Figure 31 data pertinent to PC/PEG1000/MWCNT membrane systems are reported as as black squares [79], to CA/PEG1000/MWCNT as red triangles [81], to Matrimid/PEG200/ZSM-5 as blue circles [84], to PSF/PEG1000/MOF as magenta stars [88]. In Figure 32 black squares are pertinent to PC/PEG1000/MWCNT membrane system [79], blue circles to Pebax®1657/PEG800/ZIF-8 [92], red triangles to CA/PEG1000/MWCNT [81], cyan pentagrams to Pebax®1657/PEGDMA500/NH2-Mil-101 [99], magenta stars to Pebax®1657/PEG400/POP [98] and green circles to Pebax®2533/PEG800/NH2-UiO-66 [95]. For each symbol, the open one is pertinent to the neat polymer membrane, the half-filled symbol one to the nanocomposite membrane at its critical filler content and the full one to hybrid membrane at its critical filler content. For reference, in Figure 31 and Figure 32 , we also report the and Robeson’s upper limit as solid lines [44].
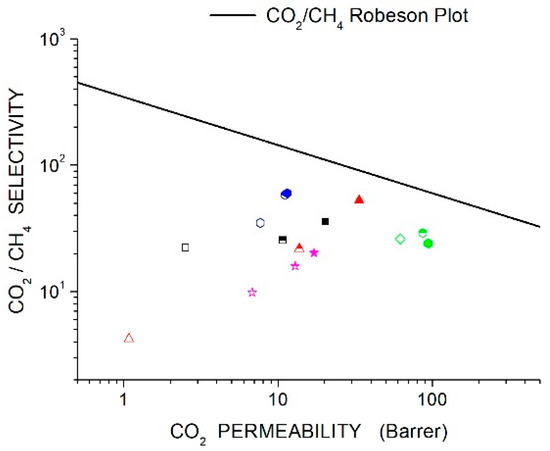
Figure 31.
Left panel: black squares, PC/PEG1000/MWCNT membranes [79], red triangles: CA/PEG1000/MWCNT membranes [81], blue circles: Matrimid/PEG200/ZSM-5 membranes [84], magenta stars: PSF/PEG1000/MOF membranes [88]. The solid line is the Robeson’s upper limit [44].
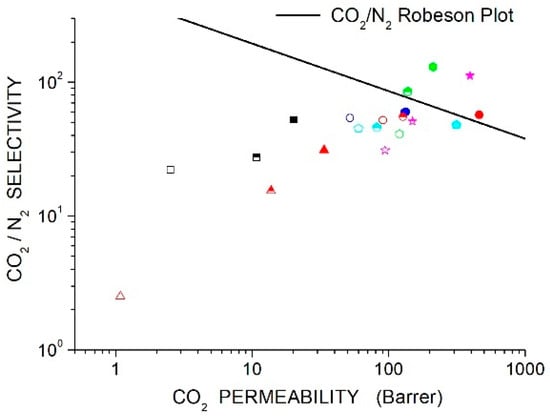
Figure 32.
Black squares: PC/PEG1000/MWCNT membranes [79] blue circles: Pebax®1657/PEG800/ZIF-8 membranes [92], red triangles: CA/PEG1000/MWCNT membranes [81], cyan pentagrams: Pebax®1657/PEGDMA500/NH2-Mil-101 membranes [99], magenta stars: Pebax®1657/PEG400/POP membranes [98], green circles: Pebax®2533/PEG800/NH2-UiO-66 membranes [95]. The solid line is the Robeson’s upper limit [52].
It can be observed that the operative properties of nanocomposite membranes overcome those of the neat one both in terms of permeability and selectivity enhancement, comparing open and half-filled symbols. It can be also observed that the hybrid membranes performances overcome those of the nanocomposite one, comparing half-filled and full symbols.
Two common trends for neat and blend membrane were observed after filler dispersion: (i) the permeability and selectivity increases by increasing the filler content, (ii) for each examined polymer/filler couple there is a critical filler content producing the highest permeability and selectivity values and (iii) when this critical filler content is overcome, the permeability generally increases but the selectivity markedly decreases. It is anyway observed that the permeability as well as the selectivity values are larger in the hybrid than in the nanocomposite membrane.
SEM micrographs of all examined hybrid and nanocomposite membrane systems show that filler aggregation in the hybrid membrane, as well as in those where PEG is crosslinked, takes place at filler contents which are somewhat larger than in the nanocomposite one. This finding clearly indicates that PEO segments in the membrane layers enhance the compatibility of the filler nanostructure with the polymer matrix, as suggested by FTIR in some of the examined membrane systems [79,80,84,85,86,89,100,101] and observed when the filler nanostructures are functionalized by PEG surface grafting [87,90,93,99]. The higher dispersion degree of the filler nanostructures in the hybrid membrane optimizes those structural refinement enhancing the membrane permeability, that is the increase in the polymer free volume [88,90,92,101,108,109,113,115], the reduction of crystalline degree [84,93,95,96,97,102] and polymer chain mobility [88,90,100]. Those refinements also permit to improve the separation performances selectively enhancing the transport because the increased chain packing act as size-sieving nest [103,110] or promoting the formation of continuous size-selective diffusion paths for migrating molecules [100,103]. Note also that the improved filler dispersion and compatibility limits the formation of void-like defects non-selectively increasing the transport rates of all penetrant molecules. Mechanical testing revealed that PEG addition favoring the filler dispersion is beneficial also for the membrane mechanical properties resulting improved compared with those of the nanocomposite ones.
To conclude this discussion, it is important to consider barriers impeding the scale-up of the above discussed hybrid membranes.
First, their commercial applications require the enhancement of their selectivity from light gases and of their mechanical properties [47,48]: this seems a hard task until issues are solved such as filler aggregation also at low contents with consequent formation of non-selective open volume defects at aggregate-matrix interface.
The scalability of the manufacturing process has also to be considered: the present hybrid PEG/polymer membranes have been produced by laboratory scale methods such as solution-casting. Their widespread application requires their production on an industrial scale, cost-effective level while maintaining high quality standards: this target requires the improvement of the existing production technologies such as melt compounding but also testing on their production by advanced technologies such as additive manufacturing [137,138,139].
The operative characterization of the hybrid PEG/polymer membranes requires more advanced testing because most studies were carried out in single gas conditions using pure gas or with binary gas mixtures prepared by mixing pure gases. This testing clearly provides important but only initial results because the operative testing must be carried out using gas mixtures as similar as possible to those under real operative conditions [140].
The scaling-up of these membranes also need dedicated experiments to study long-term operative stability under real operative conditions to explore the impact of detrimental well-known effects such as plasticization resulting from physical aging [141,142], from the high partial pressures in the feed gas mixtures [143,144], from the presence of contaminants such as higher hydrocarbons and from membrane compactation effects under high pressure of the feed mixture [145].
It is worth considering specific situations. Flue gases from power plants are wet, their pressure is lower than 0.1 bar and their temperature is between 80 and 170 °C: PEG containing membranes have lower value which potentially limit their application in flue-gas separation. The scaling-up of these membranes thus requires the development of innovative PEG based formulations with acceptable value [47,48]. Given the low flue gas pressure, separation processes require the use of composite membranes where the PEG selective layer has few tenths of micrometer thickness: the industrial fabrication of a defect free very thin PEG-based layer containing nanofiller particles is a hard challenge owing to agglomeration problems and interface defect formation. The separation of carbon dioxide from natural gas streams is a more promising application for PEG-based membranes as they must operate with feed gas at larger pressure and lower temperatures, 25–50 °C. In the separation of carbon dioxide from light gases such as nitrogen, PEG-based membranes have permeability large enough for practical applications: unfortunately, the present selectivity values, 30 to 50, allow to carry out expensive multi-stage separation processes while less expansive single-stage processes require improved selectivity which should be grater than 120 [146,147,148].
12. Conclusions
The structural properties and the separation performances of PEG-containing membranes have been reviewed to elucidate the relation between gas transport properties and membrane structure at nano-scale level. It is shown that hybrid membranes consisting of a polymer/PEG matrix with dispersed filler nanostructures simultaneously offer improved mechanical properties and separation performances than nanocomposite ones where filler particles are dispersed in the neat polymer matrix. Structural analysis evidence that better membrane performances due to the PEG addition are a consequence of an enhanced filler-matrix compatibility which limits filler aggregation and formation of filler-matrix interface defects.
To solve issues such as the low glass transition temperature of PEG-containing hybrid membranes and improve their separation properties thus attaining acceptable performances and mechanical/thermal compatibility with the operative conditions, the testing of novel inorganic nanostructures and their surface functionalization is required.
Funding
This research received no external founding.
Conflicts of Interest
The authors declare no conflict of interest.
References
- Hanson, E.; Nwakile, C.; Hammed, V.O. Carbon capture, utilization, and storage (CCUS) technologies: Evaluating the effectiveness of advanced CCUS solutions for reducing CO2 emissions. Res. Surf. Interf. 2025, 18, 100381. [Google Scholar] [CrossRef]
- Alli, Y.A.; Bamisaye, A.; Bamidele, M.O.; Etafo, N.O.; Chkirida, S.; Lawal, A.; Hammed, V.O.; Akinfenwa, A.S.; Hanson, E.; Nwakile, C.; et al. Transforming waste to wealth: Harnessing carbon dioxide for sustainable solutions. Res. Surf. Interf. 2024, 17, 100321. [Google Scholar] [CrossRef]
- Odunlami, O.A.; Vershima, D.A.; Oladimeji, T.E.; Nkongho, S.; Ogunlade, S.K.; Fakinle, B.S. Advanced techniques for capturing and separation of CO2—A review. Results Eng. 2022, 15, 100512. [Google Scholar] [CrossRef]
- Yun, X.; Soo, D.; Lee, J.J.C.; Wu, W.Y.; Tao, L.; Wang, C.; Zhu, Q.; Bu, J. Advancements in CO2 capture by absorption and desorption: A comprehensive review. J. CO2 Util. 2024, 81, 102727. [Google Scholar]
- Karimi, M.; Shirzad, M.; Silva, J.A.C.; Rodrigues, A.E. Carbon dioxide separation and capture by adsorption: A review. Environ. Chem. Lett 2023, 21, 2041–2084. [Google Scholar] [CrossRef]
- Song, C.; Liu, Q.; Deng, S.; Li, H.; Kitamura, Y. Cryogenic-based CO2 capture technologies: State-of-the-art developments and current challenges. Renew. Sust. Energy Rev. 2019, 101, 265–278. [Google Scholar] [CrossRef]
- Kim, C.; Talapaneni, S.N.; Dai, L. Porous carbon materials for CO2 capture, storage and electrochemical conversion. Mater. Rep. Energy 2023, 3, 100199. [Google Scholar] [CrossRef]
- Heidari, M.; Mousavi, S.B.; Rahmani, F.; Sene, R.A. Eco-friendly, sustainable and porous eggshell/tea waste-derived CaO nanoparticles as a high-temperature CO2 sorbent: Fabrication and textural/ morphological evaluation. J. Ind. Eng. Chem. 2024, 134, 169–180. [Google Scholar] [CrossRef]
- Mousavi, B.; Heidari, M.; Rahmani, F.; Sene, R.A.; Clough, P.T.; Ozmen, S. Highly robust ZrO2-stabilized CaO nanoadsorbent prepared via a facile one-pot MWCNT-template method for CO2 capture under realistic calcium looping conditions. J. Clean. Prod. 2023, 384, 135579. [Google Scholar] [CrossRef]
- Heidari, M.; Mousavi, S.B.; Rahmani, F.; Aminabhavi, T.M.; Rezakazemi, M. Insightful textural/morphological evaluation of cost-effective and highly sustainable Ca-Zr-O nanosorbent modified with the waste date kernel as a biomass pore-former for high-temperature CO2 capture. Sust. Mat. Technol. 2023, 38, e00778. [Google Scholar] [CrossRef]
- Chang, S.-F.; Chiu, H.-H.; Jao, H.-S.; Shang, J.; Lin, Y.J.; Yu, B.-Y. Comprehensive evaluation of various CO2 capture technologies through rigorous simulation: Economic, equipment footprint, and environmental analysis. Carbon Capt. Sci. Technol. 2025, 14, 100342. [Google Scholar] [CrossRef]
- Baker, R.W. Membrane Technology and Applications; John Wiley & Sons: Chichester, UK, 2012; ISBN 9780470743720. [Google Scholar]
- Stankiewick, A. Reactive separation for process intensification: An industrial perspective. Chem. Eng. Process. 2003, 42, 137–144. [Google Scholar] [CrossRef]
- Drioli, E.; Stankiewick, A.; Macedonio, F. Membrane engineering in process intensification—An overview. J. Membr. Sci. 2011, 380, 1–8. [Google Scholar] [CrossRef]
- Gallucci, F.; Fernandez, E.; Corengia, P.; van Sint, M. Recent advances in membranes for efficient hydrogen purification. Chem. Eng. Sci. 2013, 92, 40–66. [Google Scholar] [CrossRef]
- Naquash, A.; Qyyum, M.A.; Chaniago, Y.D.; Riaz, A.; Yehia, F.; Lim, H.; Lee, M. Separation and purification of syngas-derived hydrogen: A comparative evaluation of membrane- and cryogenic-assisted approaches. Chemosphere 2023, 313, 137420. [Google Scholar] [CrossRef]
- Baker, R.W.; Lokhandwale, K. Natural gas processing with membranes: An overview. Ind. Eng. Chem. Res. 2008, 47, 2109–2112. [Google Scholar] [CrossRef]
- Dai, Z.; Deng, L. Membranes for CO2 capture and separation: Progresses in research and development for industrial applications. J. Membr. Sci. 2024, 335, 126022. [Google Scholar] [CrossRef]
- Valappil, R.S.K.; Ghasem, N.; Al-Marzouqi, M. Current and future trends in polymer membrane-based gas separation technology: A comprehensive review. J. Ind. Eng. Chem. 2021, 98, 103–129. [Google Scholar] [CrossRef]
- Russo, F.; Galiano, F.; Iulianelli, A.; Basile, A.; Figoli, A. Biopolymers for sustainable membranes in CO2 separation: A review. Fuel Proc. Technol. 2021, 213, 106643. [Google Scholar] [CrossRef]
- Han, Y.; Winston Ho, W.S. Polymeric membranes for CO2 separation and capture. J. Membr. Sci. 2021, 628, 119244. [Google Scholar] [CrossRef]
- Merkel, T.C.; Wei, X.; He, Z.; White, L.S.; Wijmans, J.; Baker, R.W. Selective exhaust gas recycle with membranes for CO2 capture from natural gas combined cycle power plant. Ind. Eng. Chem. Res. 2012, 52, 1150–1159. [Google Scholar] [CrossRef]
- Jana, A.; Modi, A. Recent progresses on functional polymeric membranes for CO2 separation from flue gases: A review. Carbon Capt. Sci. Technol. 2024, 11, 100204. [Google Scholar] [CrossRef]
- Ramasubramanian, K.; Verweij, H.; Ho, W.S.W. Membrane processes for carbon capture from coal-fired power plant flue gas: A modeling and cost study. J. Membr. Sci. 2012, 421, 299–310. [Google Scholar] [CrossRef]
- Lin, H.; Freeman, B.D. Materials selection guidelines for membranes that remove CO2 from gas mixtures. J. Mol. Struct. 2005, 739, 57–74. [Google Scholar] [CrossRef]
- Tong, Z.; Ho, W.S.W. Facilitated transport membranes for CO2 separation and capture. Sep. Sci. Technol. 2017, 52, 156–167. [Google Scholar] [CrossRef]
- Wind, J.D.; Paoul, D.R.; Koros, W.J. Natural gas permeation in polyimide membranes. J. Membr. Sci. 2004, 228, 227–236. [Google Scholar] [CrossRef]
- Suleman, M.S.; Lau, K.K.; Yeong, Y.F. Plasticization and swelling in polymeric membranes in CO2 removal from natural gas. Chem. Eng. Technol. 2016, 39, 1604–1616. [Google Scholar] [CrossRef]
- Basu, S.; Khan, A.L.; Cano-Odena, A.; Liu, C.; Vankelecom, I.F. Membrane-based technologies for biogas separation. Chem. Soc. Rev. 2010, 39, 750–768. [Google Scholar] [CrossRef]
- Vakharia, V.; Ramasubramanian, K.; Ho, W.S.W. An experimental and modeling study of CO2-selective membranes for IGCC syngas purification. J. Membr. Sci. 2015, 488, 56–66. [Google Scholar] [CrossRef]
- Merkel, T.C.; Zhao, M.; Baker, R.W. Carbon dioxide capture with membranes at an IGCC power plant. J. Membr. Sci. 2012, 389, 441–450. [Google Scholar] [CrossRef]
- Checchetto, R.; De Angelis, M.G.; Minelli, M. Exploring the membrane-based separation of CO2/CO mixtures for CO2 capture and utilization processes: Challenges and opportunities. Sep. Purif. Technol. 2024, 346, 127401. [Google Scholar] [CrossRef]
- Numes, S.P.; Peinemann, K.V. Gas Separation with Membranes. In Membrane Technology in the Chemical Industry; Wiley-VCH Verlag: Weinheim, Germany, 2001; pp. 39–67. [Google Scholar]
- Chen, X.Y.; Vinh-Thang, H.; Ramirez, A.A.; Rodrigue, D.; Kaliaguine, S. Membrane gas separation technologies for biogas upgrading. RCS Adv. 2015, 5, 24399–24448. [Google Scholar] [CrossRef]
- Bandehali, S.; Moghadassi, A.; Parvizian, F.; Hosseini, S.M.; Matsuura, T.; Joudaki, E. Advances in high carbon dioxide separation performance of poly(ethylene oxiode)-based membranes. J. Energy Chem. 2020, 46, 30–52. [Google Scholar] [CrossRef]
- Bernardo, P.; Drioli, E.; Golemme, G. Membrane gas separation: A review/state of art. Ind. Eng. Chem. Res. 2009, 48, 4638–4663. [Google Scholar] [CrossRef]
- Marturano, V.; Cerruti, P.; Ambrogi, V. Polymer Additives. Phys. Sci. Rev. 2017, 2, 20160130. [Google Scholar]
- Bailey, F.E., Jr.; Koleske, J.V. Poly(Ethylene) Oxide. Academic Press: New York, NY, USA, 1976. [Google Scholar]
- Wijmans, J.G.; Baker, R.W. The solution-diffusion model: A review. J. Membr. Sci. 1995, 518, 1–21. [Google Scholar] [CrossRef]
- Sharma, J.; Tewari, K.; Arya, R.K. Diffusion in polymers—A review on the free volume theory. Prog. Org. Coat. 2017, 111, 83–92. [Google Scholar] [CrossRef]
- Matteucci, S.; Yampolskii, Y.; Freeman, B.D.; Pinnau, I. Transport of gases and vapors in glassy and rubbery polymers. In Materials Science of Membranes for Gas and Vapor Separation; Yampolskii, Y., Pinnau, I., Freeman, B.D., Eds.; John Wiley & Sons Ltd: Hoboken, NJ, USA, 2006; ISBN 978-0-470-85345-0. [Google Scholar]
- Redhead, P.A.; Hobson, J.P.; Kornelsen, E.V. The Physical Basis of Ultrahigh Vacuum; American Institute of Physics: New York, NY, USA, 1992. [Google Scholar]
- Cecopieri-Gomez, M.L.; Palacios-Alquisira, J.; Dominguez, J. On the limits of gas separation in CO2/CH4, N2/CH4 and CO2/N2 binary mixtures using polyimide membranes. J. Membr. Sci. 2007, 293, 53–65. [Google Scholar] [CrossRef]
- Robeson, L.M. The upper bound revisited. J. Membr. Sci. 2008, 320, 390–400. [Google Scholar] [CrossRef]
- Freeman, B.D. Basis of permeability/selectivity tradeoff relations in polymeric gas. Macromolecules 1999, 32, 375–380. [Google Scholar] [CrossRef]
- Ullmann, F. Polyoxyalkylenes. In Ullmann’s Encyclopedia of Industrial Chemistry; Wiley-VCH: Weinheim, Germany, 2000. [Google Scholar] [CrossRef]
- Liu, S.L.; Shao, L.; Chua, M.L.; Lau, C.H.; Wang, H.; Quan, S. Recent progresses in the design of advanced PEO-containing membranes for CO2 removal. Prog. Polym. Sci. 2013, 38, 1089–1120. [Google Scholar] [CrossRef]
- Ajitha, A.R.; Sabu, T. (Eds.) Compatibilization of Polymer Blends: Micro and Nanoscale Phase Morphologies, Interphase Characterization and Properties. Elsevier: Amsterdam, The Netherlands, 2020. [Google Scholar]
- Koningsveld, R. Thermodynamic of polymer blends. Macromol. Symp. 1994, 78, 1–13. [Google Scholar] [CrossRef]
- Einaga, Y. Thermodynamics of polymer solutions and mixtures. Prog. Polym. Sci. 1994, 19, 1–28. [Google Scholar] [CrossRef]
- Manis, E.; UtracKi, L.A. Thermodynamics of Polymer Blends. In Polymer Blends Handbook; Utracki, L.A., Wilkie, C.A., Eds.; Springer: Dordrecht, The Netherlands, 2014; pp. 171–289. [Google Scholar]
- Yang, R. Analytical Methods for Polymer Characterization; CRC Press: Boca Raton, FL, USA, 2020. [Google Scholar]
- Su, W.F. (Ed.) Characterization of Polymers. In Principles of Polymer Design and Synthesis; Springer: Berlin, Germany, 2013; pp. 89–110. [Google Scholar]
- Raja, P.M.V.; Barron, A.R. SEM and its Applications for Polymers Science. In Physical Methods in Chemistry and Nano Science; Barron, A.R., Ed.; LibreTexts: Davis, CA, USA, 2012; Available online: https://chem.libretexts.org/Bookshelves/Analytical_Chemistry/Physical_Methods_in_Chemistry_and_Nano_Science_(Barron)/09:_Surface_Morphology_and_Structure/9.03:_SEM_and_its_Applications_for_Polymer_Science (accessed on 13 March 2025).
- Drzezdzon, J.; Jacewicz, D.; Sielika, A.; Chmurzynsi, L. Characterization of polymers based on differential scanning calorimetry-based techniques. TrAC Trends Anal. Chem. 2019, 110, 51–56. [Google Scholar] [CrossRef]
- He, Y.; Zhu, B.; Inoue, Y. Hydrogen bonds in polymer blends. Prog. Polym. Sci. 2004, 29, 1021–1051. [Google Scholar] [CrossRef]
- Sharma, J. Characterization of polymer blends by X-ray scattering: SAXS and WAXS. In Characterization of Polymer Blends; Thomas, S., Grohens, Y., Jyotishkumar, P., Eds.; Wiley-VCH: Weinheim, Germany, 2015. [Google Scholar]
- Hacarlioglu, P.; Toppare, L.; Yilmaz, L. Effect of preparation parameters on performance of dense homogeneous polycarbonate membrane. J. Appl. Polym. Sci. 2003, 90, 776–785. [Google Scholar] [CrossRef]
- Hamrahi, Z.; Kargari, A. Modification of polycarbonate membrane by polyethylene glycol for CO2/CH4 separation. Sep. Sci. Technol. 2017, 52, 544–556. [Google Scholar] [CrossRef]
- Bashir, Z.; Lock, S.S.M.; Hira, N.E.; Ilyas, S.U.; Lim, L.G.; Lock, I.S.M.; Yiin, C.L.; Darban, M.A. A review on recent advances of cellulose acetate membranes for gas separation. RCS Adv. 2024, 14, 19560–19580. [Google Scholar] [CrossRef]
- Li, J.; Wang, S.; Nagai, K.; Nakagawa, T.; Mau, A.W.-H. Effect of polyethyleneglycol (PEG) on gas permeabilities and perm-selectivities in its cellulose acetate (CA) blend membranes. J. Membr. Sci. 1998, 138, 134–152. [Google Scholar] [CrossRef]
- Checchetto, R.; Scarpa, M.; De Angelis, M.G.; Minelli, M. Mixed gas diffusion and permeation of ternary and quaternary CO2/CO/N2/O2 gas mixtures in Matrimid®, polyetherimide and poly(lactic) acid membranes for CO2/CO separation. J. Membr. Sci. 2022, 659, 120768. [Google Scholar] [CrossRef]
- Castro-Munoz, R.; Fila, V.; Ahmad, M.Z. Enhancing the CO2 separation performances of Matrimid 5218 membranes for CO2/CH4 binary mixture separation. Chem. Eng. Technol. 2019, 42, 645–654. [Google Scholar] [CrossRef]
- Loloei, M.; Moghadassi, A.; Omidkhan, M.; Amooghin, A. Improved CO2 separation performance of Matrimid®5218 membrane by addition of low molecular weight polyethylene glycol, Geenhouse Gases. Sci. Technol. 2015, 5, 530–544. [Google Scholar]
- Yousef, S.; Sereika, J.; Tonkonogovas, A.; Hashem, T.; Mohamed, A. CO2/CH4, CO2/N2 and CO2/H2 selectivity performances of PES membranes under high pressure and temperature for biogas upgrading systems. Environ. Technol. Innov. 2021, 21, 101339. [Google Scholar] [CrossRef]
- Nasirian, D.; Salahshoori, I.; Sadeghi, M.; Rahshidi, N.; Hassanzadeganroudsari, M. Investigation of the gas permeability properties from polysulfone/polyethylene glycol composite membranes. Polym. Bull. 2020, 77, 5529–5552. [Google Scholar] [CrossRef]
- McKeown, N.B. Polymer of intrinsic microporosity. Polymer 2020, 202, 122736. [Google Scholar] [CrossRef]
- He, S.S.; Zhu, B.; Li, S.W.; Zhang, Y.Q.; Jiang, X.; Cher, H.L.; Lu, S. Recent progress in PIM-1 based membranes for sustainable CO2 separations: Polymer structure manipulation and mixed matrix membrane design. Sep. Purif. Technol. 2022, 284, 120277. [Google Scholar] [CrossRef]
- Budd, P.M.; Msayib, K.J.; Tattershall, C.E.; Ghanem, B.S.; Reynolds, K.J.; McKeown, N.B.; Fritsch, D. Gas separation membranes from polymers of intrinsic microporosity. J. Membr. Sci. 2005, 251, 263–269. [Google Scholar] [CrossRef]
- Wu, X.M.; Zhang, Q.G.; Lin, P.J.; Qu, Y.; Zhu, A.M.; Liu, Q.L. Towards enhanced CO2 selectivity of the PIM-1 membrane by blending with polyethylene glycol. J. Membr. Sci. 2015, 493, 147–155. [Google Scholar]
- Gonzalez, T.; Castro-Munoz, R.; Vera, M.; Merlet, G.; Pino-Soto, L.; Cabezas, R. Polyether-block-amide PEBA membranes for gas separation and pervaporation: Current design and applications. J. Ind. Chem. Eng. 2024, 135, 67–86. [Google Scholar] [CrossRef]
- Embaye, A.S.; Martinez-Izquierdo, L.; Malankowska, M.; Tellez, C.; Coronas, J. Poly(ether-block-amide) copolymer membranes in CO2 separation applications. Energy Fuels 2021, 35, 17085–17102. [Google Scholar] [CrossRef]
- Car, A.; Stropnik, C.; Yave, W.; Peinemann, K.V. PEG modified poly(amide-b-ehylene oxide) membranes for CO2 separation. J. Membr. Sci. 2008, 307, 88–95. [Google Scholar] [CrossRef]
- Azizi, N.; Mahdavi, H.R.; Isanejad, M.; Mohammadi, T. Effects of low and high molecular mass PEG incorporation into different types of poly(ther-b-amide) copolymers on the permeation properties of CO2 and CH4. J. Polym. Res. 2017, 24, 141. [Google Scholar] [CrossRef]
- Taheri, P.; Raisi, A.; Maleh, M.S. CO2-selective poly(ether-block-amine)/polyethylene glycol composite blend membrane for CO2 separation from gas mixtures. Environ. Sci. Pollut. Res. 2021, 28, 38274–38291. [Google Scholar] [CrossRef] [PubMed]
- Niu, Z.; He, N.; Yao, Y.; Ma, A.; Zhang, E.; Cheng, L.; Li, Y.; Lu, X. Mixed matrix membranes for gas separation: A review. Chem. Eng. J. 2024, 494, 152912. [Google Scholar] [CrossRef]
- Kamble, A.R.; Patel, C.M.; Murphy, Z.V.P. A review on the recent advances in mixed matrix membranes for gas separation processes. Renew. Sust. Energy Rev. 2021, 145, 111062. [Google Scholar] [CrossRef]
- Powell, C.E.; Qiao, G.G. Polymeric CO2/N2 gas separation membranes for the capture of carbon dioxide from power plant flue gases. J. Membr. Sci. 2006, 279, 1–49. [Google Scholar] [CrossRef]
- Moghadassi, A.R.; Rajabi, Z.; Hosseini, S.M.; Mohammadi, M. Preparation and characterizzation of polycarbonate-blend-raw/functionalized multi-walled carbon nano tubes mixed matrix membranes for CO2 separation. Sep. Sci. Technol. 2013, 48, 1261–1271. [Google Scholar] [CrossRef]
- Kausar, A. Investigation on nanocomposite membrane of multiwalled carbon nanotube reinforced polycarbonate blend for gas separation. J. Nanomat. 2016, 2016, 7089530. [Google Scholar] [CrossRef]
- Hussain, E.A.; Farrukh, S.; Hussain, A.; Ayoub, M. Carbon capture from natural gas using multi-walled CNTs based mixed matrix membranes. Environ. Technol. 2017, 40, 843–854. [Google Scholar] [CrossRef]
- Moghadassi, A.R.; Rajabi, Z.; Hosseini, S.M.; Mohammadi, M. Fabrication and modification of cellulose acetate based mixed matrix membranes: Gas separation and physical properties. J. Ind. Eng. Chem. 2014, 20, 1050–1060. [Google Scholar] [CrossRef]
- Castro-Munoz, B.R.; Fila, V.; Martin-Gil, V.; Muller, C. Enhanced CO2 permeability in Matrimid®5218 mixed matrix membranes for separation of CO2/CH4 mixtures. Sep. Purif. Technol. 2019, 210, 553–562. [Google Scholar] [CrossRef]
- Loloei, M.; Omidkhan, M.; Moghadassi, A.; Amooghin, A.E. Preparation and characterization of Matrimid® 5218 based binary and ternary mixed matrix membranes for CO2 separation. Int. J. Greenh. Control 2015, 39, 225–235. [Google Scholar] [CrossRef]
- Raouf, M.; Abedini, R.; Omidkhan, M.; Nezhadmoghadan, E. A favored CO2 separation over light gases with mixed matrix membranes comprising polysulfone/polyethylene glycol and graphene hydroxide nanoparticles. Proc. Saf. Environ. Prot. 2020, 133, 349–407. [Google Scholar] [CrossRef]
- Salahshoori, I.; Nasarian, D.; Rashidi, N.; Hossain, M.K.; Hatami, A.; Hassanzadeganroudsari, M. The effect of silica nanoparticles on polysulfone-polyethylene glycol (PES/PEG) composite membrane on the gas separation and rheologiocal properties of nanocompopsites. Polym. Bull. 2021, 78, 3227–3258. [Google Scholar] [CrossRef]
- Singh, S.; Verghese, A.M.; Reddy, K.S.K.; Romanos, G.E.; Karanikolos, G.N. Polysulfone mixed matrix membranes comprising poly(ethylene glycol)—Grafted carbon nanotubes: Mechanical properties and CO2 separation performances. Ind. Eng. Chem. Res. 2021, 60, 11289–11308. [Google Scholar] [CrossRef]
- Ma, Y.; He, X.; Xu, S.; Yu, Y.; Zhang, C.; Meng, J.; Zeng, L.; Tang, K. Enhanced 2-D MOF nanosheets PES-g-PEG mixed matrix membranes for efficient CO2 separation. Chem. Eng. Res. Des. 2022, 180, 79–89. [Google Scholar] [CrossRef]
- Khan, H.R.; Jahan, Z.; Niazi, M.B.K.; Noor, T.; Hou, H.; Rafiq, S. High-selective separation performances of CO2 from CH4 by interfacial engineering of ultra-low-dose bimetallic pyrazine-MOF based mixed matrix membranes. Carbon Capt. Sci. Technol. 2022, 3, 100048. [Google Scholar] [CrossRef]
- Khan, M.M.; Filiz, V.; Bengtson, G.; Shishatskiy, S.; Rahman, M.M.; Lillepaerg, J.; Abetz, V. Enhanced gas permeability by fabricating mixed matrix membranes of functionalized multiwalled carbon nanotubes and polymer of intrinsic microporosity (PIM). J. Membr. Sci. 2013, 436, 109–120. [Google Scholar] [CrossRef]
- Wang, S.F.; Liu, Y.; Huang, S.X.; Wu, H.; Li, Y.F.; Tian, Z.Z.; Jiang, Z.Y. Pebax–PEG–MWCNT hybrid membranes with enhanced CO2 capture properties. J. Membr. Sci. 2014, 460, 62–70. [Google Scholar] [CrossRef]
- Eljaddi, T.; Bouillon, J.; Roizard, D.; Lebrun, L. Pebax-Based Composite Membranes with High Transport Properties Enhanced by ZIF-8 for CO2 Separation. Membranes 2022, 12, 836. [Google Scholar] [CrossRef]
- Azizi, N.; Mohammadi, T.; Behbahbani, R.M. Synthesis of a new nanocomposite membrane (PEBAX-1074/PEG-400/TiO2) to separate CO2 from CH4. J. Nat. Gas Sci. Technol. 2017, 37, 39–51. [Google Scholar] [CrossRef]
- Azizi, N.; Jahanmahin, O.; Homayoon, R.; Khajouei, M. A new ternary membrane (PEBAX/PEG/MgO) to enhance CO2/CH4 and CO2/N2 separation efficiency, Korean. J. Chem. Eng. 2023, 40, 1457–1473. [Google Scholar]
- Yu, Z.; Guo, Z.H.; Yu, L. Xiao Feng and Bo Wang, Poliyethylene glycol-mediated high performance mixed matrix membranes via nesting effect for CO2 separation. ACS Appl. Polym. Mater. 2024, 6, 5443–5451. [Google Scholar] [CrossRef]
- Shin, J.E.; Lee, S.K.; Cho, Y.H.; Park, H.B. Effect of PEG-MEA and graphene oxide additives on the performances of Pebax®1657 mixed matrix membranes for CO2 separation. J. Membr. Sci. 2019, 572, 300–308. [Google Scholar] [CrossRef]
- Zhang, B.; Yang, C.; Zheng, Y.; Wu, Y.; Song, C.; Liu, Q.; Wang, Z. Modification of CO2-selective mixed matrix membranes by a binary composition of poly(ethylene) glycol/NaY zeolite. J. Membr. Sci. 2021, 627, 119239. [Google Scholar] [CrossRef]
- He, R.; Cong, S.; Xu, S.; Han, S.; Guo, H.; Liang, Z.; Wang, J.; Zhang, Y. CO2-philic mixed matrix membranes based on low molecular weight polyethylene glycol and porous organic polymers. J. Membr. Sci. 2021, 624, 119081. [Google Scholar] [CrossRef]
- Zhang, P.; Sun, H.; Sum, Q.; Deng, Y.; Zhang, Y.; Li, R.; Feng, G.; Wang, R.; Lian, A.; Wang, Y.; et al. Preparation of Pebax ternary mixed matrix membranes for enhancing CO2 separation. Sep. Purif. Technol. 2025, 355, 129607. [Google Scholar] [CrossRef]
- Wu, P.-C.; Wang, H.-Y.; Kang, D.-Y.; Tung, K.-L. Green delamination of 2D LDH nanosheets incorporated in mixed matrix membranes for CO2 capture. J. Membr. Sci. 2024, 702, 122797. [Google Scholar] [CrossRef]
- Wang, C.; Wu, J.; Wang, Y.; Cheng, P.; Sun, S.; Wang, T.; Lei, Z.; Niu, X.; Xu, L. CO2-philic nanocomposite polymer matrix incorporated with MXene nanosheets for ultraefficient CO2 capture. ACS Appl. Mater. Interfaces 2024, 16, 14152–14161. [Google Scholar] [CrossRef]
- Dai, Z.D.; Deng, J.; Peng, K.-J.; Liu, Y.-L.; Deng, L. Pebax/PEG grafted CNT hybrid membranes for enhanced CO2/N2 separation. Ind. Eng. Chem. Res. 2019, 58, 12226–12234. [Google Scholar] [CrossRef]
- Liu, Y.; Wu, H.; Wu, S.; Song, S.; Guo, Z.; Ren, Y.; Zhao, R.; Yang, L.; Wu, Y.; Jiang, Z. Multifunctional covalent organic frameworks (COF)-based mixed matrix membranes for enhanced CO2 separation. J. Membr. Sci. 2021, 618, 118693. [Google Scholar] [CrossRef]
- Li, X.; Cheng, Y.; Zhang, H.; Wang, S.; Jiang, Z.; Guo, R.; Wu, H. Efficient CO2 capture by functionalized graphene oxide nanosheets as filler to fabricate multi-permselective mixed matrix membranes. ACS Appl. Mater. Interfaces 2015, 7, 5528–5537. [Google Scholar] [CrossRef] [PubMed]
- Vatanpour, V.; Teber, O.O.; Meharabi, M.; Koyuncu, I. Polyvinyl alcohol-based separation membranes: A comprehensive review on fabrication techniques, applications and future prospective. Mater. Today Chem. 2023, 28, 101381. [Google Scholar] [CrossRef]
- Dilshad, M.R.; Islam, A.; Sabir, A.; Shafiq, M.; Butt, M.T.Z.; Ijaz, A.; Jamil, T. Fabrication and performance characterization of novel zinc oxide filled cross-linked PVA/PEG 600 blended membranes for CO2/N2 separation. J. Ind. Eng. Chem. 2017, 55, 65–73. [Google Scholar] [CrossRef]
- Dilshad, M.R.; Islam, A.; Haider, B.; Sabir, A.; Ijaz, A.; Khan, R.U.; Durrani, A.K. Novel PVA/PEG nano-composite membranes tethered with surface engineered multi-walled carbon nanotubes for carbon dioxide separation. Microporous Mesoporous Mat. 2020, 308, 110545. [Google Scholar] [CrossRef]
- Dilshad, M.R.; Islam, A.; Hamidullah, U.; Jamshaid, F.; Ahmad, A.; Butt, M.T.Z.; Ijaz, A. Effect of alumina on the performance and characterization of cross-linked PVA/PEG 600 blend membranes for CO2/N2 separation. Sep. Purif. Technol. 2019, 210, 627–635. [Google Scholar] [CrossRef]
- Dilshad, M.R.; Islam, A.; Haider, B.; Sajid, M.; Ijaz, A.; Khan, R.U.; Khan, W.G. Effect of silica nanoparticles on carbon dioxide separation performances of PVA/PEG cross-linked membranes. Chem. Pap. 2021, 75, 3131–3153. [Google Scholar] [CrossRef]
- Barooh, M.; Mandal, B. Enhanced CO2 separation performances by PVA/PEG/silica mixed matrix membranes. J. Appl. Polym. Sci. 2018, 135, 46481. [Google Scholar] [CrossRef]
- Xing, R.; Winston Ho, W.S. Synthesis and characterization of crosslinked polyvinylalcohol/polyethyleneglycol blend membranes for CO2/CH4 separation. J. Taiwan Inst. Chem. Eng. 2009, 40, 654–662. [Google Scholar] [CrossRef]
- Li, R.; Yang, Y.; Zhang, Z.; Lian, S.; Zhao, Q.; Song, C. PEO-based mixed matrix membranes containing N-doped microporous carbon microparticles for enhanced CO2/N2 separation. J. Membr. Sci. 2023, 685, 121983. [Google Scholar] [CrossRef]
- Zheng, G.; Wu, J.; Jia, Y.; Han, G.; Zhang, S. Dual-enhanced solubility and diffusivity via MOF-regulated impregnation of small molecules in crosslinked polymers for CO2/N2 and CO2/H2 separation. J. Membr. Sci. 2024, 705, 122924. [Google Scholar] [CrossRef]
- Luo, W.; Niu, Z.; Mu, P.; Li, J. M Xene/poly(ethylene glycol) mixed matrix membranes with excellent permeance for highly efficient separation of CO2/N2 and CO2/CH4. Coll. Surf. A Physicochem. Eng. Asp. 2022, 640, 128481. [Google Scholar] [CrossRef]
- Checchetto, R.; Facchinelli, T.; Cantalini, G.; Scarpa, M. Tunable gas selectivity of cellulose nanocrystals-polyethylene glycol composite membranes. Int. J. Hydrogen Energy 2024, 57, 688–695. [Google Scholar] [CrossRef]
- Park, H.B.; Han, S.H.; Jung, C.H.; Lee, Y.M.; Hill, A.J. Thermally rearranged (TR) polymer membranes for CO2 separation. J. Membr. Sci. 2010, 359, 11–24. [Google Scholar] [CrossRef]
- Guo, L.; Liu, W.; Yang, Y.; Ali, A.; Lau, C.H.; Bermeshev, M.V.; Shao, L. Recent progresses in thermally rearranged (TR) polymer-based membranes for sustainable gas separation. Sep. Purif. Technol. 2025, 355(Part A), 129690. [Google Scholar] [CrossRef]
- Bandehali, S.; Amooghin, A.E.; Sanaeepur, H.; Ahmadi, R.; Fuoco, A.; Jansen, J.C.; Shirazian, S. Polymer of intrinsic microporosity and thermally rearranged polymer membranes for highly efficient gas separation. Sep. Purif. Technol. 2021, 278, 119513. [Google Scholar] [CrossRef]
- Lee, W.H.; Seong, J.G.; Hu, X.; Lee, Y.M. Recent progresses in microporous polymers from thermally rearranged polymers and polymers of intrinsic microporosity for membrane gas separation: Pushing performances limits and revisiting trade-off lines. J. Polym. Sci. 2020, 58, 2450–2466. [Google Scholar] [CrossRef]
- Budd, P.M.; McKeown, N.B.; Fritsch, D. Free volume and intrinsic microporosity in polymers. J. Mater. Chem. 2005, 15, 1977–1986. [Google Scholar] [CrossRef]
- Li, P.; Chung, T.S.; Paul, D.R. Gas sorption and permeation in PIM-1. J. Membr. Sci. 2013, 432, 50–57. [Google Scholar] [CrossRef]
- Thomas, S.; Du, I.P.N.; Guiver, M.D. Pure and mixed-gas permeation properties of a microporous spirobisindane-based ladder polymer (PIM-1). J. Membr. Sci. 2009, 333, 125–131. [Google Scholar] [CrossRef]
- Qiu, B.; Gao, Y.; Gorgojo, P.; Fan, X. Membranes of polymer of intrinsic microporosity PIM-1 for gas separation: Modification strategies and meta-analysis. Nano-Micro Lett. 2025, 17, 114. [Google Scholar] [CrossRef] [PubMed]
- Wang, Y.; Ma, X.; Ghanem, B.S.; Alghunaimi, F.; Pinnau, I.; Han, Y. Polymers of intrinsic microporosity for energy-intensive membrane-based gas separations. Mater. Today Nano 2018, 3, 69–95. [Google Scholar] [CrossRef]
- Feng, X.; Zhu, J.; Jin, J.; Wang, Y.; Zhang, Y.; Van der Brugger, B. Polymers of intrinsic microporosity for membrane-based precise separations. Prog. Mater. Sci. 2024, 144, 101285. [Google Scholar] [CrossRef]
- Lau, H.S.; Eugenia, A.; Weng, Y.; Yong, W.F. Recent advances in polymers of intrinsic microporosity (PIMs) membranes: Delving into the intrinsic microstructure for carbon capture and arduous industrial applications. Prog. Mater. Sci. 2024, 145, 101297. [Google Scholar] [CrossRef]
- Zhang, M.; Semiat, R.; He, X. Recent advances in poly(ionic liquids) membranes for CO2 separation. Sep. Purif. Technol. 2022, 299, 121784. [Google Scholar] [CrossRef]
- Wang, Y.; Wang, J.X.; Sun, L.; Ma, X. Progress in polymers of intrinsic microporosity for post-combustion carbon capture. Sep. Purif. Technol. 2025, 363, 132003. [Google Scholar] [CrossRef]
- Wang, J.; Luo, J.; Feng, S.; Li, H.; Wan, Y.; Zhang, X. Recent development of ionic liquid membranes. Green Energy Environ. 2016, 1, 43–61. [Google Scholar] [CrossRef]
- Friess, K.; Izak, P.; Karaszova, M.; Pasichnyk, M.; Lanc, M.; Nikolaeva, D.; Luis, P.; Jansen, J.C. A review of ionic liquid gas separation membranes. Membranes 2021, 11, 97. [Google Scholar] [CrossRef]
- Martizez-Palou, R.; Likhanova, N.V.; Olivares-Xometl, O. Supported ionic liquid membranes for separation of gases and liquids: An overview. Pet. Chem. 2015, 54, 595–607. [Google Scholar] [CrossRef]
- Santos, E.; Albo, J.; Irabien, A. Acetate based Supported Ionic Liquid Membranes (SILMs) for CO2 separation: Influence of the temperature. J. Membr. Sci. 2014, 452, 277–283. [Google Scholar] [CrossRef]
- Zhang, X.; Xiong, W.; Tu, Z.; Peng, L.; Wu, Y.; Hu, X. Supported Ionic Liquid Membranes with Dual-Site Interaction Mechanism for Efficient Separation of CO2, ACS Sustain. Chem. Eng. 2019, 7, 10792–10799. [Google Scholar]
- Cichowska-Kopczynska, I.; Joskowska, M.; Debski, B.; Łuczak, J.; Aranowski, R. Influence of Ionic Liquid Structure on Supported Ionic Liquid Membranes Effectiveness in Carbon Dioxide/Methane Separation. J. Chem. 2013, 1, 980689. [Google Scholar] [CrossRef]
- Tomé, L.C.; Patinha, D.J.S.; Ferreira, R.; Garcia, H.; Pereira, C.S.; Freire, C.S.R.; Rebelo, L.P.N.; Marrucho, I.M. Cholinium-based Supported Ionic Liquid Membranes: A Sustainable Route for Carbon Dioxide Separation. ChemSusChem 2014, 7, 110–113. [Google Scholar] [CrossRef] [PubMed]
- Mulk, W.U.; Ali, S.A.; Shah, S.N.; Hassan Shah, M.U.; Zhang, Q.-J.; Younas, M.; Fatehizadeh, A.; Sheikh, M.; Rezakazemi, M. Breaking boundaries in CO2 capture: Ionic liquid-based membrane separation for post-combustion applications. J. CO2 Util. 2023, 75, 102555. [Google Scholar] [CrossRef]
- Tayyab, M.; Zizhe, L.; Rauf, S.; Xu, Z.; Sagar, R.U.R.; Faiz, F.; Tayyab, Z.; Rehman, R.U.; Imran, M.; Waheed, A.; et al. Advanced fabrication techniques for polymer-metal nanocomposites films: State-of-the-art innovations in energy and electronic application. Chem. Sci. 2025, 16, 3362–3407. [Google Scholar] [CrossRef]
- Islam, A.; Mobarak, H.; Rimon, I.H.; Al Mahmud, Z.; Ghosh, J.; Ahmed, M.S.; Hossain, N. Additive manufacturing in polymer research: Advances, synthesis and applications. Polym. Test. 2024, 132, 108364. [Google Scholar] [CrossRef]
- Fredi, G.; Dorigato, A. Compatibilization of biopolymer blends: A review. Ind. Eng. Polym. Res. 2024, 7, 373–404. [Google Scholar] [CrossRef]
- Nemestóthy, N.; Bakonyi, P.; Szentgyörgyi, E.; Kumar, G.; Nguyen, D.D.; Chang, S.W.; Kim, S.-H.; Bélafi-Bakó, K. Evaluation of a membrane permeation system for biogas upgrading using model and real gaseous mixtures: The effect of operating conditions on separation behaviour, methane recovery. J. Clean. Prod. 2018, 185, 44–51. [Google Scholar] [CrossRef]
- Rowe, B.W.; Freeman, B.D.; Paul, D.R. Physical aging of ultrathin glassy polymer films tracked by gas permeability. Polymer 2009, 50, 5565–5575. [Google Scholar] [CrossRef]
- Murphy, T.M.; Langhe, D.S.; Ponting, M.; Baer, E.; Freeman, B.D.; Paul, D.R. Physical aging of layered glassy polymer films via gas permeability tracking. Polymer 2011, 52, 6117–6125. [Google Scholar] [CrossRef]
- Wessling, M.; Schoeman, S.; van der Boomgaard, T.; Smolders, C.A. Plasticization of gas separation membranes. Gas Sep. Purif. 1991, 5, 222–228. [Google Scholar] [CrossRef]
- Horn, N.R.; Paul, D.R. Carbon dioxide plasticization and conditioning effects in thick vs. thin glassy polymer films. Polymer 2011, 52, 1619–1627. [Google Scholar] [CrossRef]
- Bos, A.; Pünt, I.G.M.; Wessling, M.; Strathmann, H. CO2-induced plasticization phenomena in glassy polymers. J. Membr. Sci. 1999, 155, 67–78. [Google Scholar] [CrossRef]
- Baker, R.W.; Low, B.T. Gas separation membranes: A perspective. Macromolecules 2014, 47, 6999. [Google Scholar] [CrossRef]
- Favre, E. Carbon dioxide recovery from post-combustion processes: Can gas permeation membranes compete with absorption? J. Membr. Sci. 2007, 294, 50–59. [Google Scholar] [CrossRef]
- Merkel, T.C.; Lin, H.Q.; Wei, X.T.; Baker, R. Power plant post-combustion carbon dioxide capture: An opportunity for membranes. J. Membr. Sci. 2010, 359, 126–139. [Google Scholar] [CrossRef]
Disclaimer/Publisher’s Note: The statements, opinions and data contained in all publications are solely those of the individual author(s) and contributor(s) and not of MDPI and/or the editor(s). MDPI and/or the editor(s) disclaim responsibility for any injury to people or property resulting from any ideas, methods, instructions or products referred to in the content. |
© 2025 by the author. Licensee MDPI, Basel, Switzerland. This article is an open access article distributed under the terms and conditions of the Creative Commons Attribution (CC BY) license (https://creativecommons.org/licenses/by/4.0/).