Abstract
Thiocyanates are effective in inhibiting the growth of microorganisms in raw milk to extend shelf life, but excessive addition can cause human health problems. Currently, ion chromatography and spectrophotometry are the main methods used in industry to determine SCN, but the pre-treatment process is cumbersome and time-consuming and has low sensitivity. Aqueous two-phase flotation (ATPF) technology has the advantages of simplicity, rapidity and economy. In this study, an acetonitrile/ammonium sulfate ATPF–gold nanoparticle (AuNP) colorimetric method was developed for the determination of SCN− in raw milk, and ATPF was used to separate and concentrate SCN− in raw milk to improve the detection sensitivity under convenient and economical conditions. The separation conditions were optimized by single-factor experiments and RSM, while the detection conditions, effects of CTAB concentration, pH and reaction time, were investigated. The “aggregation–anti-aggregation” mechanism of the gold-nano colorimetric method for the determination of SCN− was investigated by UV-vis absorption spectroscopy (UV-vis) and transmission electron microscopy (TEM). Under the optimal separation and detection conditions, the SCN− concentration showed a linear relationship with A630/A520 values in the concentration range of 0–2.5 mg/L with R2 of 0.9933, limit of detection (LOD) of 0.0919 mg/L, limit of quantitation (LOQ) of 0.306 mg/L, intra-day precision of 5.3% and spiked recoveries of 80.91–101.25%. In addition, the ATPF-AuNP colorimetric method demonstrated high selectivity and stability.
1. Introduction
Raw milk is an essential source of nutrition for the human body, highly nutritious and easily digested and absorbed. Therefore, it is important to strictly control its quality and safety. The lactoperoxidase system (LPS) is a natural enzymatic antibacterial system in raw milk that promotes the oxidation of SCN− and halides by H2O2 to produce antibacterial compounds such as hypothiocyanate ions (OSCN−) [1]. Therefore, the appropriate addition of hydrogen peroxide and thiocyanate ions (SCN−) to raw milk to artificially produce active LPS was allowed by some regulations which could temporarily inhibit the growth of pathogenic microorganisms. However, as a toxic substance, the excessive addition of SCN− could be harmful to human health by releasing cyanide ions (CN−) into the body. The binding of CN− and Fe3+ in the cytochrome oxidase enzyme could inhibit the activity of the enzyme and cause hypoxia in human tissues, even significantly damaging kidney function [2]. Research by Sun et al. showed that the level of SCN− in raw milk must be strictly controlled in industrial production [3]. Therefore, the determination of SCN− in raw milk is of great importance for food safety and public health.
Due to their unique chemical, optical, electronic, magnetic and catalytic properties, metal nanoparticles are ideal for the generation and transmission of signals for the detection component of various analyses [4]. As a common photoactive metal nanomaterial, gold nanoparticles (AuNPs) are widely used in various analytical systems due to their high stability, great biocompatibility and surface chemistry [5]. In optical methods, spherical AuNPs of 1–100 nm showed different colors, such as brown, orange, red and violet, in aqueous solution. Furthermore, they showed the absorption peak relative to particle size in the visible spectrum at 500–550 nm, which was caused by the collective oscillations of the conducting electrons. This phenomenon was not only related to the size of the nanoparticles; it was also influenced by the shape, solvent, surface ligands, nuclear charge, etc. [6]. Depending on the color change in the presence of AuNPs, the formation or aggregation state of AuNPs can also be monitored by UV–visible spectroscopy. The aggregation of nanoparticles results in a significant red shift of the SPR frequency and broadening the surface plasma excitonic band, which changes the color of the solution from red to blue [7]. A number of colorimetric sensing methods based on the aggregation of AuNPs had been established for the detection of DNA, proteins, cells and ions [8,9,10,11]. In recent years, the colorimetric method using AuNPs as sensors for the determination of SCN− was developed. Zhao et al. proposed a novel, highly sensitive and selective dual-reading sensor (colorimetric and fluorometric) for the detection of t SCN− based on fluorescent carbon dots (CDs) and unmodified AuNPs [12]. The amino-functionalized CDs tended to adsorb on the surface of citrate-coated AuNPs through Au-N interaction, resulting in the aggregation and discoloration of AuNPs. A630/A520 showed a good linear relationship with the SCN− concentration in the range of 0.2–2 µM, with an R2 of 0.991 and an estimated detection limit of 0.14 µM. Meanwhile, Deng et al. developed a colorimetric sensor based on the anti-aggregation effect of SCN− on citrate-encapsulated AuNPs for the detection of SCN− in aqueous samples in the environment [4]. The relationship between the SCN− concentration and A700/A520 was linearly correlated in the range of 0.25–2 μM, with an R2 of 0.999, a detection limit of 140 nM and an RSD of 2.3%.
Aqueous two-phase flotation (ATPF) is a special type of liquid–liquid extraction that combines the principles of Aqueous Two-Phase System (ATPS) and Solvent Sublation (SS) [13]. SS is a separation method where the target substance is transported from the bottom phase to the top phase by rising bubbles, which absorb the substance on the surface [14]. ATPF has three main types: hydrophilic organic solvent/salt ATPF, polymer/salt ATPF and ionic liquid/salt ATPF [15,16,17]. As a system composed mainly of water, it is able to maintain the natural structure of purified biomolecules. In addition, ATPF can be classified as a bubble adsorption/separation technique, where the target substance is selectively adsorbed on the bubble surface during flotation and enters the top phase with the bubble to achieve the separation, enrichment and purification of the target substance [18]. Compared with ATPE, ATPF not only retains the advantages of traditional liquid–liquid extraction, such as high productivity, simple operation, short processing time and mild conditions, but also has a higher concentration factor. In recent years, ATPF had been widely used for the downstream processing of biological compounds such as enzymes, biopharmaceuticals and other biological products [19,20,21].
The ATPF technique has the advantages of being efficient, rapid, simple and inexpensive, which could eliminate the interference of other coexisting substances on the detection and improve the detection sensitivity. In this work, ATPF was applied for the first time to the separation and enrichment of SCN− in raw milk. Meanwhile, it was combined with spectroscopic techniques to construct a new method for the determination of SCN−. This study provided a new idea for the establishment of standards for the detection of SCN− in raw milk and laid the foundation for the future development of a dedicated small-scale rapid detector and a new ATPF technique for the field of anionic pre-treatment.
2. Materials and Methods
2.1. Materials
Milk samples were purchased from local supermarkets. Cetyltrimethylammonium bromide (CTAB), ammonium sulfate((NH4)2SO4), acetonitrile, sodium citrate and sodium thiocyanate were purchased from Aladdin, Shanghai. Tetrachloroauric acid trihydrate (99%), disodium hydrogen phosphate and sodium dihydrogen phosphate were purchased from Sigma (St. Louis, MO, USA). Hydrochloric acid and nitric acid were purchased from Fuchen Chemical Reagent Factory, Tianjin, China. Nitrogen (99.999%) was purchased from Qinghua Industrial Gas Co., Ltd, Harbin, China. Except for acetonitrile, which was chromatographically pure, all other reagents were of analytical grade.
2.2. Equipment
The pH of the solution was measured using a PHS-3C pH meter (Shanghai Instrument Electric Scientific Instrument Co., Ltd, Shanghai, China). A CT14D high-speed centrifuge (Shanghai Techcomp Scientific Instrument Co., Ltd, Shanghai, China) was used for sample separation. A UV-2700 spectrophotometer (Beijing Purkinje General Instrument Co., Ltd, Beijing, China) was used for the determination of absorbance. Transmission electron microscopy (HT7800, Tokyo, Japan) was used to observe the presence of nanoparticles. The 50.0 mL flotation column (Zhenjiang Gas Chemical Glass Plant Co., Ltd, Zhenjiang, China) was used to construct a flotation device according to the report of Jiang [22].
2.3. Preparation of ATPF
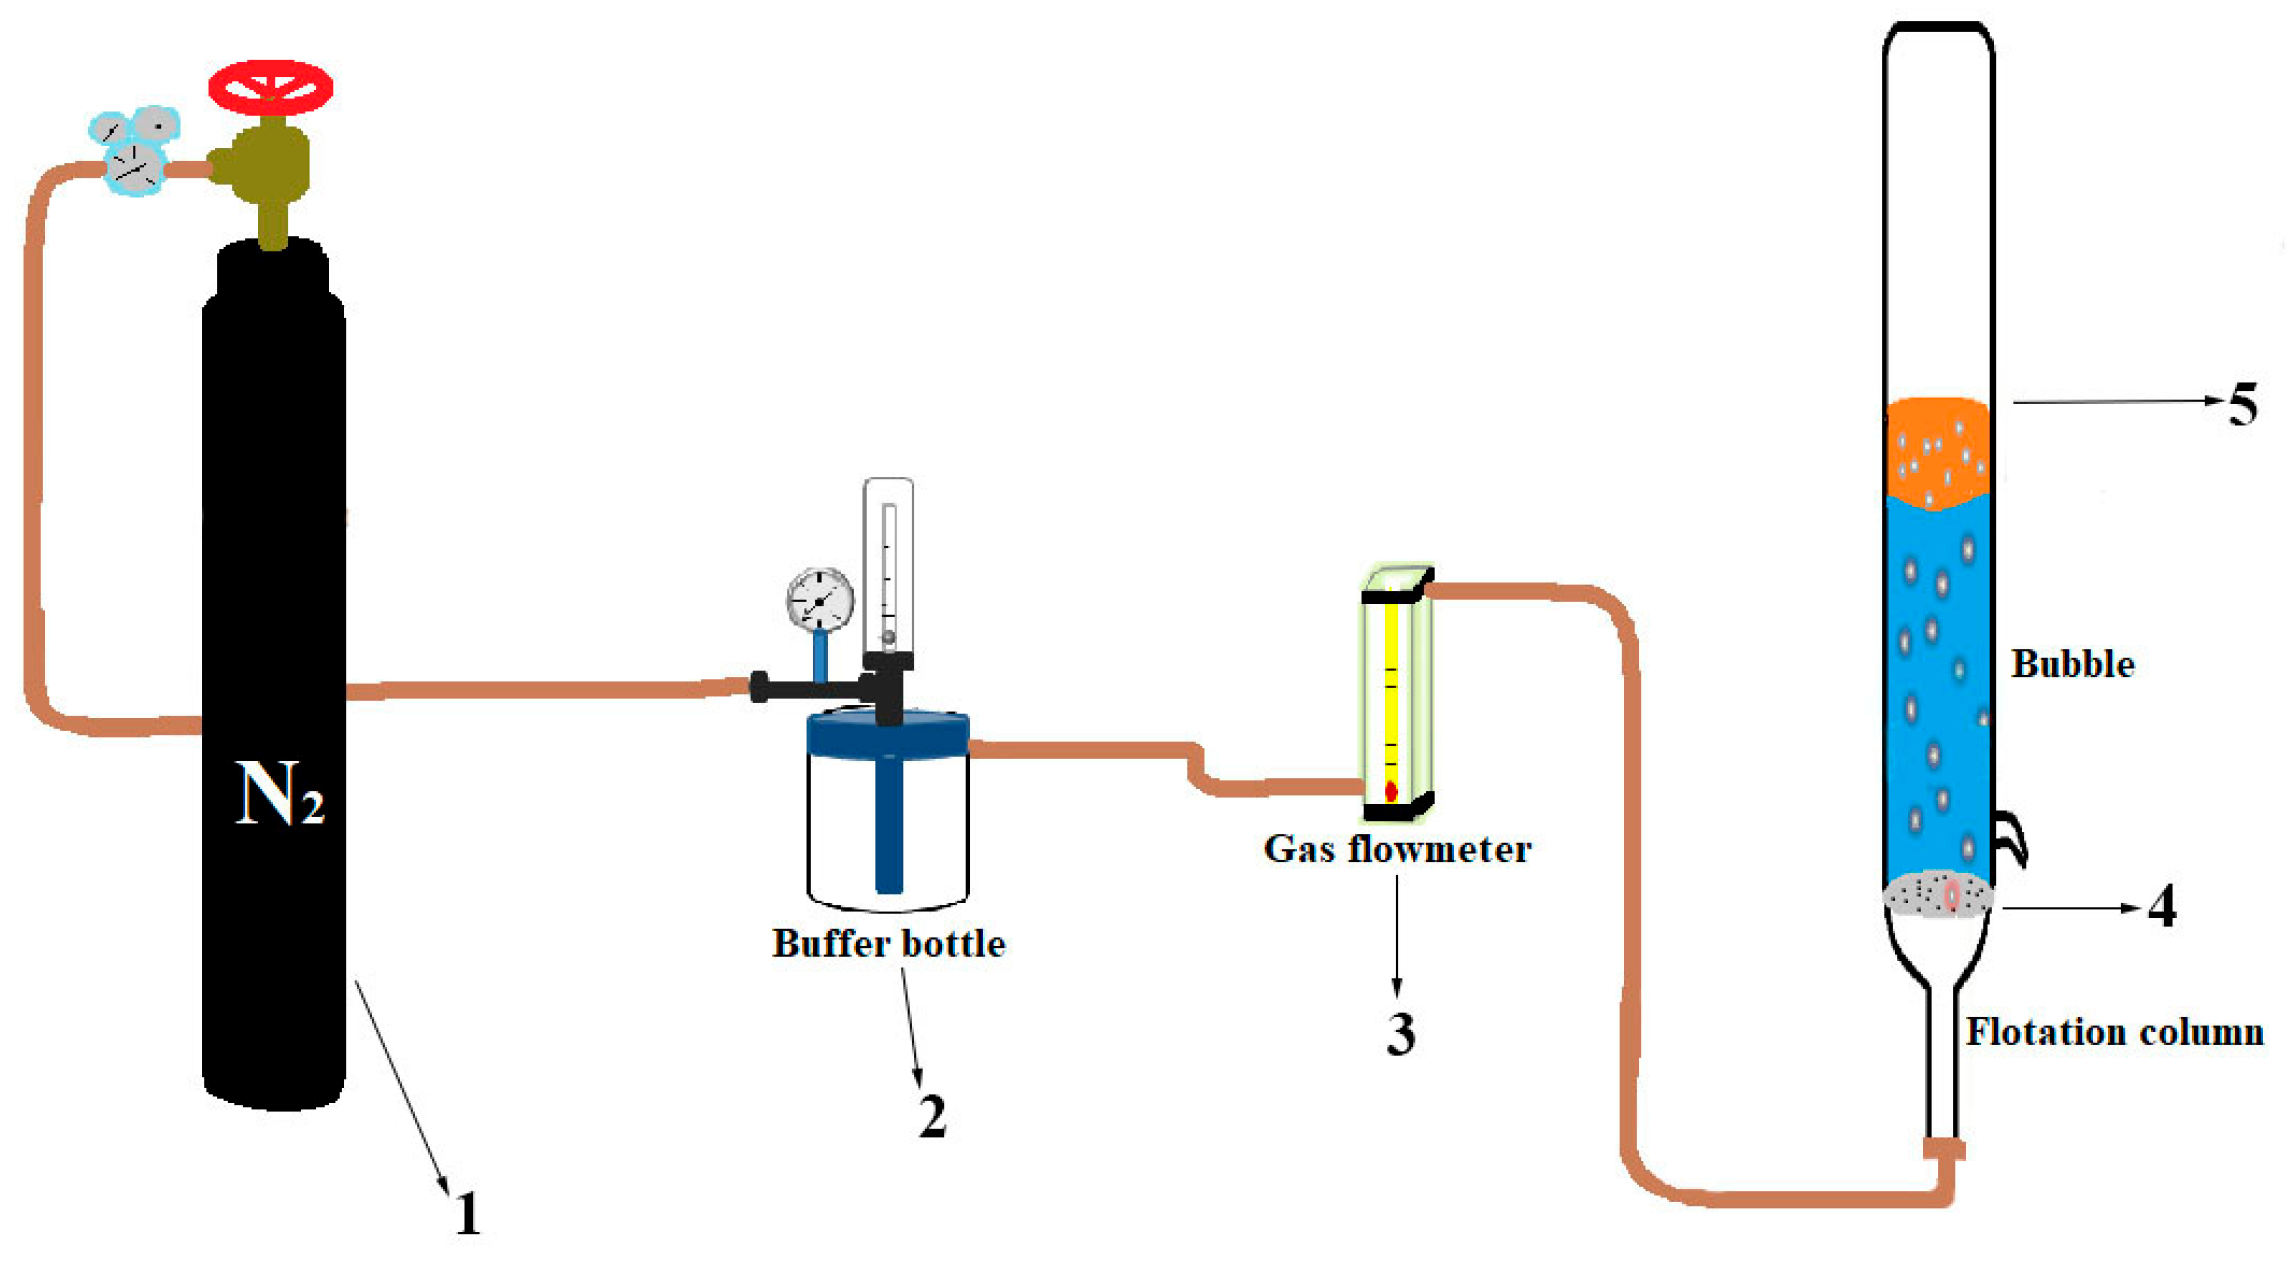
As shown in Figure 1, ATPF was established by previous reports [22]. Nitrogen was used as the flotation gas due to its low cost and stable character. The acetonitrile/(NH4)2SO4 ATPF was used to separate and concentrate SCN− in the filtrate. At room temperature, different amounts of (NH4)2SO4 were mixed with the sample filtrate to prepare the sample solution with different mass fractions of (NH4)2SO4. The flow rate of nitrogen into the system was controlled by a flow meter. When the bubbles were stable, 5 mL of acetonitrile was added to the flotation column, and the flotation time was recorded. At the end of the flotation, the top phase of the ATPF was collected to measure the volume. The effect of parameters on separation, including a ((NH4)2SO4: 28, 30, 32, 34, 36, and 38% w/w), b (pH: 1.5, 2.0, 3.0, 4, 5.0, 6.0, and 7.0), c (flow rate: 11, 13, 15, 16, 17, and 19 mL/min) and d (flotation time: 10, 20, 23, 25, 27, and 30 min) were evaluated based on a single-factor experiment. The content of SCN− in the top phase was determined using the gold-nanoparticles colorimetric method. The separation and concentration efficiency of SCN− by ATPFs were investigated by the recovery rate (Y) and concentration factor (CF), respectively. The calculation formula was as shown in Equations (1) and (2):
where c0 is the SCN− concentration of the top phase after nitrogen blowing (mg/L), V is the top-phase volume of ATPF after nitrogen blowing (mL), m is the added mass of SCN− in the system (mg), and ci is the concentration of SCN− before enrichment (mg/L).

Figure 1.
Schematic diagram of ATPF apparatus: (1) high-purity nitrogen cylinder, (2) gas buffer device reformed by float-type oxygen inhaler, (3) flowmeter, (4) G4 glass core, and (5) flotation column.
2.4. Response Surface Experiments
Based on the optimum conditions obtained from single-factor experiments, the response surface experiment (RSM) was used to adjust the mutual effect of different flotation conditions according to Jiang’s report [23]. The results of the BBD design are shown in Table 1. Using Y and CF as response values for the experiment, the response values were statistically analyzed using ANOVA to optimize the optimum process parameters. The values of Y and CF were interactively fitted using a second-order polynomial equation model, as shown in Equation (3).
where Y is the response value; xi and xj represent each individual factor; and A0, Ai, Aj and Aij denote the intercept, primary term coefficient, secondary term coefficient and interaction coefficient, respectively. The statistical significance of the model was assessed using an F-test.

Table 1.
Factors and levels of code values in the response surface design.
2.5. Preparation of AuNPs
The preparation of citrate-coated AuNPs was based on the classical Frens method, using sodium citrate as a chemical reducing and stabilizing agent [24]. All glassware used in this experiment was cleaned in advance with aqua regia (configured by us) to avoid interference from other residual metals. Then, 50 mL of 86.3 mg/L HAuCl4 solution was added to a three-necked flask and boiled at reflux, with stirring, for 5 min; then, 1.3 mL of 1% (w/w) trisodium citrate solution was quickly added. After stirring at reflux for 15 min, the color of the solution changed from faint yellow to wine red. The heating source was removed, and the solution was condensed and stirred at room temperature until cooled and then stored at 4 °C.
2.6. Transmission Electron Microscopy (TEM)
TEM was used to observe the morphology and dispersion of the nanoparticles. The solution containing AuNPs only, the AuNP solution containing CTAB and the AuNP solution containing SCN− and CTAB were ultrasonicated at 480 W by TYHD-480 (Beijing Tianyou Hengda Technology Co., LTD, Beijing, China) for 20 min to make the AuNPs uniformly dispersed in the solutions. The solutions were then adsorbed on a copper support mesh for 30 min in the dark. AuNPs were observed by TEM at a voltage of 200 kV.
2.7. Thiocyanate Content Test
The determination of SCN− was carried out according to the method of Song with appropriate modifications [25]. Before determination, the top phase of the ATPF was moderately diluted. In total, 3 mL of PBS buffer solution (NaH2PO4-Na2HPO4) at the appropriate pH was mixed with 180 μL of the ATPF top-phase dilution in a colorimetric tube, and then 0.8 mL of the prepared AuNP solution and 20 μL of the CTAB solution were added, and the reaction was carried out at room temperature for 15 min. The color change was clearly observed during the reaction. A UV-2700 spectrophotometer was used to measure the absorbance values at 520 nm and 630 nm.
2.8. Selection of CTAB Concentration
In order to obtain the optimum assay conditions, the effect of different CTAB concentrations of 0.05, 0.1, 0.2, 0.3, 0.4, 0.5, 0.6, 0.7 and 0.8 mg/L on the degree of response of SCN− detection was investigated using the CTAB concentration as a variable. Finally, the optimal CTAB concentration was determined.
2.9. Selection of pH
The pH of SCN− was adjusted using PBS solutions of different pH values. The PBS solutions with pH 5.0, 5.7, 6.0, 6.5, 7.0, 7.5 and 8.0 were added to investigate the effect of pH on the prevention of the AuNPs’ aggregation by SCN−.
2.10. Selection of Color Development Time
Known amounts of PBS solution, AuNP solution, flotation top-phase blank solution or top-phase solution containing SCN−, CTAB solution were added to fifteen test tubes. After color development for 1 min, 3 min, 5 min, 7 min, 9 min, 11 min, 13 min, 15 min, 17 min, 19 min, 21 min, 23 min, 25 min, 27 min and 31 min, the colorimetric determination of SCN− was carried out to investigate the effect of color-development time on the determination.
2.11. Analysis of Sample and Calculation of Results
The SCN− content of the sample was calculated according to Equation (4).
where c is the concentration of SCN− in the raw milk (mg/kg); ρ is the concentration of SCN− in the top phase of the ATPF, as measured by the standard curve (mg/L); V is the volume of top phase of ATFF (mL); f is the dilution multiple of the sample solution; and m is the amount of filtrate sample (g).
The spiked recovery in the actual samples was calculated according to Equation (5).
where P is the spiked recovery (%) in the actual sample, c1 is the SCN− concentration (mg/kg) in the sample, c2 is the spiked sample concentration (mg/kg) and c3 is the spiked amount (mg/kg).
2.12. Statistical Analysis
Mean values and the standard deviations (means ± SD) of the data were analyzed using SPSS 20.0 software (Chicago, IL, USA). Significant difference between sample means (p < 0.05) were established using Duncan’s multiple-range algorithms [26,27].
3. Results and Discussion
3.1. Determination of Process Parameters for ATPF
3.1.1. Effect of (NH4)2SO4 Content
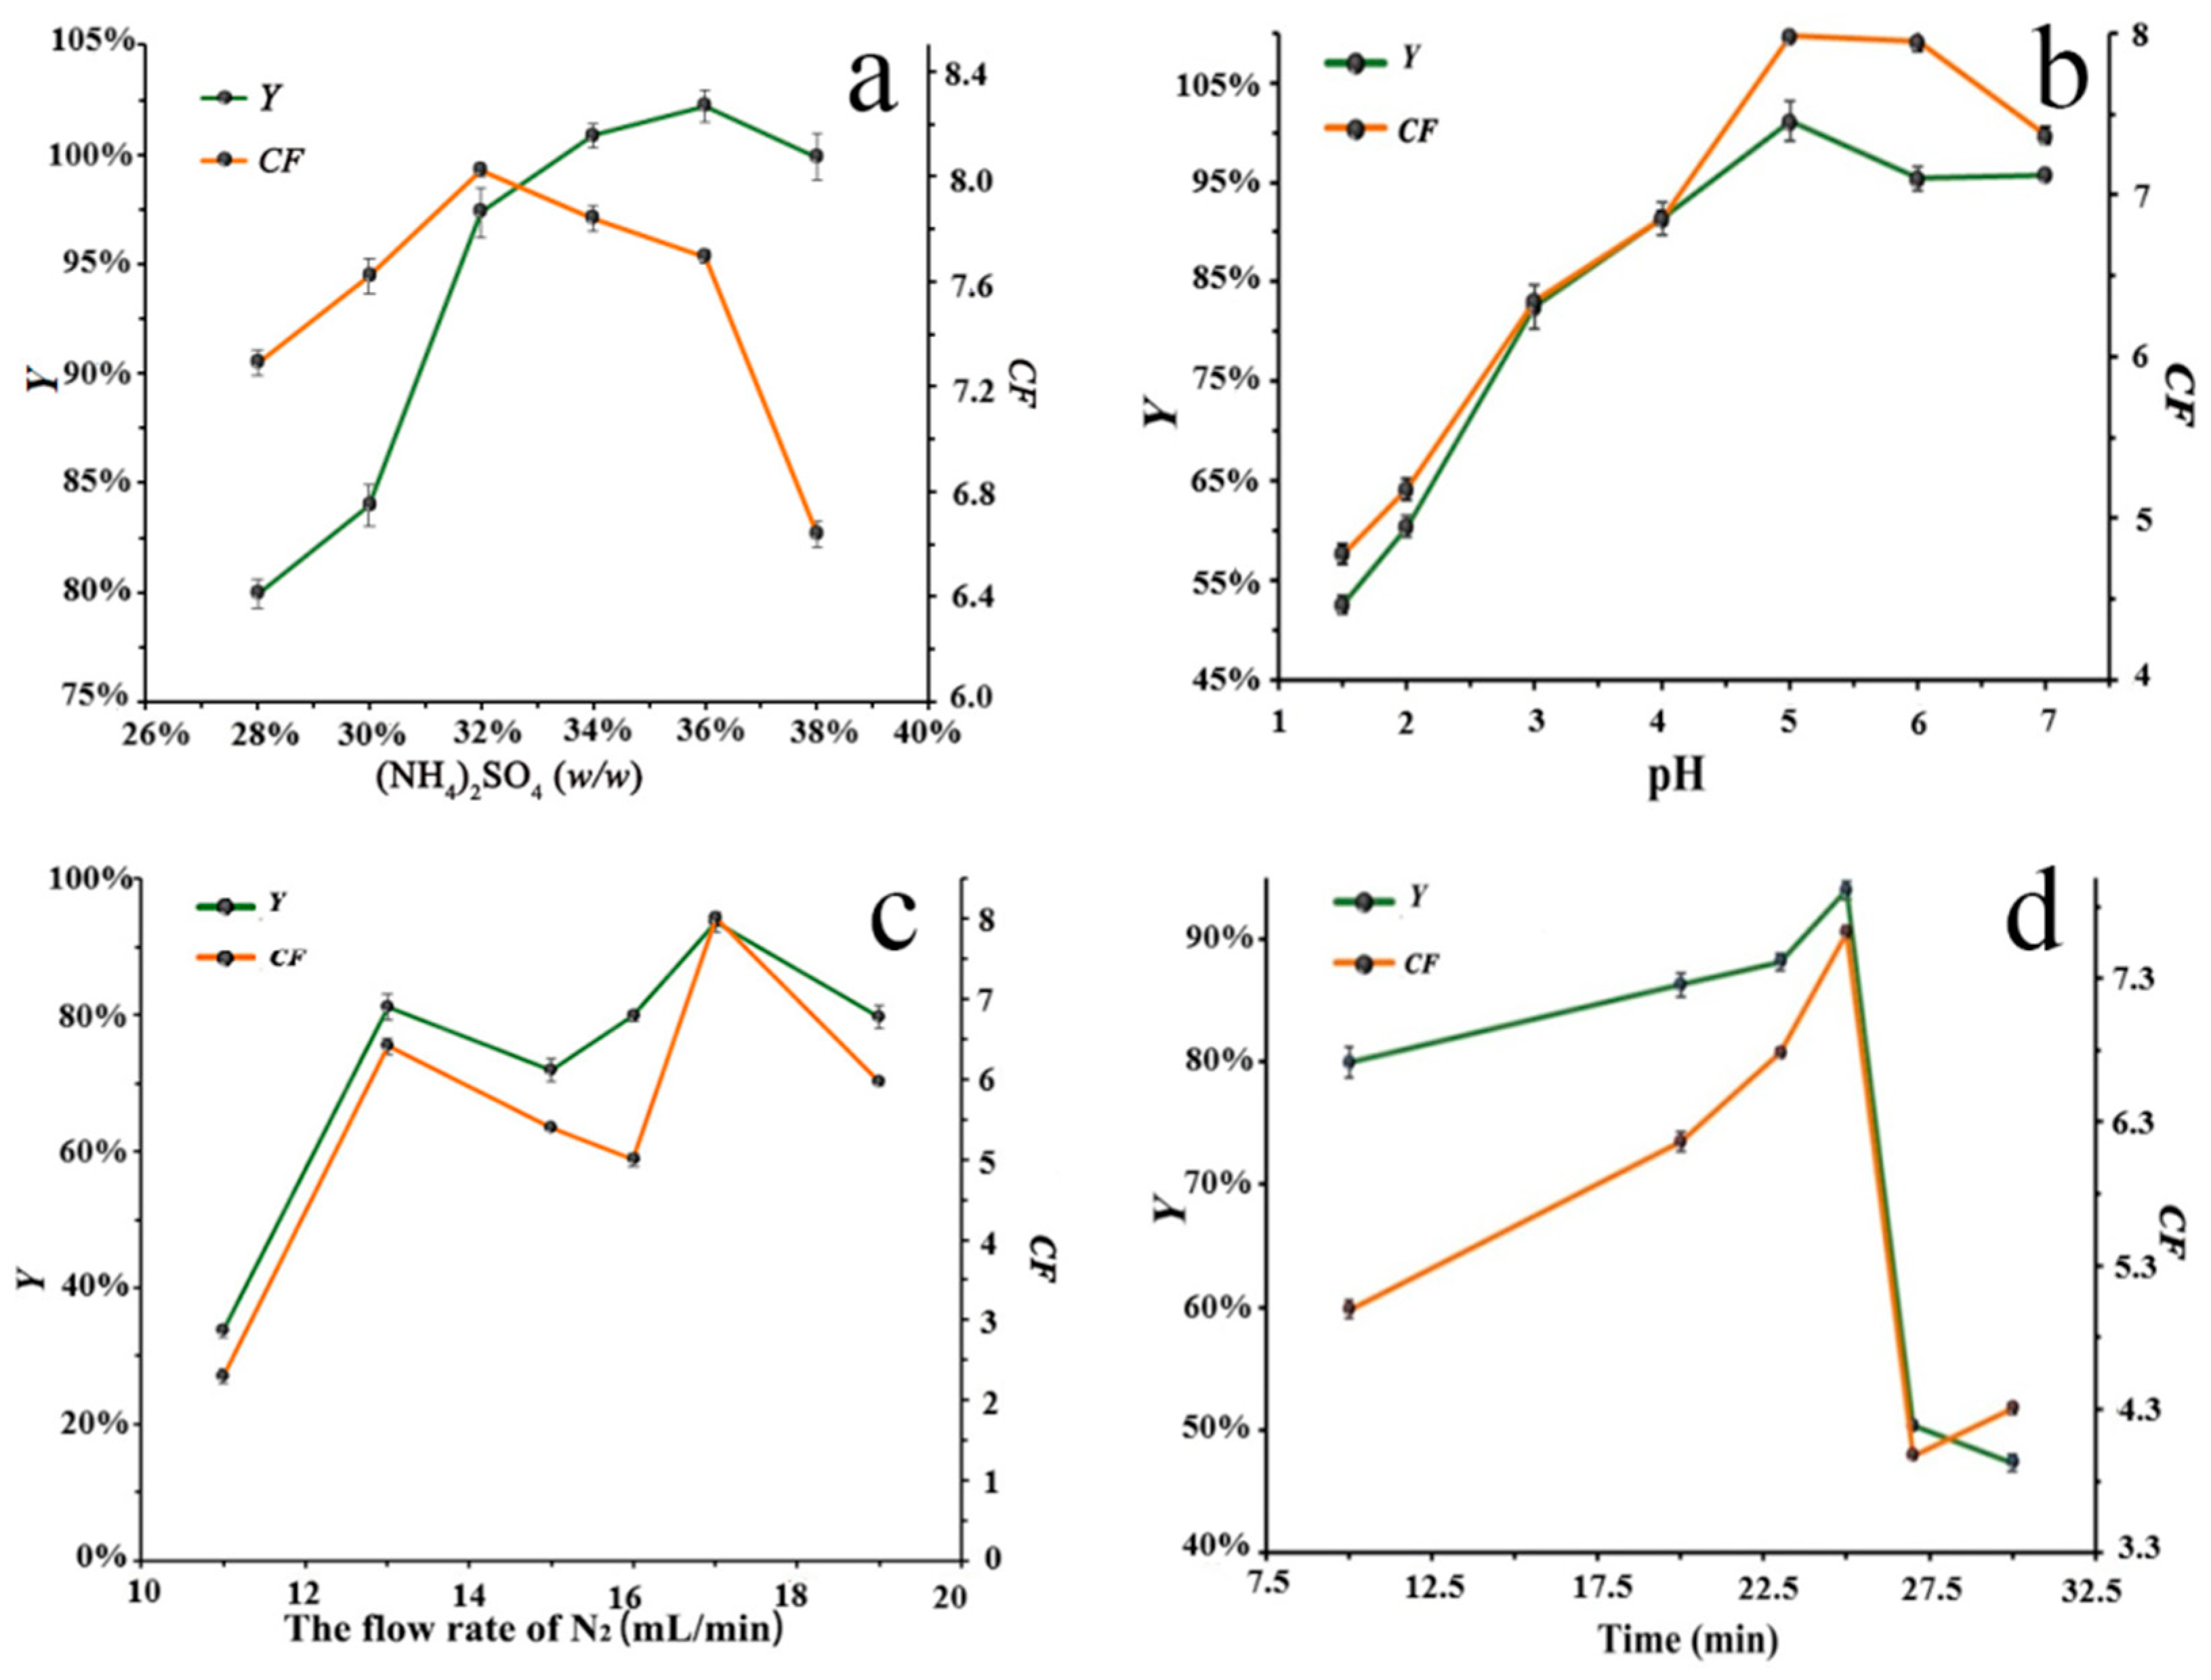
There was a large difference between the top and bottom phase volumes in ATPF, so that the higher salt concentration was required to maintain phase formation stability [28]. Figure 2a shows the effect of ATPF with different mass fractions of (NH4)2SO4 on the recovery (Y) and the concentration factor (CF) of SCN−. As the mass fraction of (NH4)2SO4 increased, CF and Y increased and reached the maximum at the mass fraction of 32% and 36%, respectively. This phenomenon could be attributed to the fact that, as the (NH4)2SO4 concentration increased, the increase in SO42− content caused an increase in the homogeneous charge repulsion between SCN− and SO42−, which decreased the solubility of SCN− in the salt solution and promoted the transfer of SCN− to the top phase. Continuously exceeding the (NH4)2SO4 concentration would inhibit the adsorption of SCN− by bubbles and lead to the decrease in CF and Y. In the mass fraction range of 32–36%, the value of CF decreased, but only by about 0.4. Therefore, the (NH4)2SO4 mass fraction of 36% was chosen as the best experimental condition with a higher value of Y.
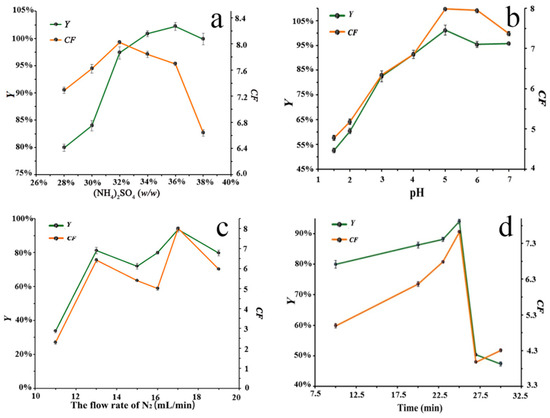
Figure 2.
Influence of different factors in ATPF: (a) effect of the (NH4)2SO4 concentration, (b) effect of pH, (c) effect of flow rate and (d) effect of flotation time.
3.1.2. Effect of pH
The pH value largely determined the form of the flotation target material and directly affected the adsorption capacity of the material on the bubble surface and the solubility of the organic phase, which, in turn, affected the flotation efficiency [29]. Figure 2b shows that the separation efficiency of SCN− was strongly influenced by the pH. In the range of 1.5 to 7, both CF and Y first increased and then decreased, reaching their maximum at a pH of 5. It indicated that the separation and enrichment of SCN− in the ATPF was strongly dependent on pH, which could be attributed to the charge effect of SCN−. With the increasing pH, the protonation of SO42− decreased, which increased charge rejection between SO42− and SCN−. The SCN− was preferentially transferred to the top phase, which increased the CF and Y. A further increase in pH would cause the change in solubility of SCN− in the top phase and lead to the decrease in CF and Y. Therefore, a pH of 5 was chosen as the optimum condition for further study.
3.1.3. Effect of Nitrogen Flow Rate
Figure 2c shows the effect of different flow rates on the flotation efficiency of SCN− at the flotation time of 20 min. At the flow rate of 17 mL/min, the CF and Y reached the maximum value of 8.02 and 93.58%, respectively. However, a further increase would decrease the CF and Y. At a low flow rate, the buoyancy of the bubbles was less than the interfacial tension, which prevented the bubbles passing through the interface between the two phases and resulted in the failure of the flotation [30]. However, a high flow rate caused the bubbles to rise too fast, which reduced the contact time between SCN− and bubbles and the stability of adsorption, causing the SCN− adsorbed on the bubble surface to fall back into the bottom phase [31]. When the flow rate exceeded a certain critical value, CF and Y decreased, and either a too-high or too-low flow rate was detrimental to the ATPF process. Therefore, 17 mL/min was the optimum flotation conditions in this experiment.
3.1.4. Effect of Flotation Time
Figure 2d shows the results of the effect of different flotation times on Y and CF. With the increase in the flotation time, the Y and CF gradually increased and reached the maximum at 25 min. However, with the further increase in flotation time, the water film between the interface of the two phases would be drained, and the water film layer would become thinner or even break, causing the SCN− in the top phase to return to the bottom phase, thereby reducing the Y and CF. Therefore, 25 min was chosen as the optimum flotation time for this experiment.
3.2. Response Surface Experiment Design and Model Fitting
Based on the results of the single-factor tests, the process parameters for the extraction of SCN− with the acetonitrile/(NH4)2SO4 ATPF were optimized using the Box–Behnke design (BBD) and the response surface methodology (RSM). The effects of (NH4)2SO4 mass fraction (34–38%), pH (4–6), flow rate (16–18 mL/min) and flotation time (23–27 min) on CF and Y were investigated. The BBD experimental design and results are presented in Table 2. The experimental data were processed using Design Expert software (Version 8.0.6) to obtain a quadratic multinomial regression equation with a response value of Y. The fitted equations were as follows.
Table 2.
Experimental design and results for BBD.
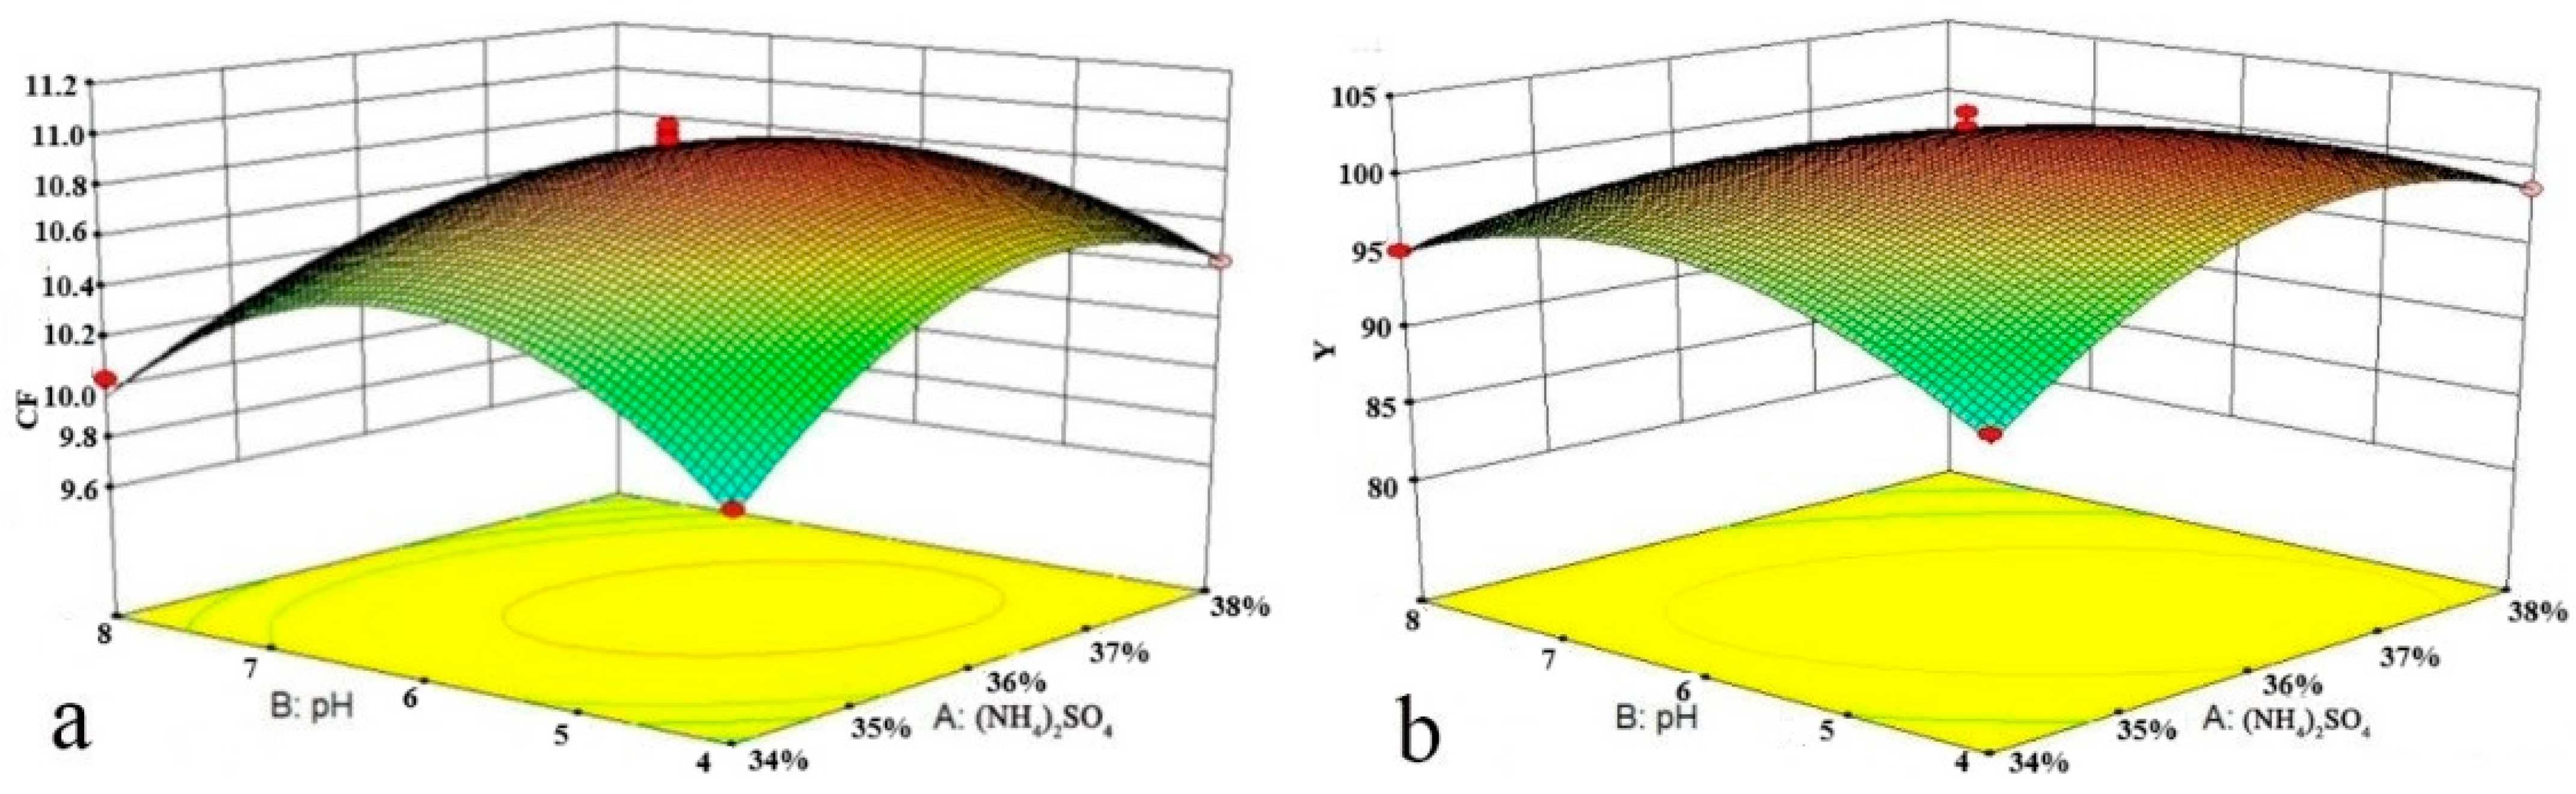
From the coefficients of the primary term of the fitted equation above, it was clear that the primary order of factors affecting the recovery of SCN− was pH (B) and flow rate (C) > time (D) > mass fraction of (NH4)2SO4 (A).
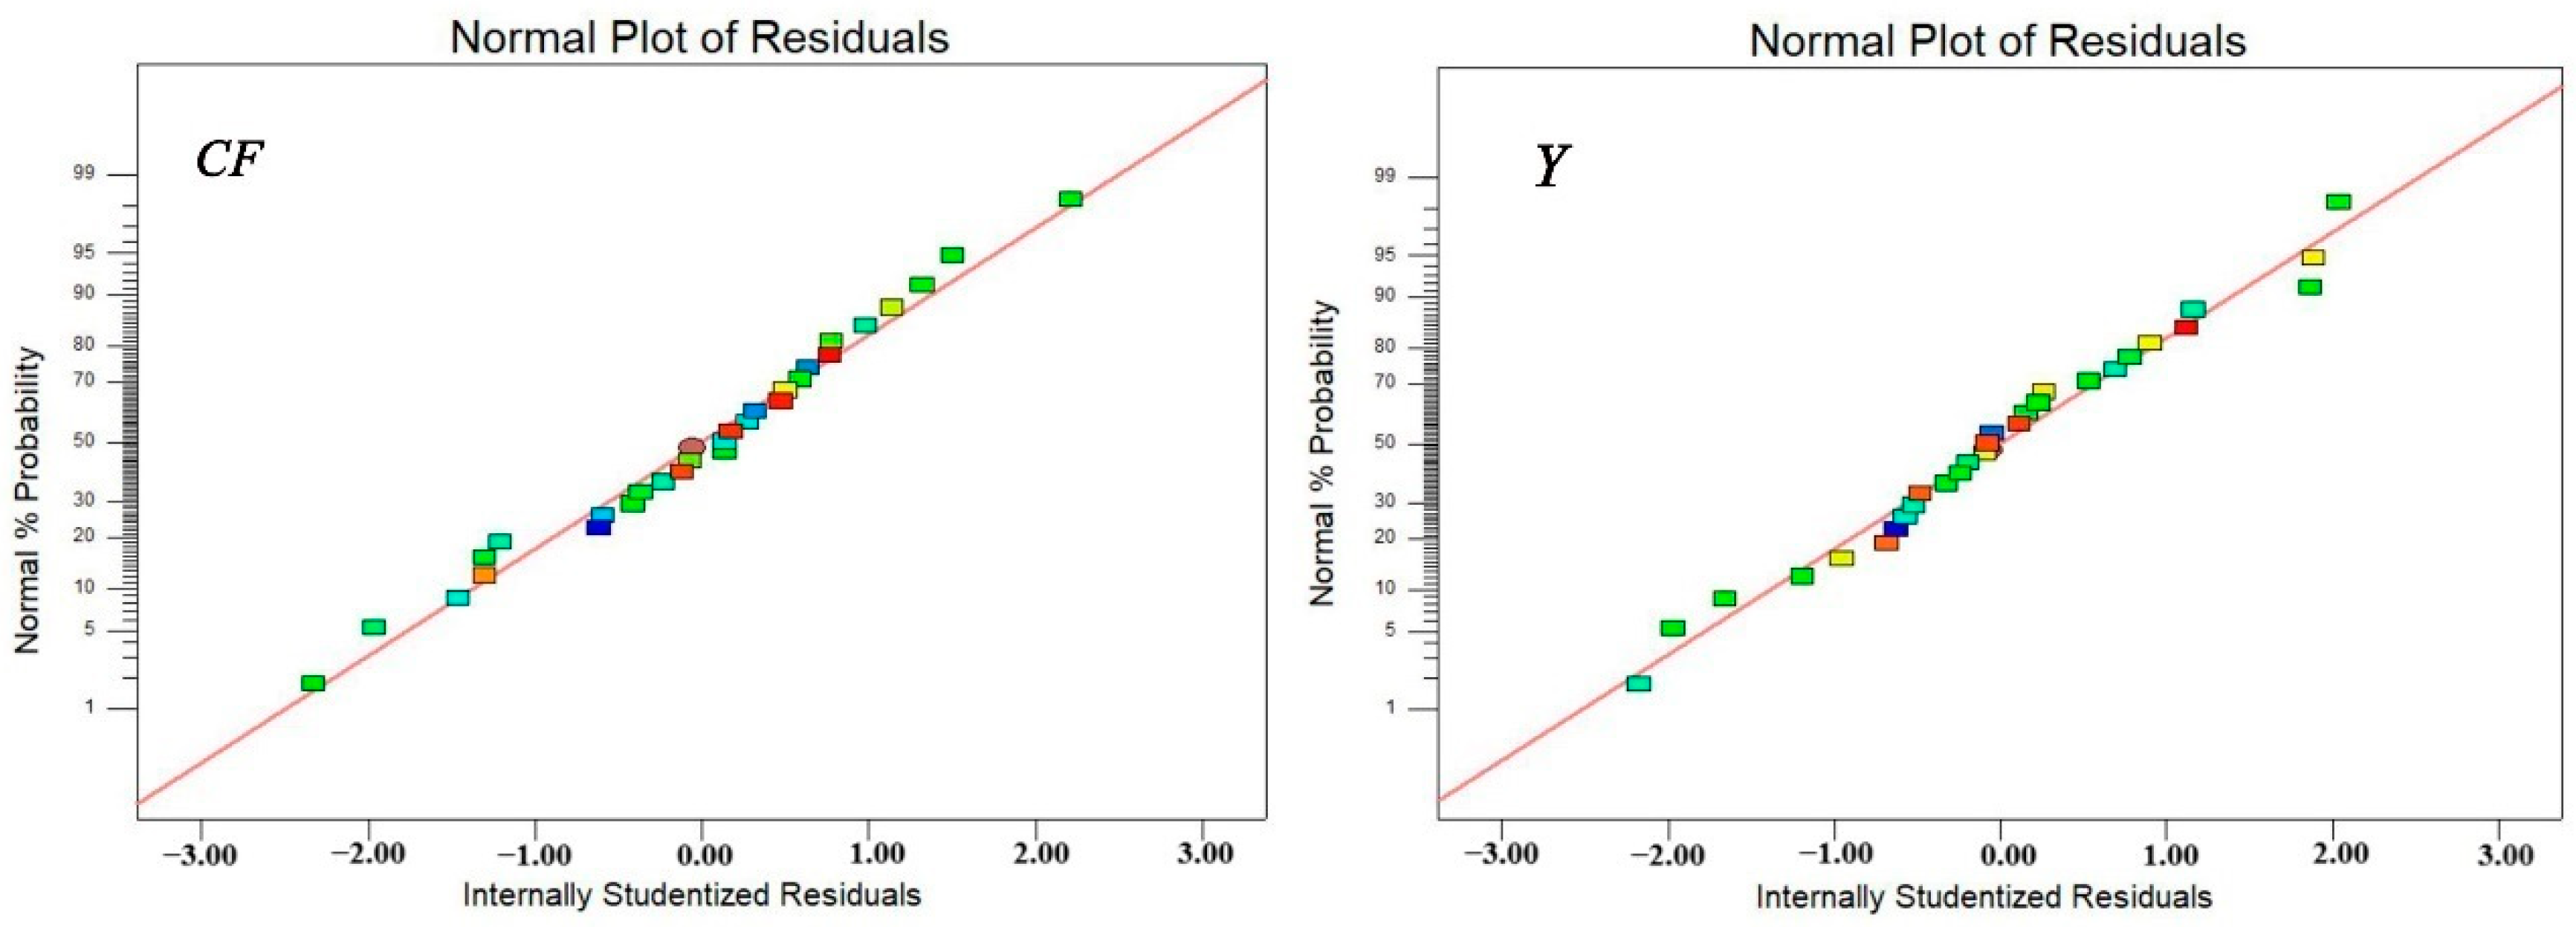
As shown in Table 3 and Table 4, the regression model for CF and Y was good (p1 < 0.0001 and p2 < 0.0001), indicating that the model was highly statistically significant. Furthermore, the lack of fit (0.22 > 0.05; 0.1407 > 0.05) and R2 (0.96 and 0.97) suggested that the model was a good fit to the actual test, while the coefficients of variation (CV%) were 4.03% and 2.37%, respectively. Figure 3 illustrates that the predicted and true values of the CF and Y prediction models correlated well. The above results clearly indicated that the model can be adequately fitted for numerical analysis with a high degree of accuracy and reliability.
Table 3.
The ANOVA of the prediction model of CF.
Table 4.
The ANOVA of the prediction model of Y.
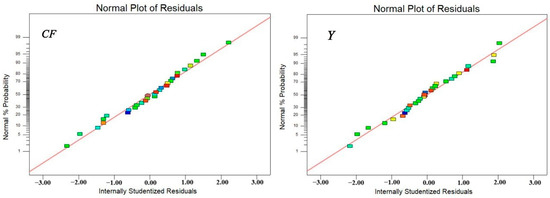
Figure 3.
Relationships between predicted and actual values in the models of CF and Y.
3.3. Interaction of Various Factors
Figure 4a,b show the effect of the interaction between the (NH4)2SO4 mass fraction and pH on CF and Y, respectively. Lower (NH4)2SO4 mass fractions and pH values were not conducive to the transfer of SCN− to the top phase. With the increasing (NH4)2SO4 mass fraction, the repulsive force between SO42− and the equally negatively charged SCN− was increased, resulting in the easy adsorption of SCN− on the bubble surface and transfer to the top phase. With the increasing pH, the protonation of SO42− was decreased, and the repulsive force between SO42− and SCN− was increased, which caused more SCN− to move up to the top phase with the bubbles. However, a too-high mass fraction of (NH4)2SO4 would increase the viscosity of the bottom phase and lead to an increase in the resistance of the bubbles entering the top phase, thus affecting the process of the bubbles carrying SCN− into the top phase, which not only reduced Y but also led to a reduction in CF.

Figure 4.
Effects of the concentration of (NH4)2SO4 and pH on CF (a) and Y (b).
The effects of the interaction between flotation time and flow rate on the CF and Y of SCN− are illustrated by Figure 5a,b, respectively. In order to achieve the same flotation effect, there was a negative correlation between the flotation time and flow rate. Considering that acetonitrile is a volatile organic solvent, a high flow rate and a long flotation time could break the interface between the two phases and accelerate its volatilization, resulting in a reduction in the top-phase volume, thus reducing the dissolved SCN− content in the top phase. Therefore, the shortest flotation time and maximum flow rate were generally preferred without compromising the flotation effect in ATPF.
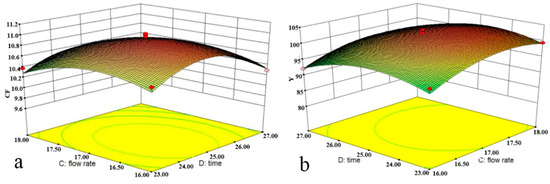
Figure 5.
Effects of flow rate and flotation time on CF (a) and Y (b).
Based on the BBD results, it can be concluded that the optimum flotation conditions were as follows: the mass fraction of (NH4)2SO4 was 36%, the pH was 4.85, the flow rate was 17.27 mL/min and the flotation time was 24.81 min. The CF and Y of SCN− under these conditions were 10.96 and 103.34%, respectively. For ease of operation, the conditions were adjusted as follows: the mass fraction of (NH4)2SO4 was 36%, the pH was 4.8, the flow rate was 17 mL/min and the flotation time was 25 min. There was no significant difference between the experimental results and the predicted values, indicating the reliability of the method and good experimental optimization results.
3.4. Flotation Path of SCN−
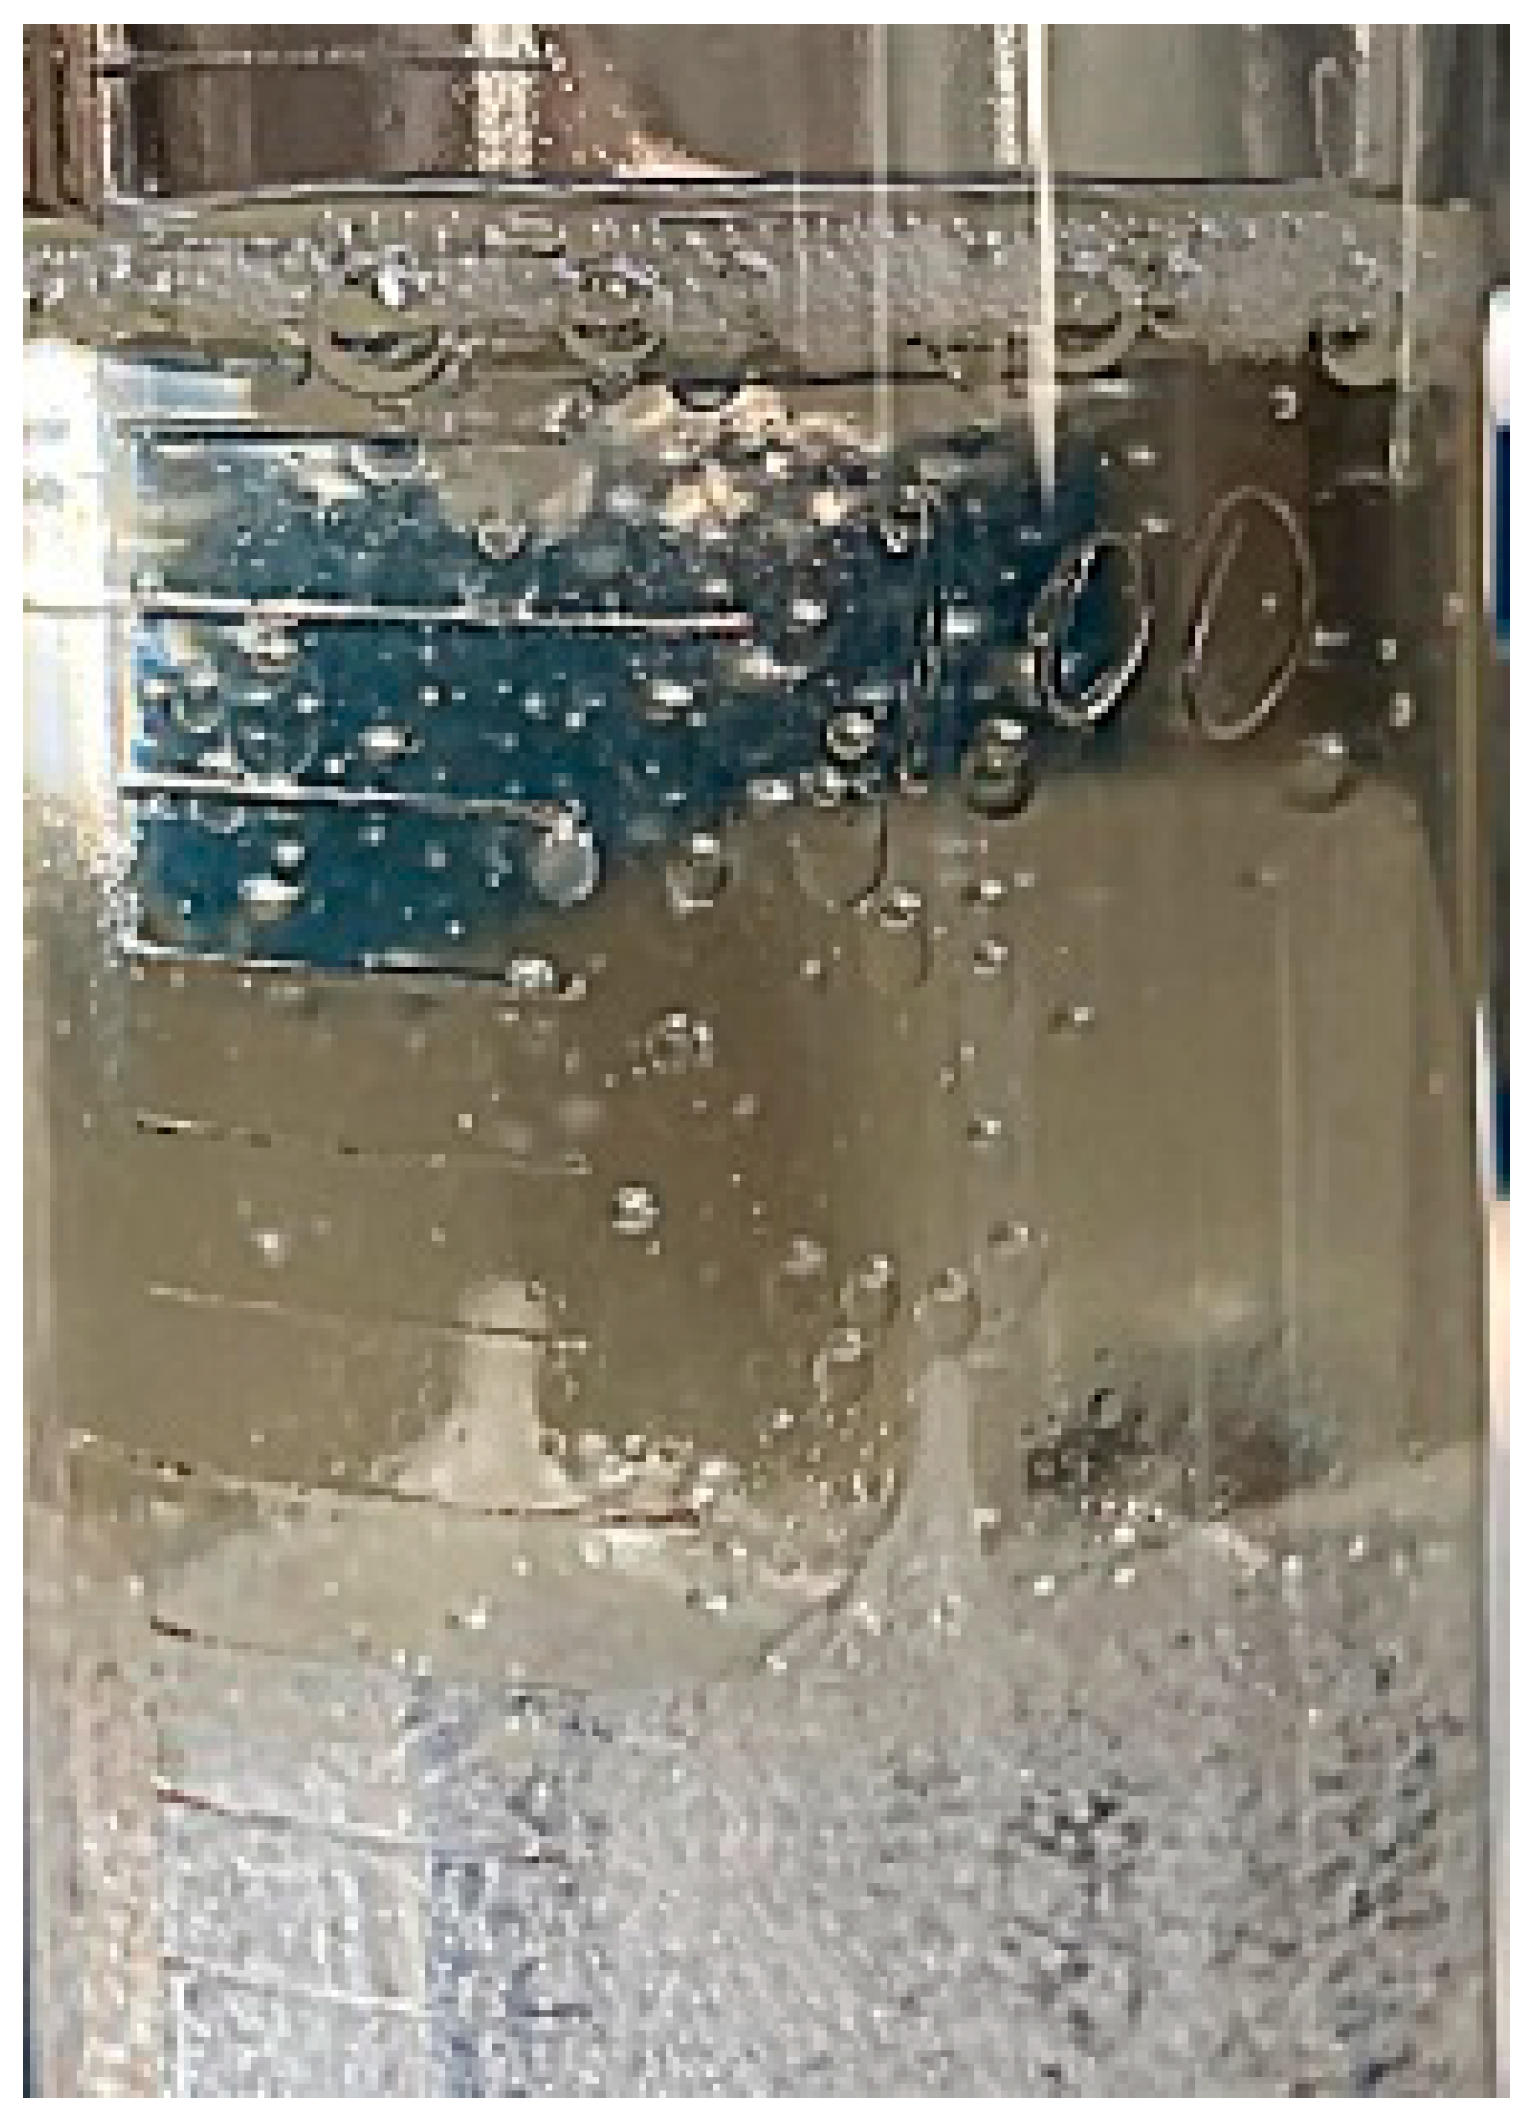
In this part, the Fe3+ solution was used to completely stain the SCN− during flotation, and the specific path of SCN− was traced by observing the color change in the top phase under optimal experimental conditions. The experimental results are shown in Figure 6 and Figure 7. The top phase showed different depths of yellow color after 0 min (a), 5 min (b), 10 min (c) and 25 min (d) of flotation, respectively. As can be seen in Figure 7, the bubbles carrying SCN− transferred from the bottom phase through the interface between the two phases into the top phase and formed a cluster of bubbles on the surface of the top phase. After bursting into small droplets, the SCN− was retained in the top phase. During the flotation process, the color of the top-phase solution became darker, which indicated that the SCN− was successfully carried by the bubbles to enter the top phase, thus achieving the flotation effect.
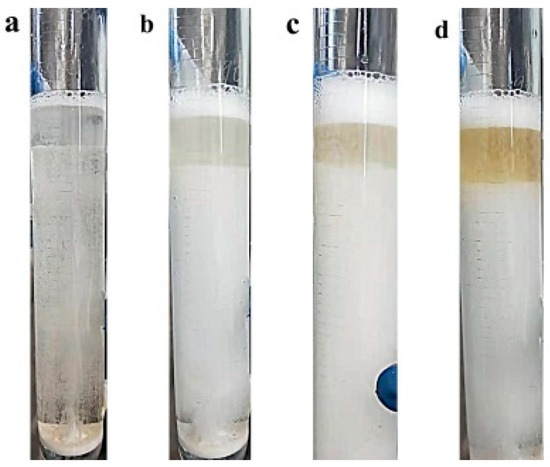
Figure 6.
Digital photos during flotation: (a) flotation time of 0 min, (b) flotation time of 5 min, (c) flotation time of 10 min and (d) flotation time of 25 min.
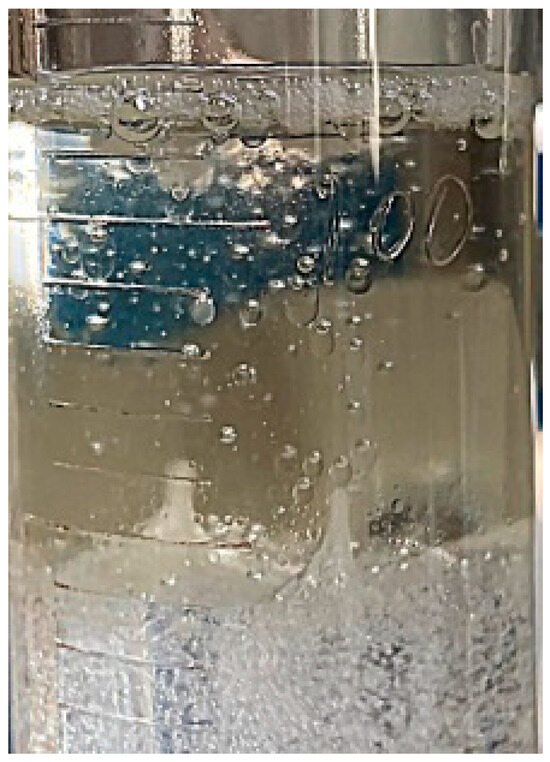
Figure 7.
Digital photos of top phase of flotation.
3.5. Determination of Thiocyanate in Raw Milk by ATPF-AuNPs Colorimetric Method
3.5.1. Effect of CTAB Concentration
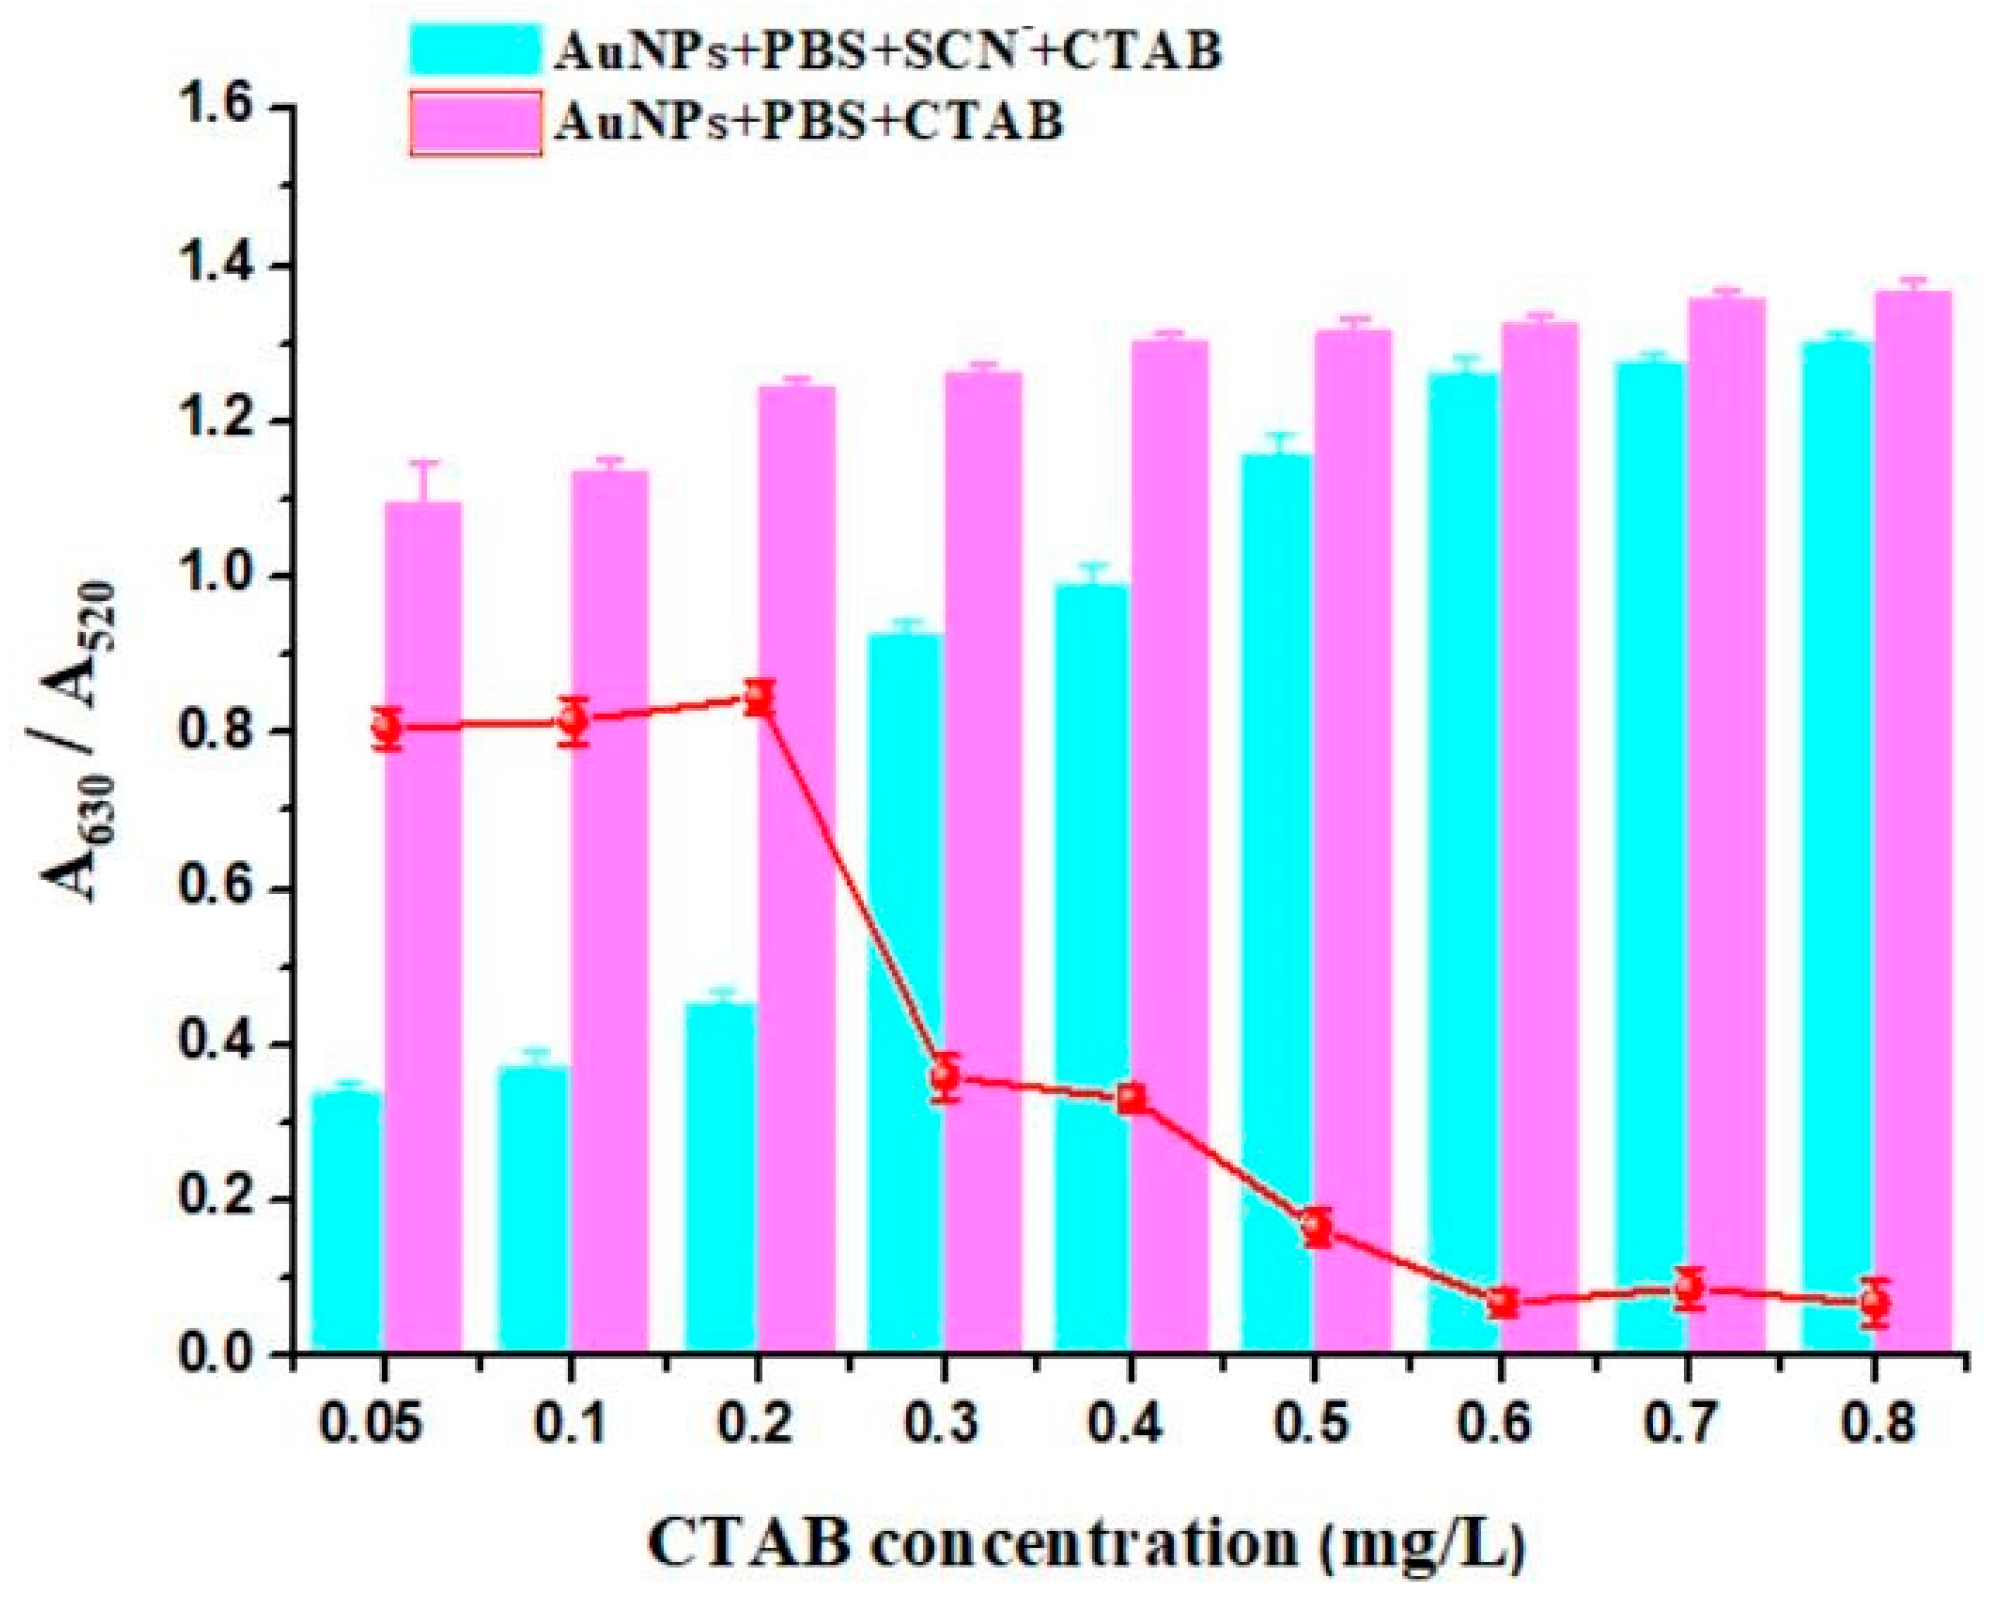
Figure 8 indicates that the addition of CTAB as an aggregating agent could improve the sensitivity of the determination of SCN−. In the range of 0.05–0.2 mg/L, the degree of aggregation of AuNPs was gradually increased. When the CTAB concentration was above 0.2 mg/L, the change in the A630/A520 value was not significant, indicating that the degree of aggregation of AuNPs was basically saturated. The broken line indicated the degree of response to the detection of SCN− at different CTAB concentrations. It can be seen that the degree of response was greatest at 0.2 mg/L. Therefore, 0.2 mg/L was chosen as the further experimental concentration to achieve the high detection sensitivity.

Figure 8.
The influence of the CTAB concentration on the determination.
3.5.2. Effect of pH and Reaction Time
The effect of pH 5.0–8.0 on the detection of SCN− is shown in Figure 9a. ΔA630/A520 was the difference value of the absorbance ratio before and after the addition of SCN−, which indicated the degree of recovery of AuNP aggregation. With the increasing pH, ΔA630/A520 increased and reached its maximum at pH 7.0, where the degree of recovery of AuNP aggregation was highest. Therefore, a pH of 7.0 was selected as the optimum condition for SCN− detection.
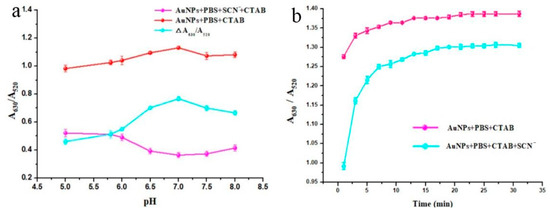
Figure 9.
The influence of pH (a) and time (b) on the determination.
As shown in Figure 9b, the anti-aggregation kinetics of the method were investigated. It can be seen that the absorbance ratio (A630/A520) increased with the increasing reaction time (0–30 min) and gradually stabilized after 15 min, which demonstrated that the reaction was completed at this point. Therefore, all subsequent experiments were carried out with a reaction time of 15 min.
3.6. Colorimetric Detection of Thiocyanate
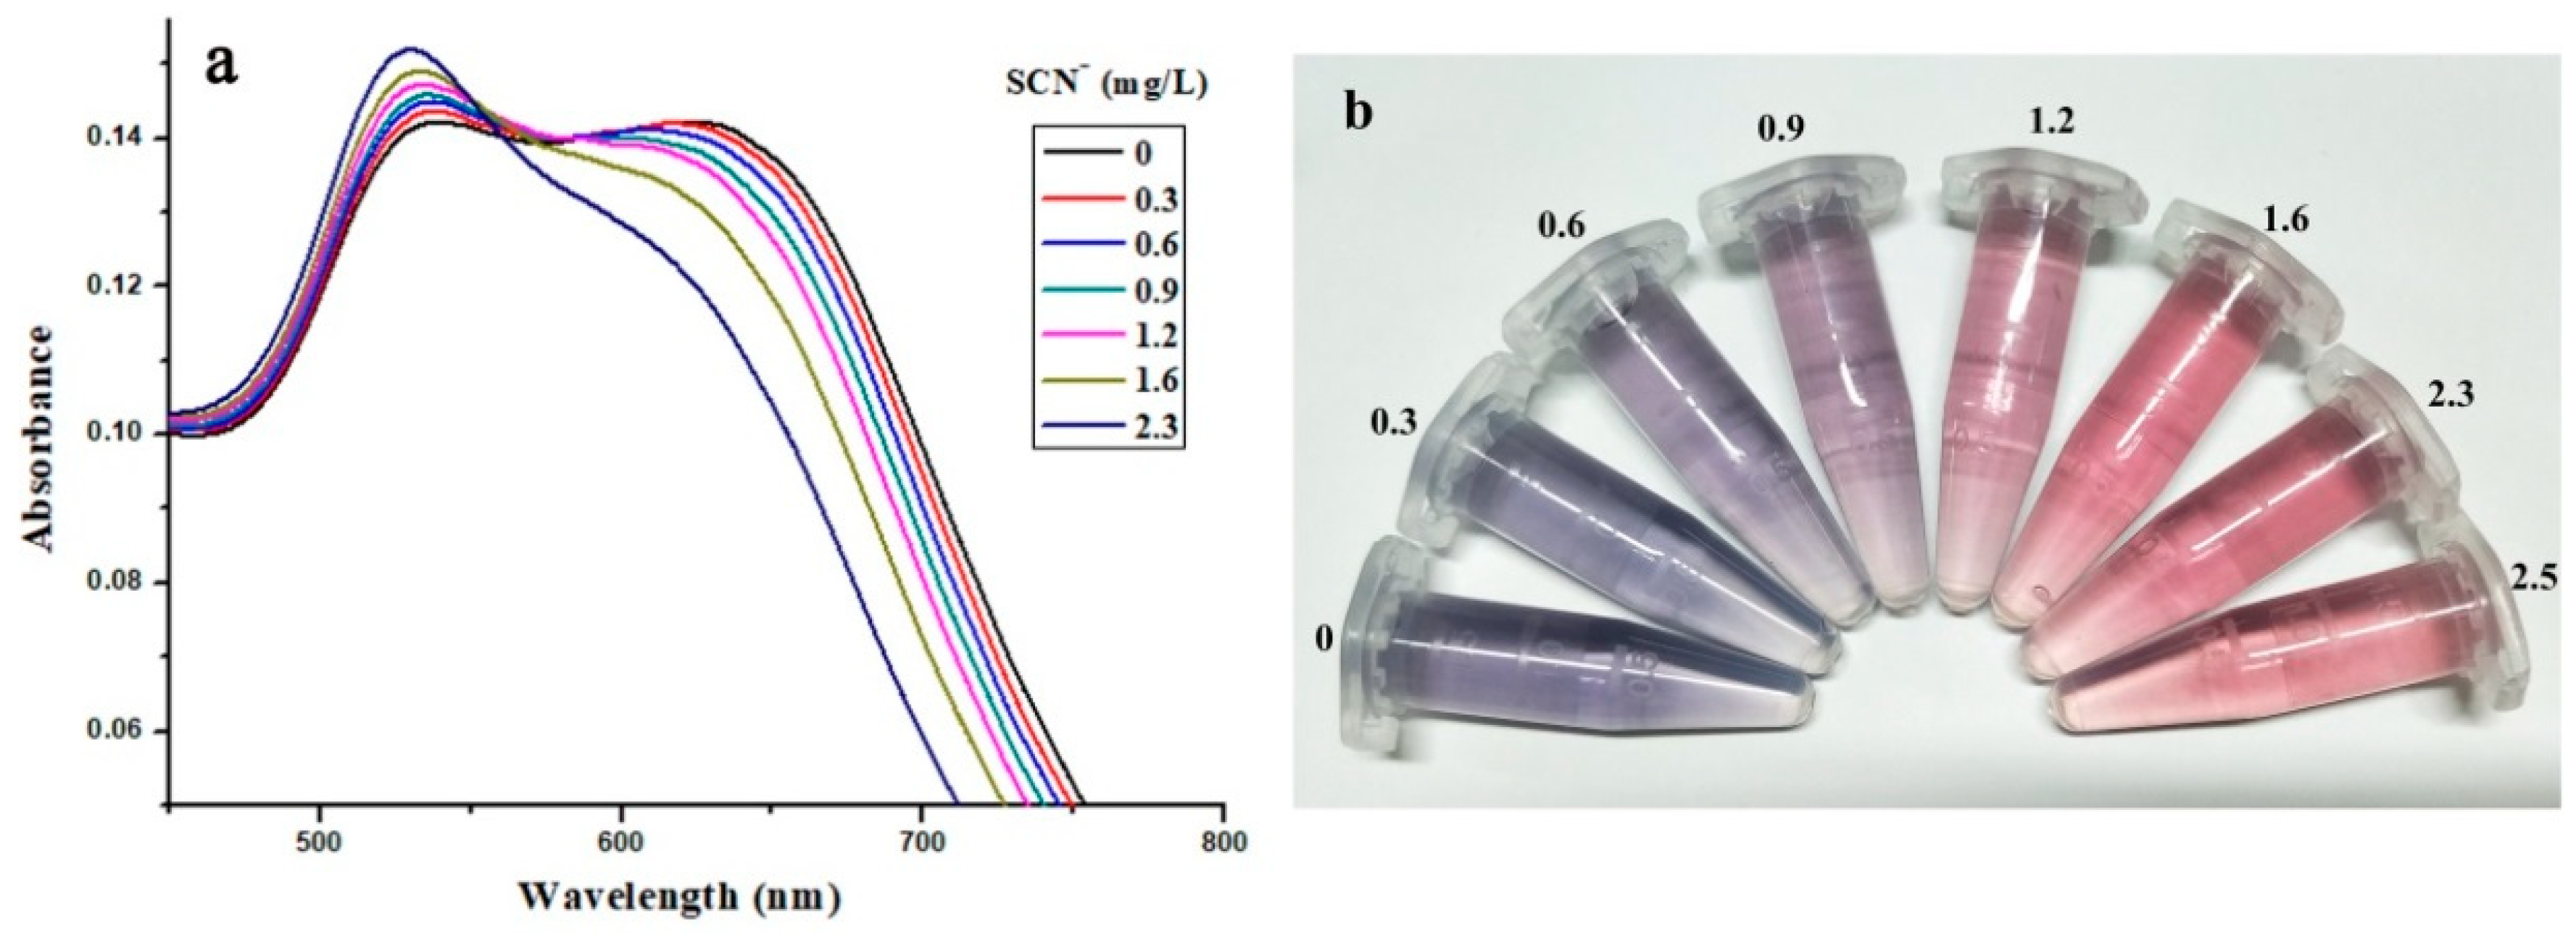
Under the optimal ATPF and detection conditions, the UV absorption spectra of AuNPs after the addition of different concentrations of SCN− are shown in Figure 10a. As the concentration of SCN− increased, A630 gradually decreased, while A520 increased, which indicated that SCN− was effective in protecting AuNPs. It had been shown that this performance was far superior to that obtained from the formation of colored complexes [32]. As shown in Figure 10b, the solution color changed from blue to red with the increasing SCN− concentration in the range of 0–2.5 mg/L. It was clear that the SCN− recognition system could also be detected visually by the naked eye. At the same time, a quantitative determination of SCN− can be performed using UV absorption spectrograms. By correlating the A630/A520 absorbance ratio with the concentration of SCN−, an exponential decay curve could be fitted, and the linear interval for the determination of SCN− could be measured.

Figure 10.
(a) UV absorption spectra of AuNPs after adding various concentrations of SCN−; (b) each AuNP solution corresponding to the spectrum; the concentrations of SCN− (mg/L) are listed next to the corresponding solution.
3.7. Exploration of the Mechanism of AuNPs Colorimetric Determination of SCN−
3.7.1. UV Absorption Spectra
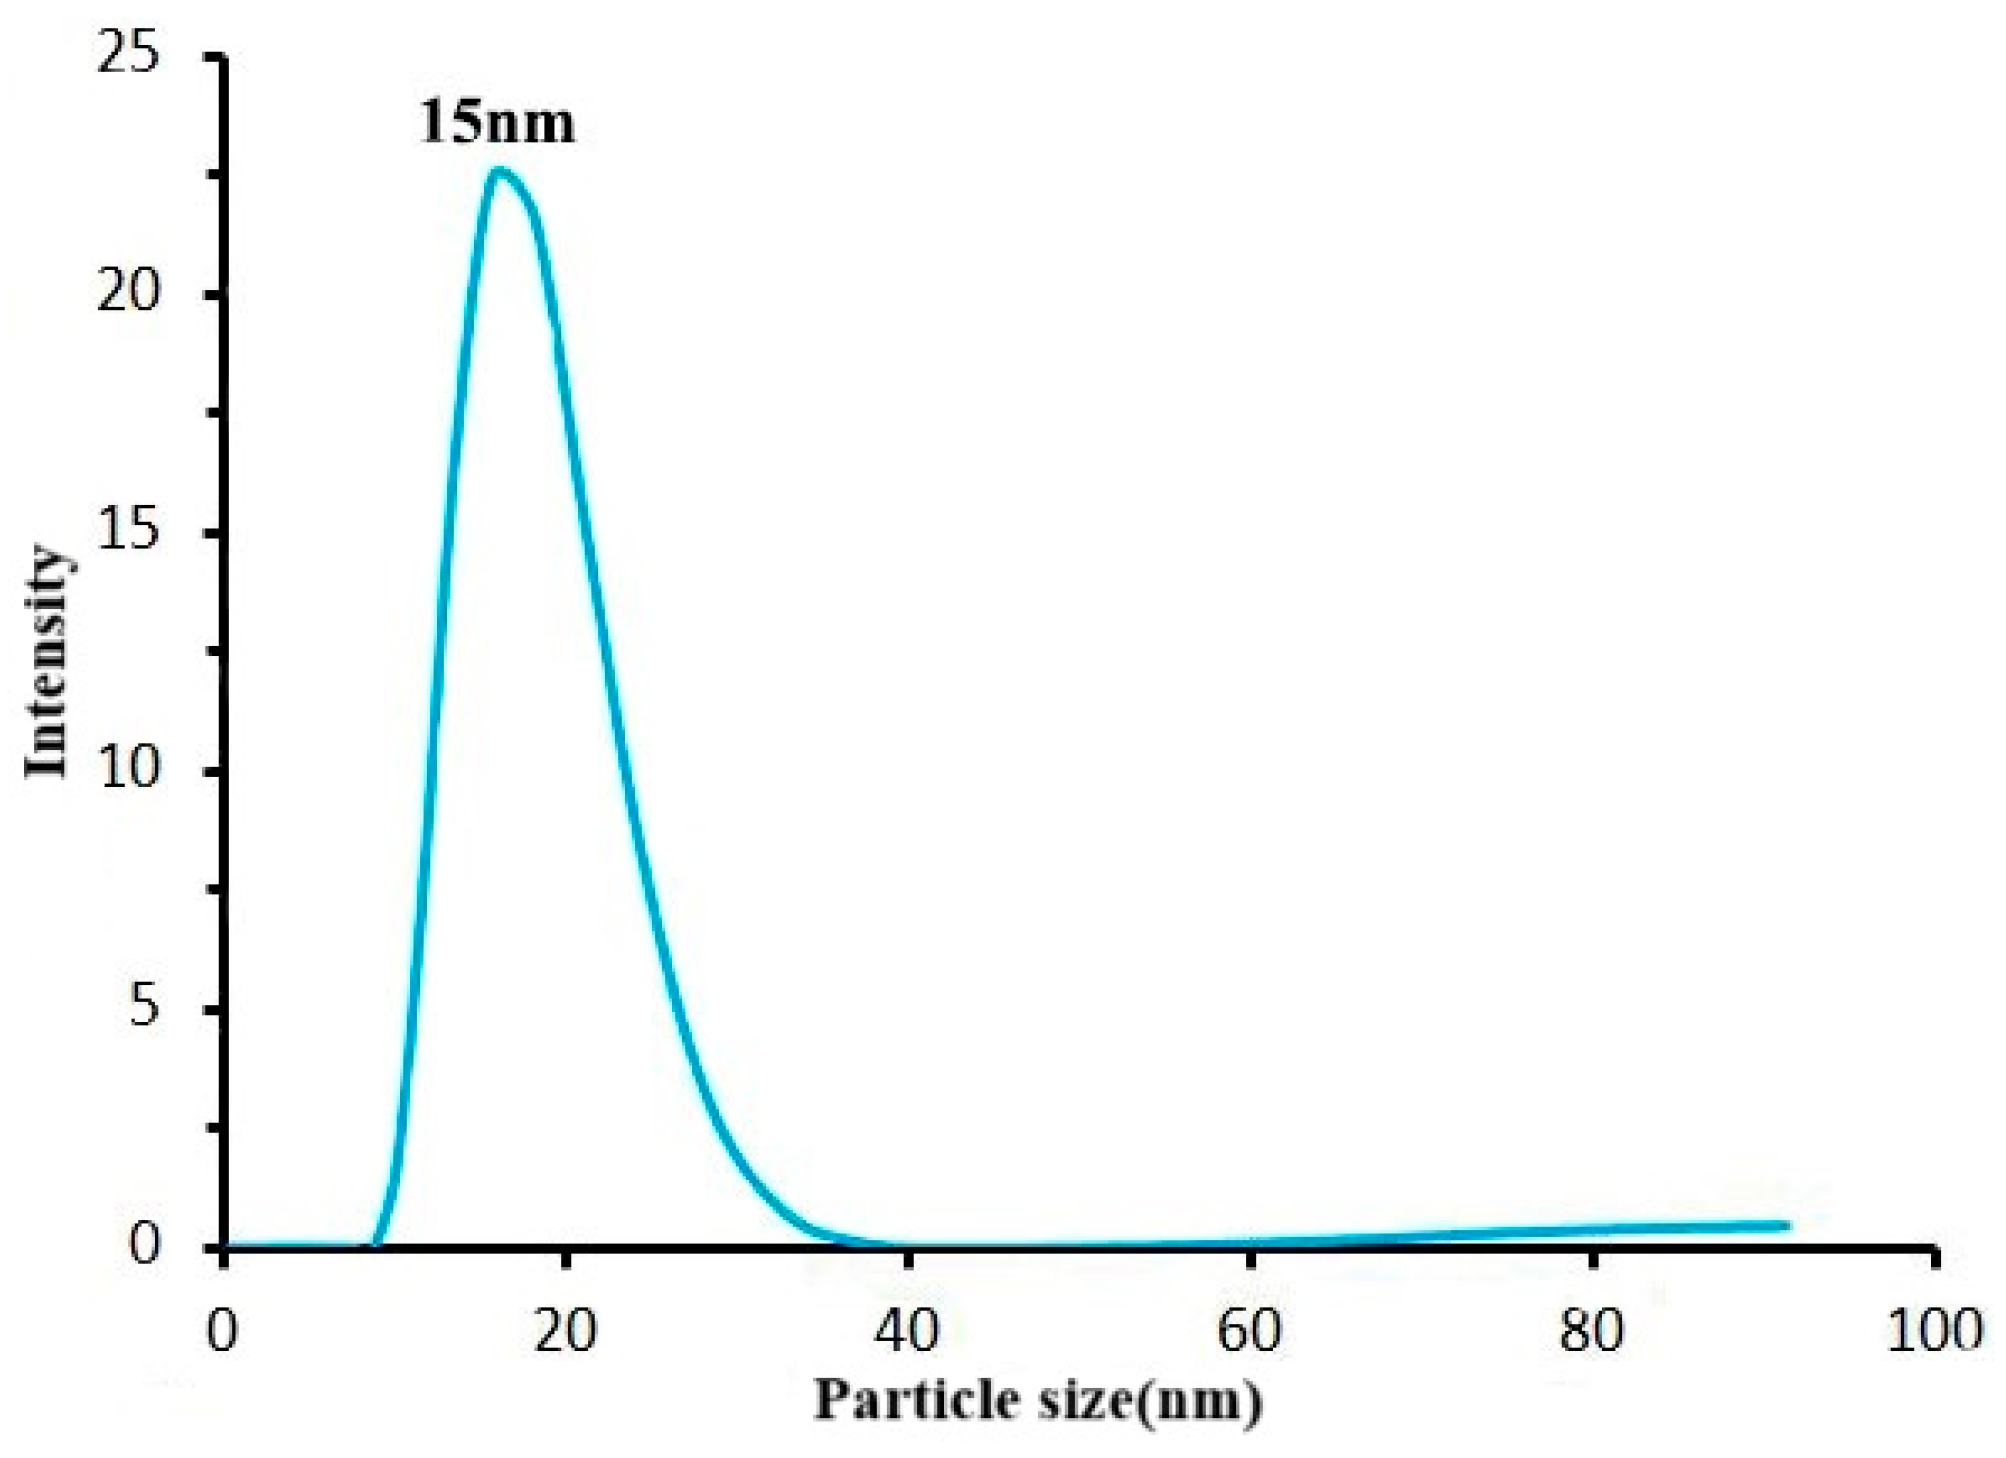
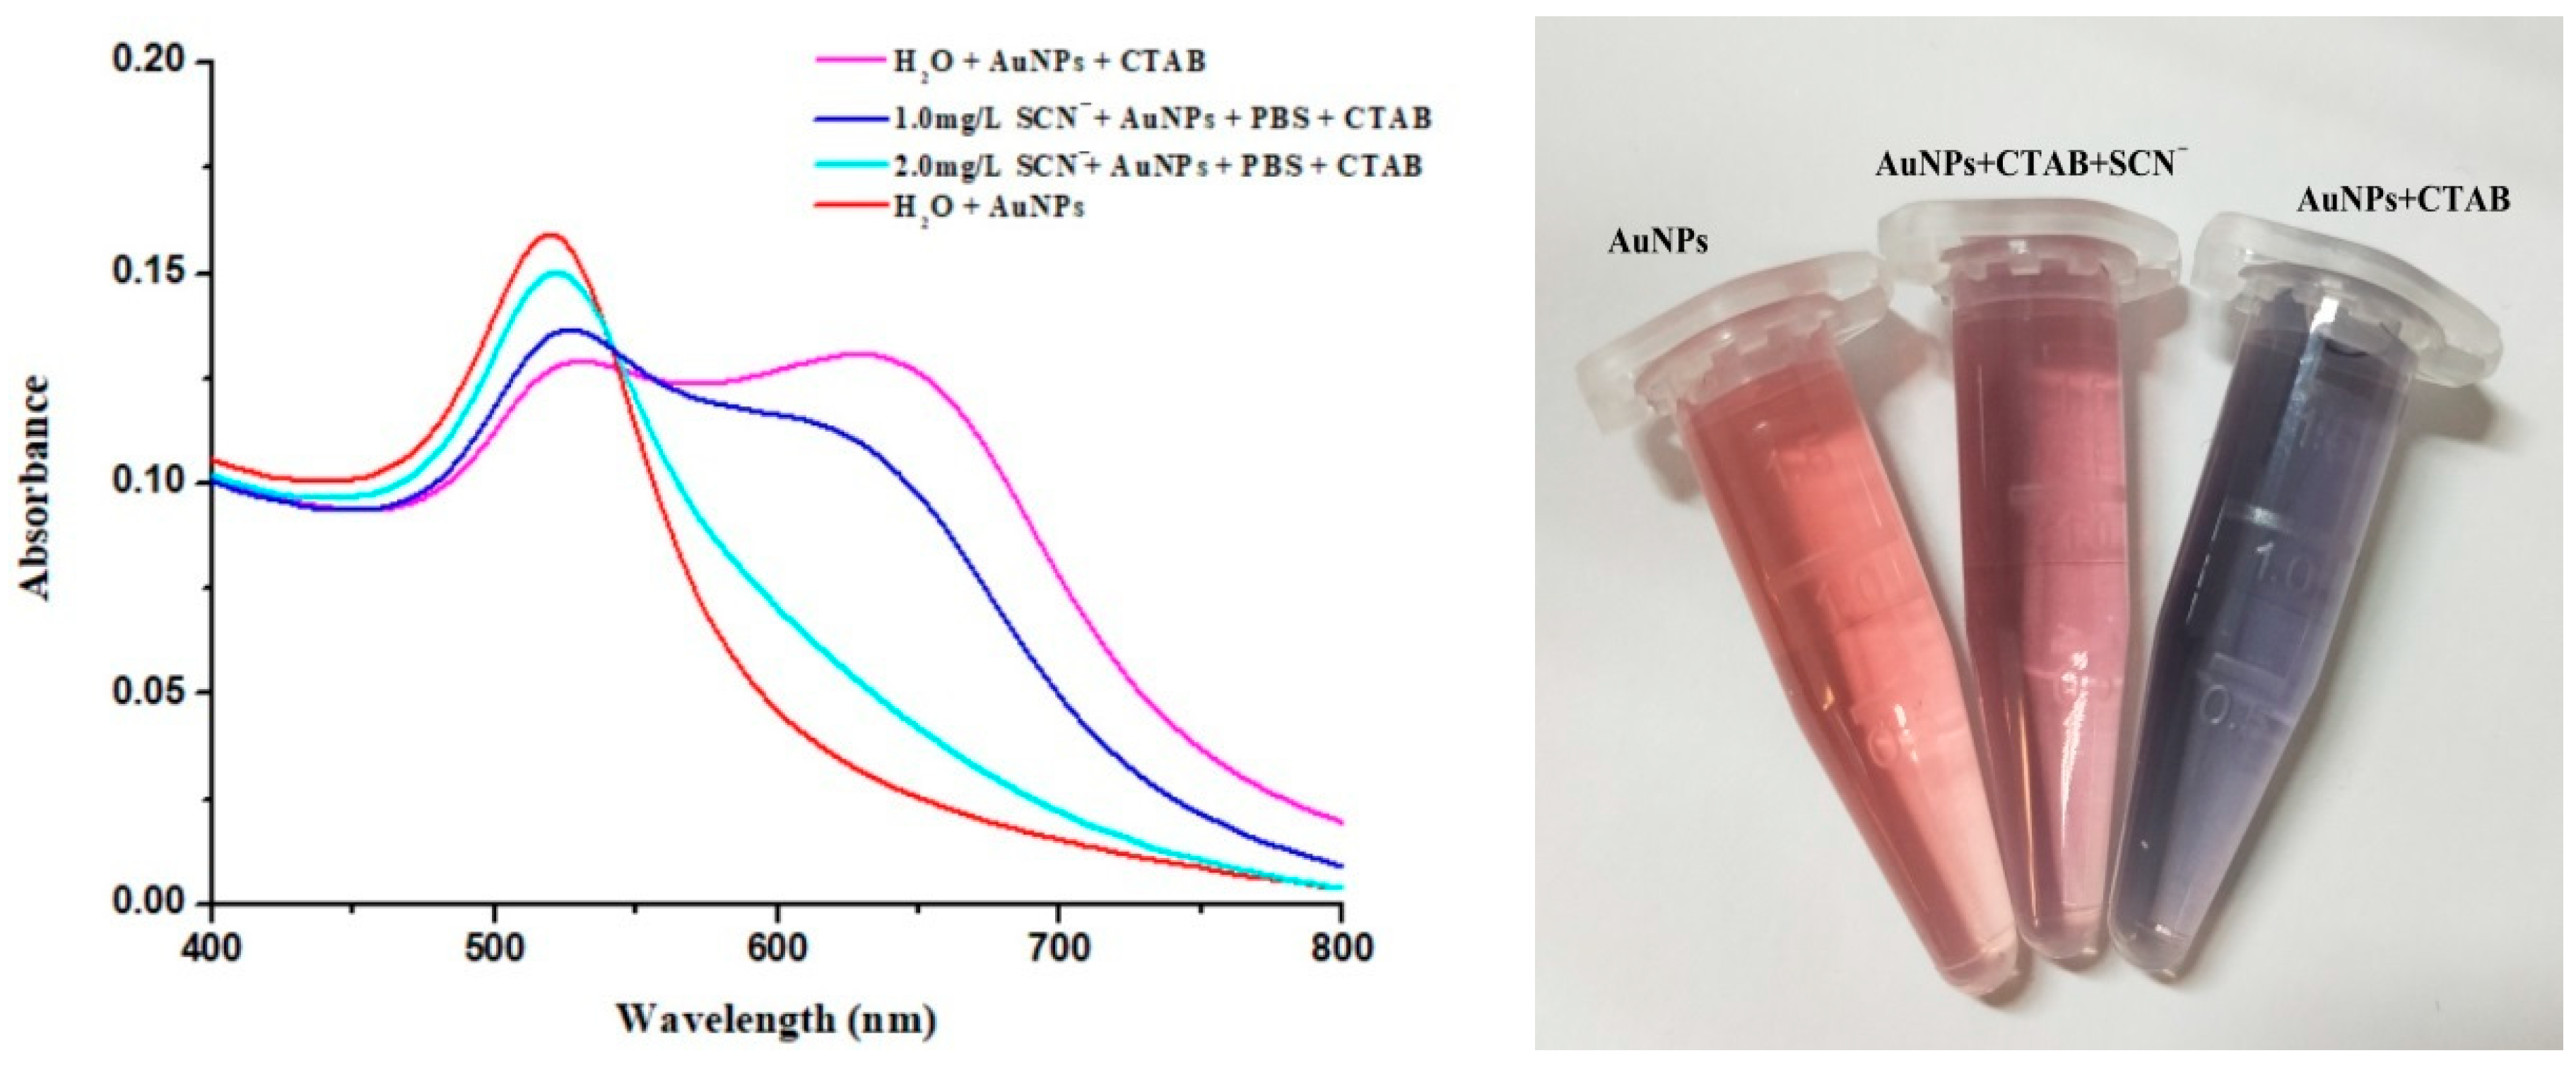
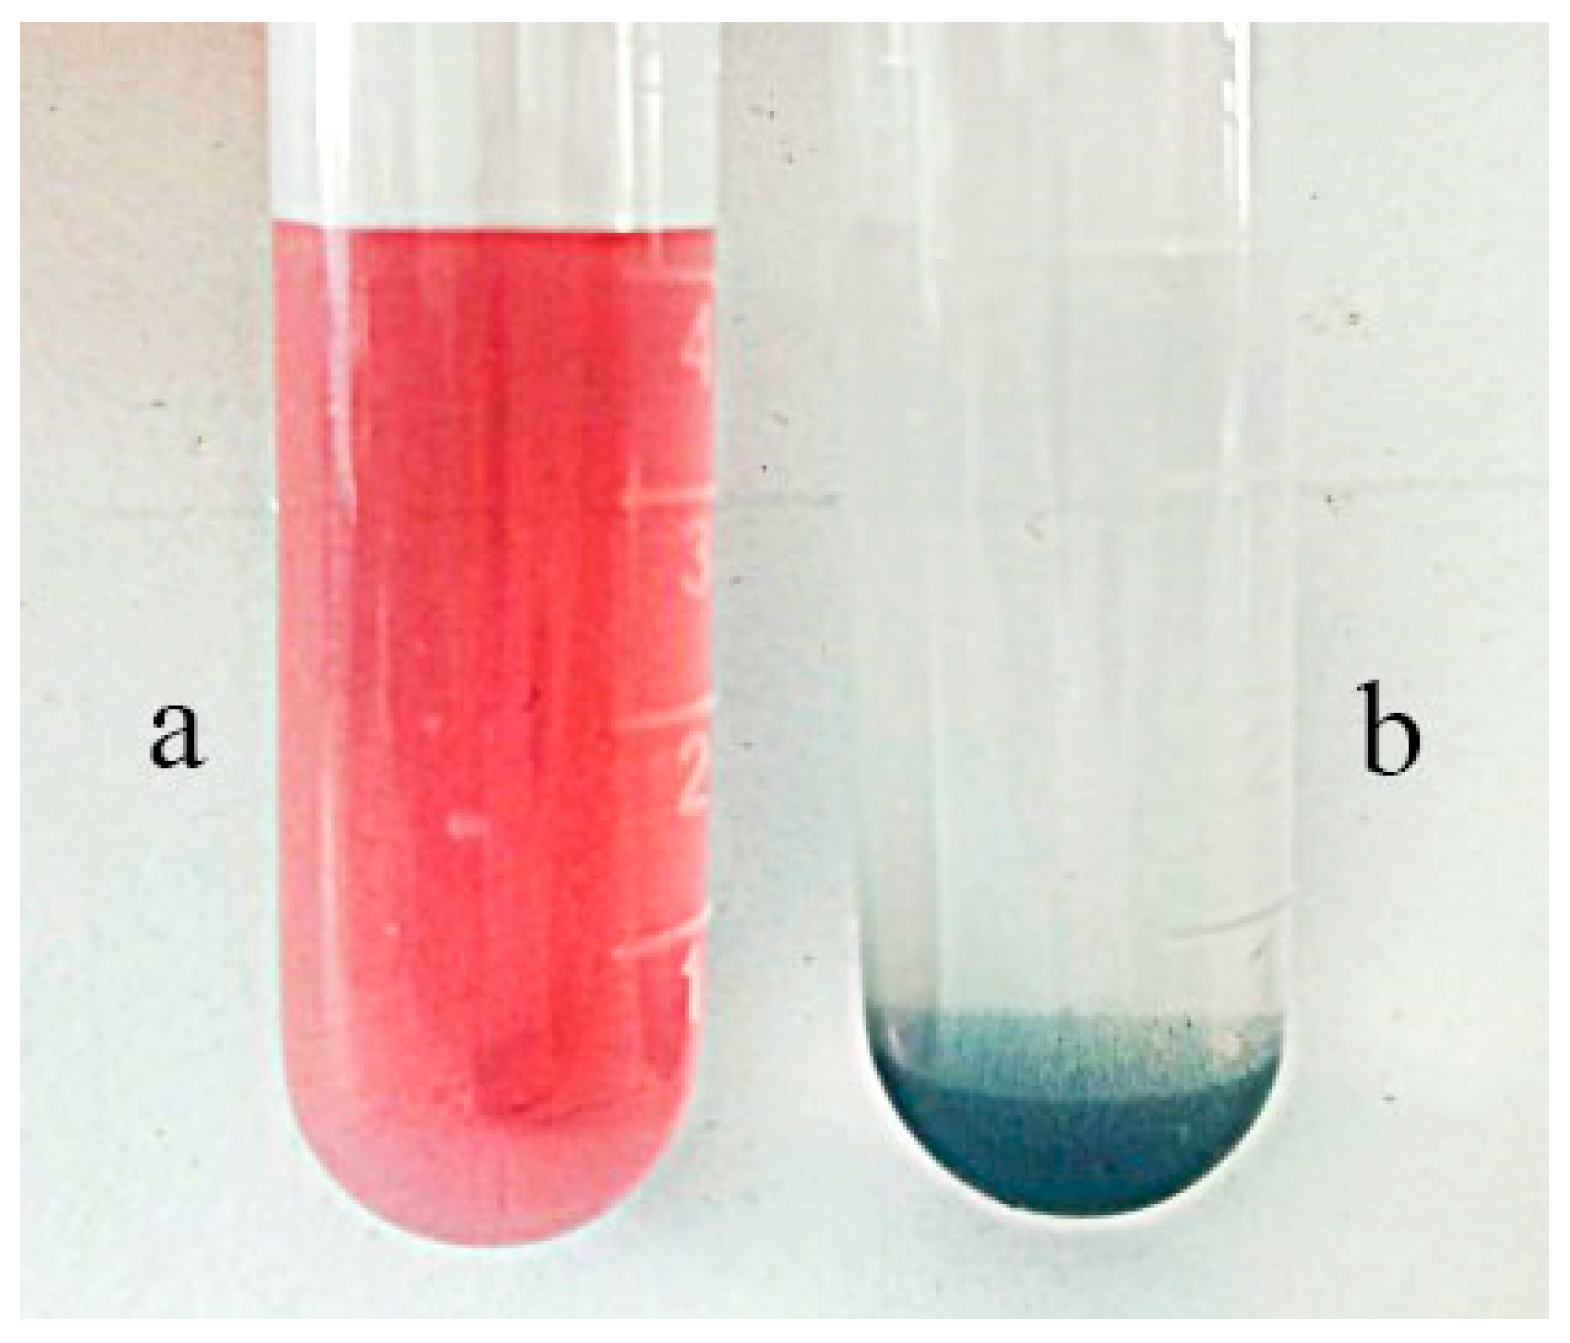
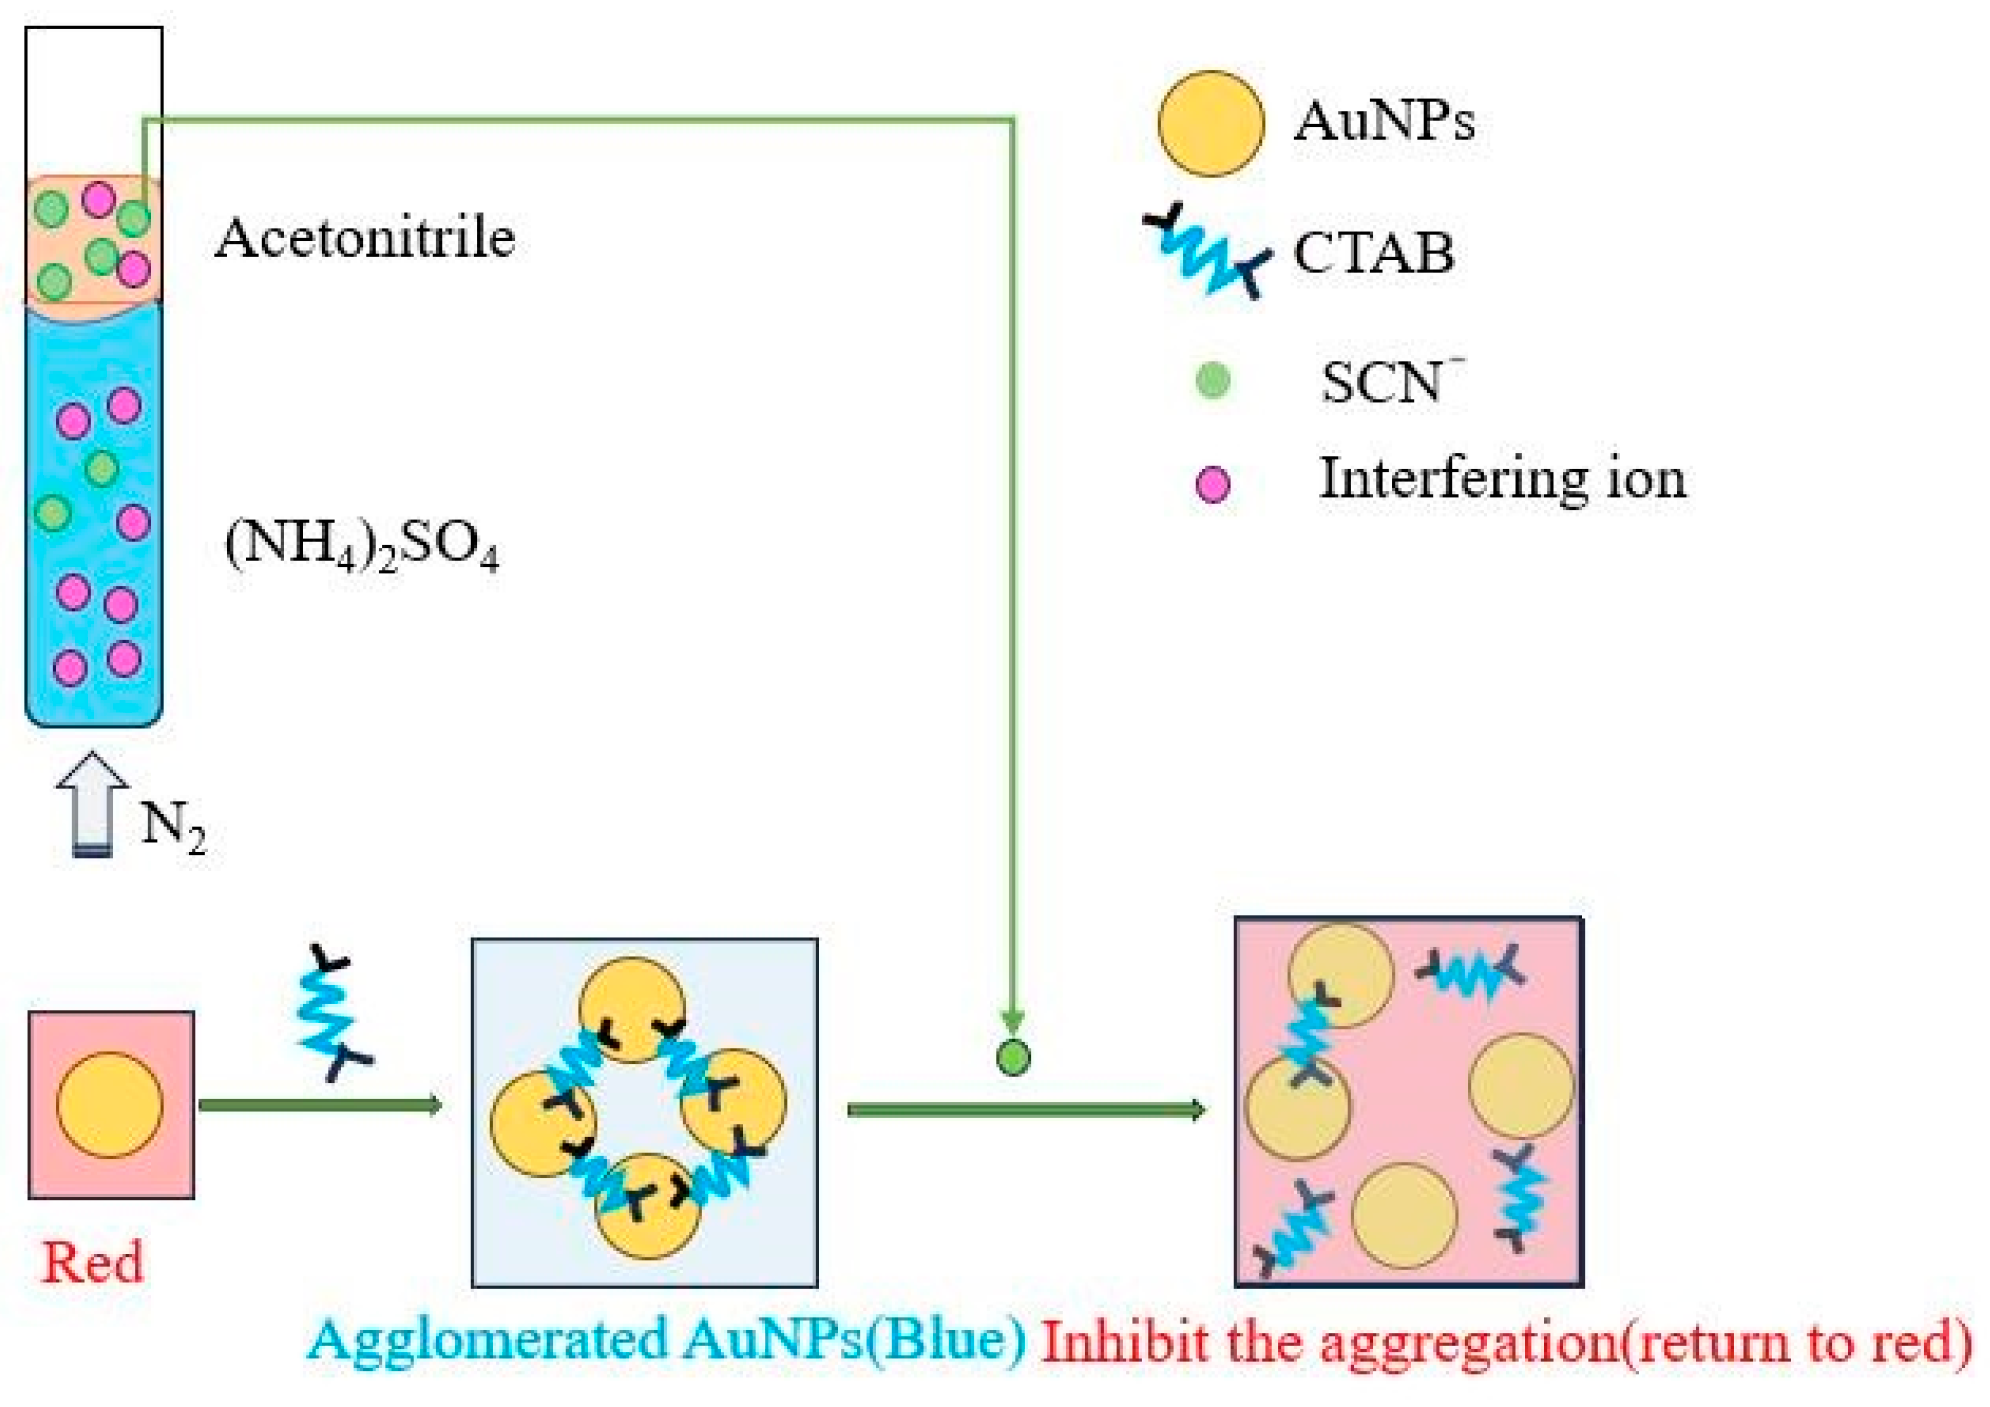
It had been shown that gold nanoparticles encapsulated in sodium citrate with a particle size of 13 ± 2 nm had a higher sensitivity for the determination of SCN [25]. Figure 11 illustrates that the particle size of AuNPs used in this study was 15 nm. As shown in Figure 12, when the solution contained only AuNPs, the solution had a characteristic adsorption peak at 520 nm when the solution contained only AuNPs, and the color of the solution was red. When CTAB was added to the AuNP solution, the intensity of the adsorption peak at 520 nm decreased, while the absorption peak at 630 nm appeared. At this time, the color of the solution changed from red to blue. As shown in Figure 13, the AuNP solution and AuNP solution with CTAB showed a clear color change after standing for 6 h, and a blue precipitate was produced, as shown in Figure 13b, which demonstrated that CTAB had the ability to induce the aggregation of AuNPs. Furthermore, the addition of SCN− would decrease the adsorption intensity at 630 nm and show a dosage-dependent relationship, which indicated that the adsorption of SCN− on the surface of AuNPs could prevent the aggregation effect of CTAB on AuNPs. Therefore, the degree of AuNP aggregation could be expressed by the ratio of A630/A520, which was similar to the results of previous studies [33,34]. The process of SCN− extraction and colorimetric determination is shown in Figure 14.
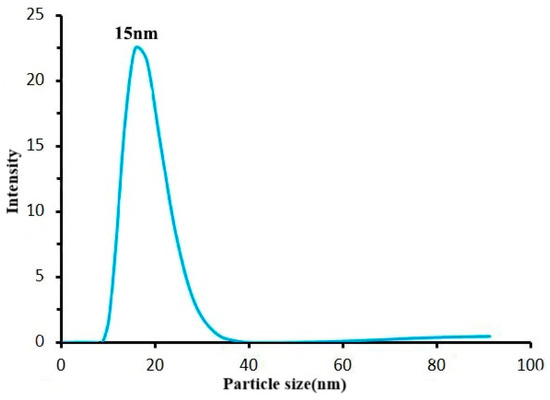
Figure 11.
Particle size analysis of AuNPs.
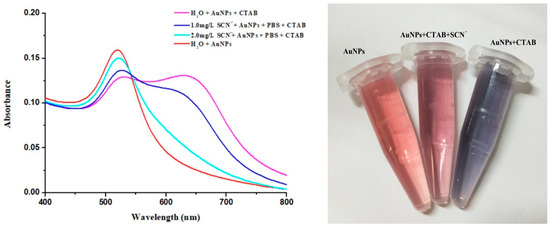
Figure 12.
Ultraviolet absorption spectra and color changes in AuNPs.

Figure 13.
Changes in AuNPs solution after standing for 6 h: (a) AuNPs solution and (b) AuNPs solution with CTAB.

Figure 14.
The diagram of ATPF-AuNPs colorimetry.
3.7.2. TEM Explores Detection Mechanisms
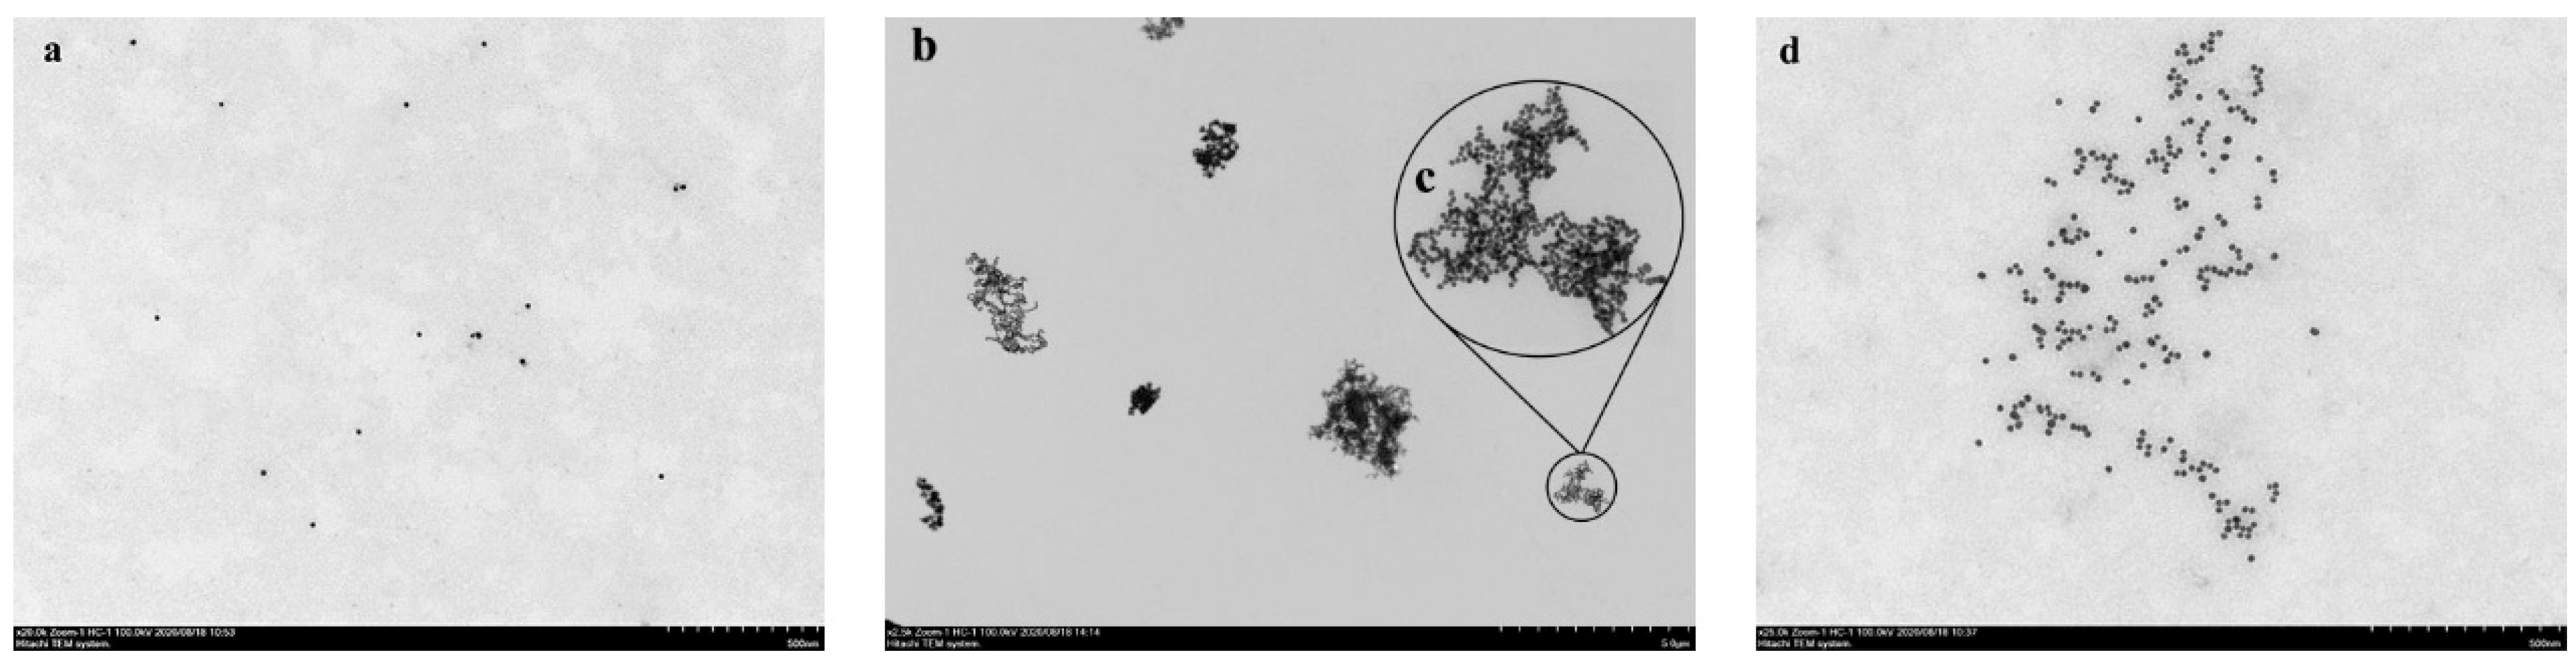
Figure 15 shows the TEM analysis of AuNPs after the addition of different substances. Figure 15a shows that the AuNPs were in a dispersed state without aggregation. Figure 15b demonstrates that the AuNPs were in a high degree of aggregation with CTAB. As shown in Figure 15c, CTAB caused the AuNP particles to associate with each other and aggregate to clusters. Figure 15d is the TEM image when the SCN− was added into the AuNP solution with CTAB. There were some AuNP particles in a dispersed state, while other AuNP particles were interconnected with the slight aggregation. In summary, the adsorption of SCN− on the surface of AuNPs could achieve the protective effect on AuNPs, thus preventing the occurrence of interparticle aggregation. Therefore, it is feasible to perform the determination of SCN− based on this mechanism.
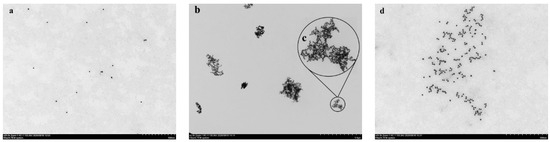
Figure 15.
TEM images of AuNPs: (a) only AuNPs, (b) AuNPs with CTAB, (c) partial enlarged image of (b,d) AuNPs with CTAB and SCN−.
3.8. Standard Curve Plotting
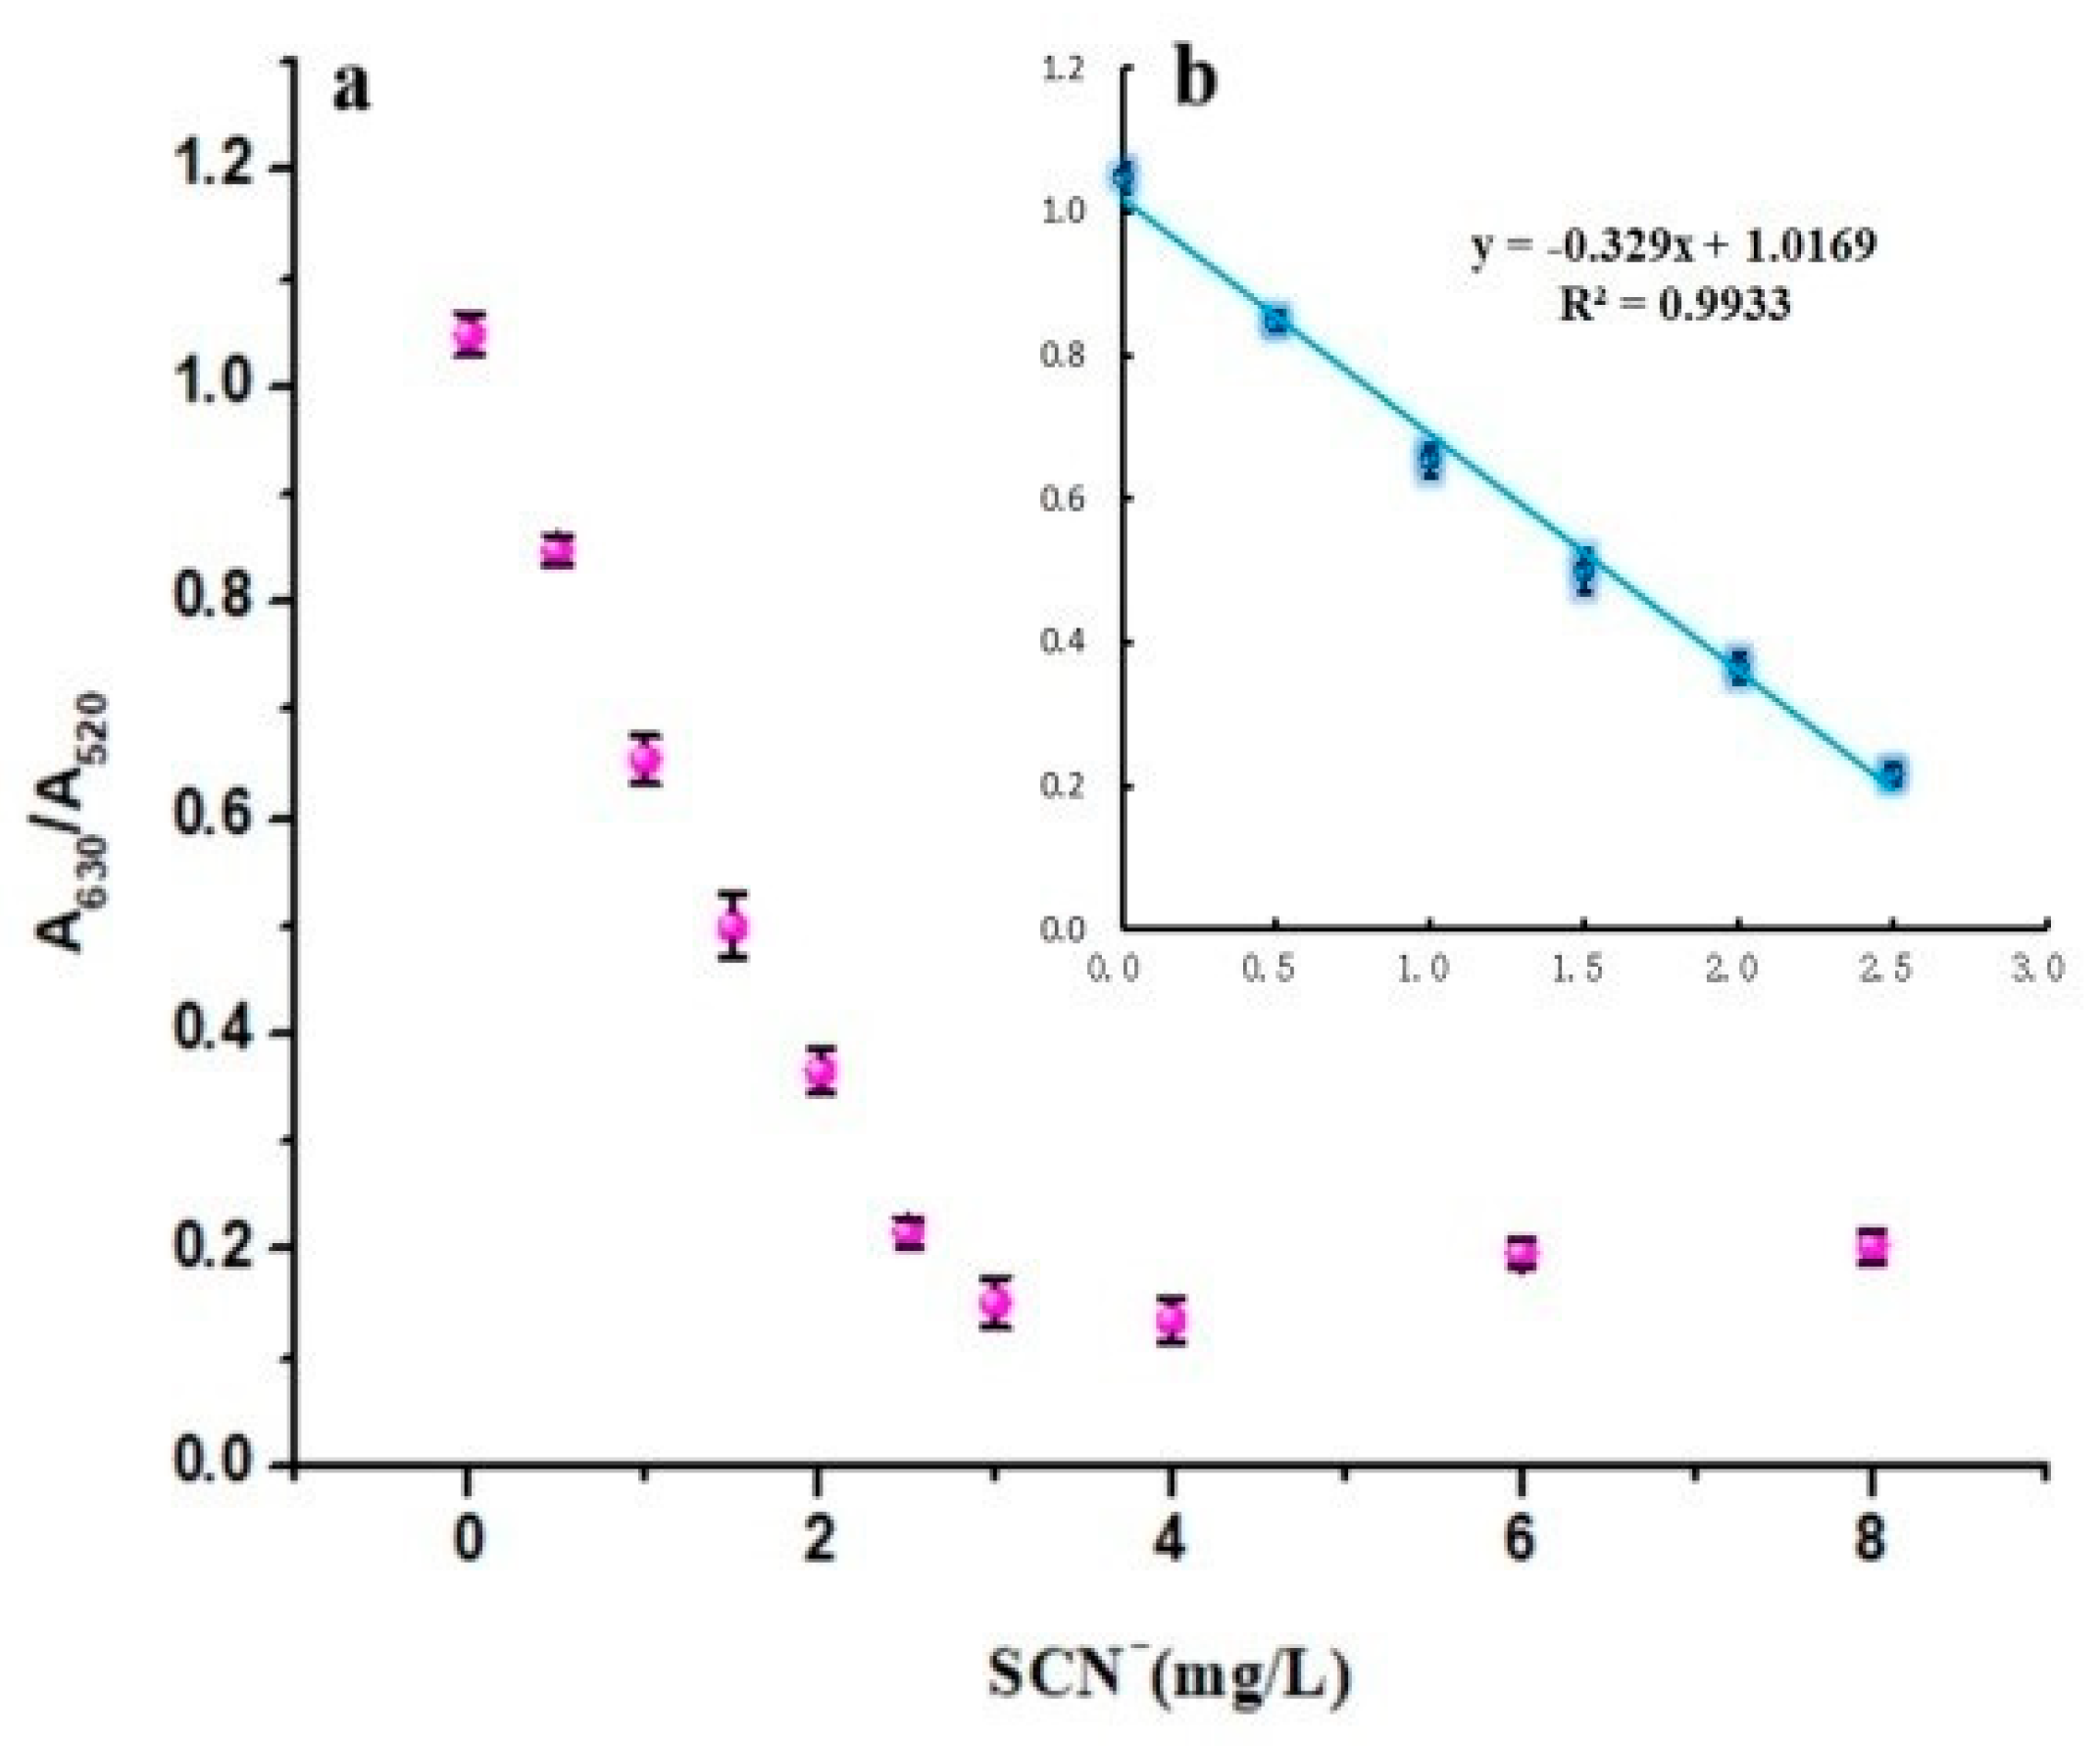
As shown in Figure 16, based on the results of the absorbance ratio measurements, the A630/A520 value gradually decreased in the range of 0–4 mg/L. A further increase in the SCN− concentration would not cause significant changes in the A630/A520 value, which indicated that the saturation point of the reaction had been reached. In addition, the linear relationship between the SCN− concentration and A630/A520 value was measured in the concentration range of 0–2.5 mg/L. The linear equation was y = −0.329x + 1.0169, and the linear correlation coefficient, R2, was 0.9933, which showed a great linear relationship.

Figure 16.
(a) Effect of SCN− concentrations on A630/A520 (b) standard curve for determination of SCN−.
3.9. Limit of Detection, Limit of Quantification and Relative Standard Deviation
According to the method for determining of the limit of detection (LOD) specified by IUPAC, the relative standard deviation (RSD) of the extraction rate obtained from consecutive determinations of samples under optimal extraction and detection conditions was the precision of the method. The LOD of the method was 0.0919 mg/L, and the limit of quantification (LOQ) was 0.306 mg/L. The precision of the method was 5.3%. All data indicated that the experiment was of good precision and feasibility.
3.10. Interference Analysis
An interference analysis was an important step in the evaluation of the performance of the determination, as it allowed the degree of interference of the interfering substance with the determination to be analyzed. Therefore, the interference of various possible coexisting anions, metal cations and amino acids was investigated. The A630/A520 values when only SCN− was present were used as a control, and then the relative A630/A520 values were 100%; the relative A630/A520 values for the remaining interfering substances are shown in Table 5. All of the anions and amino acids responded similarly to the control signal with minor changes, with relative A630/A520 values around 100% and deviations within 5%, and the effects of these interfering substances were negligible in the detection. Most of these metal ions interfered with the determination, such as Mn2+, Ag+, Ni2+, Ga3+, Zn2+, Fe3+, Cu2+, Cd2+, Al3+ and Hg2+. Among them, SCN− can complex or combine with Mn2+, Ag+, Zn2+, Fe3+, Cu2+, Cd2+, Al3+ and Hg2+ metal cations to produce precipitation, which reduced the amount of SCN- adsorption on the surface of AuNPs, thus reducing the protection of SCN− on AuNPs particles and increasing the degree of aggregation, so that the A630/A520 value increased, and the relative A630/A520 values were all greater than 100%. However, there were almost no metal ions present in the raw milk. Therefore, we designed the experiment to investigate the accuracy of the ATPF-AuNPs colorimetric method for the detection of SCN in the presence of Fe3+, Cu2+, Al3+, I− and amino acids. The results showed that most of the interfering ions can be separated from SCN− and retained in the bottom phase by ATPF. However, the interaction between SCN− and other ions was inevitable, resulting in the low detection level of SCN−. The results showed that most of the interfering ions can be separated from SCN− and retained in the bottom phase by ATPF. However, the interaction between SCN− and other ions was inevitable, which led to the low detection amount of SCN−. Although amino acids and SCN− would transfer to the top phase together, the detection of SCN− was not affected basically. Combined with interference experiments, it was shown that our method had excellent selectivity for SCN− detection of most common anions and amino acids.
Table 5.
The influence of different substances on the degree of aggregation of AuNPs in the coexistence of SCN−.
In order to verify the accuracy of the ATPF-AuNPs colorimetric method in real samples, separate spiked recovery experiments were performed on SCN− in raw milk samples. The three levels of SCN− spiked in the raw milk samples were separated and concentrated by ATPF, and then the top-phase solution was diluted 10 times for determination. Each level was measured in three parallel groups, and the mean of the ten determinations of 1.23 mg/kg was used as the amount of SCN− in the sample blanks to calculate the recovery for each spiked level. As shown in Table 6, the recoveries of the spiked levels ranged from 80.91% to 101.25%, with a relative standard deviation (RSD) of 2.92–9.25%, indicating the high reliability of the method for the determination of SCN− in raw milk.
Table 6.
Result of spike recovery experiment.
3.11. Method Limitation Analysis
The gold nanoparticle colorimetry could easily and quickly detect SCN− with a good detection limit. However, the process of preparing gold nanoparticles by reducing metal salts is not environmentally sustainable, and its high cost is not in line with the concept of green chemistry. In addition, a variety of coexisting interfering cations in complex substrates will affect the accuracy of the detection of SCN−. Furthermore, compared with other methods such as fluorescence, the sensitivity of this method needs to be improved. Therefore, finding a green and sustainable synthesis method, optimizing the pre-treatment process of the target to improve the specificity of detection and exploring a new signal amplification method will be the focus of future work.
4. Conclusions
In this study, an acetonitrile/(NH4)2SO4 ATPF-AuNPs colorimetric method was developed for the separation and determination of SCN− in raw milk. Under the optimal separation conditions, the CF and Y of SCN− were 10.96 and 103.34%, respectively. The detection conditions of CTAB concentration, pH and reaction time were optimized by single-factor experiments. The color-change mechanism based on the “aggregation–anti-aggregation” of SCN− was investigated by UV-vis and TEM. Under the optimal conditions, the method showed a linear relationship between the SCN− concentration and the A630/A520 value in the SCN− concentration range of 0–2.5 mg/L, with a linear correlation coefficient R2 of 0.9933. The LOD for SCN− was 0.0919 mg/L, the LOQ was 0.306 mg/L, the precision was 5.3% and the spiked recovery was 80.91–101.25%. Although nanoparticle-based colorimetry faced several challenges that need to be addressed, it was considered to be the most easy, simple and rapid method to use to detect ions. This study provided an efficient method for the trace analysis of SCN− in raw milk and provided a basis for the future development of a dedicated compact rapid detector, as well as a new technical tool for the field of anion pre-treatment.
Author Contributions
Data curation, H.Y., X.F. and J.W.; formal analysis, H.Y., X.F. and Y.F.; funding acquisition, B.J.; investigation, H.Y. and X.F.; methodology, B.J., D.L. and C.L.; project administration, B.J. and D.L.; writing—original draft, B.J., H.Y. and X.F.; writing—review and editing, B.J. and D.L. All authors have read and agreed to the published version of the manuscript.
Funding
This research was funded by National Key Research and Development Program of China (2018YFC1604204).
Data Availability Statement
Data are available within the article.
Conflicts of Interest
The authors declare that they have no known competing financial interest or personal relationships that could have appeared to influence the work reported in this paper.
References
- Yong, L.; Wang, Y.; Yang, D.; Liu, Z.; Abernethy, G.; Li, J. Investigation of concentration of thiocyanate ion in raw cow’s milk from China, New Zealand and the Netherlands. Food Chem. 2017, 215, 61–66. [Google Scholar] [CrossRef]
- Yu, P.; Deng, M.; Yang, Y.; Nie, B.; Zhao, S. 3D Microfluidic Devices in a Single Piece of Paper for the Simultaneous Determination of Nitrite and Thiocyanate. Sensors 2020, 20, 4118. [Google Scholar] [CrossRef]
- Sun, J.; Lu, Y.; He, L.; Pang, J.; Yang, F.; Liu, Y. Colorimetric sensor array based on gold nanoparticles: Design principles and recent advances. TrAC Trends Anal. Chem. 2020, 122, 115754. [Google Scholar] [CrossRef]
- Deng, H.-H.; Wu, C.-L.; Liu, A.-L.; Li, G.-W.; Chen, W.; Lin, X.-H. Colorimetric sensor for thiocyanate based on anti-aggregation of citrate-capped gold nanoparticles. Sens. Actuators B-Chem. 2014, 191, 479–484. [Google Scholar] [CrossRef]
- Kumari, Y.; Kaur, G.; Kumar, R.; Singh, S.K.; Gulati, M.; Khursheed, R.; Clarisse, A.; Gowthamarajan, K.; Karri, V.V.S.N.R.; Mahalingam, R.; et al. Gold nanoparticles: New routes across old boundaries. Adv. Colloid Interface Sci. 2019, 274, 102037. [Google Scholar] [CrossRef]
- Sibuyi, N.R.S.; Moabelo, K.L.; Fadaka, A.O.; Meyer, S.; Onani, M.O.; Madiehe, A.M.; Meyer, M. Multifunctional gold nanoparticles for improved diagnostic and therapeutic applications: A review. Nanoscale Res. Lett. 2021, 16, 174. [Google Scholar] [CrossRef] [PubMed]
- Malik, S.; Niazi, M.; Khan, M.; Rauff, B.; Anwar, S.; Amin, F.; Hanif, R. Cytotoxicity Study of Gold Nanoparticle Synthesis Using Aloe vera, Honey, and Gymnema sylvestre Leaf Extract. ACS Omega 2023, 8, 6325–6336. [Google Scholar] [CrossRef]
- Ahmed, S.; Ahmad, M.; Swami, B.L.; Ikram, S. A review on plants extract mediated synthesis of silver nanoparticles for antimicrobial applications: A green expertise. J. Adv. Res. 2016, 7, 17–28. [Google Scholar] [CrossRef]
- Gavrilenko, N.A.; Volgina, T.N.; Gavrilenko, M.A. Colorimetric sensor for determination of thiocyanate in fossil and drill waters. Mendeleev Commun. 2017, 27, 529–530. [Google Scholar] [CrossRef]
- Gong, B.; Shen, Y.; Li, H.; Li, X.; Huan, X.; Zhou, J.; Chen, Y.; Wu, J.; Li, W. Thermo-responsive polymer encapsulated gold nanorods for single continuous wave laser-induced photodynamic/photothermal tumour therapy. J. Nanobiotechnol. 2021, 19, 41. [Google Scholar] [CrossRef]
- Simon, J.; Udayan, S.; Nampoori, V.P.N.; Kailasnath, M. Investigations on nonlinear optical properties and thermal diffusivity of gold nanoparticle embedded protein complex. Opt. Laser Technol. 2021, 138, 106859. [Google Scholar] [CrossRef]
- Zhao, D.; Chen, C.; Lu, L.; Yang, F.; Yang, X. A dual-mode colorimetric and fluorometric “light on” sensor for thiocyanate based on fluorescent carbon dots and unmodified gold nanoparticles. Analyst 2015, 140, 8157–8164. [Google Scholar] [CrossRef] [PubMed]
- Show, P.L.; Tan, C.P.; Anuar, M.S.; Ariff, A.; Yusof, Y.A.; Chen, S.K.; Ling, T.C. Direct recovery of lipase derived from Burkholderia cepacia in recycling aqueous two-phase flotation. Sep. Purif. Technol. 2011, 80, 577–584. [Google Scholar] [CrossRef]
- Mat Aron, N.S.; Chew, K.W.; Ang, W.L.; Ratchahat, S.; Rinklebe, J.; Show, P.L. Recovery of microalgae biodiesel using liquid biphasic flotation system. Fuel 2022, 317, 123368. [Google Scholar] [CrossRef]
- Sankaran, R.; Parra Cruz, R.A.; Show, P.L.; Haw, C.Y.; Lai, S.H.; Ng, E.; Ling, T.C. Recent advances of aqueous two-phase flotation system for the recovery of biomolecules. Fluid Phase Equilibria 2019, 501, 112271. [Google Scholar] [CrossRef]
- Al Sadat Shafiof, M.; Nezamzadeh-Ejhieh, A. A comprehensive study on the removal of Cd (II) from aqueous solution on a novel pentetic acid-clinoptilolite nanoparticles adsorbent: Experimental design, kinetic and thermodynamic aspects. Solid State Sci. 2020, 99, 106071. [Google Scholar] [CrossRef]
- Lee, S.; Khoiroh, I.; Ling, T.; Show, P. Enhanced recovery of lipase derived from Burkholderia cepacia from fermentation broth using recyclable ionic liquid/polymer-based aqueous two-phase systems. Sep. Purif. Technol. 2017, 179, 152–160. [Google Scholar] [CrossRef]
- Lin, Y.K.; Show, P.L.; Yap, Y.J.; Tan, C.P.; Ng, E.-P.; Ariff, A.B.; Annuar, M.S.B.M.; Ling, T.C. Direct recovery of cyclodextringlycosyltransferase from Bacillus cereus using aqueous two-phase flotation. J. Biosci. Bioeng. 2015, 120, 684–689. [Google Scholar] [CrossRef] [PubMed]
- Xia, J.; Ni, L.; Han, J.; Wang, Y.; Li, Y.; Li, Y.; Tian, Y. Simultaneous aqueous two-phase flotation of sodium chlorophyllin and removal of sugars from saponified solution of bamboo leaves. Chem. Eng. Process-Process Intensif. 2016, 101, 41–49. [Google Scholar] [CrossRef]
- Sidek, N.L.M.; Tan, J.S.; Abbasiliasi, S.; Wong, F.W.F.; Mustafa, S.; Ariff, A.B. Aqueous two-phase flotation for primary recovery of bacteriocin-like inhibitory substance (BLIS) from Pediococcus acidilactici Kp10. J. Chromatogr. B-Anal. Technol. Biomed. Life Sci. 2016, 1027, 81–87. [Google Scholar] [CrossRef]
- Zhou, S.; Liu, M.; Chen, B.; Sun, L.; Lu, H. Microbubble-and nanobubble-aeration for upgrading conventional activated sludge process: A review. Bioresour. Technol. 2022, 362, 127826. [Google Scholar] [CrossRef]
- Jiang, B.; Na, J.; Wang, L.; Li, D.; Liu, C.; Feng, Z. Reutilization of Food Waste: One-Step Extration, Purification and Characterization of Ovalbumin from Salted Egg White by Aqueous Two-Phase Flotation. Foods 2019, 8, 286. [Google Scholar] [CrossRef]
- Jiang, B.; Yue, H.; Fu, X.; Wang, J.; Feng, Y.; Li, D.; Liu, C.; Feng, Z. One-step high efficiency separation of prolyl endopeptidase from Aspergillus niger and its application. Int. J. Biol. Macromol. 2024, 271, 132582. [Google Scholar] [CrossRef]
- Frens, G. Controlled Nucleation for the Regulation of the Particle Size in Monodisperse Gold Suspensions. Nat. Phys. Sci. 1973, 241, 20–22. [Google Scholar] [CrossRef]
- Song, J.; Huang, P.-C.; Wan, Y.-Q.; Wu, F.-Y. Colorimetric detection of thiocyanate based on anti-aggregation of gold nanoparticles in the presence of cetyltrimethyl ammonium bromide. Sens. Actuators B-Chem. 2016, 222, 790–796. [Google Scholar] [CrossRef]
- Han, B.; Chen, P.; Guo, J.; Yu, H.; Zhong, S.; Li, D.; Liu, C.; Feng, Z.; Jiang, B. A novel intelligent indicator film: Preparation, characterization, and application. Molecules 2023, 28, 3384. [Google Scholar] [CrossRef]
- Yang, G.; Li, F.; Zhang, H.; Yan, H.; Gao, S.; Fu, Y.; Ye, F. Electrospinning for producing antifungal nanofibers consisting of prochloraz/hydroxypropyl-γ-cyclodextrin inclusion complex. Ind. Crops Prod. 2024, 211, 118282. [Google Scholar] [CrossRef]
- Zhuang, J.; Yang, W.; Chen, X.; Jiao, F. Enantioseparation of Phenylsuccinic Acid Enantiomers Using Aqueous Two-Phase Flotation and Their Determination by HPLC and UV Detection. Chromatographia 2014, 77, 679–685. [Google Scholar] [CrossRef]
- Du, M.; Wang, J.; Dong, F.; Wang, Z.; Yang, F.; Tan, H.; Fu, K.; Wang, W. The study on the effect of flotation purification on the performance of α-hemihydrate gypsum prepared from phosphogypsum. Sci. Rep. 2022, 12, 95. [Google Scholar] [CrossRef] [PubMed]
- Han, J.; Cai, Y.; Wang, L.; Mao, Y.; Ni, L.; Wang, Y. A high efficiency method combining metal chelate ionic liquid-based aqueous two-phase flotation with two-step precipitation process for bromelain purification. Food Chem. 2020, 309, 125749. [Google Scholar] [CrossRef]
- Li, J.; Liu, Y.; Lin, H.; Chen, Y.; Liu, Z.; Zhuang, X.; Tian, C.; Fu, X.; Chen, L. Label-free exonuclease I-assisted signal amplification colorimetric sensor for highly sensitive detection of kanamycin. Food Chem. 2021, 347, 128988. [Google Scholar] [CrossRef]
- Feng, Y.; Mo, R.; Wang, L.; Zhou, C.; Hong, P.; Li, C. Surface Enhanced Raman Spectroscopy Detection of Sodium Thiocyanate in Milk Based on the Aggregation of Ag Nanoparticles. Sensors 2019, 19, 1363. [Google Scholar] [CrossRef]
- Díaz-García, V.; Contreras-Trigo, B.; Rodríguez, C.; Coelho, P.; Oyarzún, P. A Simple Yet Effective Preanalytical Strategy Enabling the Application of Aptamer-Conjugated Gold Nanoparticles for the Colorimetric Detection of Antibiotic Residues in Raw Milk. Sensors 2022, 22, 1281. [Google Scholar] [CrossRef]
- Feng, Y.; Liu, G.; La, M.; Liu, L. Colorimetric and Electrochemical Methods for the Detection of SARS-CoV-2 Main Protease by Peptide-Triggered Assembly of Gold Nanoparticles. Molecules 2022, 27, 615. [Google Scholar] [CrossRef]


Disclaimer/Publisher’s Note: The statements, opinions and data contained in all publications are solely those of the individual author(s) and contributor(s) and not of MDPI and/or the editor(s). MDPI and/or the editor(s) disclaim responsibility for any injury to people or property resulting from any ideas, methods, instructions or products referred to in the content. |
© 2024 by the authors. Licensee MDPI, Basel, Switzerland. This article is an open access article distributed under the terms and conditions of the Creative Commons Attribution (CC BY) license (https://creativecommons.org/licenses/by/4.0/).