Abstract
The interest in lipid composition profiling is significantly increasing as research reveals the immense importance of lipids in medicine, plant science, food and agriculture. However, lipidomic analysis requires high-end specialty equipment. We used two-dimensional thin-layer chromatography (2D-TLC) as a readily available, low-cost tool for basic lipidomic profiling of lipid classes in algal samples in the models Chlamydomonas reinhardtii, Auxenochlorella protothecoides, and Euglena gracilis, validating lipid class identification using an LC-MS/MS analysis. Algal lipid extracts were separated on a 2D-TLC plate, and TLC analysis was followed by scraping individual TLC spots off the plate, and a subsequent liquid chromatography separation and tandem mass spectrometry (LC-MS/MS) analysis. For comparison, crude lipid extracts were also injected directly to the LC-MS/MS system. Lipid class annotation was achieved by a combination of accurate mass, retention time information, neutral loss and fragment ion analysis by MS2Analyzer, and by matching spectra to LipidBlast MS/MS library. Overall, we were able to identify 15 lipid classes, and to adequately profile the lipid classes in all three organisms. This TLC method is thus suggested as an accessible tool for lipid class profiling of algal, plant, and food lipids, alike, when a rapid and simple analysis is required, e.g., for screening purposes.
1. Introduction
Lipidomics is an emerging research field with immense significance to all areas of life science, including medicine, plant science, food and agriculture, among others [1]. The direct use of liquid chromatography (LC) and electrospray tandem mass spectrometry (LC-MS/MS) is the dominant form of lipidome analyses today [2]. Among the various forms of LC-MS/MS, use of reversed phase LC and high-resolution accurate mass spectrometry presents the most often used method for comprehensive analysis of lipids [3]. However, such lipidomic analysis tools are costly, in addition to also requiring skilled manpower to operate the instrumentation and interpret the data, as lipid annotation is still a laborious process.
For basic lipid class profiling, thin-layer chromatography (TLC), an established method, has been suggested as a good basic-level alternative. Classically, TLC was suggested as a simple method to separate and visualize lipid classes [4,5]. Two-dimensional TLC (2D-TLC) in particular is used to provide sufficient resolution to various lipid classes [6]. It should also be mentioned that annotation of lipid classes is highly dependent on the specific staining methods and commercially available standards. Moreover, identification of individual compounds cannot be achieved by TLC alone. To investigate the TLC spots in more details, coupling TLC directly with mass spectrometry has been studied [7], but requires specialized devices to introduce the sample from TLC plates directly to MS, or requires desorption-based MS and modified target plates [8,9].
Over the last decade, algae have raised great scientific and industrial interest, as a rich resource for food, feed and bio-diesel, as well as for novel compounds and pharmaceuticals [10]. Algal lipids resemble those of plants, which differ significantly from animal lipids [11]. The most abundant lipids in photosynthetic organisms are glycerolipids, including monogalactosyl diacylglycerol (MGDG), digalactosyl diacylglycerol (DGDG) and sul-foquinovosyldiacylglycerol (SQDG). These are mainly present in the photosynthetic membranes (the thylakoid), and play a role in photosynthesis [12]. Other lipids present in algae include neutral lipids, namely mono, di and triacylglycerols (MG, DG and TG, respectively), which are sometimes present in the cells in the form of oil droplets. Polar lipids in algae include phospholipids such as phosphatidic acid (PA), phosphatidyl choline (PC), phosphatidyl serine (PS), phosphatidyl glycerol (PG), phosphatidyl inositol (PI) and (PE) [13]. At the same time, algae present some unique characteristic lipid molecules, mainly the betaine lipids diacylglycerol-O-(N,N,N-trimethyl)-homoserine (DGTS), diacylglyceryl-hydroxymethyltriethyl-β-alanine (DGTA) and diacylglyceryl carboxy-hydroxymethylcholine (DGCC) [14,15].
The wide variety of lipids in algae made them a good model for the current work. We employed 2D-TLC followed by LC-MS/MS and applied it to the lipid-class profiling of three important photosynthetic species: the green algae Chlamydomonas reinhardtii (CC-125) and Auxenochlorella protothecoides (UTEX 2341, [16]) and the protist Euglena gracilis (UTEX LB 367). C. reinhardtii is a model organism, which has been investigated in the context of the photosynthetic apparatus and genetic engineering [17,18], while E. gracilis and A. protothecoides are promising sources of biofuel [19,20].
The main aim of the current work was thus to establish a method which will enable an initial lipid class analysis using TLC, when advanced liquid chromatography mass spectrometry (LC-MS) instrumentation is not available. Algal lipids were used as a rich source of various lipid classes, and by performing LC-MS/MS annotation we aimed to provide an easy and low-cost reference for basic lipidomic analysis of a wide range of samples, when a high-end LC equipment is unavailable, or for basic sample screening.
2. Materials and Methods
2.1. Algal Cultures
Chlamydomonas reinhardtii strain CC-125 was purchased from the Chlamydomonas Resource Center (http://Chlamycollection.org (accessed on 1 June 2023) and used to prepare stock cultures. These were prepared by inoculating 75 mL sterile TAP media and growing at 23 °C under constant illumination with cool-white fluorescent bulbs at a fluence rate of 70 μmol m−2 s−1 and with continuous shaking (120 rpm). When cells were at 5.0 × 10⁵ cells/mL (counted under a microscope (Microstar IV, Cambridge Instruments, NJ, USA) with a hemocytometer (Hausser Scientific, PA, USA)), 1 mL of stock culture (5.0 × 10⁵ cells) was taken into each 75 mL experimental culture for inoculation. Experimental cultures were then grown under the same conditions as stock cultures. Experimental cultures were grown for six days, to the late exponential phase (1.25 × 10⁷ cells/mL). All chemicals were purchased from Sigma-Aldrich (www.sigmaaldrich.com (accessed on 1 June 2023)).
Auxenochlorella protothecoides (UTEX 2341) was purchased from UTEX, the Culture Collection of Algae at the University of Texas at Austin (http://web.biosci.utexas.edu/utex/ (accessed on 1 June 2023)) and cultivated in 1 L bottles filled to 800 mL with N8-NH4 medium [21]. Aeration was supplied at half the culture volume per minute with 2% CO2 mixed with air (by volume). Cultures were maintained at 28 °C and mixed by a stir bar set to 300 rpm. Illumination (10,000 lux) was supplied by T5 growth lamps operating on a 16:8 light/dark cycle. Samples were taken for lipidomics analysis during the mid-exponential growth stage.
Euglena gracilis (UTEX LB 367) was purchased from UTEX and used as received. To enrich the algae cells in the original culture, cells of each 10 mL culture were harvested by centrifugation for 5 min at 4000 g, and 1 mL of liquid media was added to each cell pellet.
1 mL algal culture of each algal strain was added into 1 mL cold 70% methanol in water (stored in −80 °C), followed by centrifugation (16,000 rcf for 3 min). After centrifugation, liquid was removed and the cell pellet was quenched in liquid nitrogen and stored in −80 °C.
2.2. Lipid Extraction
Liquid extraction was performed based on the Folch method [22]. Cell pellets were ground for 30 s at 1500 rpm with 5 mm i.d. steel balls (Retsch GmbH & Co., Haan, Germany). A volume of 600 µL cold chloroform/methanol (2:1, by volume, stored in −20 °C) was added, followed by vortexing for 10 s. After adding 120 µL water and vortexing for 20 s, phase separation was acquired by centrifugation for 2 min at 14,000 rcf. The lower-chloroform phase was transferred to another tube and dried in a speed vacuum concentrator. The dried samples were kept in −20 °C until further analysis.
2.3. Analytical Separation by 2D-TLC and LC-MS/MS
On the day of experiment, extracts of 10 Chlamydomonas, 20 Chlorella and 2 enriched Euglena samples were combined for each species in 65 µL chloroform: methanol (2:1, by volume). The whole extracts were applied to TLC plates (silica gel 60A, 20 cm × 10 cm, layer thickness 0.2 mm, Merck (Darmstadt, Germany)) [23], and 2D separations were performed based on the Rouser method [24] using chloroform/methanol/water (75:25:2.5, by volume) as developing solvent for the first dimension, and chloroform/methanol/acetic acid/water (80:9:12:2, by volume) for the second dimension. To further analyze the lipids by LC-MS/MS, general lipids were stained by iodine vapor. After iodine staining, lipid fractions were scraped by razor blades and transferred into 2 mL round bottom Eppendorf tubes. Lipids were then re-extracted using the Folch method as previously described. The bottom Folch solvent layer was filtered through 0.2 µm PTFE filters (SUPELCO, Bellefonte, PA) and dried in a speed vacuum concentrator. The run time for each 1D-TLC was 25 min, to a total of 50 min for one 2D-TLC run.
All lipid fractions from 2D-TLC as well as the non-fractionated crude lipid extracts for the three algal species were analyzed by LC-MS/MS. An Acquity 1.7 μm CSH C18 2.1 × 100 mm2 column (Waters Technologies, Milford, MA, USA) was used for the separation of lipids. The LC-MS/MS analysis was performed with an Agilent 1290 LC coupled to an Agilent 6530 accurate mass QTOF system with a JetStream Electrospray Ionization (ESI) source (Agilent, Santa Clara, CA, USA). Algal lipid fractions from TLC were re-suspended in 65 µL methanol: toluene 90:10 with 50 ng/mL 12-(cyclohexylcarbamoylamino)dodecanoic acid (CUDA, as internal standard). The injection volume was 3 μL for the positive mode and 5 μL for the negative mode. Mobile Phase A was acetonitrile/water, 60:40, with 10 mM ammonium formate and 0.1% formic acid. Mobile Phase B was isopropanol/acetonitrile 90:10 with 10 mM ammonium formate and 0.1% formic acid. Lipids were separated by a 15 min method, with constant flow rate at 0.6 mL/min and column temperature of 65 °C. The gradient was as follows: 0 min, 15% B; 2 min, 30% B; 2.5 min, 48% B; 11 min, 82% B; 11.5 min, 99% B; 12 min, 99% B; 12.1 min, 15% B and 15 min, 15% B.
The ESI source and MS parameters were as previously published [25]. MS conditions: MS1 mass range, m/z 100–1700; MS/MS mass range, m/z 100–1700; collision energy, +20 eV; capillary voltage, +3.5 kV; nozzle voltage, +1 kV; gas temperature, 200 °C; drying gas (nitrogen), 14 L/min; nebulizer gas (nitrogen), 35 psi; sheath gas temperature, 350 °C; sheath gas flow (nitrogen), 11 L/min. MS data acquisition: MS1, 10 spectra/s (100 ms); MS/MS, 13 spectra/s (77 ms); total cycle time, 0.508 s; number of precursor ion per cycle, 4; mass range for selection of precursor ions, m/z 300–1200; isolation width, narrow (1.3 m/z); precursor threshold, 2000 counts; active exclusion, excluded after 3 spectra, released after 0.07 min. Reference masses: m/z 121.0509, m/z 922.0098.
2.4. Data Processing and Annotation of Lipid Species
Agilent Mass Hunter Qualitative (Version B.06.00 2012) software was used to export the 100 most intense fragments of each MS/MS spectrum into MGF files. Lipids were annotated by using the MS2Analyzer software (version 2.1) [26] in addition to matching accurate masses and mass spectra using the LipidBlast [27] library. MS2Analyzer is a JAVA program that applies user-defined precursor, neutral loss and product ion query to the unknown MS/MS spectra automatically. In MS2Analyzer, the m/z tolerance is 0.005 for positive mode and 0.01 for negative mode, while the relative intensity threshold is 5% of the base peak. LipidBlast is an in-silico MS/MS library for lipid identification. Library search through LipidBlast was performed by NIST MSPepSearch GUI. In NIST MSPepSearch, the precursor and fragment peak m/z tolerance were set to be 0.005 and 0.01, respectively. The results from MS2Analyzer and LipidBlast were combined and reported after manual curation.
3. Results and Discussion
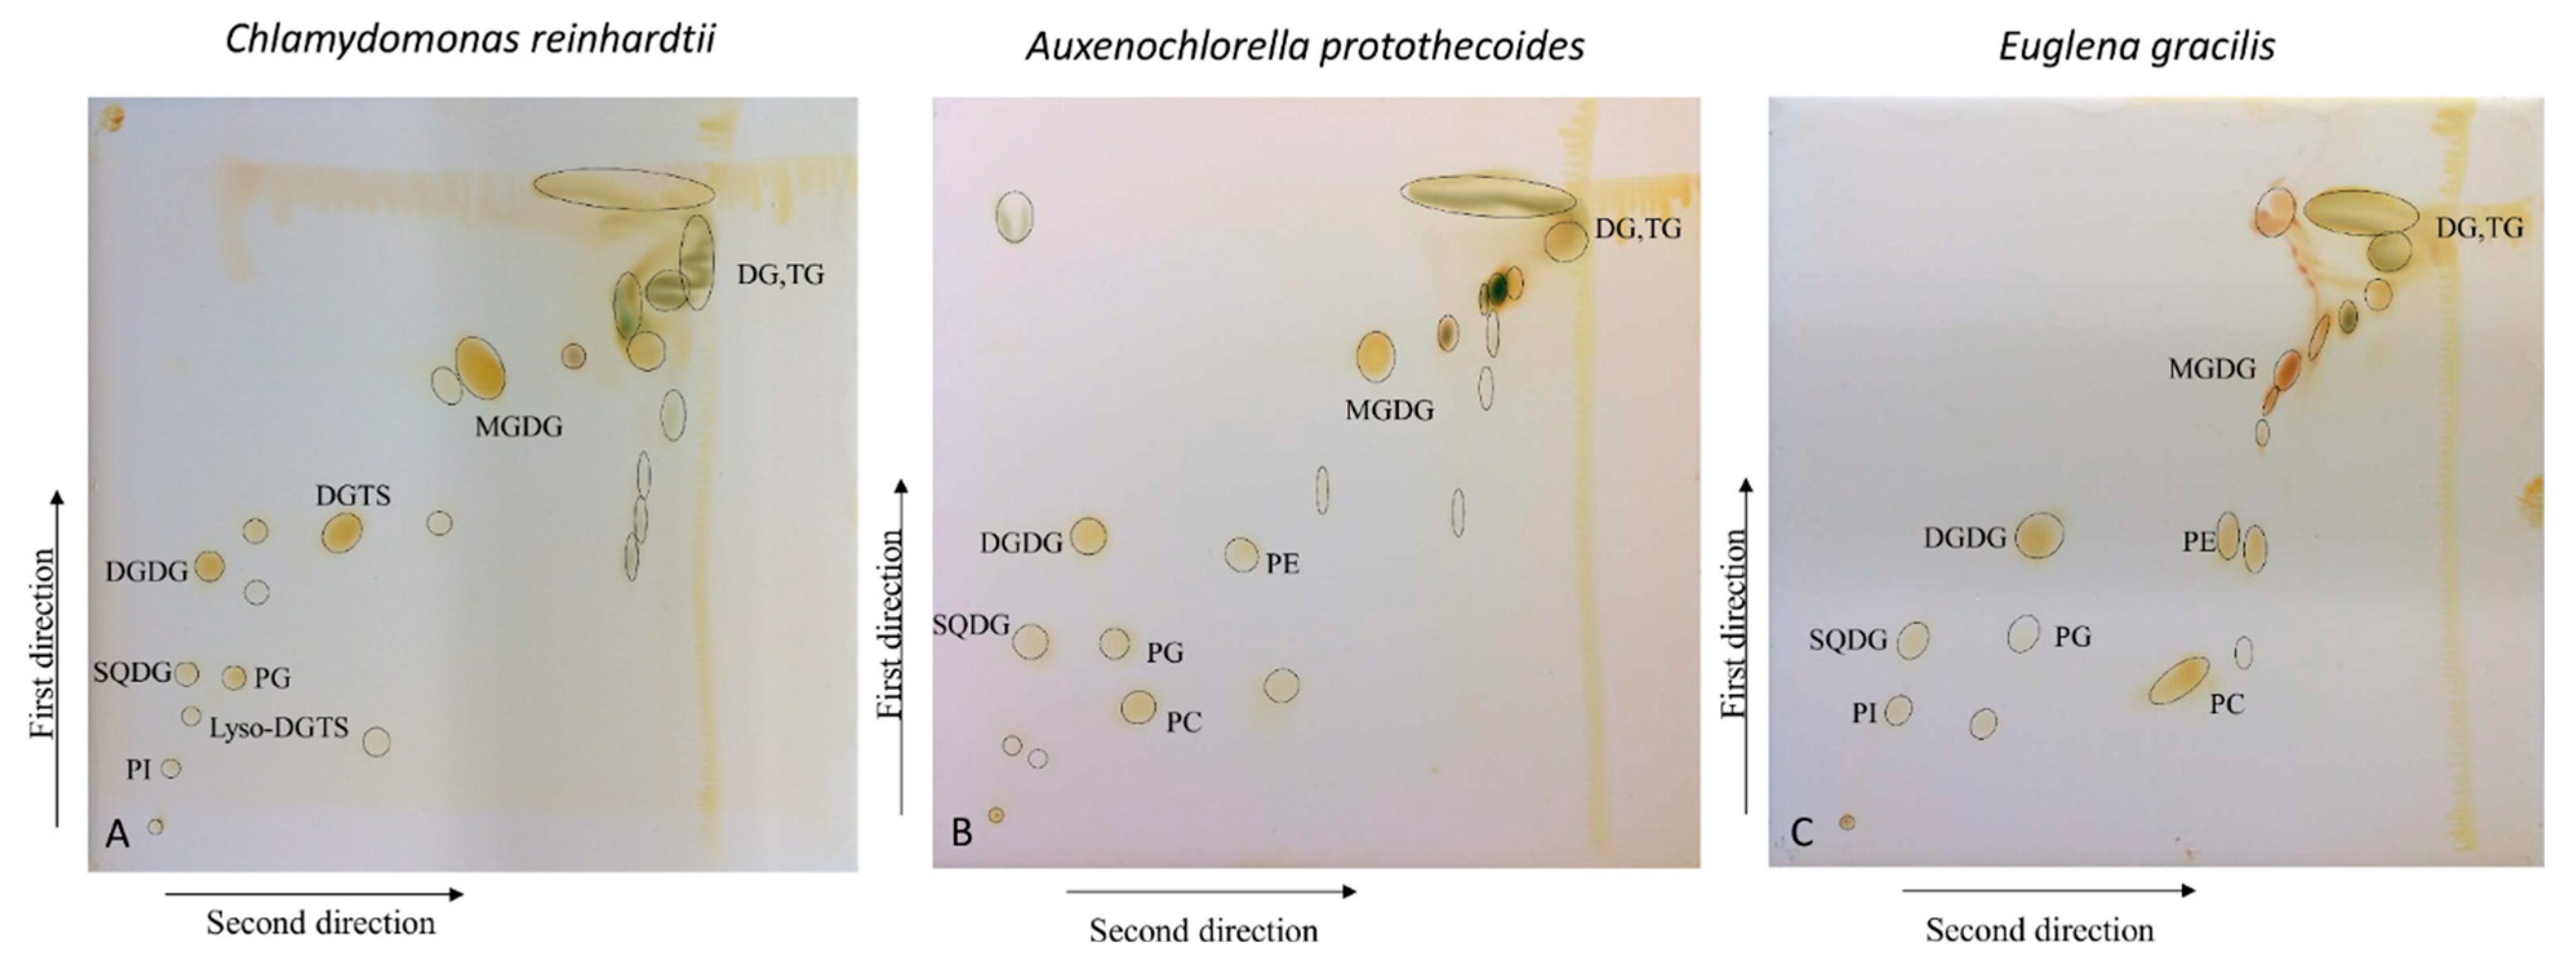
The 2D-TLC runs were performed for the crude lipid extracts of Chlamydomonas reinhardtii (CC-125), Auxenochlorella protothecoides (UTEX 2341) and Euglena gracilis (UTEX LB 367). After non-destructive iodine staining, an average of 20 fractions were visualized for each lipid sample, as shown in Figure 1, and spot numbers are presented in Figure S1.

Figure 1.
Two-dimensional separation of total lipids of (A) Chlamydomonas reinhardtii, (B) Auxenochlorella protothecoides, and (C) Euglena gracilis, stained by iodine vapor. Annotations of some lipid classes are shown.
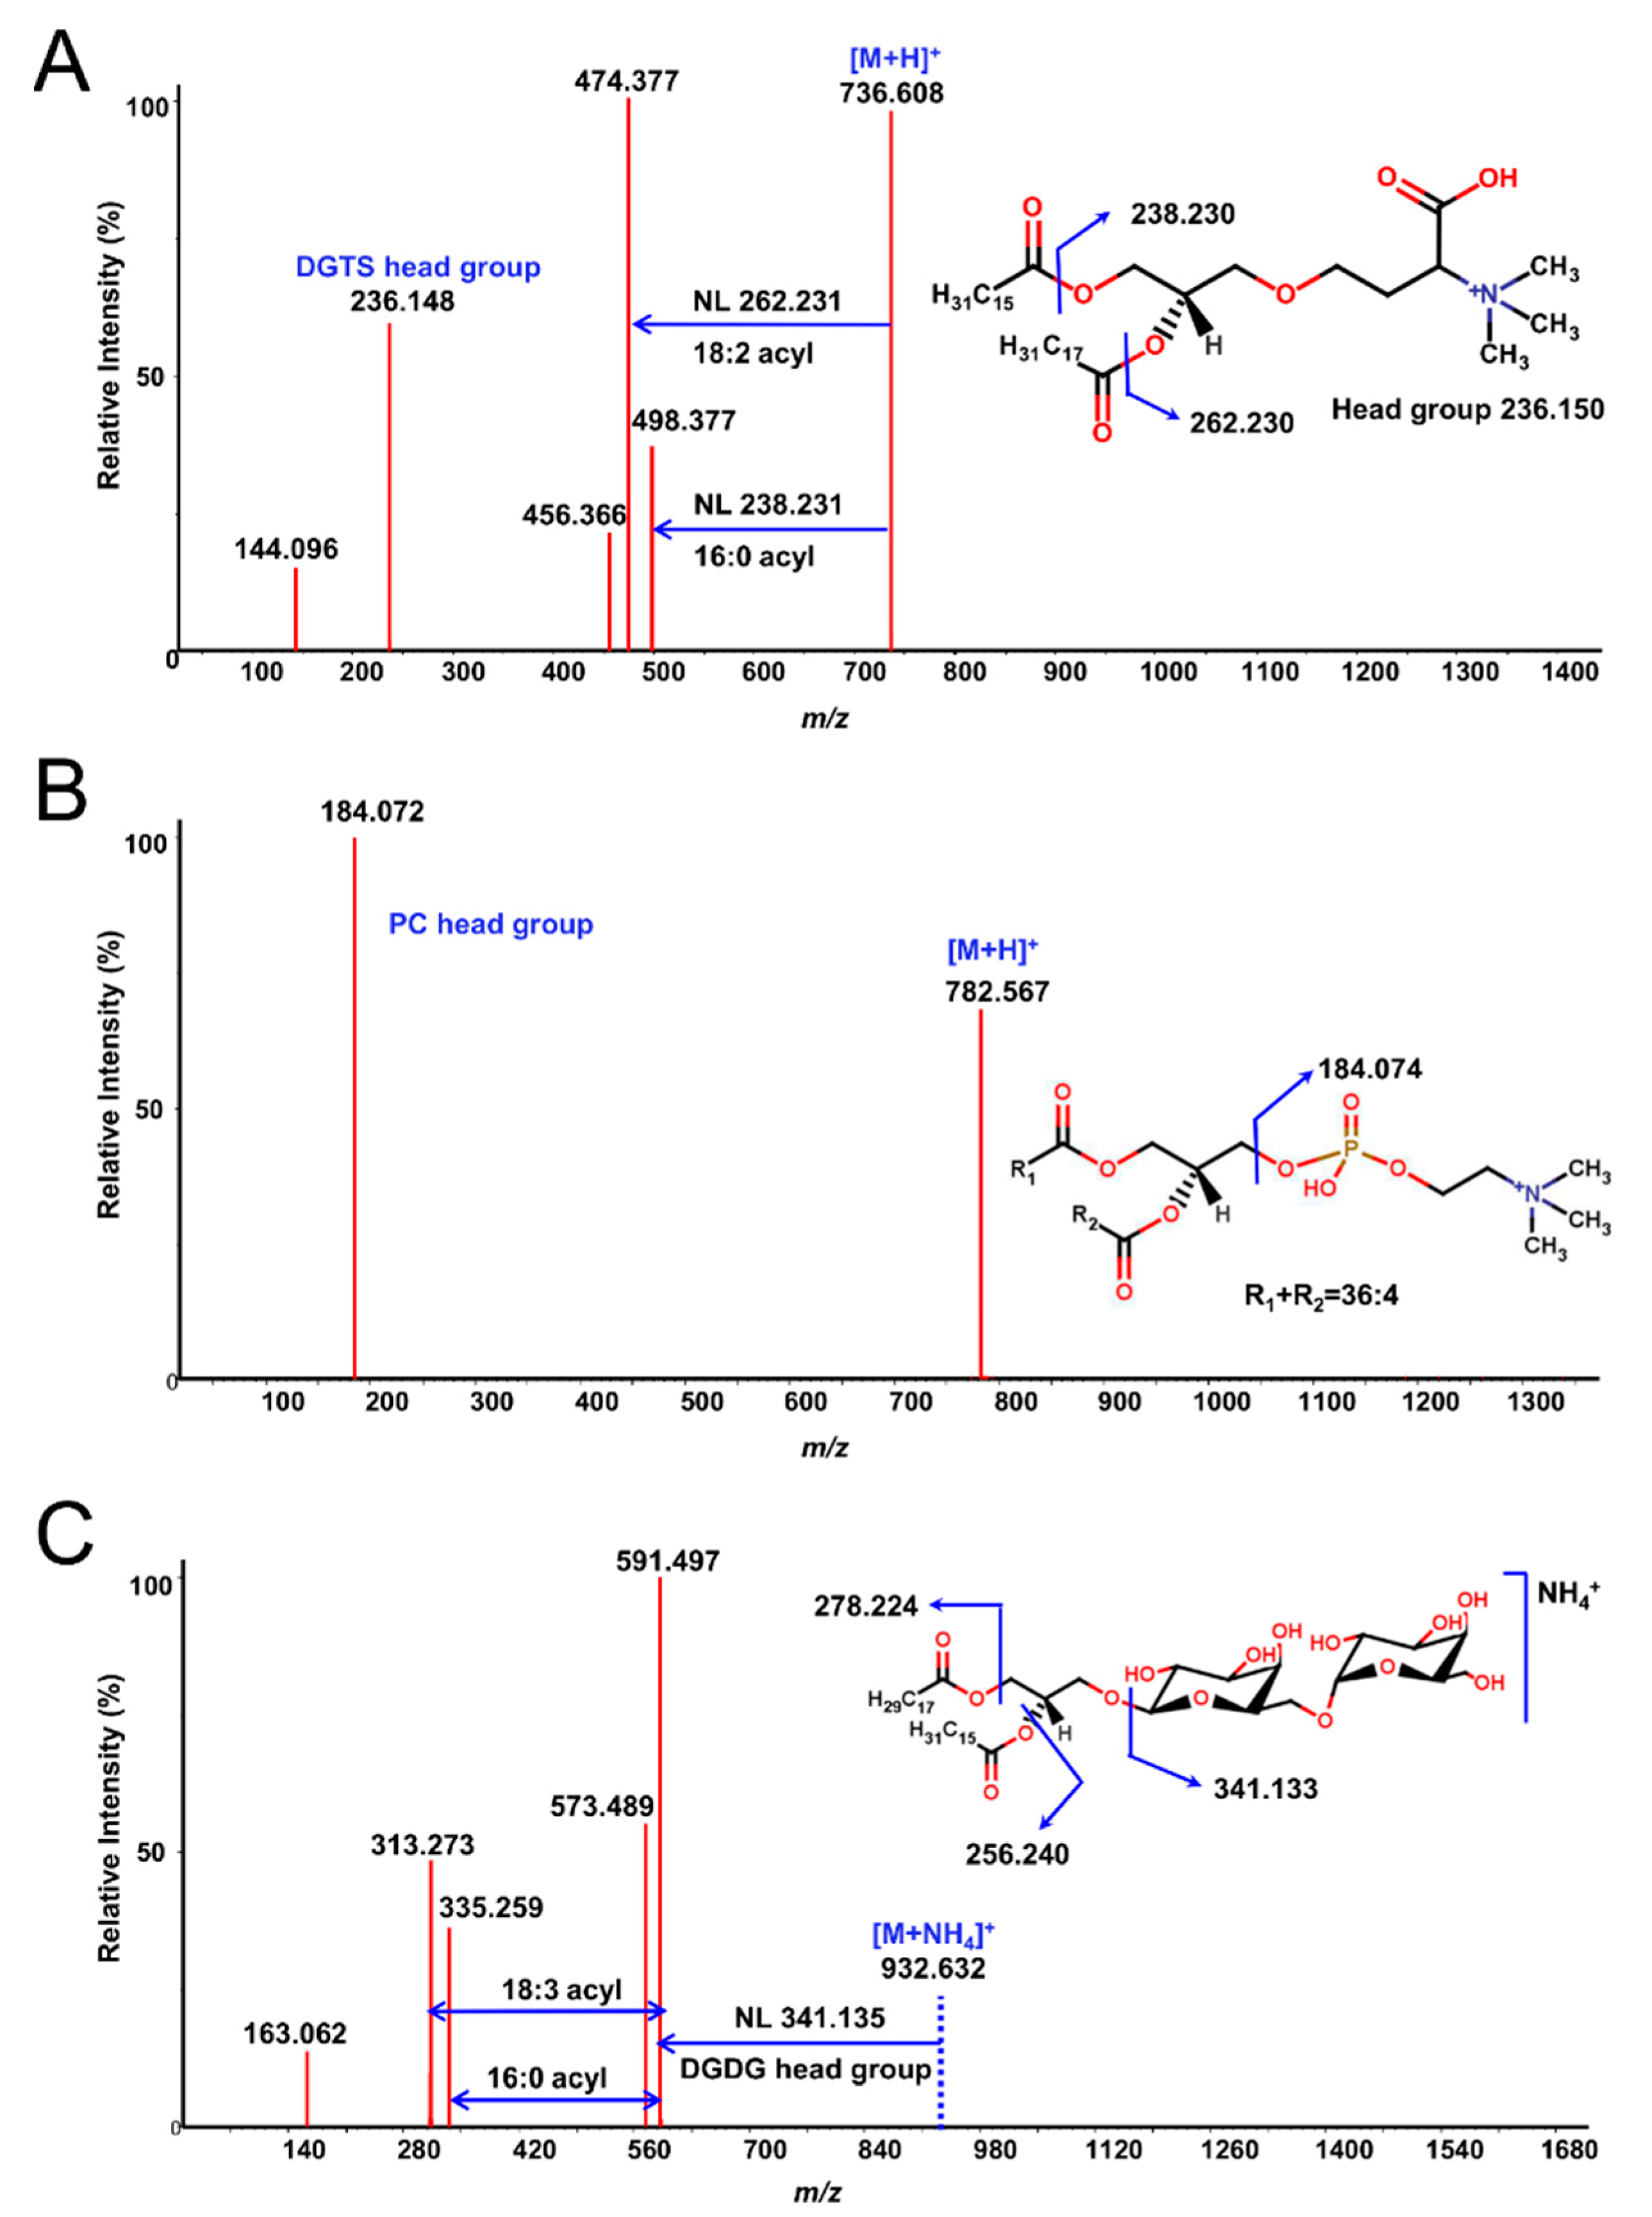
Next, each lipid fraction was scraped, re-extracted and analyzed with high-resolution LC-QTOF MS/MS. As expected, each spot yielded several lipid molecules, all from the same class (except for some specific cases, which will be pointed out) (Figure 1 and Figure S1). Resulting lipids were annotated by the LipidBlast in silico MS/MS library and MS2Analyzer software. Figure 2 demonstrates how MS2Analyzer used characteristic neutral losses, product ions and precursor ions to annotate lipids such as DGTS, PC and MGDG. For comparison, crude lipid extracts of the three lipid species were injected into LC-MS directly, without 2D-TLC pre-fractionation. Table 1 shows the summary of all the lipid classes and their corresponding TLC spots. More detailed information for individual lipids annotated from each spot, including precursor m/z and retention times, can be found in Tables S1–S3.

Figure 2.
Examples of MS/MS spectra from TLC fractions annotated by MS2Analyzer using characteristic neutral losses and product ions. (A) DGTS 34:2(16:0/18:2) [M + H]+ in Chlamydomonas reinhardtii. (B) PC 36:4 [M + H]+ in Auxenochlorella protothecoides. The acyl chain lengths and composition for sn1 and sn2 fatty acids remained undetermined due to the lack of characteristic fragment ions. (C) MGDG 34:3(16:0/18:3) [M + NH4]+ in Euglena gracilis.

Table 1.
Summary of lipids annotated in 2D-TLC of Chlamydomonas reinhardtii, Auxenochlorella protothecoides, and Euglena gracilis, presenting fraction number. Lipid fraction numbers for reference are included in Figure S1, and Tables S1–S3.
With respect to lipid classes, glycerolipids (MGDG, DGDG and SQDG), neutral lipids (DG and TG) and some phospholipids (PG, PI) were present in the lipidomes of all three algal species. In C. reinhardtii, betaine lipid DGTS was found to be a major lipid com-ponent, completely replacing phospholipid PC as previously reported by us [28] and others [29]. On the other hand, DGTS was not observed in UTEX 2341, whether using 2D-TLC or direct LC-MS/MS analysis. The absence of DGTS in UTEX 2341 (previously identified at Chlorella minutissima) was contrary to a report published in 1996 [30]. This fact turned out to be one of the major lines of evidence that the current UTEX 2341 strain is actually Auxenochlorella protothecoides, which we have recently confirmed by 18S gene sequencing [16]. In addition, it has been shown that UTEX 2341 can only produce DGTS under certain growth conditions, e.g., when grown on complex solid medium [16,31].
Among the three photosynthetic species, E. gracilis was found to be richest in lipid classes, with 15 identified lipid classes. Besides the lipids found in the two algal species, phosphatidic acid (PA) and plasmenyl-PE were only found in E. gracilis crude lipid extracts. Wax esters, which were reported to be produced by E. gracilis under anaerobic conditions [32], were not detected in our sample, due to the use of aerobic growing conditions at the UTEX center.
In accordance with our initial aims, 2D-TLC reduced the complexity of biological samples, enabling us to easily profile lipid classes in algal samples, although obviously inferior to classic LC-MS/MS analysis. Direct analysis by LC-MS/MS was able to detect some lipid classes that were not found by 2D-TLC in certain algal species (Tables S1–S3). Specifically, PE was not detected in 2D-TLC fractions in C. reinhardtii, lyso PC and lyso PE were absent from A. protothecoides and DGTS, and lyso DGTS and PA were not identified in E. gracilis but were found by direct LC-MS/MS analysis (Tables S1–S3). In addition, in some specific cases the TLC spot contained more than one lipid class, or one lipid class appeared in more than one spot: lysoDGTS were detected in both spot 3 and spot 10 of C. reinhardtii, and thus spot number 10 contained both DGTS and lysoDGTS (Table 1). In E. gracilis, spot number 9 contained PE, lysoPE and plasmenyl-PE. In C. reinhardtii and A. protothecoides TG were spread between three and two spots (19, 20, 21 and 19, 20, respectively), and mixed with DG (spots 21 and 19, respectively). This might be partially due to the fact that TG and DG were present in large quantities in both these species, but not in E. gracilis (Tables S1–S3).
Compared to 2D-TLC, analyses of crude lipid extracts by LC-MS/MS yielded a higher number of identified species (Tables S1–S3), and coverage of algal lipidomics did not improve if 2D-TLC fractionation was used prior to classic LC-QTOF MS/MS analysis. The limited coverage of 2D-TLC may be due to problems with losses and overall sensitivity of the method, e.g., resulting from possible reactions between unsaturated lipids and iodine vapor during the staining. Therefore, relatively low-abundance lipids in the samples might not have been detected. To reduce the degradation of sensitive lipids, iodine staining time should be minimized. In addition, some fractions in the TLC plates still remained unknown after LC-MS/MS annotation (Figure 1). The investigation of those unknown components might require more comprehensive MS/MS databases, but these fractions could also contain species that are not very amenable to electrospray ionization, such as pigments and xanthophyll cycle intermediates.
Although the overall coverage of 2D-TLC was limited in comparison to that of LC-QTOF MS/MS, it allowed us the annotation of lipid classes in C. reinhardtii, A. protothecoides and E. gracilis. The 2D-TLC patterns provide an intuitive overview of the distribution of lipid classes in complex samples, and this classic method is inexpensive, independent and adds orthogonal piece of information to the biological understanding. As a classic, non-expensive separation method, 2D-TLC is also widely used in the discovery or confirmation of new lipid classes induced by certain experimental conditions [33]. In TLC analyses results are usually compared with standards to identify each spot and avoid retention time drift between runs. However, the literature regarding algal lipidomics is generally missing, and TLC works are few [34,35,36,37]. In addition, chemical standards for many lipids are not commercially available [25]. Thus, for the current work we did not use standards, but rather identified the spots by scraping and applying the lipidomic LC-MS/MS workflow.
In light of our results, we recommend using it as a routine method for lipidomic evaluation in a wide range of samples, not limited to the organisms evaluated in this work or even to algal samples in general, for profiling lipid classes. This way, thanks to the similarity between algal and plant lipids, this method is also suggested for plant lipid class profiling. For example, it might be useful in profiling the lipid classes of specific species, e.g., in the case of PC absence from C. reinhardtii, in evaluating new algal or plant varieties, in studying the effect of cultivation conditions on the lipid class profile of food crops and algae, or quickly evaluating the effect of certain treatments on the observed lipid profile. It may also serve as a preliminary step before a more thorough comprehensive LC-QTOF MS/MS analysis, to initially screen plant and algal samples. It might be regarded as the lipidomic parallel of other simple methods suggesting general information about the sample, e.g., its total polyphenol content, using spectrophotometric methods, rather than (or before) using advanced separation methods for profiling.
4. Conclusions
We hypothesized that applying 2D-TLC lipidomics would allow lipid-class identification in C. reinhardtii, A. protothecoides and E. gracilis. A total of 15 lipid classes were annotated using LipidBlast MS/MS library match and MS2Analyzer software. Results revealed that the suggested method was sensitive enough to detect the differences in the lipidomes of the three algal species, including the absence of PC in C. reinhardtii and DGTS in A. protothecoides. Among the three algal species, Euglena gracilis was the richest in lipid classes. This technique might best be used if the appearance of novel lipid classes is hypothesized, which would be easily detected as new spots in 2D-TLC assays.
Supplementary Materials
The following supporting information can be downloaded at: https://www.mdpi.com/article/10.3390/separations11060161/s1, Figure S1. The 2D-TLC plates of (A) Chlamydomonas reinhardtii, (B) Auxenochlorella protothecoides, and (C) Euglena gracilis, with lipid fraction numbers for reference in Table S1–S3; Table S1: Detailed information of all lipids annotated in Chlamydomonas reinhardtii (CC-125); Table S2. Detailed information of all lipids annotated in Auxenochlorella protothecoides (UTEX 2341); Table S3: Detailed information of all lipids annotated in Euglena gracilis (UTEX LB 367).
Funding
ZT was supported by Vaadia-BARD Postdoctoral Fellowship award No. FI-469-2012 from the United States Israel Binational Agriculture Research and Development Fund (BARD).
Data Availability Statement
Data is contained within the article or Supplementary Material.
Acknowledgments
We would like to thank Oliver Fiehn laboratory members and Jean VanderGheynst Laboratory members for their help with lipid identification and useful assistance on the manuscript. We would also like to thank Alberto Vargas for his technical assistance, and Ingrid Gennity for her helpful comments and support.
Conflicts of Interest
The authors declare no conflicts of interest.
References
- Tietel, Z.; Hammann, S.; Meckelmann, S.W.; Ziv, C.; Pauling, J.K.; Wölk, M.; Würf, V.; Alves, E.; Neves, B.; Domingues, M.R. An overview of food lipids toward food lipidomics. Compr. Rev. Food Sci. Food Saf. 2023, 22, 4302–4354. [Google Scholar] [CrossRef]
- Züllig, T.; Köfeler, H.C. High resolution mass spectrometry in lipidomics. Mass Spectrom. Rev. 2021, 40, 162–176. [Google Scholar] [CrossRef]
- Cajka, T.; Fiehn, O. Comprehensive analysis of lipids in biological systems by liquid chromatography-mass spectrometry. TrAC Trends Anal. Chem. 2014, 61, 192–206. [Google Scholar] [CrossRef]
- Fuchs, B.; Süß, R.; Teuber, K.; Eibisch, M.; Schiller, J. Lipid analysis by thin-layer chromatography—A review of the current state. J. Chromatogr. A 2011, 1218, 2754–2774. [Google Scholar] [CrossRef]
- Wang, Z.; Benning, C. Arabidopsis thaliana polar glycerolipid profiling by thin layer chromatography (TLC) coupled with gas-liquid chromatography (GLC). J. Vis. Exp. JoVE 2011, 18, 2518. [Google Scholar]
- Klug, R.M.; Benning, C. Two enzymes of diacylglyceryl-O-4′-(N,N,N,-trimethyl) homoserine biosynthesis are encoded by btaA and btaB in the purple bacterium Rhodobacter sphaeroides. Proc. Natl. Acad. Sci. USA 2001, 98, 5910–5915. [Google Scholar] [CrossRef]
- Morlock, G.; Schwack, W. Coupling of planar chromatography to mass spectrometry. TrAC Trends Anal. Chem. 2010, 29, 1157–1171. [Google Scholar] [CrossRef]
- Hu, B.; Xin, G.-Z.; So, P.-K.; Yao, Z.-P. Thin layer chromatography coupled with electrospray ionization mass spectrometry for direct analysis of raw samples. J. Chromatogr. A 2015, 1415, 155–160. [Google Scholar] [CrossRef]
- Manikandan, M.; Hasan, N.; Wu, H.-F. Rapid detection of haloarchaeal carotenoids via liquid–liquid microextraction enabled direct TLC MALDI-MS. Talanta 2013, 107, 167–175. [Google Scholar] [CrossRef]
- Chapman, R. Algae: The world’s most important “plants”—An introduction. Mitig. Adapt. Strat. Glob. Chang. 2013, 18, 5–12. [Google Scholar] [CrossRef]
- Guschina, I.A.; Harwood, J.L. Lipids and lipid metabolism in eukaryotic algae. Prog. Lipid Res. 2006, 45, 160–186. [Google Scholar] [CrossRef]
- Boudière, L.; Michaud, M.; Petroutsos, D.; Rébeillé, F.; Falconet, D.; Bastien, O.; Roy, S.; Finazzi, G.; Rolland, N.; Jouhet, J.; et al. Glycerolipids in photosynthesis: Composition, synthesis and trafficking. Biochim. Biophys. Acta (BBA) Bioenerg. 2014, 1837, 470–480. [Google Scholar] [CrossRef]
- Roche, S.A.; Leblond, J.D. Betaine lipids in chlorarachniophytes. Phycol. Res. 2010, 58, 298–305. [Google Scholar] [CrossRef]
- Armada, I.; Hachero-Cruzado, I.; Mazuelos, N.; Ríos, J.L.; Manchado, M.; Cañavate, J.P. Differences in betaine lipids and fatty acids between Pseudoisochrysis paradoxa VLP and Diacronema vlkianum VLP isolates (Haptophyta). Phytochemistry 2013, 95, 224–233. [Google Scholar] [CrossRef]
- Vogel, G.; Woznica, M.; Gfeller, H.; Müller, C.; Stämpfli, A.A.; Jenny, T.A.; Eichenberger, W. 1(3),2-Diacylglyceryl-3(1)-O-2′-(hydroxymethyl)(N,N,N,-trimethyl)-β-alanine (DGTA): A novel betaine lipid from Ochoromonas danica (Chrysophyceae). Chem. Phys. Lipids 1990, 52, 99–109. [Google Scholar] [CrossRef]
- Higgins, B.T.; Nobles, D.; Ma, Y.; Wikoff, W.; Kind, T.; Fiehn, O.; Brand, J.; VanderGheynst, J.S. Informatics for improved algal taxonomic classification and research: A case study of UTEX 2341. Algal Res. 2015, 12, 545–549. [Google Scholar] [CrossRef]
- Rochaix, J.-D. Chlamydomonas, a model system for studying the assembly and dynamics of photosynthetic complexes. FEBS Lett. 2002, 529, 34–38. [Google Scholar] [CrossRef]
- Siaut, M.; Cuiné, S.; Cagnon, C.; Fessler, B.; Nguyen, M.; Carrier, P.; Beyly, A.; Beisson, F.; Triantaphylidès, C.; Li-Beisson, Y. Oil accumulation in the model green alga Chlamydomonas reinhardtii: Characterization, variability between common laboratory strains and relationship with starch reserves. BMC Biotechnol. 2011, 11, 7. [Google Scholar] [CrossRef]
- Bhatnagar, A.; Bhatnagar, M.; Chinnasamy, S.; Das, K. Chlorella minutissima—A promising fuel alga for cultivation in municipal wastewaters. Appl. Biochem. Biotechnol. 2010, 161, 523–536. [Google Scholar] [CrossRef]
- Li, Z.; Yuan, H.; Yang, J.; Li, B. Optimization of the biomass production of oil algae Chlorella minutissima UTEX2341. Bioresour. Technol. 2011, 102, 9128–9134. [Google Scholar] [CrossRef]
- Higgins, B.T.; VanderGheynst, J.S. Effects of Escherichia coli on Mixotrophic Growth of Chlorella minutissima and Production of Biofuel Precursors. PLoS ONE 2014, 9, e96807. [Google Scholar] [CrossRef] [PubMed]
- Folch, J.; Lees, M.; Sloane-Stanley, G. A simple method for the isolation and purification of total lipids from animal tissues. J. Biol. Chem. 1957, 226, 497–509. [Google Scholar] [CrossRef] [PubMed]
- Gilmore, S.F.; Yao, A.I.; Tietel, Z.; Kind, T.; Facciotti, M.T.; Parikh, A.N. Role of squalene in the organization of monolayers derived from lipid extracts of Halobacterium salinarum. Langmuir 2013, 29, 7922–7930. [Google Scholar] [CrossRef] [PubMed]
- Rouser, G.; Kritchevsky, G.; Yamamoto, A. Column chromatographic and associated procedures for separation and determination of phosphatides and glycolipids. Lipid Chromatogr. Anal. 1967, 1, 99–162. [Google Scholar]
- Cajka, T.; Fiehn, O. LC–MS-based lipidomics and automated identification of lipids using the LipidBlast in-silico MS/MS library. Methods Mol. Biol. 2017, 1609, 149–170. [Google Scholar]
- Ma, Y.; Kind, T.; Yang, D.; Leon, C.; Fiehn, O. MS2Analyzer—A software for small molecule substructure annotations from accurate mass MS/MS spectra. Anal. Chem. 2014, 86, 10724–10731. [Google Scholar] [CrossRef] [PubMed]
- Kind, T.; Liu, K.H.; Lee, D.Y.; DeFelice, B.; Meissen, J.K.; Fiehn, O. LipidBlast in silico tandem mass spectrometry database for lipid identification. Nat. Methods 2013, 10, 755–758. [Google Scholar] [CrossRef] [PubMed]
- Tietel, Z.; Wikoff, W.R.; Kind, T.; Ma, Y.; Fiehn, O. Hyperosmotic stress in Chlamydomonas induces metabolomic changes in biosynthesis of complex lipids. Eur. J. Phycol. 2020, 55, 11–29. [Google Scholar] [CrossRef]
- Vieler, A.; Wilhelm, C.; Goss, R.; Süß, R.; Schiller, J. The lipid composition of the unicellular green alga Chlamydomonas reinhardtii and the diatom Cyclotella meneghiniana investigated by MALDI-TOF MS and TLC. Chem. Phys. Lipids 2007, 150, 143–155. [Google Scholar] [CrossRef]
- Haigh, W.G.; Yoder, T.F.; Ericson, L.; Pratum, T.; Winget, R.R. The characterisation and cyclic production of a highly unsaturated homoserine lipid in Chlorella minutissima. Biochim. Biophys. Acta (BBA)-Lipids Lipid Metab. 1996, 1299, 183–190. [Google Scholar] [CrossRef]
- Kind, T.; Meissen, J.; Yang, D.; Nocito, F.; Vaniya, A.; Cheng, Y.; VanderGheynst, J.; Fiehn, O. Qualitative analysis of algal secretions with multiple mass spectrometric platforms. J. Chromatogr. A 2012, 1244, 139–147. [Google Scholar] [CrossRef] [PubMed]
- Tucci, S.; Vacula, R.; Krajcovic, J.; Proksch, P.; Martin, W. Variability of wax ester fermentation in natural and bleached Euglena gracilis strains in response to oxygen and the elongase inhibitor flufenacet. J. Eukaryot. Microbiol. 2010, 57, 63–69. [Google Scholar] [CrossRef] [PubMed]
- Vences-Guzmán, M.Á.; Guan, Z.; Bermúdez-Barrientos, J.R.; Geiger, O.; Sohlenkamp, C. Agrobacteria lacking ornithine lipids induce more rapid tumour formation. Environ. Microbiol. 2013, 15, 895–906. [Google Scholar] [CrossRef] [PubMed]
- Jouhet, J.; Lupette, J.; Clerc, O.; Magneschi, L.; Bedhomme, M.; Collin, S.; Roy, S.; Maréchal, E.; Rebeille, F. LC-MS/MS versus TLC plus GC methods: Consistency of glycerolipid and fatty acid profiles in microalgae and higher plant cells and effect of a nitrogen starvation. PLoS ONE 2017, 12, e0182423. [Google Scholar] [CrossRef] [PubMed]
- Yang, Y.; Du, L.; Hosokawa, M.; Miyashita, K. Total lipids content, lipid class and fatty acid composition of ten species of microalgae. J. Oleo Sci. 2020, 69, 1181–1189. [Google Scholar] [CrossRef] [PubMed]
- Yao, L.; Gerde, J.A.; Lee, S.-L.; Wang, T.; Harrata, K.A. Microalgae lipid characterization. J. Agric. Food Chem. 2015, 63, 1773–1787. [Google Scholar] [CrossRef]
- Guihéneuf, F.; Schmid, M.; Stengel, D.B. Lipids and fatty acids in algae: Extraction, fractionation into lipid classes, and analysis by gas chromatography coupled with flame ionization detector (GC-FID). Nat. Prod. Mar. Algae Methods Protoc. 2015, 1308, 173–190. [Google Scholar]
Disclaimer/Publisher’s Note: The statements, opinions and data contained in all publications are solely those of the individual author(s) and contributor(s) and not of MDPI and/or the editor(s). MDPI and/or the editor(s) disclaim responsibility for any injury to people or property resulting from any ideas, methods, instructions or products referred to in the content. |
© 2024 by the author. Licensee MDPI, Basel, Switzerland. This article is an open access article distributed under the terms and conditions of the Creative Commons Attribution (CC BY) license (https://creativecommons.org/licenses/by/4.0/).