Article

Evaluation of CO2/H2O Co-Adsorption Models for the Anion Exchange Resin Lewatit VPOC 1065 under Direct Air Capture Conditions Using a Novel Lab Setup

Institute of Chemical, Environmental and Bioscience Engineering, TU Wien, Getreidemarkt 9/166, 1060 Wien, Austria
*
Author to whom correspondence should be addressed.
Separations 2024, 11(6), 160; https://doi.org/10.3390/separations11060160
Submission received: 29 April 2024 / Revised: 17 May 2024 / Accepted: 20 May 2024 / Published: 22 May 2024
(This article belongs to the Topic Carbon Capture Science & Technology (CCST))

Abstract

:
This study aimed to develop a laboratory-scale direct air capture unit for evaluating and comparing amine-based adsorbents under temperature vacuum swing adsorption conditions. The experimental campaign conducted with the direct air capture unit allowed for the determination of equilibrium loading, CO2 uptake capacity, and other main performance parameters of the investigated adsorbent Lewatit VP OC 1065®. The investigations also helped to understand the co-adsorption of CO2 and H2O on the tested material, which is crucial for improving temperature vacuum swing adsorption processes. This was achieved by obtaining pure component isotherms for CO2 and H2O and using three different co-adsorption isotherm models from the literature. It was found that the weighted average dual-site Toth model emerged as the most accurate and reliable model for simulating this co-adsorption behaviour. Its predictions closely align with the experimental data, particularly in capturing the adsorption equilibrium at various temperatures. It was also observed that this lab-scale unit offers advantages over thermogravimetric analysis when conducting adsorption experiments on the chosen amine. The final aim of this study is to provide a pathway to develop devices for testing and developing efficient and cost-effective adsorbents for direct air capture.

1. Introduction

As the atmospheric CO2 concentration continues to increase, there is a growing risk of severe and irreversible impacts due to the dramatic progression of climate change [1]. In response to these concerns, the United Nations Framework Convention on Climate Change facilitated the development of the Paris Agreement, a landmark international accord on climate change [2]. Under this agreement, participating countries submitted Nationally Determined Contributions (NDCs) outlining their commitments to reduce greenhouse gas emissions. However, analyses suggest that adopting the existing commitments will result in a temperature increase of around 2.4–2.6 °C by the end of the century, considering both conditional and unconditional NDCs [3]. Therefore, there is a growing recognition of the need for effective carbon dioxide removal (CDR) strategies to complement emission reduction efforts and achieve the desired climate goals. CDR encompasses various approaches that aim to reduce atmospheric CO2 levels, including methods for direct extraction of CO2 from the atmosphere and enhancing carbon sinks on land and in the oceans to enhance CO2 removal [4].
Primarily, six technical CDR approaches have been identified for the removal and sequestration of carbon dioxide: coastal blue carbon, terrestrial carbon removal and sequestration, bioenergy with carbon capture and storage (BECCS), carbon mineralization, geological sequestration, and direct air capture (DAC) [5]. Each of the aforementioned technical methods presents its own set of advantages and disadvantages. Yet, factors such as the land area required, water demand, technology learning curve, scalability, and life-cycle considerations cause DAC to garner more attention than coastal blue carbon and BECCS as a method for carbon removal [6]. Furthermore, since DAC can also be used in the CO2 utilization industry, which helps climate mitigation efforts, there is a growing interest in developing and scaling up DAC technology [7].
Despite this growing interest in DAC technology, the industry is still in its infancy, with a limited number of major players such as Carbon Engineering, Climeworks, and Global Thermostat and a plethora of upcoming startups. However, these companies have their own drawbacks, such as high costs and low scale of operations [8].
One way to drastically reduce the costs is to bring down the energy requirements of the CO2 capture process. This, as indicated by several research papers, boils down to choosing the most suitable active material that captures CO2 and the subsequent method of adsorption–desorption [9]. Several different functional materials are being used in the industry or investigated at research institutes, for example, aqueous alkali hydroxide solutions, solid amine-functionalized adsorbents, solid oxide-based adsorbents, and membrane-based filters [10]. Similarly, there are various methods proposed for adsorption–desorption, for example, temperature swing adsorption (TSA), temperature vacuum swing adsorption (TVSA), pressure vacuum swing adsorption (PVSA), moisture swing adsorption (MSA), electro-swing process, and electrolysis [9,11,12]
Amine-functionalized adsorbents that work on TVSA are often proposed as active materials for DAC CO2 capture [13]. It is known that the characterization, comparison, and evaluation of solid amine-functionalized adsorbents are critical steps in determining their suitability for CO2 capture applications. To characterize any adsorbent for CO2 capture, two types of properties are typically measured: intrinsic properties and performance parameters. Intrinsic properties are textural features of the material that are determined after synthesis and depend on the material’s structure. These properties include pore size, surface area, and pore volume, which play a critical role in the adsorption process. Performance parameters, on the other hand, describe the functional behaviour of the adsorbent, such as the CO2 uptake capacity, selectivity, degradation over lifetime, and regeneration potential. These parameters are used to evaluate the adsorbent’s effectiveness for CO2 capture applications [14].
However, assessing adsorbents for CO2 capture can be challenging because there are many different types of adsorbents available, and each has its own unique properties. Furthermore, different research studies may use varying test conditions, making it difficult to compare the adsorbent’s performance parameters accurately. For example, the temperature, pressure, and gas composition used in the experiments can significantly affect the adsorbent’s performance.
Hence, this study aimed to develop a suitable lab setup and a testing method that can help evaluate and compare amine-functionalized adsorbents under TVSA-DAC conditions for a range of performance parameters. Performance parameters such as temperature, relative humidity, CO2 partial pressure, and adsorption kinetics are tested to assess the efficiency of the adsorbent. The collected data are then used to explore models that explain the multilayer adsorption of both CO2 and water (H2O) on these materials, which is crucial for improving TVSA processes [15]. The results will be compared with thermogravimetric analysis (TGA) for H2O and CO2 adsorption on amines to see if this lab unit offers advantages over the conventional methods of measuring adsorption kinetics. This comprehensive approach aids in developing more efficient materials for carbon capture and utilization applications.
The design of the test equipment is based on state-of-the-art knowledge of DAC technology and amine-functionalized adsorbent materials, as well as practical considerations such as ease of use and integrability. For this study, Lewatit VP OC 1065®, a solid amine-functionalized adsorbent, is used. The equipment, methods, and models developed in this work should also apply to other amine-functionalized adsorbents. The final goal of this research is to contribute to the scaling up DAC technology globally by providing a pathway to develop a suitable setup for testing and developing efficient and cost-effective adsorbents.

2. Material and Methods

A novel DAC unit on a laboratory scale at TU Wien was built and used for the experimental investigations of carbon capture potential of amine-functionalized sorbents under direct air capture conditions. The purpose of this facility was to create an environment in which an adsorbent can be loaded and unloaded with CO2 under specific conditions, thus providing information on the optimum operating conditions for different adsorbents.
The material used in this study, Lewatit, consists of a polystyrene polymer cross-linked with divinylbenzene and functionalized with primary amine groups. This adsorbent was proposed in a variety of CO2 capture processes, for example, by Veneman et al. [16] and Sonnleitner et al. [17] in a continuous TSA CO2 capture process, or by Low et al. [18] in DAC applications, with the latter providing detailed BET analysis of the adsorbent. The key material data obtained from the material datasheet [19] are presented in Table 1.

2.1. Laboratory Unit Setup

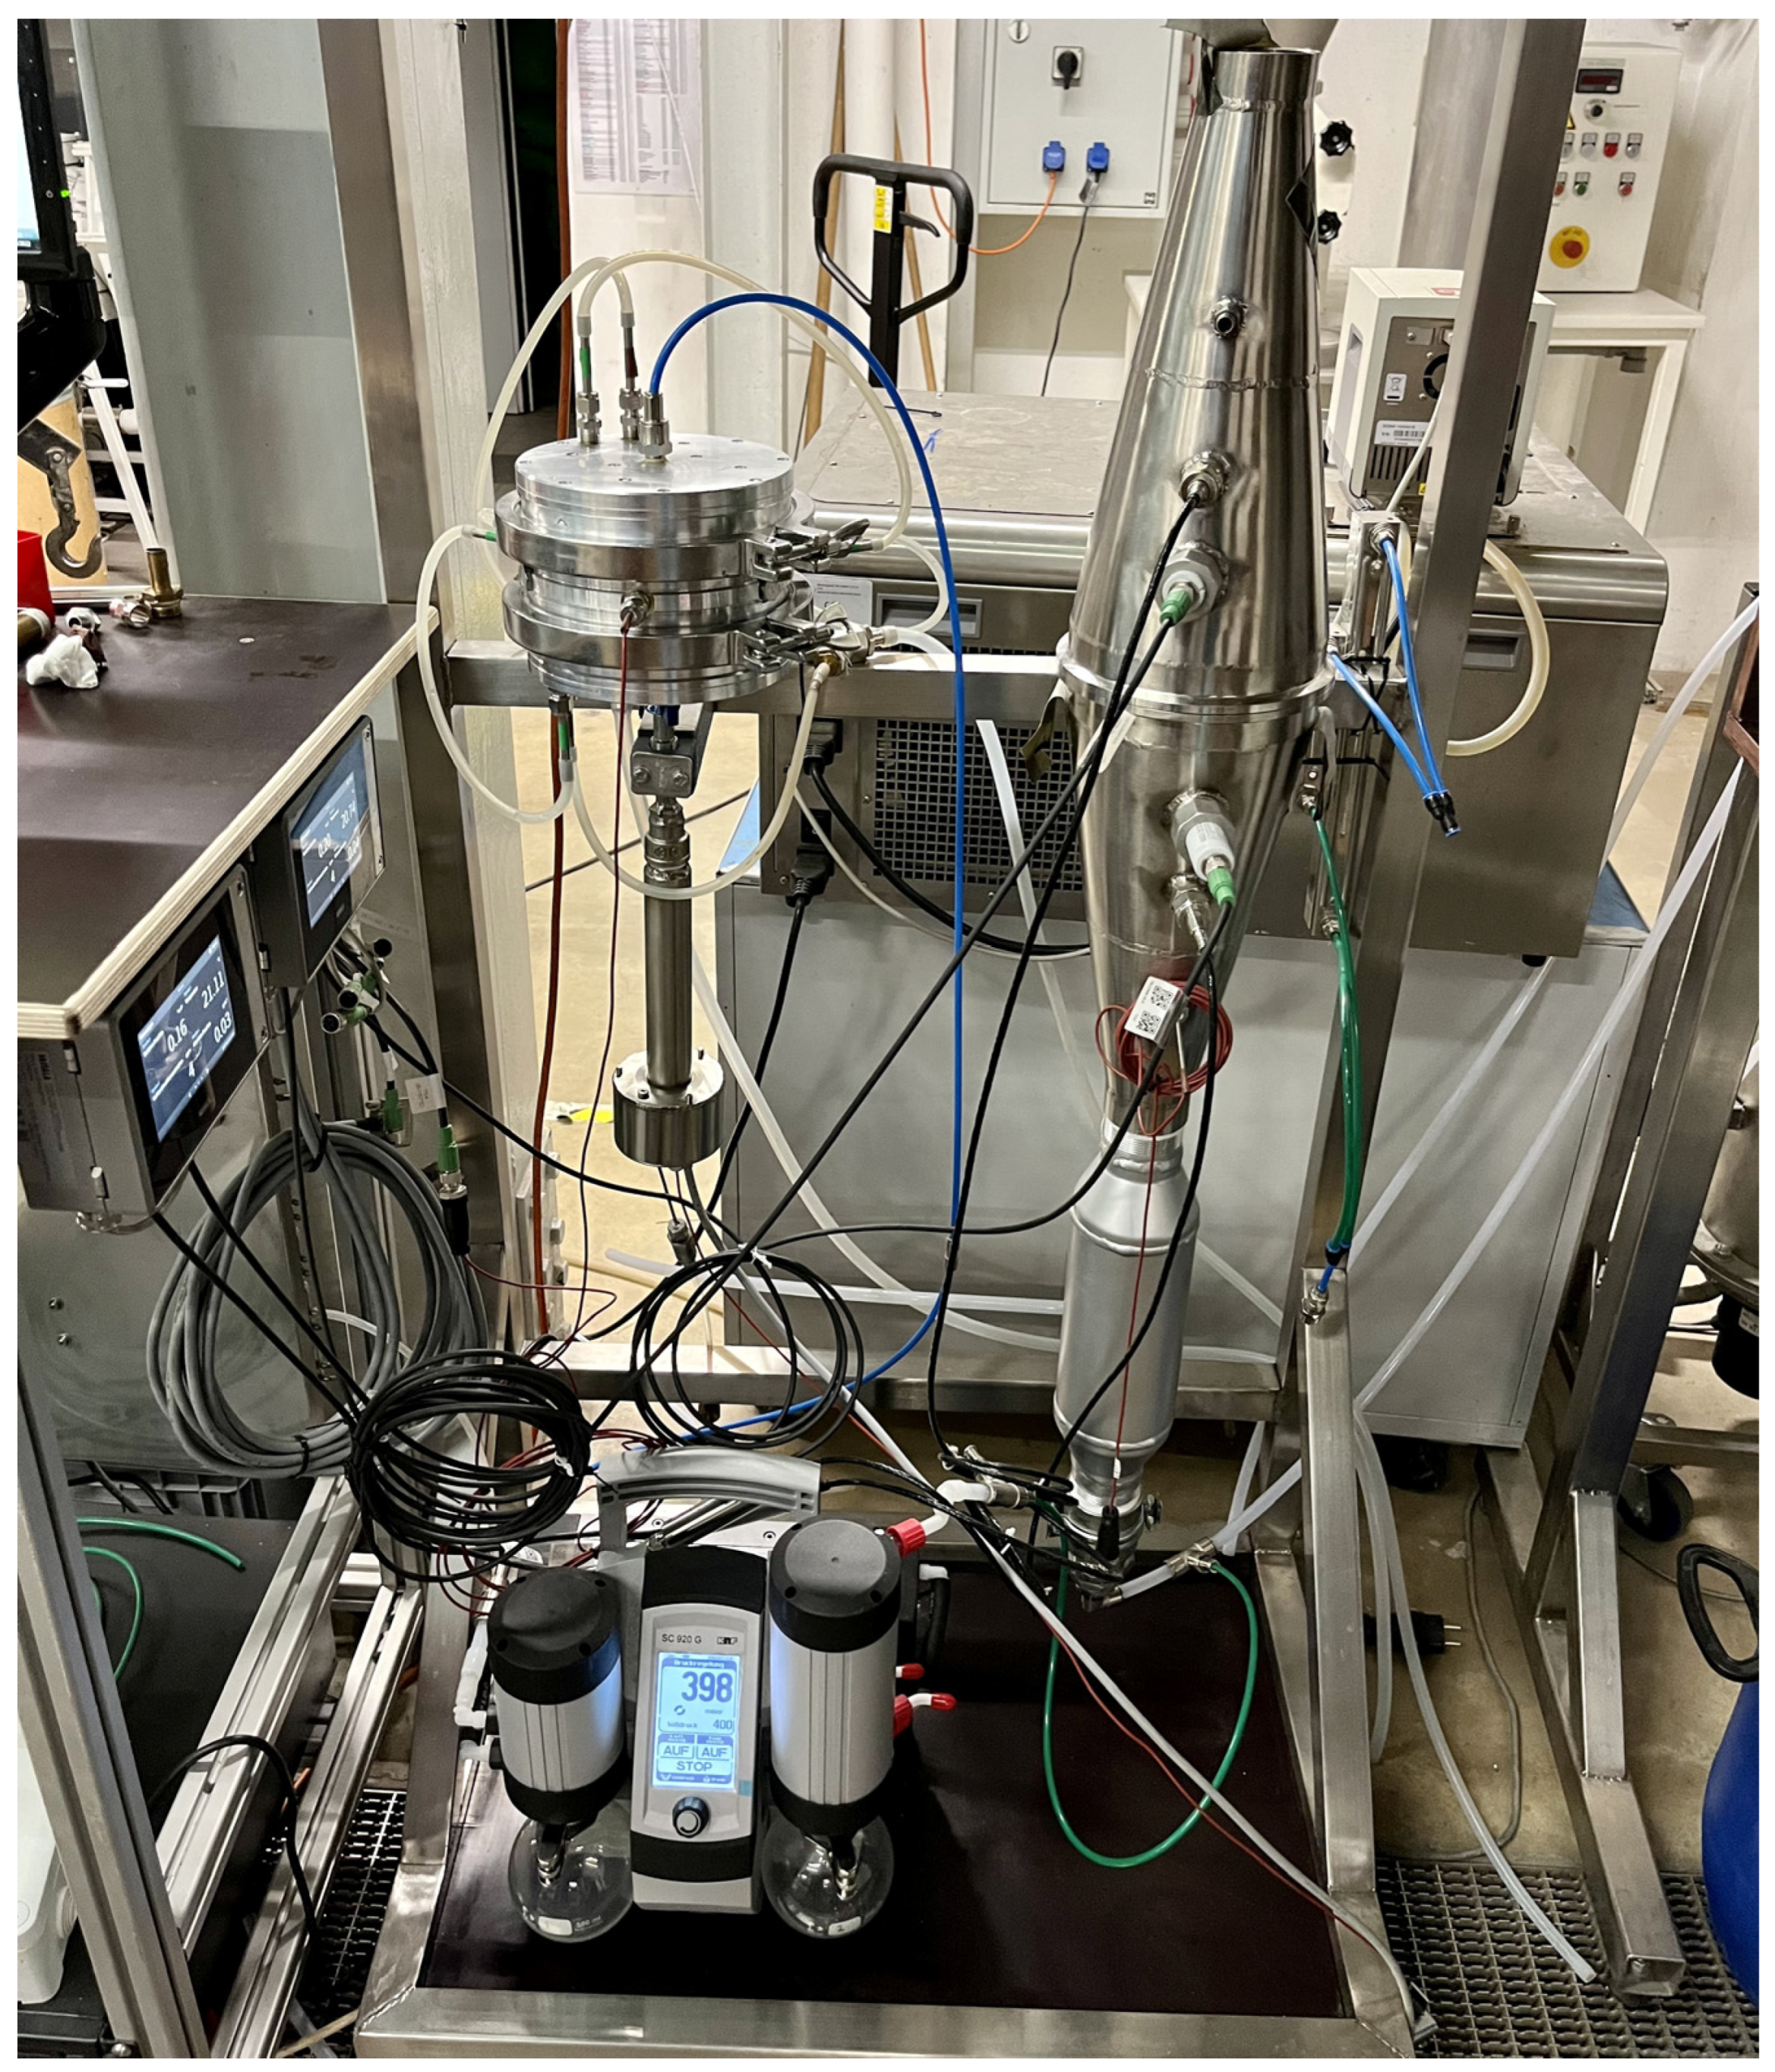
The experimental setup of the laboratory unit can be divided into two process modes: adsorption and desorption. This unit captures CO2 in batches rather than continuously. For research purposes, this has the advantage that the mass and energy balance can be calculated for both process modes separately.
Figure 1 shows a picture of the DAC unit operating in its desorption mode. 
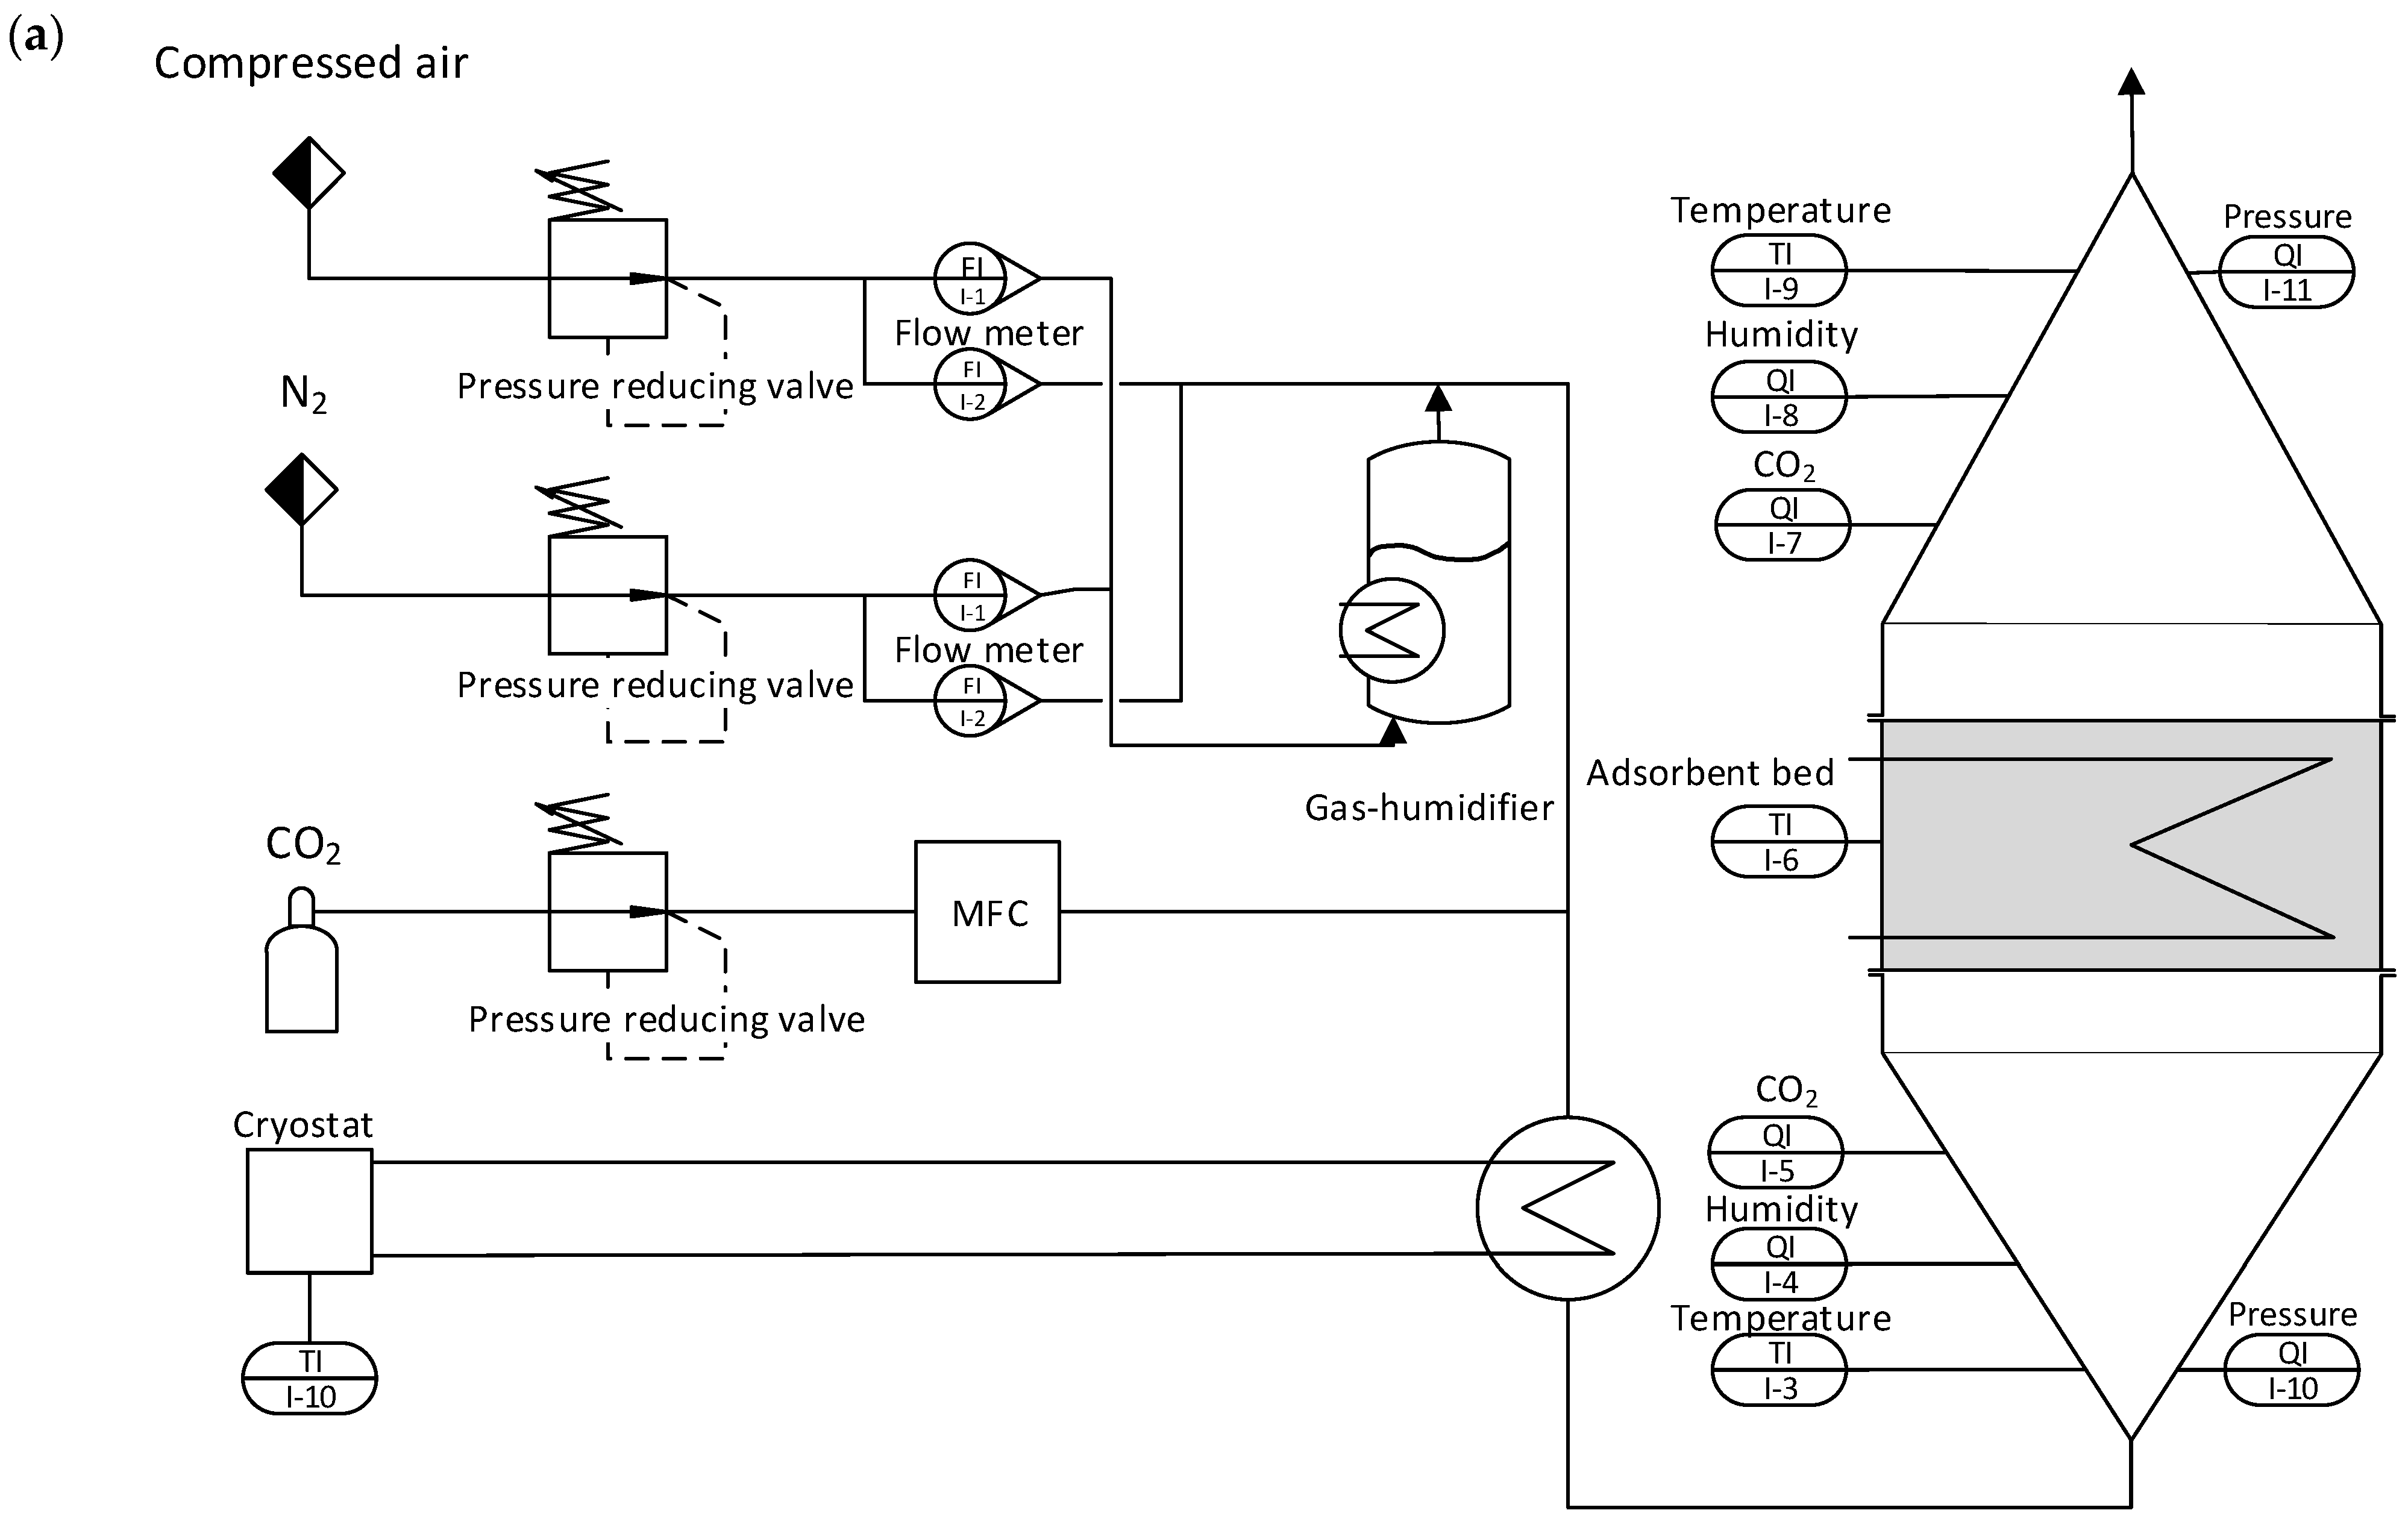
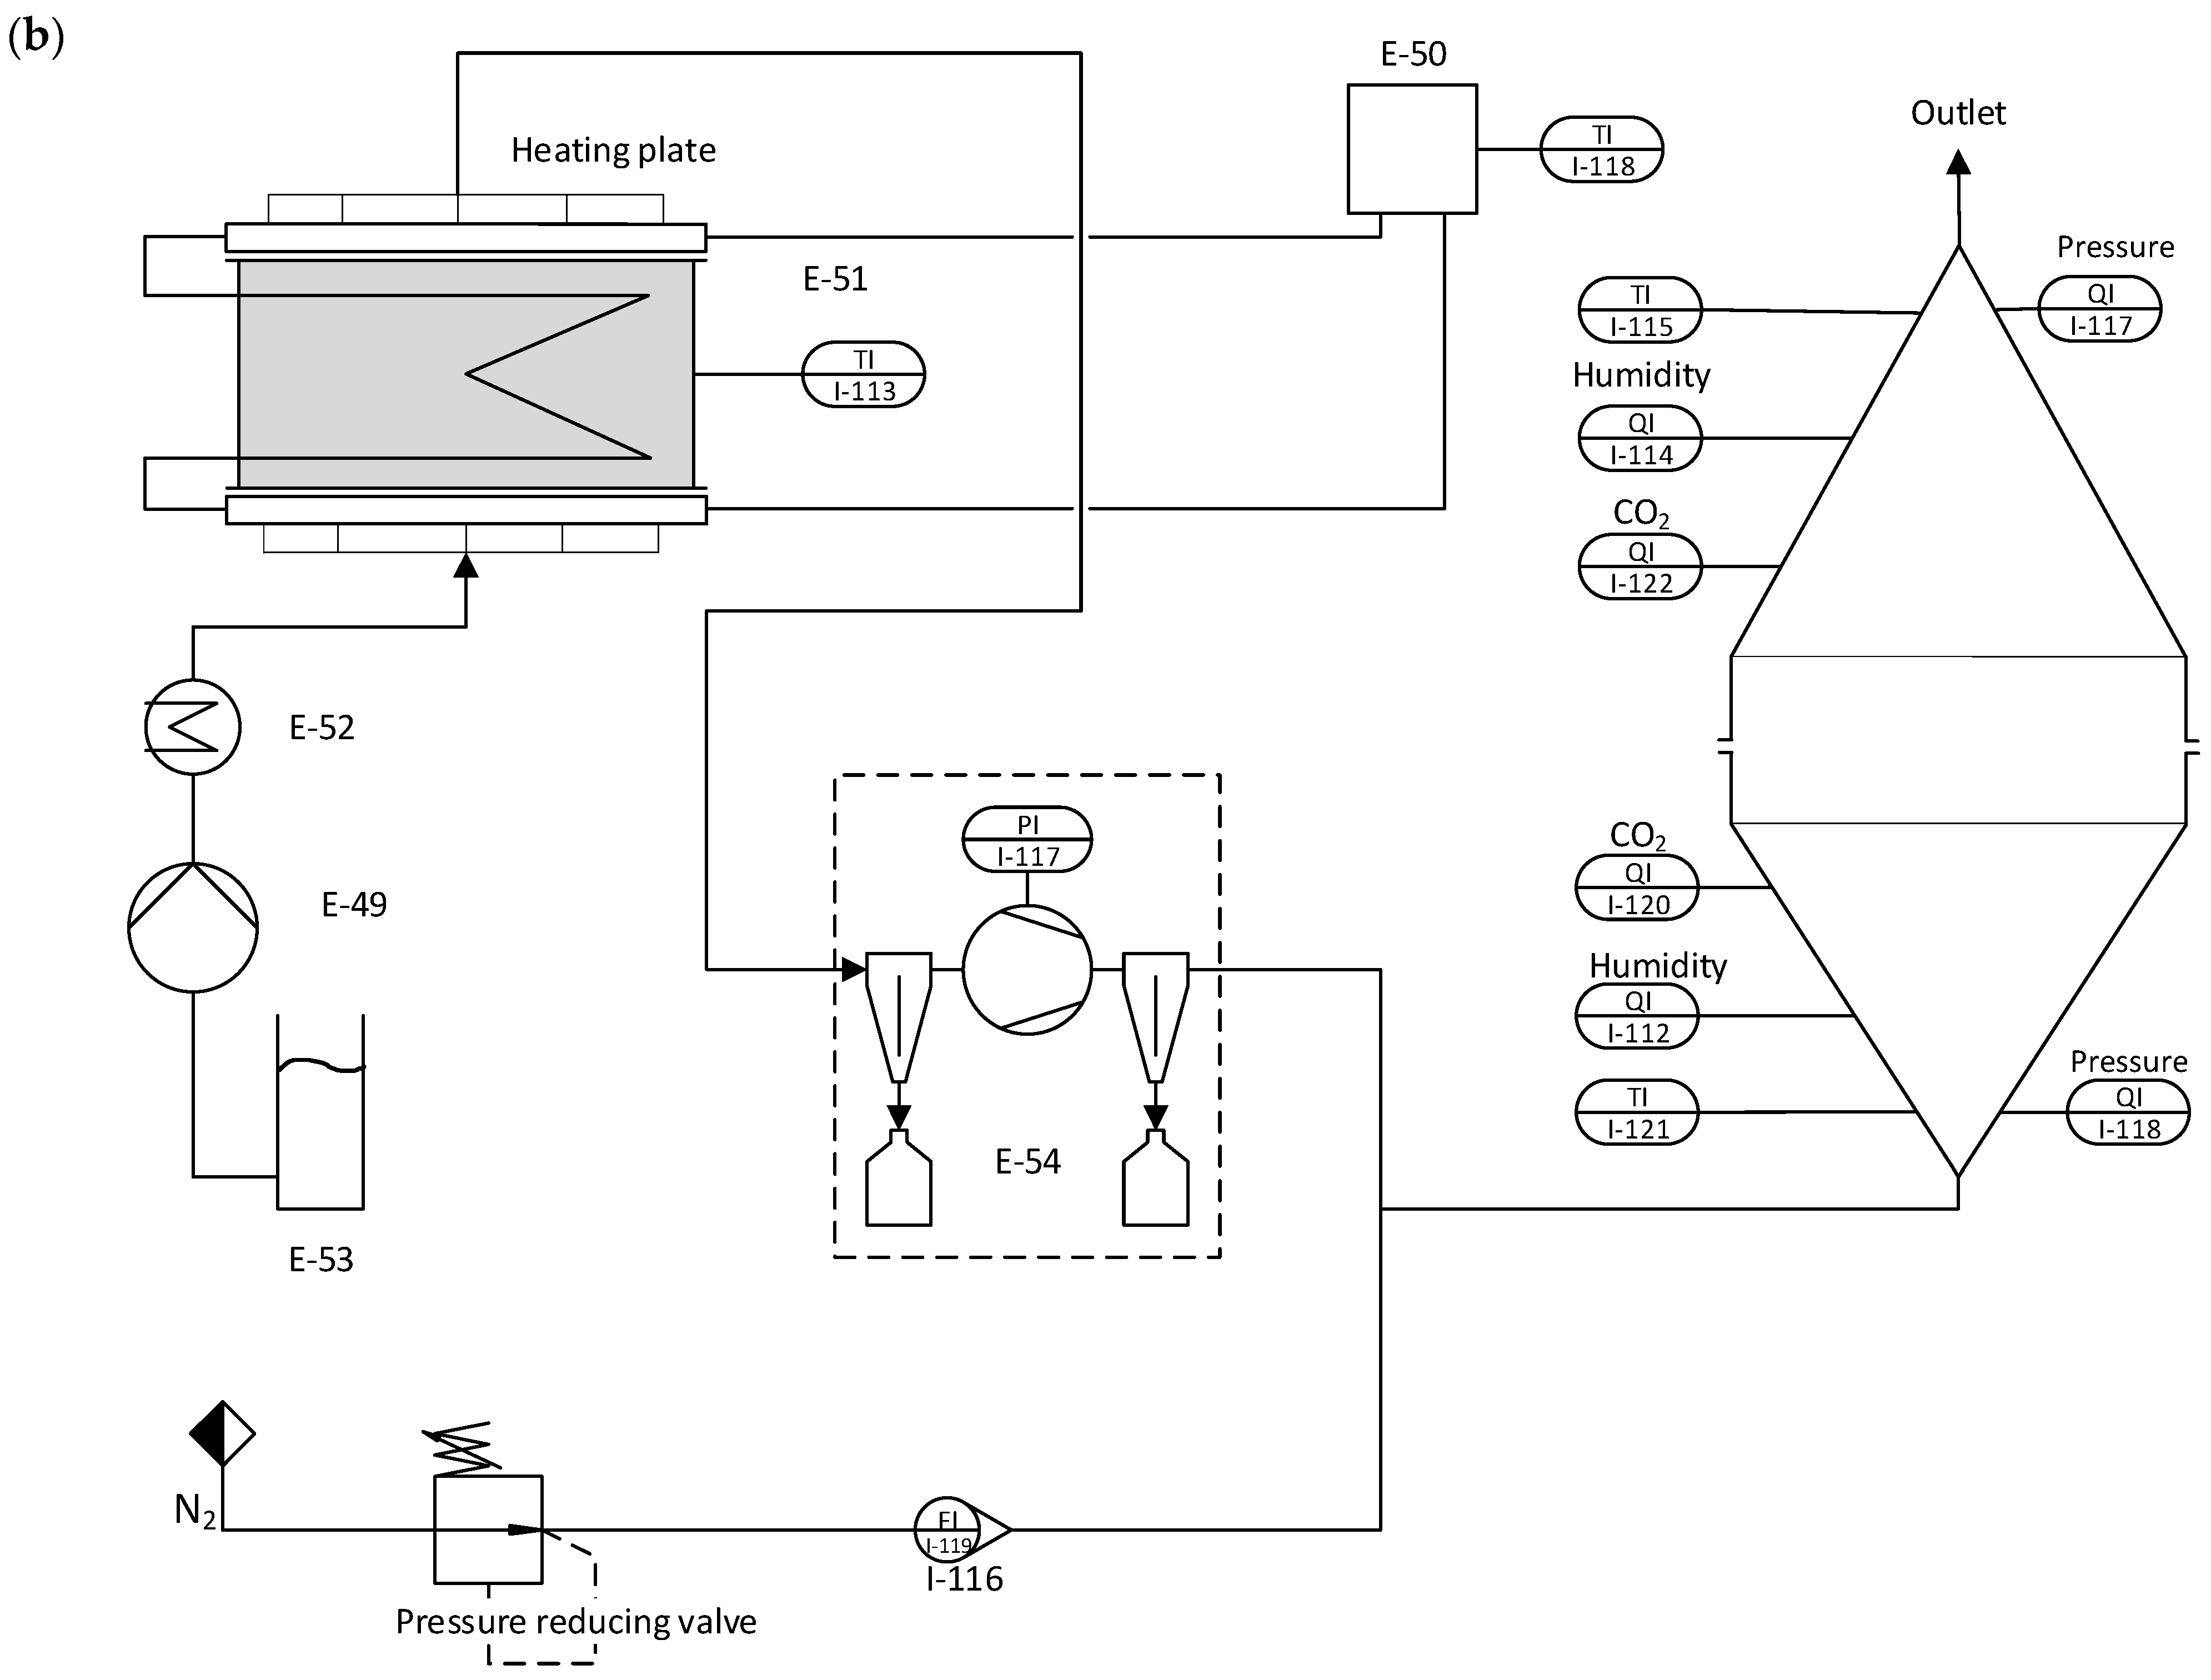
Figure 2a shows a schematic flow diagram of the adsorption setup, and Figure 2b shows the desorption setup. For the CO2 loading of the adsorbent, a stream of dry compressed air containing 450 ± 30 ppm of CO2 is used. To reduce or enhance the CO2 loading of the gas stream, pure CO2 or nitrogen can be added via a mass flow controller (MFC). Part of the humidity of the dry gas stream can be sent through a temperature-regulated humidifier to increase the humidity. Before the gas stream reaches the fixed adsorbent bed, it passes through a honeycomb heat exchanger. This enables precise control over the gas stream’s temperature. The fixed bed containing the adsorbent is located between two cones and sealed off, ensuring the adsorbent is only in contact with the gas stream from the heat exchanger.
The adsorbent bed is mounted between two heating plates made of aluminum in the regeneration setup, as shown in Figure 2b. These heating plates feature fine perforations and an intricate gas channelling system. This design efficiently extracts released gas from the fixed bed while ensuring the uniform distribution of purge gas and preventing the formation of channels. Furthermore, the heating plates have additional channels allowing water or thermal oil to be pumped through, allowing the system to regulate the temperature precisely. It is essential to mention that these two channel systems are separated, and no molecular exchange is happening between the water-saturated CO2 gas stream and the thermal oil. The released gas can be pumped off at the top side on the upper plate, while the purge gas can be introduced at the lower plate. During regeneration, the influence of this purge gas on the desorption process is to be investigated. For this purpose, the apparatus is equipped with a steam generator connected to a membrane pump. The released gas mixture is pumped off via a downstream vacuum pump. A heat exchanger for cooling is installed on the suction side to prevent condensation and overheating in the pump. This heat exchanger collects residual water in the gas stream via condensation. The nitrogen flow is selected so that the downstream CO2 measurement operates in the intended measuring range (0–10,000 ppm). From the N2 flow and CO2 concentration, the absolute amount of CO2 can finally be determined in the originally extracted gas flow.
Pt100 sensors with a diameter of 3 mm are used to measure the temperature in the fixed bed as well as the temperature of the supply air after the heat exchanger. Due to the low inert mass of the sensors, they react immediately to temperature changes and provide reliable data. The humidity sensors, which are installed in the conical pipes, measure not only the relative humidity but also the temperature. Pressure sensors in the conical pipes monitor the pressure loss across the fixed bed. However, due to the low bed height and low gas velocity, the pressure loss is <1 mbar and can therefore be neglected. Table 2 shows a list of the sensors used for the investigations. This is sufficient for adsorption measurements before and after the fixed bed. However, since the gas stream from the vacuum pump is almost pure CO2, it is mixed with a defined quantity of nitrogen. To obtain a homogeneous mixing of the gases and to avoid introducing counterpressure into the vacuum pump, the nitrogen is fed straight through a T-piece. At the same time, the CO2 flows in laterally through a taper.

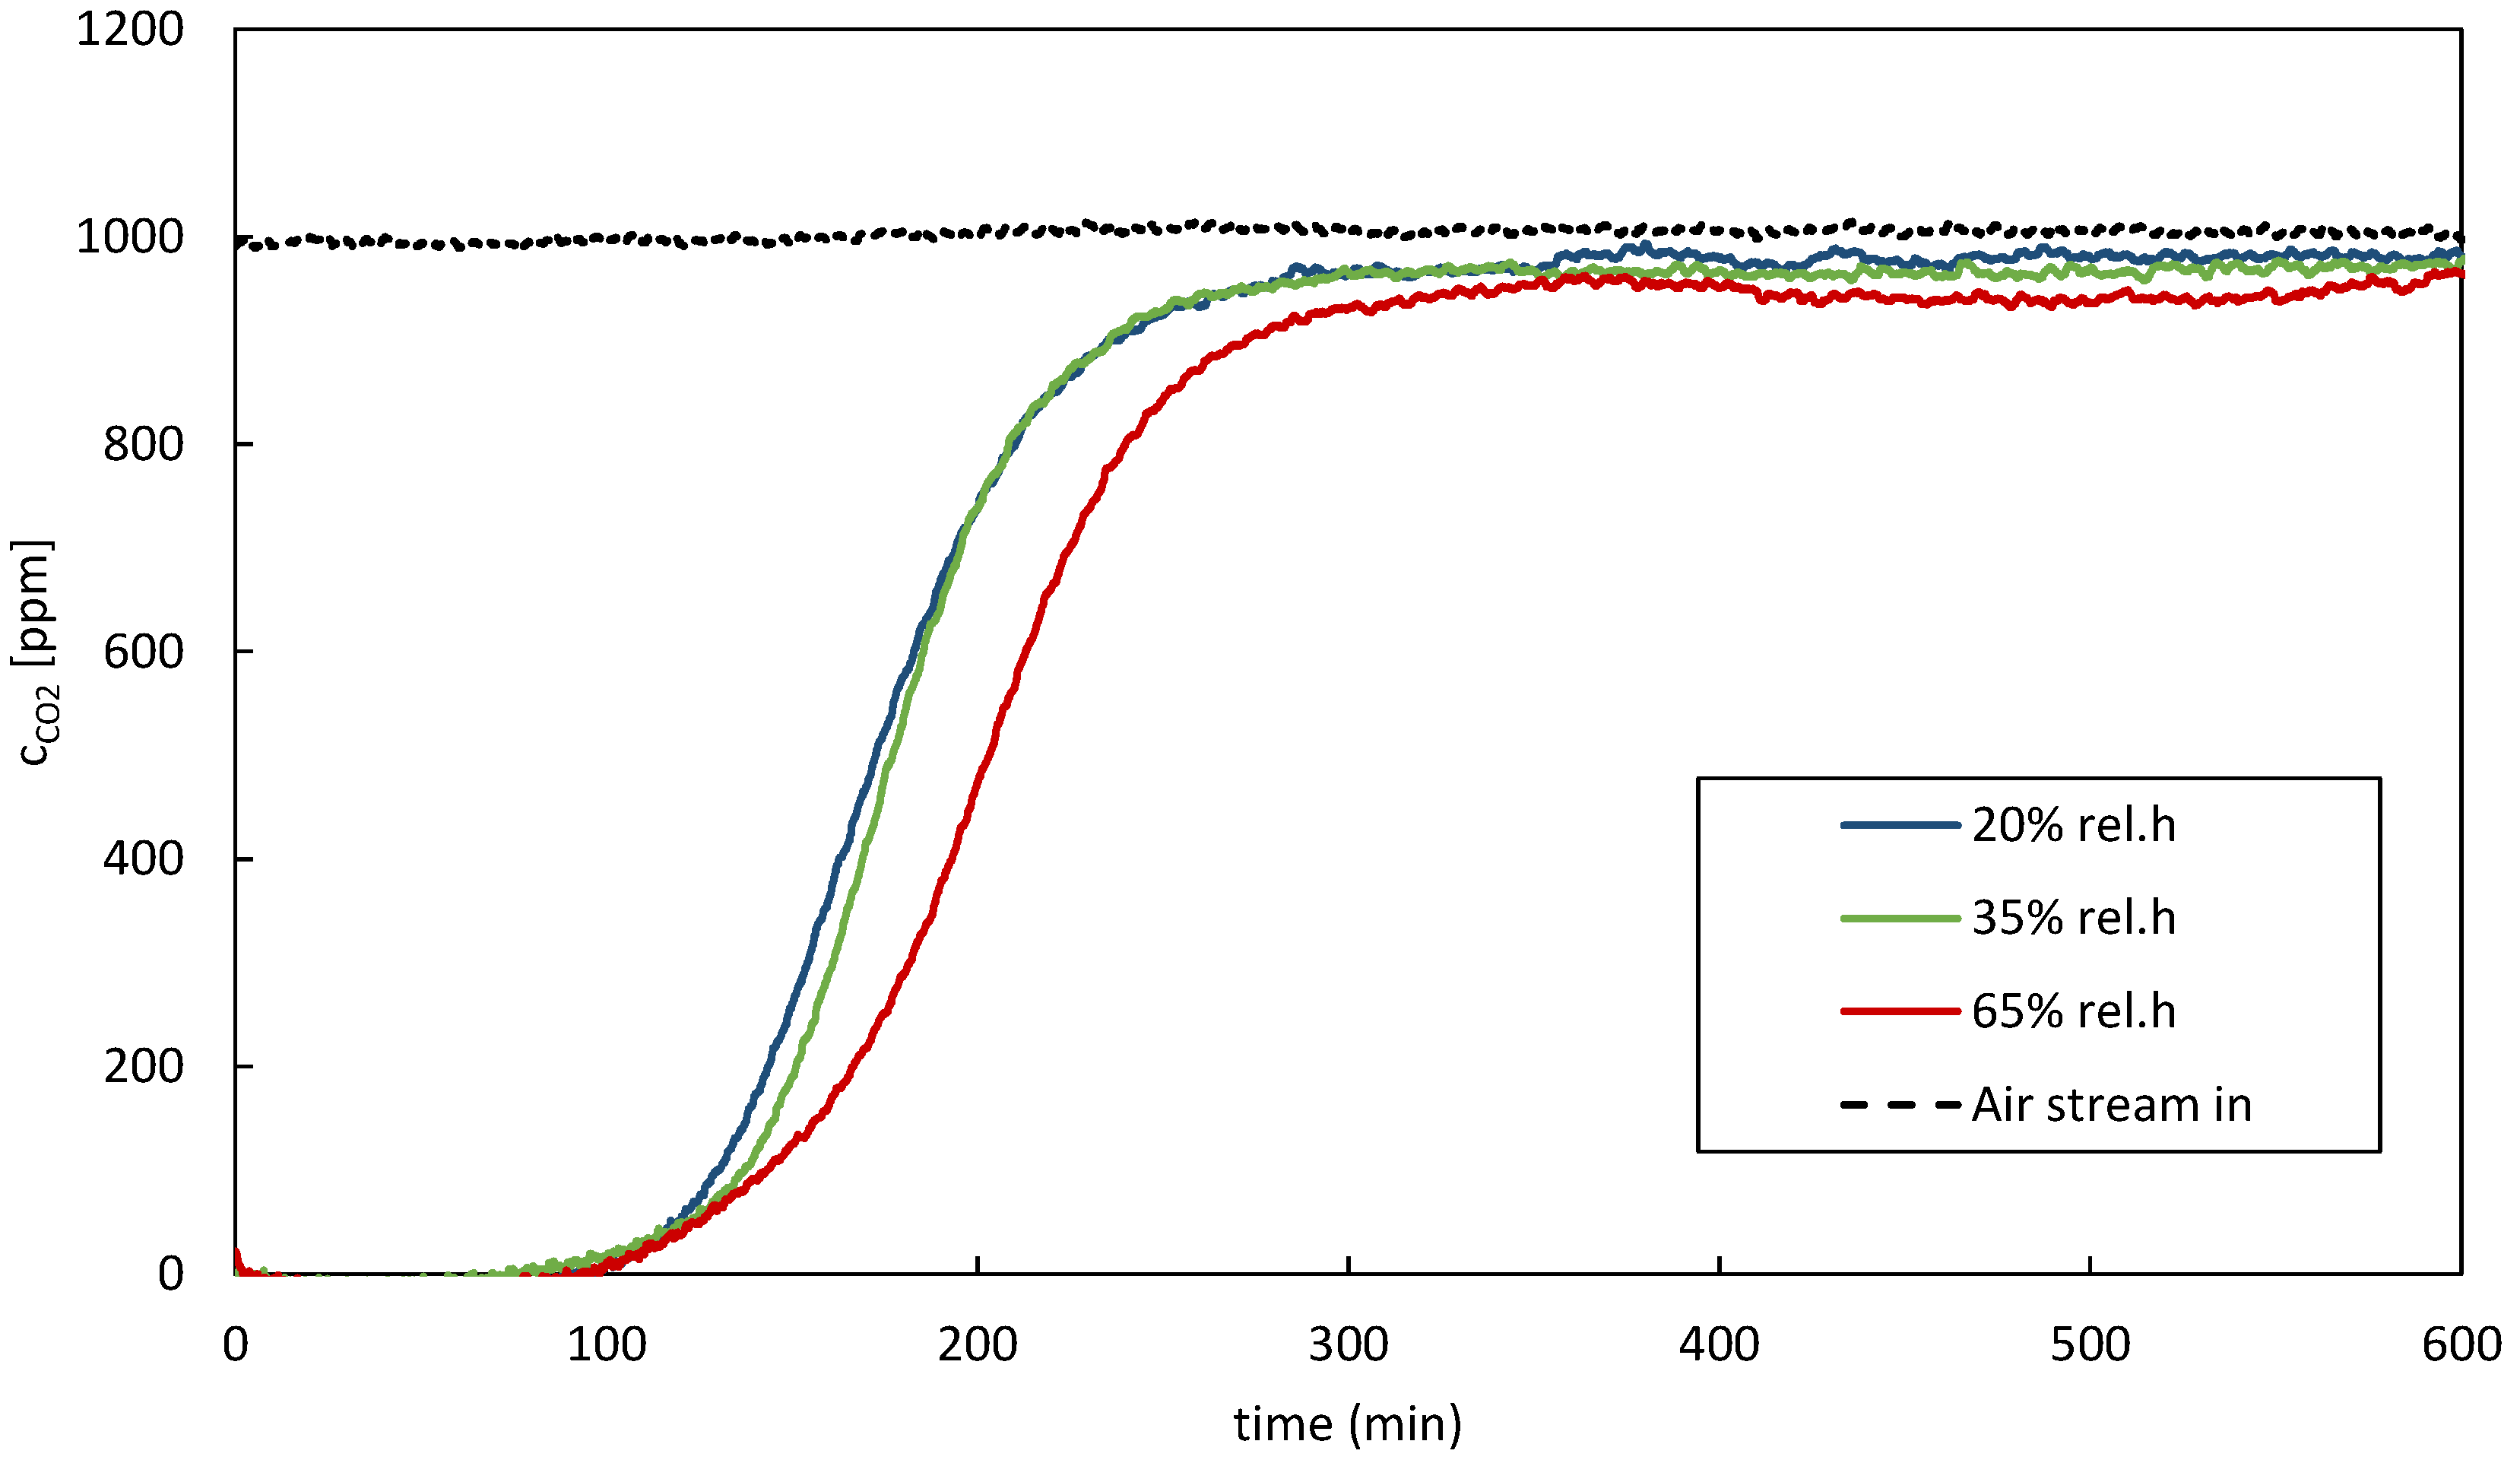
2.2. CO2 Adsorption Experiments

All CO2 adsorption measurements were conducted in an aluminum fixed bed column. Approximately 500 g of adsorbent inside the column was tightly packed and fixed in position with wire meshes. The adsorbent was fully desorbed after each adsorption step. All experiments were carried out using TVSA. The experiment consisted of the adsorbent loading and regeneration phase. The adsorbent loading or adsorption phase was initiated by introducing a CO2/N2- or H2O/N2-loaded air stream for the pure component adsorption data or a CO2/H2O-loaded air stream for the co-adsorption data. During each adsorption step, all operating parameters were kept constant and were recorded at 2 s intervals. Equilibrium was reached when the partial pressure of CO2 measured by sensors before and after the adsorbent bed was consistent, indicating that no further adsorption or desorption was occurring. Various heating and cooling systems were used to ensure isothermal conditions during adsorption. The fluidizing humidifier (bubbler) was held at a constant temperature using a PID controller. The separated dry and humid gas streams are reunited before passing through a heat exchanger, which is temperature-controlled via a cryostat.
After the adsorption was completed, the adsorbent bed was placed onto the desorption apparatus, and the initial evacuation step was initiated. This purging step was crucial to removing residual air inside the adsorbent bed and all other connected tubes. This was realized by connecting the adsorbent bed to a vacuum pump and setting an absolute pressure of 50 mbar for one minute. Although some CO2 can be desorbed through physisorption even during an isothermal evacuation, no measurable CO2 was detected in this step. The adsorbent’s regeneration started once the system’s absolute pressure did not rise when the vacuum pump was turned off. This ensured that the system had no leaks and, thus, no false air was passing through the adsorbent bed.
The heating of the adsorbent during regeneration was realized in two different ways. Two aluminum heating plates transfer thermal energy to the fixed bed via heat conduction. Additionally, the fixed bed is heated from the inside via a heat exchanger in the form of bent 6 mm aluminum tubes. As a purging agent, nitrogen or steam can be used. For the latter, the membrane pump transports a defined amount (75 g/h in this study) of water through an evaporator and into the fixed bed. The vacuum pump was set to a specified pressure setting for the desorption duration to ensure a constant gas stream through the adsorbent bed. After fully regenerating, the adsorbent was cooled to approximately 55 °C to avoid sorbent degradation. The desorption conditions were kept the same for the entire duration of the experiment as presented in Table 3.

2.3. Applied Methods

2.3.1. Adsorption Capacity

The equilibrium loading is determined by balancing according to Equation (1). Adapted for CO2, the formula is as follows.
X = m a d s m a d s o r b e n t = m i n m o u t m a d s o r b e n t
where X is the equilibrium loading of CO2, min and mout are the mass of CO2 entering and leaving the adsorbent bed during the adsorption period, mads is the total mass of CO2 adsorbed, and madsorbent is the total mass of the adsorbent inside the fixed bed when it is not loaded (fully desorbed). For the entire duration of the experiment, it is assumed that there is a constant mass of CO2 flowing into the reactor, and thus the total mass of incoming CO2 min can be calculated. This assumption is justified because no change is made to the reactor inlet stream during this time. To determine the incoming CO2, the duration of adsorption is multiplied by the concentration measured upstream of the reactor after the experiment, using the ideal gas equation.
m i n = t 0 t c V ˙ p M R T d t
where c is the CO2 concentration, V ˙ is the volumetric flow, p is the total pressure (1 atm.), R is the ideal gas constant, T is the temperature, and M is the molar mass of CO2.
The same procedure can be followed for the mass of CO2 leaving the reactor. Here, the total duration of the adsorption is divided into discrete time intervals with a length of 2 s. For these n time intervals, the concentration measured at the outlet is then used to determine an outgoing mass in this time interval. These partial masses are summed up as shown in Equation (3).
m o u t = i = 1 n t i 1 t i c V ˙ p M R T d t
The calculation of the adsorption capacity q C O 2 follows Equation (4):
q C O 2 = m a d s M m a d s o r b e n t

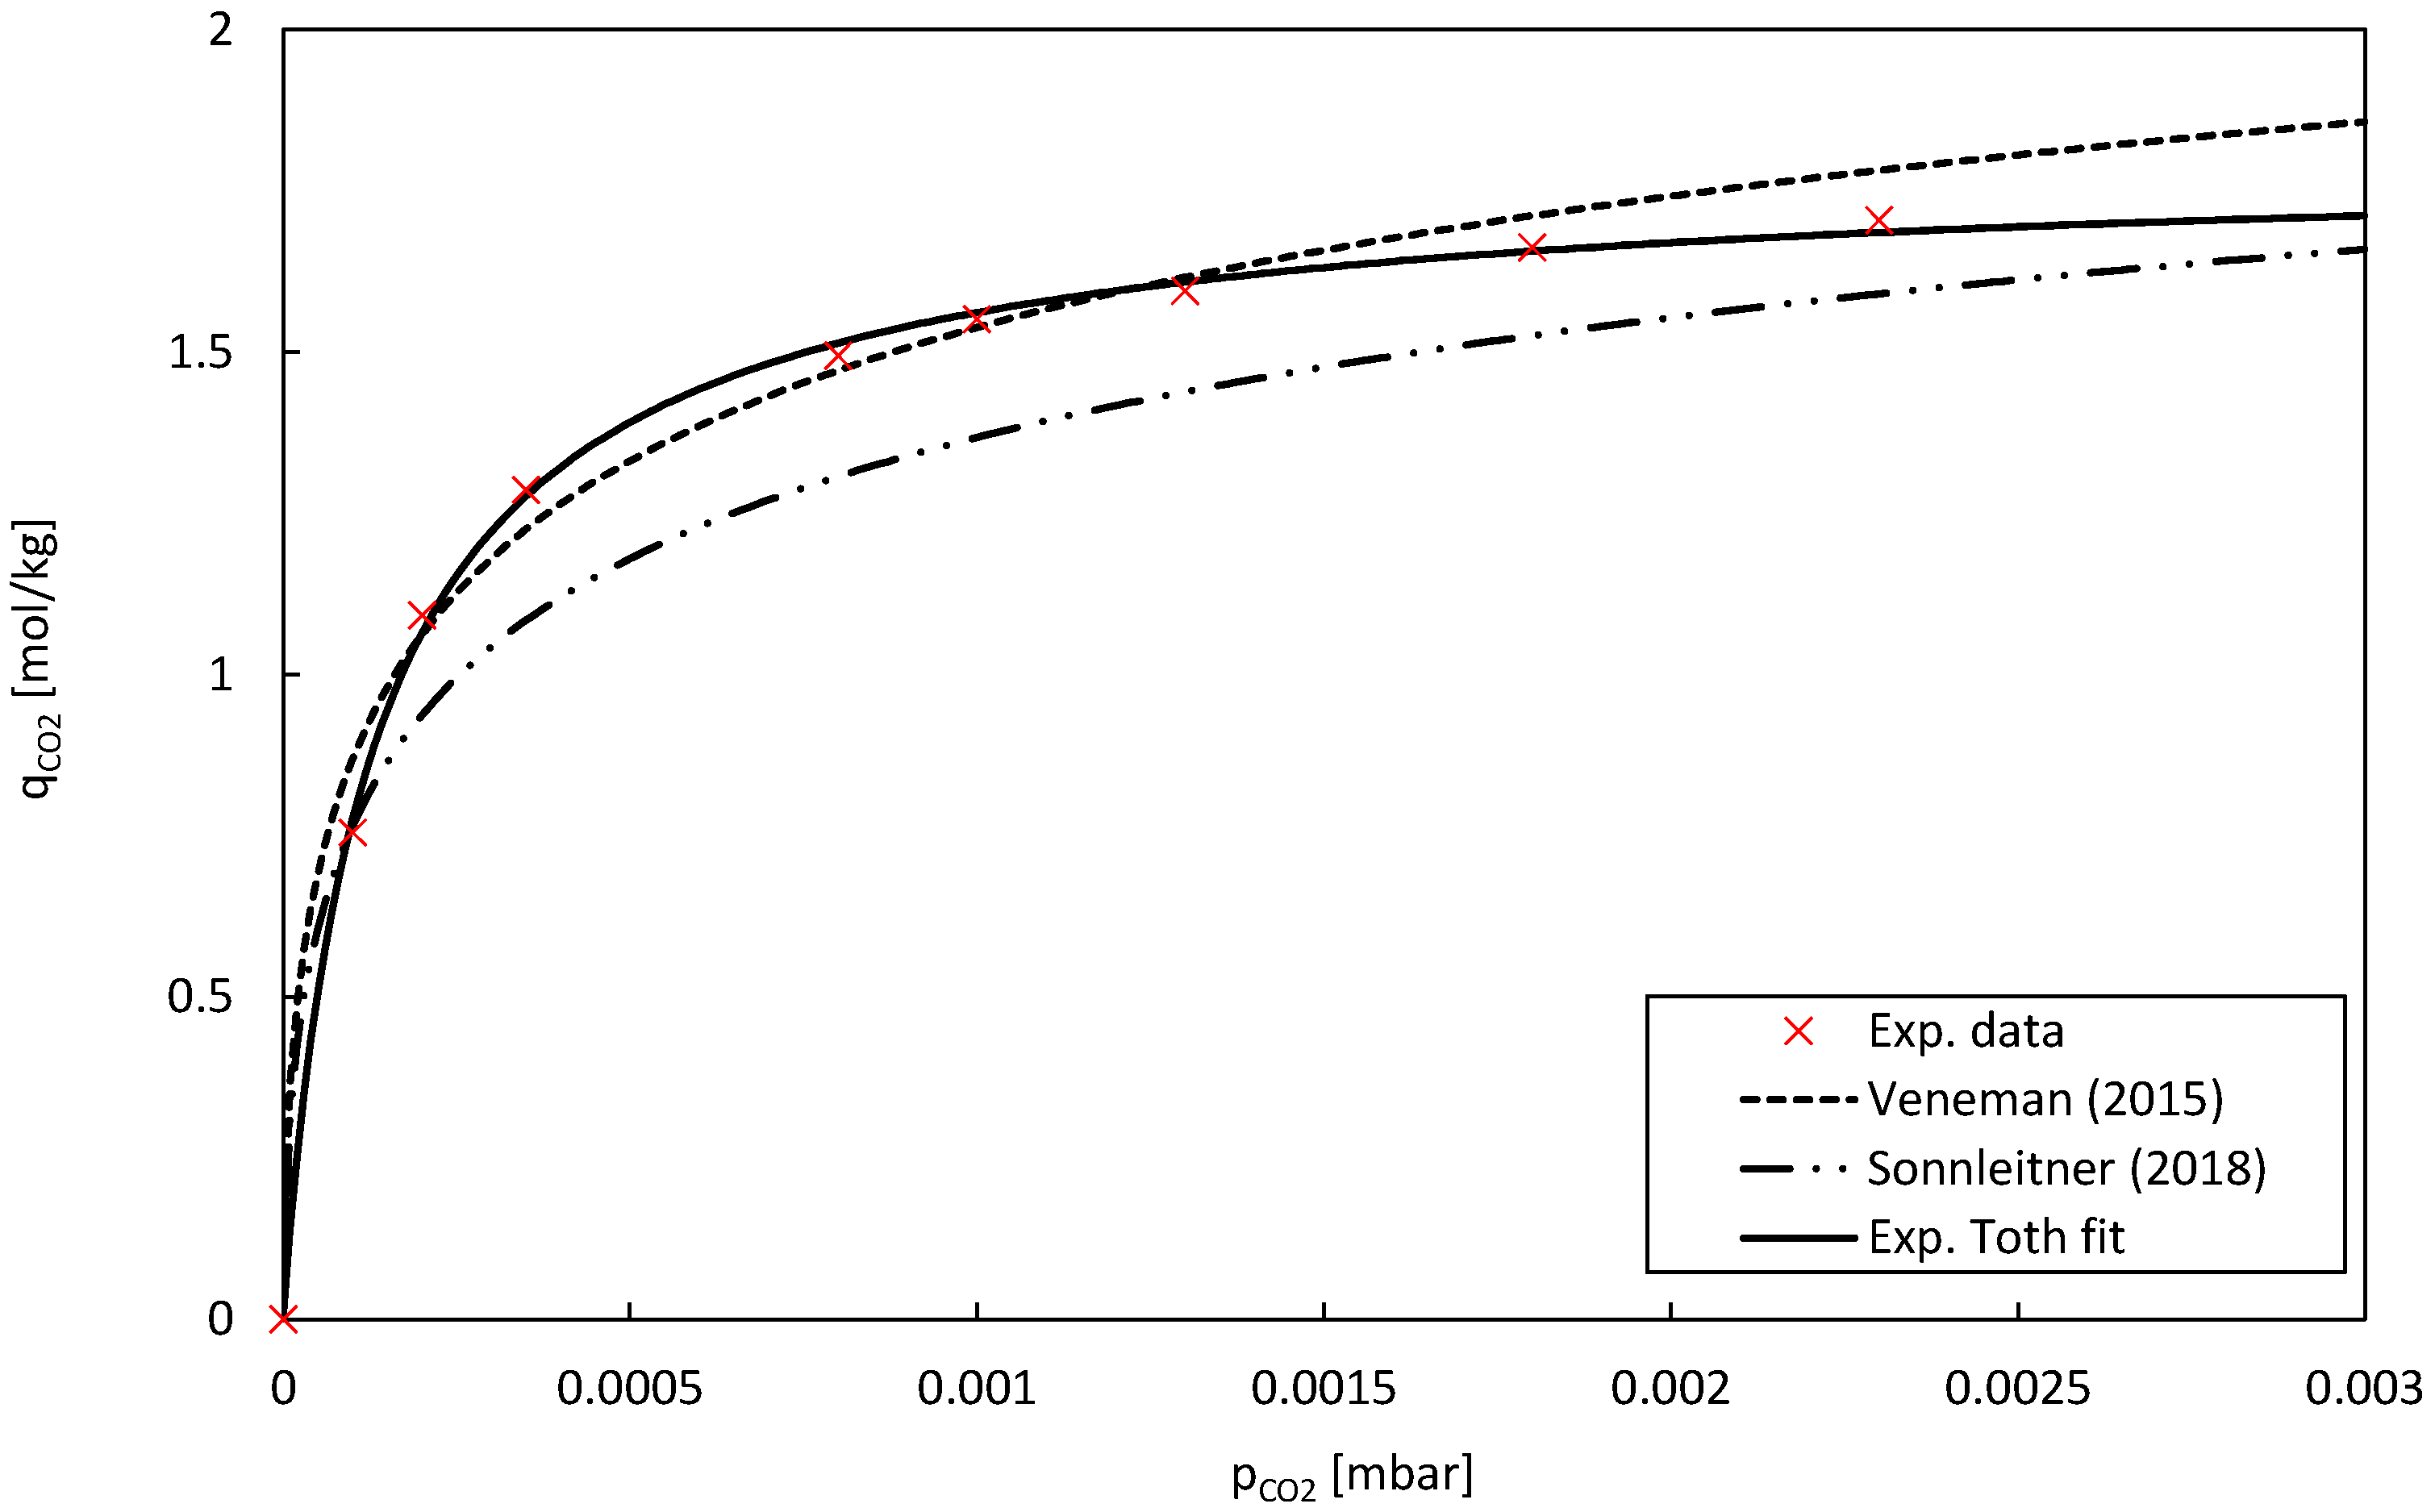
2.3.2. Pure Component Adsorption Isotherms

The pure component CO2 adsorption isotherms were modelled using the temperature-dependent Toth isotherm. For amine functionalized adsorbents, this model has proven accurate for higher CO2 partial pressures [16,20,21], as well as in low partial pressure regions, as is the case for direct air capture [9,22]:
q C O 2 ( T , p C O 2 ) = n s ( T ) b ( T ) p C O 2 [ 1 + ( b ( T ) p C O 2 ) τ ( T ) ] 1 / τ ( T )
where ns is the maximum adsorption capacity, b is the adsorption affinity, p C O 2 is the partial pressure of CO2 in the gas phase, and τ is an exponential factor describing the heterogeneity of the adsorbent called the Toth constant. To obtain the temperature-dependent Toth equation, the aforementioned parameters must also be based on temperature-dependent calculations:
n s ( T ) = n s , 0 exp χ 1 T T 0
b ( T ) = b 0 exp H 0 R T 0 ( T 0 T 1 )
τ ( T ) = τ 0 + α ( 1 T 0 T )
where ns,0, b0, and τ0 represent the values of the Toth parameters at a reference temperature T0χ and α are dimensionless parameters and ∆H0 is the isosteric heat of adsorption at zero fractional loading.
For CO2 capture applications, water adsorption onto solid species is an essential field of study [23,24,25]. The Guggenheim–Anderson–de Boer (GAB) model, an extension of the Brunauer–Emmet–Teller (BET) model, has proven to be the most accurate regarding solid sorbent adsorption. The equation for the GAB model is:
q H 2 O ( φ ) = n m c g K a d s φ ( 1 K a d s φ ) ( 1 + c g 1 K a d s φ )
where q H 2 O is the adsorption capacity at a relative humidity φ and nm is the monolayer adsorption capacity of H2O. The parameters cg and Kads are temperature dependent and are calculated as follows:
c g ( T ) = c 0 exp ( H C R T )
K a d s ( T ) = K 0 exp ( H K R T )
where ΔHC and ΔHk are the adsorption enthalpies of mono- and multilayer adsorption, and c0 and K0 are dimensionless parameters [26,27,28,29].

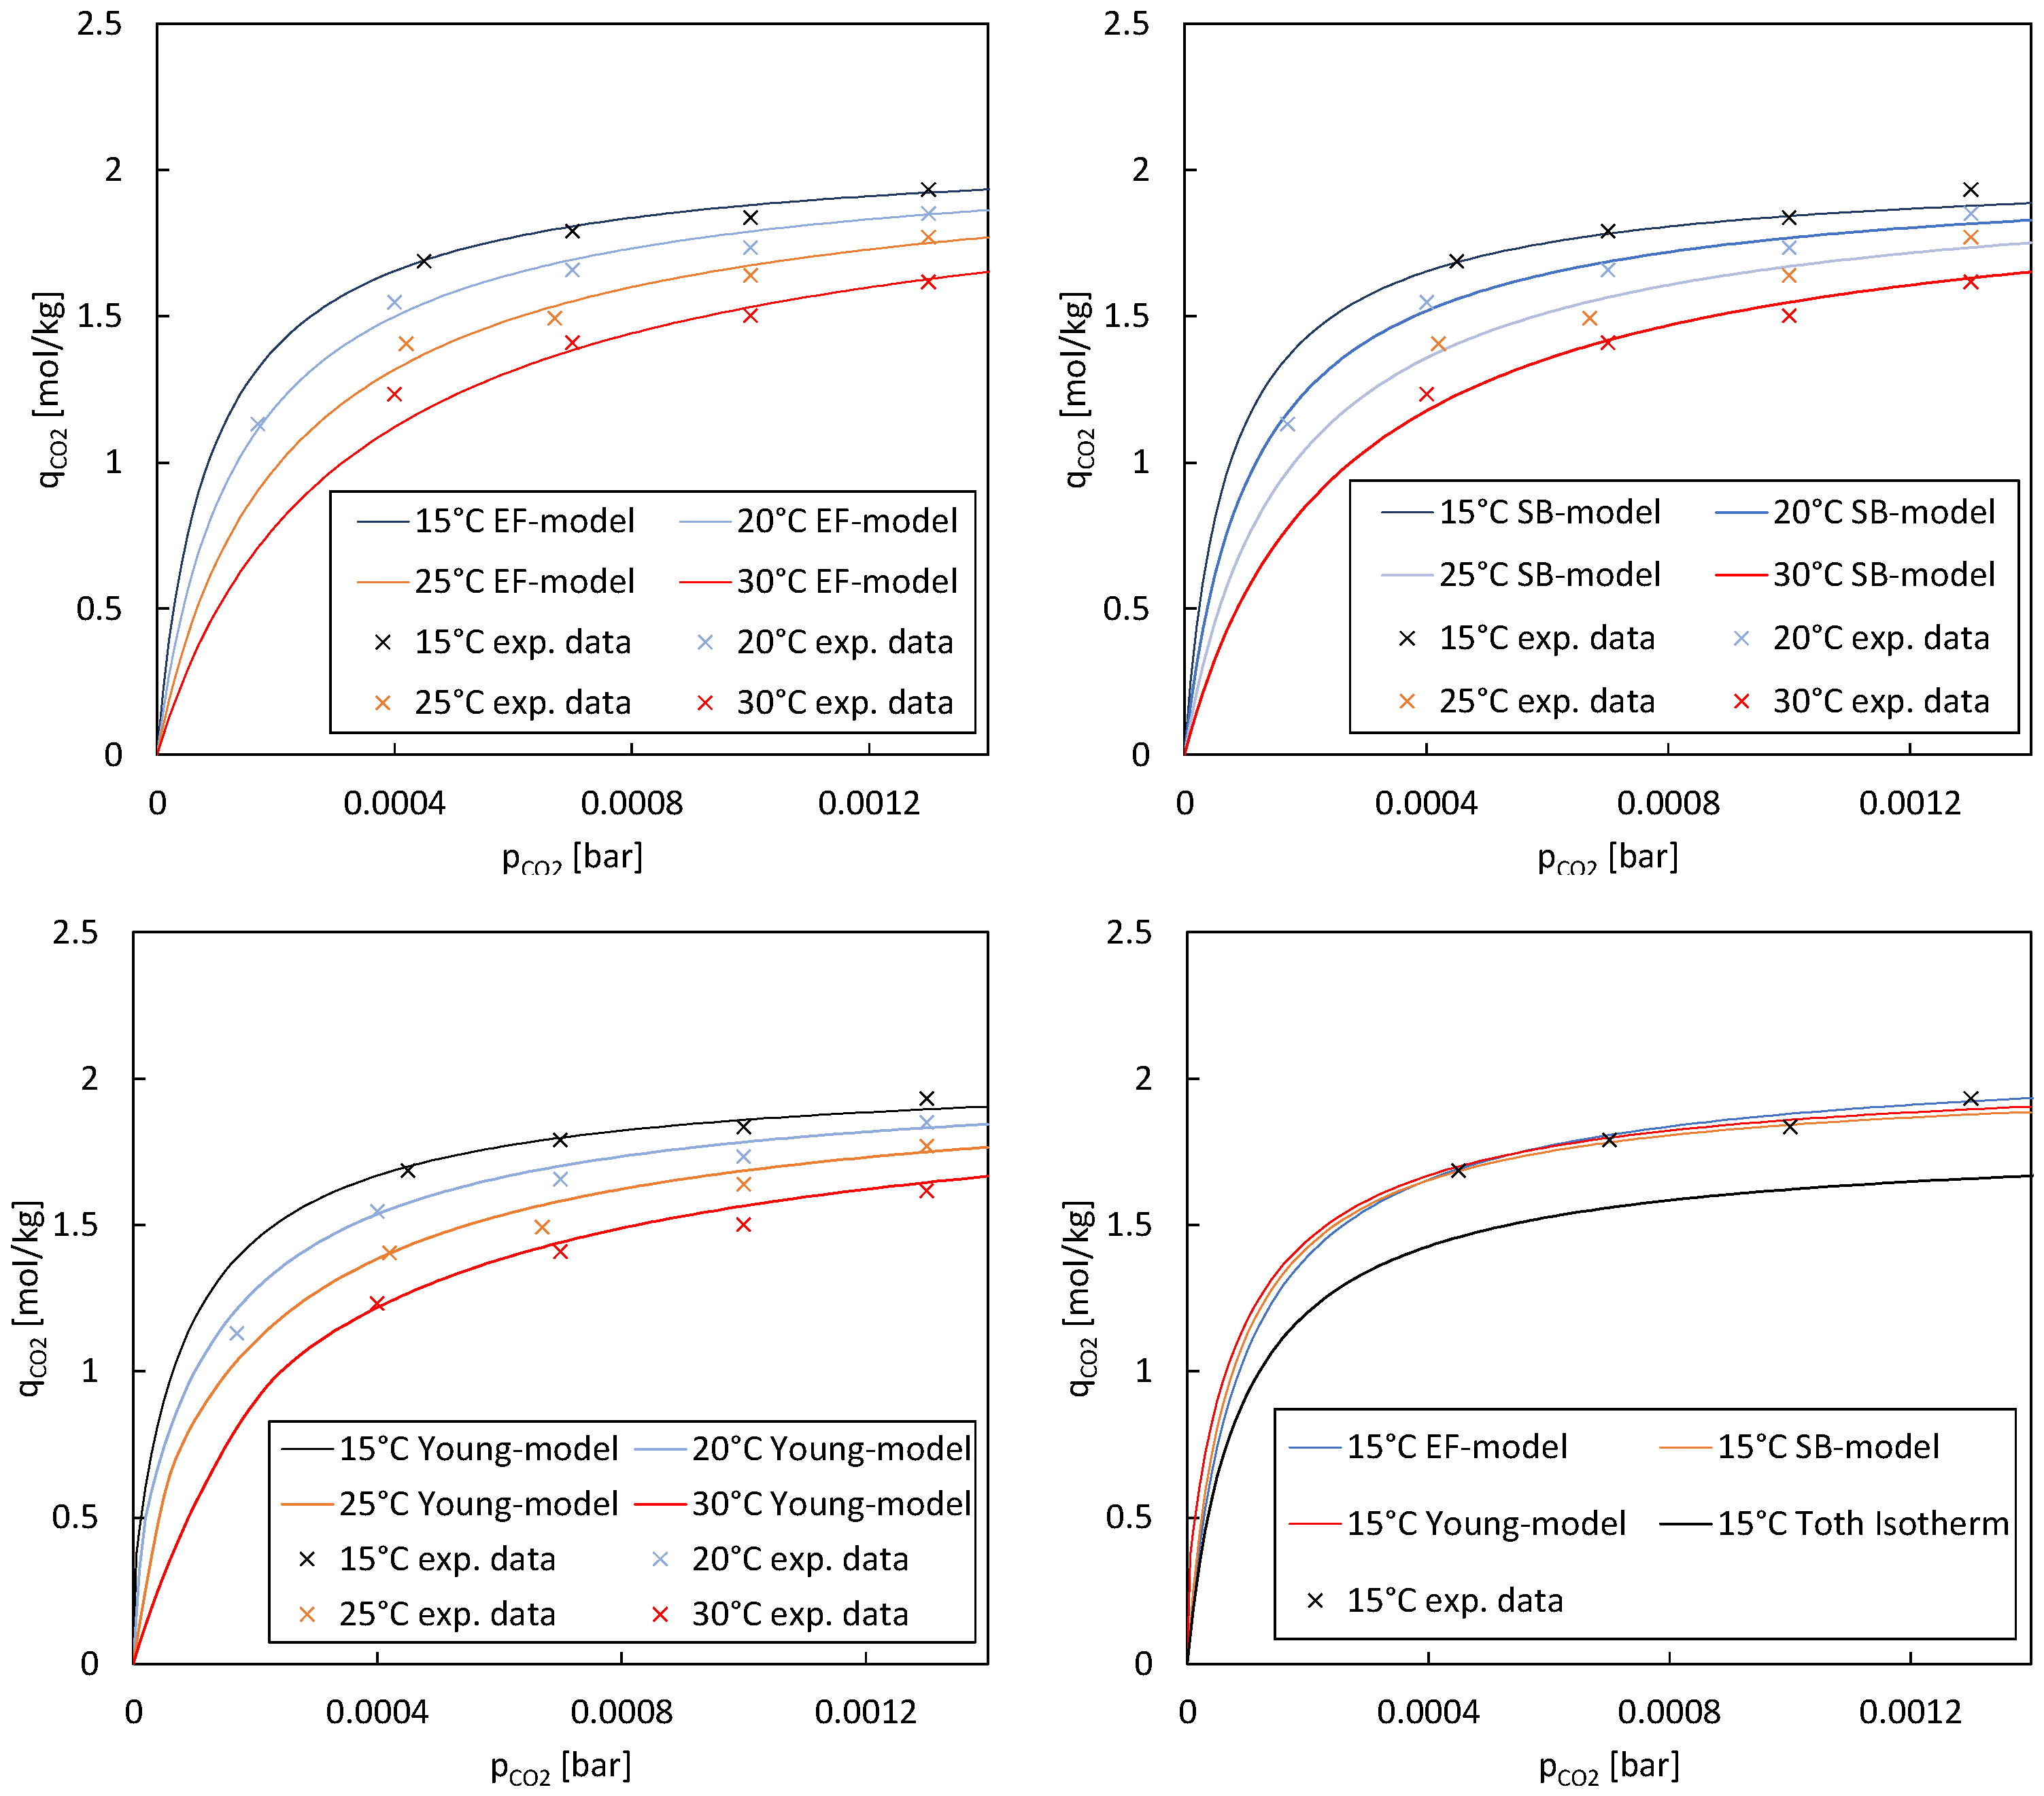
2.3.3. Co-Adsorption Isotherms

Previous research has shown that the presence of water enhances the CO2 uptake of amine-based adsorbents [16,30,31,32], meaning the CO2 isotherm becomes steeper, especially in low partial pressure ranges, and the overall maximum uptake increases. There are different approaches in the literature when it comes to describing the co-adsorption of CO2 and H2O. In the following paragraphs, three different models are compared to describe this phenomenon.
The first approach is empirical, where an enhancement factor (EF) is introduced to describe the adsorption capacity. Wurzbacher et al. [29] used a similar approach to describe binary CO2 and H2O adsorption onto their adsorbent. An enhancement factor βEF is introduced based on previous adsorption data from Sonnleitner et al. [17]. This factor includes a constant k and the relative humidity φ:
q C O 2 ( T , p C O 2 , φ ) = β E F ( φ ) q C O 2 ( T , p C O 2 )
β E F φ = 1 + φ k
A different approach was followed by Stampi-Bombelli et al. [28], where a new isotherm model (SB model) based on the Toth isotherm was proposed. The model accounts for the water uptake dependency in the maximum uptake term ns and the affinity coefficient b:
q C O 2 ( T , p C O 2 , q H 2 O ) = n s ( T , q H 2 O ) b T , q H 2 O p C O 2 [ 1 + ( b T , q H 2 O p C O 2 ) τ ( T ) ] 1 / τ ( T )
n s ( T , q H 2 O ) = n s 1 1 y q H 2 O y > 0
b T , q H 2 O = b T 1 + β q H 2 O β > 0
This model results in an increased maximum CO2 uptake and isotherm affinity when water is present in the gas and it reduces to the single component Toth model when water is absent.
The third approach is the weighted average dual-site Toth (WADST) co-adsorption model introduced by Young et al. [27]. This approach is based on the different availability of water molecules at sites on the adsorbent where one site has a water molecule available, and the other does not. The probability that one site has a water molecule available is described via an Arrhenius-style equation described by a critical water loading parameter A.
q C O 2 ( p C O 2 , q H 2 O , T ) = 1 e A q H 2 O n s , d r y T b d r y T p C O 2 [ 1 + ( b d r y T p C O 2 ) τ d r y T ] 1 τ d r y T + e A q H 2 O n s , w e t ( T ) b w e t T p C O 2 [ 1 + ( b w e t T p C O 2 ) τ w e t ( T ) ] 1 τ w e t ( T )
The first part of the equation simply describes the Toth model shown in Equation (5) including the fitted parameters from the pure component adsorption isotherms, while the wet site is defined by the same equations and fitted to co-adsorption experiments. While the same model for the adsorption capacity q H 2 O is used, Equation (9) describes the temperature dependency of cg and Kads according to Anderson’s derivation [33] as follows:
c g ( T ) = exp ( E 1 E 10 + R T )
K a d s ( T ) = exp ( E 2 9 E 10 + R T )
E 1 ( T ) = C exp ( D T )
E 2 9 ( T ) = F + G T
E 10 + ( T ) = 44.38 T + 57220
where E1 refers to the heat of adsorption for the 1st layer, E2–9 represents the heat of adsorption for the 2nd to 9th layers, and E10+ corresponds to the heat of adsorption for the 10th layer and beyond, which is comparable to the latent heat of water condensation. The unknown dependencies of temperature (C, D, F, G) on E1, E2–9, and E10+ were empirically fitted to experimental water isotherms for Lewatit.

3. Results

3.1. Adsorption Breakthrough Curves

Adsorption performance evaluation was implemented in three different test series. For this purpose, an elaborate test matrix was defined in which the supplied air temperature, the CO2 concentration, and the relative humidity in the supplied airflow were changed (Table 4). This matrix involved a total of 24 adsorption tests followed by a constant regeneration of the adsorbent. A constant volume flow of 6 Nm3/h was sent through the fixed bed over the entire duration of the experiment. The temperature variation between 15 °C and 30 °C represents typical direct air capture conditions. For this purpose, comparisons were made between the tests, which differed only in the parameter investigated under otherwise identical or averaged conditions. The regeneration of the adsorbent after every adsorption was carried out with a set vacuum pump pressure of 300 mbar(a), 75 mL/h/kgLewatit membrane pump flow rate (conveying water into the evaporator), and 90 °C cryostat temperature for external heating. Table 3 shows a detailed summary of the desorption conditions.
The first experiments with 400 ppm CO2 in the supplied air stream showed slower adsorption due to the low CO2 concentration, as seen in Figure 3a. At 15 °C, equilibrium loading was reached after about 10 h. As expected, the lower temperature of the supply air stream positively affected the maximum CO2 uptake of the adsorbent. In the first 200 min of the test, the data showed that practically no CO2 was measured after the adsorbent bed. To gain valuable insights into separation efficiency and adsorption kinetics, it is recommended to increase the gas-to-solid (G/S) ratio and operate the experiment as an ideal fluidized bed. The initial kinetics and separation efficiency at zero loading can only be obtained this way. After a certain amount of CO2 has passed through the adsorbent bed, the so-called breakthrough occurs where an increase in the CO2 concentration after the bed is first visible. The expected trend in the breakthrough time starting at 30 °C with falling temperature down to 15 °C of supply air temperature was confirmed during the experiments. The measured carbon dioxide captured during subsequent desorption fitted well with the adsorption data. In accordance with the adsorption data, the desorbed CO2 mass decreased with the increasing supply air temperature of the previous adsorption.
For the experiments with higher CO2 concentrations than 400 ppm, CO2 was added to the supply air stream using a mass flow controller. Therefore, it was possible to precisely adjust the CO2 concentration and compensate for natural fluctuations of the CO2 content of the ambient air. The same behaviour regarding equilibrium loading and breakthrough curves could be observed. With increasing temperature, the equilibrium loading and total adsorption time decreased. In case of the experiments with 700 ppm of CO2, shown in Figure 3b, the overall desorption time was reduced to approximately 6.5 h. A similar reduction in desorption time could also be determined for the experiments with 1000 and 1300 ppm of CO2. During these experiments, shown in Figure 3c,d, desorption times of 5 h and 3.5 h were achieved, respectively.
No increase in the fixed-bed temperature was observed over the entire duration of the tests. Although the adsorption of CO2 is an exothermic reaction, the heat generated during the reaction had no relevant effect. This is due to the relatively large volume of air that flows around the adsorbent and immediately dissipates any heat. Overall, the data clearly indicated the significant impact of partial pressure on the overall adsorption time.
Veneman et al. [16] reported that the presence of CO2 does not significantly affect the sorption capacity of Lewatit VP OC 1065 for H2O. However, the adsorption capacity for CO2 can dramatically increase when water is present. This phenomenon has been observed before for other amine-based adsorbents and is attributed to the interference of H2O in the adsorption mechanism [34,35,36]. The presence of water influences the reaction stoichiometry during CO2 adsorption because water can act as a free base. This facilitates the formation of bicarbonate ions, enabling one amine group to potentially react with one CO2 molecule. On the other hand, under dry conditions, the absence of water leads to carbamate formation. Hence, the reaction requires two amine molecules to bind one molecule of CO2. This discrepancy in stoichiometry highlights the significance of water in the adsorption process [27].
Figure 4 shows the impact of the variation of relative humidity in the supply air stream. Looking at the breakthrough curves with the corresponding CO2 balances confirms the above-stated observations. Higher relative humidity in the supply air stream causes an increase in adsorption time; therefore, an improved CO2 uptake can be confirmed. It is important to mention that some materials may experience a decrease in adsorption capacity due to pore blockage or competition for adsorption sites between water and CO2.

3.2. H2O and CO2 Adsorption Isotherms

Most research today uses TGA to obtain pure component CO2 and H2O isotherms, as it serves as a valuable tool for investigating adsorption behaviour [20,31,37,38,39]. However, the unique setup used in this study allows for precise measurements of pure component isotherms without the use of TGA. The mathematical model used for curve fitting was based on the GAB model Equations (9)–(11), where Kads, cg, and nm represent the parameters of interest. This study utilized a least squares curve fitting approach in MATLAB, called the “lsqucurvefit” function. By fitting the model equation to the experimental data points using the least squares method, the MATLAB code iteratively adjusted the parameter values to minimize the sum of squared differences between the predicted and actual measured equilibrium loadings. Evaluating the accuracy of a model entails comparing its predictions or fitted values with experimental data. We utilized the coefficient of determination (R2) as a metric to quantify the accuracy of our fit. The resulting parameter values provide valuable insights into the water sorption behaviour of Lewatit under different relative humidity conditions. The H2O adsorption isotherm obtained coincides with the literature data for the same material [16,18].
The adsorption isotherms for pure CO2 were obtained and fitted using the same methodology as employed for the H2O isotherms. The isotherms were compared to previous adsorption experiments at TU Wien by Sonnleitner et al. [17] using a fluidizing bed reactor as well as TGA. The temperature-dependent Toth isotherm model described in Section 2.3.2 was used for these isotherms. In the presence of extremely low partial pressures of CO2, the fitted data demonstrate equilibrium loadings comparable to the findings reported by Veneman et al. [16]. Moreover, the equilibrium loadings are slightly elevated compared to the results reported by Sonnleitner et al. [17] for Lewatit. Given that both models are optimized for higher equilibrium loadings, discrepancies between the experimental data and the models become evident at elevated partial pressures of CO2.
The slight variations in the CO2 adsorption capacity results obtained could be attributed to several factors. The particle size of the adsorbent material may not have been uniform across the samples used in the tests. Variations in particle size can affect the available surface area for adsorption and thus impact the results. Also, different batches of the adsorbent material obtained from production might exhibit slight variations in their chemical composition or physical properties, leading to differences in CO2 adsorption capacities. Furthermore, variations in the amine loading, which refers to the amount of amine functional groups attached to the adsorbent material, can affect its adsorption capacity for CO2. Other possible points of difference include testing methodology, sample preparation, measurement techniques, and material aging. These factors highlight the importance of controlling and standardizing these parameters to ensure consistent and comparable results in CO2 adsorption studies.
The temperature-dependent Toth model parameters, as well as the GAB model parameters, are given in Table 5. The values for the heat of adsorption ΔH0 are within reasonable boundaries for amine-functionalized solid adsorbents in low partial pressure ranges, ensuring credibility and justifying the adoption of these data in the models used [9,27,40]. Figure 5 illustrates the adsorption isotherm of water on Lewatit, while Figure 6 displays the CO2 adsorption isotherms on the same material.

3.3. Co-Adsorption CO2 Isotherms

Figure 7 presents the co-adsorption CO2 isotherms in low partial pressure regions at a relative humidity of 35–38% and different temperatures. Since the pure component temperature-dependent Toth model lacks the effect of H2O, the models based on Equations (12)–(22) were used. As reported by Young et al. [27], the co-adsorption enhancement effect is particularly noticeable at lower CO2 concentrations, leading to increased adsorption capacity compared to dry conditions. This finding is crucial for DAC processes, which typically operate at partial CO2 pressures around 0.4 mbar. As the partial pressure of CO2 increases, the enhancement effect tends to become negligible. Nonetheless, this behaviour is advantageous for DAC, as desorption typically begins at significantly higher partial pressures than adsorption. If the enhancement effect of water remained high during desorption, it would hinder the desorption process by competing with CO2 for adsorption sites and potentially impeding the release of CO2 molecules. The parameters of the three models used in this study are shown in Table 6.

4. Discussion

In this study, we evaluated three different models, namely, the EF model, SB model, and Young model, to describe the adsorption isotherms of a particular system across various temperatures. We selected these three distinct co-adsorption models from the literature because each offers a fundamentally different approach. By choosing models with diverse theoretical foundations, we aimed to facilitate a comprehensive comparison and evaluation of their respective strengths and limitations. Our analysis focused on the coefficient of determination (R2) as a measure of how well each model fitted the experimental data (see Table 7). Our findings revealed notable differences in the performance of the models across different temperatures. The EF model exhibited higher R2 values at lower temperatures, such as 15 °C, indicating a better fit to the experimental data in these conditions. Conversely, the SB model and Young model demonstrated more consistent performance across a range of temperatures.
When considering the overall fit across all temperatures, the SB model and Young model emerged as strong contenders, with comparable R2 values suggesting robust performance across varying temperature conditions. These models provided a good representation of the adsorption isotherms, capturing a significant proportion of the variance in the experimental data. These results underscore the importance of evaluating model performance across different temperature regimes. The temperature sensitivity observed in the EF model highlights the necessity of considering temperature effects when selecting an appropriate model for describing adsorption processes. The experimental data exhibited variations and potential sources of inaccuracies. Maintaining constant parameters like temperature, relative humidity, and CO2 partial pressure while investigating the impact of a single parameter proved challenging. It has been found that experimental conditions have a more prolonged effect on adsorption results than just one adsorption and regeneration cycle. To ensure accuracy, multiple measurements were performed under controlled conditions, and the results were validated through comparison with known standards or the literature data. Overall, while experimental measurements may have inherent variability, efforts were made to minimize uncertainties and ensure the reliability of the equilibrium loading and CO2 uptake capacity values reported in the study. However, additional investigations are required to assess the impact of relative humidity on the isotherms.
While the R2 values offer valuable insights into model performance, it is essential to interpret them in the context of other factors. Factors such as the physical basis of the models, simplicity versus complexity, and their ability to generalize to new conditions should also be considered in model selection.
In conclusion, our study provides valuable insights into the suitability of different models for describing adsorption isotherms across varying temperature conditions. The findings contribute to a better understanding of adsorption processes and aid in the selection of appropriate models for predictive purposes in practical applications.
When evaluating the suitability of the laboratory unit compared to TGA, it is important to consider different aspects. The laboratory unit offers several advantages. First, it allows greater flexibility in adjusting parameters such as pressure, temperature, and gas composition. In comparison, TGA usually offers more limited adjustment options. Real-time analysis of dynamic processes cannot be achieved using standard TGA setups, which can be a limitation when studying fast reactions or phenomena. In addition, the laboratory unit can often simulate more realistic conditions specific to the system or process under study. This allows for more accurate modelling of actual adsorption conditions. Another vital advantage of the laboratory plant is that it can accommodate co-adsorption isotherms. In contrast, TGA usually focuses on the adsorption of a single gas. The laboratory system can provide a more realistic representation of complex adsorption processes in which multiple gas components are adsorbed simultaneously by recording co-adsorption isotherms. This is particularly relevant for applications such as gas purification or DAC.
The ability to record co-adsorption isotherms allows more accurate characterization of the interactions between the different gas components and the adsorbent. This allows, for example, a better understanding of synergistic effects or competitive phenomena during adsorption and desorption. This understanding is essential to improve the efficiency of adsorption processes and to determine optimal conditions for the adsorption of specific gas components. Additional conditions and measurements may vary depending on the study’s specific objectives. For example, variations in temperature and pressure can be used to study the effects on adsorption capacity and other adsorption properties. Isotherm measurements at different partial pressures of the adsorbate molecule can be performed to determine adsorption isotherms and better understand adsorption behaviour. Desorption studies allow the investigation of desorption behaviour and provide information on the stability and reusability of the adsorbent.

5. Conclusions

This study aimed to develop a laboratory-scale DAC unit for evaluating and comparing amine-based adsorbents under TSA conditions. The unit was designed to provide information about the optimum operating conditions for different adsorbents and assess their effectiveness and efficiency in capturing CO2 from air.
The experimental campaign conducted with the lab unit allowed for the determination of equilibrium loadings, CO2 uptake capacities, and other performance parameters of the adsorbents. The Toth isotherm model was used to characterize the pure component CO2 adsorption isotherms, while the Guggenheim–Anderson–de Boer model was applied to study water co-adsorption onto the adsorbents. Co-adsorption isotherms were also examined, considering the enhanced CO2 uptake in the presence of water. Three approaches, namely, the EF model, SB model, and Young model, were compared to describe the co-adsorption phenomenon. The results and discussions provided insights into the adsorption performance of the amine-based adsorbents under various test conditions, including temperature, CO2 concentration, and relative humidity. The experiments demonstrated the effect of these parameters on adsorption behaviour and maximum CO2 uptake. In addition, the experimental data validated the SB and Young model to be used in simulation studies. Comparing the results of the lab unit with TGA analysis shows several advantages. The lab unit allows greater flexibility in adjusting performance parameters such as pressure, temperature, and gas composition which allows for more accurate modelling of real-life adsorption conditions. The biggest advantage of this lab setup is that it can accommodate co-adsorption isotherms.
The behaviour of adsorption capacity concerning relative humidity largely depends on the specific properties of the adsorbent material and the gases involved in the process. Overall, relative humidity can impact DAC processes’ performance, energy requirements, and water management aspects. Therefore, it is an important factor to be taken into account when designing and optimizing DAC systems.
Overall, this study contributes to developing more efficient and cost-effective amine-based adsorbents for DAC applications. Providing a comprehensive evaluation and comparison of adsorbents under TSA-DAC conditions paves the way for scaling up the DAC industry globally. Further research can build upon this work by exploring additional adsorbent materials, optimizing operating conditions, and investigating the scalability of the developed lab unit. The continued advancement of DAC technology and the identification of effective adsorbents are crucial steps in mitigating climate change and reducing CO2 levels in the atmosphere.

Author Contributions

Conceptualization, F.M.C. and A.A.B.; Methodology, F.M.C.; Validation, G.S.; Resources, S.M.; Data curation, F.M.C. and A.W.; Writing—original draft, F.M.C. and A.A.B.; Writing—review & editing, J.F.; Supervision, S.M. and J.F.; Project administration, J.F. All authors have read and agreed to the published version of the manuscript.

Funding

Open Access Funding by TU Wien. This study was conducted as part of the DAC project supported and funded by the Dharma Karma Foundation.

Data Availability Statement

Data available on request due to restrictions.

Acknowledgments

The authors acknowledge TU Wien Bibliothek for financial support through its Open Access Funding Programme.

Conflicts of Interest

Author Gerhard Schöny was employed by the company DACworx. Author Aditya Anil Bhandari was employed by the company Youweb Incubator. The remaining authors declare that the research was conducted in the absence of any commercial or financial relationships that could be construed as a potential conflict of interest.

Abbreviations

BECCSBioenergy with carbon capture and storage
BETBrunauer–Emmet–Teller
CO2Carbon dioxide
CDRCarbon dioxide removal
DACDirect air capture
EFEnhancement factor
GABGuggenheim–Anderson–de Boer
H2OWater
MFCMass flow controller
MSAMoisture swing adsorption
NDCsNationally Determined Contributions
N2Nitrogen
ppmParts per million
PIDProportional–integral–derivative controller
PVSAPressure vacuum swing adsorption
Rel.HRelative humidity
SBStampi-Bombelli
TSATemperature swing adsorption
TVSATemperature vacuum swing adsorption
TGAThermogravimetric analysis
WADSTWeighted average dual-site Toth model

List of Symbols

XEquilibrium loading(-)
min/moutMass in/out(kg)
madsMass adsorbed(kg)
madsorbentMass of adsorbent(kg)
cConcentration(mol m−3)
V ˙ Volumetric flow(m3 h−1)
pPressure(Pa)
RIdeal gas constant(J mol−1 K−1)
TTemperature(K)
T0Reference temperature(K)
MMolar mass(kg mol−1)
tTime(s)
t0Time at reference point(s)
q C O 2 Loading of CO2 on the adsorbent(mol kg−1)
nsMax. adsorption capacity(mol kg−1)
ns0Max. adsorption capacity at reference temperature(mol kg−1)
bAdsorption affinity(Pa−1)
b0Adsorption affinity at reference temperature(Pa−1)
p C O 2 Partial pressure of CO2(Pa)
τexponential factor describing the heterogeneity of the adsorbent(-)
αFactor describing temperature dependency(-)
χFactor describing temperature dependency(-)
H0Isosteric heat of adsorption at zero fractional loading(J mol−1)
q H 2 O Loading of water on the adsorbent(mol kg−1)
nmMonolayer adsorption capacity(mol kg−1)
cgAffinity parameter(-)
c0Affinity parameter at reference temperature(-)
KadsAffinity parameter(-)
K0Affinity parameter at reference temperature(-)
φRelative humidity(-)
ΔHCHkAdsorption enthalpies of mono and multilayer adsorption(J mol−1)
βEFEnhancement factor(-)
kConstant describing enhancement factor(-)
βModified Toth parameter(-)
yModified Toth parameter(-)
ACritical water loading parameter(-)
E1, E2–9, E10+Heat of adsorption for the 1st, 2nd to 9th and 10th layer and beyond(J mol−1)
C, FConstants in WADST model(J mol−1)
DConstant in WADST model(K−1)
GConstant in WADST model(J mol−1 K−1)

References

  1. Hoegh-Guldberg, O.; Jacob, D.; Taylor, M.; Bolaños, T.G.; Bindi, M.; Brown, S.; Camilloni, I.A.; Diedhiou, A.; Djalante, R.; Ebi, K.; et al. The human imperative of stabilizing global climate change at 1.5 °C. Science 2019, 365, aaw6974. [Google Scholar] [CrossRef] [PubMed]
  2. Pauw, W.P.; Klein, R.J.T.; Mbeva, K.; Dzebo, A.; Cassanmagnago, D.; Rudloff, A. Beyond headline mitigation numbers: We need more transparent and comparable NDCs to achieve the Paris Agreement on climate change. Clim. Change 2017, 147, 23–29. [Google Scholar] [CrossRef]
  3. Emissions Gap Report 2022: The Closing Window Climate Crisis Calls for Rapid Transformation of Societies. Nairobi. 2022. Available online: https://www.unep.org/emissions-gap-report-2022 (accessed on 5 June 2023).
  4. Keller, D.P.; Lenton, A.; Littleton, E.W.; Oschlies, A.; Scott, V.; Vaughan, N.E. The Effects of Carbon Dioxide Removal on the Carbon Cycle. Curr. Clim. Change Rep. 2018, 4, 250–265. [Google Scholar] [CrossRef] [PubMed]
  5. National Academies of Sciences, Engineering, and Medicine. Negative Emissions Technologies and Reliable Sequestration: A Research Agenda; The National Academic Press: Washington, DC, USA, 2019. [Google Scholar] [CrossRef]
  6. Ozkan, M.; Nayak, S.P.; Ruiz, A.D.; Jiang, W. Current status and pillars of direct air capture technologies. iScience 2022, 25, 103990. [Google Scholar] [CrossRef] [PubMed]
  7. Breyer, C.; Fasihi, M.; Bajamundi, C.; Creutzig, F. Direct Air Capture of CO2: A Key Technology for Ambitious Climate Change Mitigation. Joule 2019, 3, 2053–2057. [Google Scholar] [CrossRef]
  8. Ozkan, M. Direct air capture of CO2: A response to meet the global climate targets. MRS Energy Sustain. 2021, 8, 51–56. [Google Scholar] [CrossRef] [PubMed]
  9. Elfving, J.; Bajamundi, C.; Kauppinen, J.; Sainio, T. Modelling of equilibrium working capacity of PSA, TSA and TVSA processes for CO2 adsorption under direct air capture conditions. J. CO2 Util. 2017, 22, 270–277. [Google Scholar] [CrossRef]
  10. Erans, M.; Sanz-Pérez, E.S.; Hanak, D.P.; Clulow, Z.; Reiner, D.M.; Mutch, G.A. Direct air capture: Process technology, techno-economic and socio-political challenges. Energy Environ. Sci. 2022, 15, 1360–1405. [Google Scholar] [CrossRef]
  11. Wang, T.; Hou, C.; Ge, K.; Lackner, K.S.; Shi, X.; Liu, J.; Fang, M.; Luo, Z. Spontaneous Cooling Absorption of CO2 by a Polymeric Ionic Liquid for Direct Air Capture. J. Phys. Chem. Lett. 2017, 8, 52. [Google Scholar] [CrossRef]
  12. McQueen, N.; Gomes, K.V.; McCormick, C.; Blumanthal, K.; Pisciotta, M.; Wilcox, J. A review of direct air capture (DAC): Scaling up commercial technologies and innovating for the future. Prog. Energy 2021, 3, 032001. [Google Scholar] [CrossRef]
  13. Gelles, T.; Lawson, S.; Rownaghi, A.A.; Rezaei, F. Recent advances in development of amine functionalized adsorbents for CO2 capture. Adsorption 2020, 1, 5–50. [Google Scholar] [CrossRef]
  14. Farmahini, A.H.; Krishnamurthy, S.; Friedrich, D.; Brandani, S.; Sarkisov, L. Performance-Based Screening of Porous Materials for Carbon Capture. Chem. Rev. 2021, 121, 10666–10741. [Google Scholar] [CrossRef] [PubMed]
  15. Drechsler, C.; Agar, D.W. Investigation of water co-adsorption on the energy balance of solid sorbent based direct air capture processes. Energy 2020, 192, 116587. [Google Scholar] [CrossRef]
  16. Veneman, R.; Frigka, N.; Zhao, W.; Li, Z.; Kersten, S.; Brilman, W. Adsorption of H2O and CO2 on supported amine sorbents. Int. J. Greenh. Gas. Control 2015, 41, 268–275. [Google Scholar] [CrossRef]
  17. Sonnleitner, E.; Schöny, G.; Hofbauer, H. Assessment of zeolite 13X and Lewatit® VP OC 1065 for application in a continuous temperature swing adsorption process for biogas upgrading. Biomass Convers. Biorefinery 2018, 8, 379–395. [Google Scholar] [CrossRef]
  18. Low, M.-Y.A.; Danaci, D.; Azzan, H.; Woodward, R.T.; Petit, C. Measurement of Physicochemical Properties and CO2, N2, Ar, O2, and H2O Unary Adsorption Isotherms of Purolite A110 and Lewatit VP OC 1065 for Application in Direct Air Capture. J. Chem. Eng. Data 2023, 68, 3511. [Google Scholar] [CrossRef] [PubMed]
  19. Lanxess. Product Information Lewatit® VP OC 1065. Available online: https://lanxess.com/en/Products-and-Brands/Products/l/LEWATIT--VP-OC-1065 (accessed on 16 May 2024).
  20. Veneman, R.; Zhao, W.; Li, Z.; Cai, N.; Brilman, D.W.F. Adsorption of CO2 and H2O on supported amine sorbents. In Energy Procedia; Elsevier Ltd.: Amsterdam, The Netherlands, 2014; pp. 2336–2345. [Google Scholar] [CrossRef]
  21. Serna-Guerrero, R.; Belmabkhout, Y.; Sayari, A. Modeling CO2 adsorption on amine-functionalized mesoporous silica: 1. A semi-empirical equilibrium model. Chem. Eng. J. 2010, 161, 173–181. [Google Scholar] [CrossRef]
  22. Buijs, W.; De Flart, S. Direct Air Capture of CO2 with an Amine Resin: A Molecular Modeling Study of the CO2 Capturing Process. Ind. Eng. Chem. Res. 2017, 56, 12297–12304. [Google Scholar] [CrossRef]
  23. Hefti, M.; Mazzotti, M. Modeling water vapor adsorption/desorption cycles. Adsorption 2014, 20, 359–371. [Google Scholar] [CrossRef]
  24. Marx, D.; Joss, L.; Hefti, M.; Mazzotti, M. Temperature Swing Adsorption for Postcombustion CO2 Capture: Single-and Multicolumn Experiments and Simulations. Ind. Eng. Chem. Res. 2016, 55, 1401–1412. [Google Scholar] [CrossRef]
  25. Marx, D.; Joss, L.; Hefti, M.; Pini, R.; Mazzotti, M. The Role of Water in Adsorption-based CO2 Capture Systems. Energy Procedia 2013, 37, 107–114. [Google Scholar] [CrossRef]
  26. Gebald, C.; Wurzbacher, J.A.; Borgschulte, A.; Zimmermann, T.; Steinfeld, A. Single-Component and Binary CO2 and H2O Adsorption of Amine-Functionalized Cellulose. Environ. Sci. Technol. 2014, 48, 2497–2504. [Google Scholar] [CrossRef] [PubMed]
  27. Young, J.; Ez, E.G.A.-D.; Garcia, S.; Van Der Spek, M. The impact of binary water-CO2 isotherm models on the optimal performance of sorbent-based direct air capture processes. Energy Environ. Sci. 2021, 14, 5377. [Google Scholar] [CrossRef]
  28. Stampi-Bombelli, V.; van der Spek, M.; Mazzotti, M. Analysis of direct capture of CO2 from ambient air via steam-assisted temperature–vacuum swing adsorption. Adsorption 2020, 26, 1183–1197. [Google Scholar] [CrossRef]
  29. Wurzbacher, J.A.; Gebald, C.; Brunner, S.; Steinfeld, A. Heat and mass transfer of temperature–vacuum swing desorption for CO2 capture from air. Chem. Eng. J. 2016, 283, 1329–1338. [Google Scholar] [CrossRef]
  30. Serna-Guerrero, R.; Da’na, E.; Sayari, A. New insights into the interactions of CO2 with amine-functionalized silica. Ind. Eng. Chem. Res. 2008, 47, 9406–9412. [Google Scholar] [CrossRef]
  31. Stuckert, N.R.; Yang, R.T. CO2 Capture from the Atmosphere and Simultaneous Concentration Using Zeolites and Amine-Grafted SBA-15. Environ. Sci. Technol. 2011, 45, 10257–10264. [Google Scholar] [CrossRef] [PubMed]
  32. Yu, J.; Chuang, S.S.C. The Structure of Adsorbed Species on Immobilized Amines in CO2 Capture: An in Situ IR Study Scheme 1. Reaction Mechanism of CO2 with Aqueous Amines Scheme 2. Reaction Mechanism of CO2 with Immobilized Amines. Energy Fuels 2016, 30, 58. [Google Scholar] [CrossRef]
  33. Anderson, R.B.; Hall, W.K. Modifications of the Brunauer, Emmett and Teller equation. J. Am Chem Soc. 1948, 70, 1727–1734. [Google Scholar] [CrossRef] [PubMed]
  34. Franchi, R.S.; Harlick, P.J.E.; Sayari, A. Applications of Pore-Expanded Mesoporous Silica. 2. Development of a High-Capacity, Water-Tolerant Adsorbent for CO2. Ind. Eng. Chem. Res. 2005, 44, 8007–8013. [Google Scholar] [CrossRef]
  35. Hicks, J.C.; Drese, J.H.; Fauth, D.J.; Gray, M.L.; Qi, G.; Jones, C.W. Designing Adsorbents for CO2 Capture from Flue Gas-Hyperbranched Aminosilicas Capable of Capturing CO2 Reversibly. J. Am. Chem. Soc. 2008, 130, 2902–2903. [Google Scholar] [CrossRef] [PubMed]
  36. Su, F.; Lu, C.; Kuo, S.-C.; Zeng, W. Adsorption of CO2 on Amine-Functionalized Y-Type Zeolites. Energy Fuels 2010, 24, 1441–1448. [Google Scholar] [CrossRef]
  37. Fauth, D.J.; Gray, M.L.; Pennline, H.W.; Krutka, H.M.; Sjostrom, S.; Ault, A.M. Investigation of Porous Silica Supported Mixed-Amine Sorbents for Post-Combustion CO2 Capture. Energy Fuels 2012, 26, 2483–2496. [Google Scholar] [CrossRef]
  38. Xu, X.; Zhao, X.; Sun, L.; Liu, X. Adsorption separation of carbon dioxide, methane and nitrogen on monoethanol amine modified β-zeolite. J. Nat. Gas Chem. 2009, 18, 167–172. [Google Scholar] [CrossRef]
  39. Lourenço, M.A.O.; Fontana, M.; Jagdale, P.; Pirri, C.F.; Bocchini, S. Improved CO2 adsorption properties through amine functionalization of multi-walled carbon nanotubes. Chem. Eng. J. 2021, 414, 128763. [Google Scholar] [CrossRef]
  40. Elfving, J.; Sainio, T. Kinetic approach to modelling CO2 adsorption from humid air using amine-functionalized resin: Equilibrium isotherms and column dynamics. Chem. Eng. Sci. 2021, 246, 116885. [Google Scholar] [CrossRef]
Figure 1. Experimental DAC plant set up in the Technikum at TU Wien. The system is shown in the desorption mode. In the lower part of the picture, the vacuum pump is operating at 398 mbar.
Separations 11 00160 g001
Figure 2. (a) Adsorption setup of the laboratory unit. (b) Desorption setup of the laboratory unit.
Separations 11 00160 g002aSeparations 11 00160 g002b
Figure 3. Experimental adsorption CO2 breakthrough curves at a constant relative humidity of 35%, constant volume flow of 6 Nm3/h, at 15 °C (black line), 20 °C (blue line), 25 °C (orange line), and 30 °C (red line) and at (a) 400 ppm, (b) 700 ppm, (c) 1000 ppm, (d) 1300 ppm of CO2 respectively. The dotted lines describe the air stream measured before entering the adsorbent bed.
Separations 11 00160 g003
Figure 4. Experimental adsorption CO2 breakthrough curves at a constant temperature of 20 °C, steady volume flow of 6 Nm3/h, constant partial pressure of CO2 at 1000 ppm, and 20% (blue line), 35% (green line), and 65% (red line) relative humidity. The dotted line represents the air stream measured before entering the adsorbent bed.
Separations 11 00160 g004
Figure 5. H2O adsorption isotherms at 20 °C for Lewatit obtained from lab unit measurements and fitted with GAB model and compared to data from Veneman et al. [16] and Low et al. [18].
Separations 11 00160 g005
Figure 6. CO2 adsorption isotherms on Lewatit obtained from lab unit measurements at 20 °C and fitted with Toth model. In comparison, TGA measurements from Sonnleitner et al. [17] and from Veneman et al. [16] fitted with the Toth model are displayed as well.
Separations 11 00160 g006
Figure 7. Experimental co-adsorption CO2 uptake (markers) at temperatures ranging from 15 °C to 30 °C and a relative humidity of 35–38%, respectively. The CO2 co-adsorption isotherms are fitted with experimental data from this work and expanded with the co-adsorption models from Young et al. [27], Stampi-Bombelli et al. [28], and the EF model.
Separations 11 00160 g007
Table 1. Material properties of the tested adsorbent.
Lewatit
CompositionCross-linked polystyrene functionalized with primary amines
Average particle diameter0.52 mm
Average pore diameter25 nm
Bulk density630–710 kg m−3
Table 2. Sensors used for gas analysis.
SensorMeasurement RangeMeasurement ErrorManufacturerDesignation
Pt100 temp. sensor−30 to +180 °CN/APohltechnikC-H100 × 3 sil 2 m 3 L
Humidity sensor0–100% rel. H±0.8% rel. HVaisalaHMP7
CO2 sensor0–10,000 ppm±2% VaisalaGMP252
Pressure Transmitter0–10 mbarN/AKalinskyTYPE DS 2-010
Table 3. Operating conditions during testing.
Process StepPressure (abs.)TemperatureDuration
Adsorption1.017 bar 15–30 °C180–600 min
Evacuation<0.05 barIsothermal, Tads1 min
Desorption0.2–0.6 bar70–90 °C90 min
Cooling0.1 bar<55 °C10 min
Table 4. Adsorption matrix. Process conditions in the supplied airflow.
Temperature [°C]CO2 Concentration [ppm]Relative Humidity [%]
15400/700/1000/130035
20400/700/1000/130035
25400/700/1000/130035
30400/700/1000/130035
Table 5. Toth isotherm parameters.
Toth ParametersThis WorkSonnleitner et al. [17]Veneman et al. [16]Unit
ns01.813.133.4mol kg−1
χ000-
T0343343353K
b0169.62282408.84bar−1
ΔH064.0210686.7kJ mol−1
t00.960.340.3-
α0.340.420.14-
R20.99---
GAB parametersValueUnit
cG 3.68-
Kads0.73-
nm4.99mol kg−1
R20.99-
Table 6. Co-adsorption parameters.
EF Model ParametersValueUnit
k0.42-
SB model parameters
γ 0.027-
β 0.061-
Young model parameters
A14.72mol kg−1
bwet0.37bar−1
ns,wet12.64mol kg−1
τwet8.56-
χwet0-
αwet6.62 × 10−6-
Hwet203,687J mol−1
Table 7. Fit of the models for different temperatures and their overall fit.
ModelEF ModelSB ModelYoung Model
[°C]R2R2R2
150.9870.9780.975
200.9770.9830.982
250.9090.9280.930
300.9300.9730.981
Overall fit0.9510.9650.967
Disclaimer/Publisher’s Note: The statements, opinions and data contained in all publications are solely those of the individual author(s) and contributor(s) and not of MDPI and/or the editor(s). MDPI and/or the editor(s) disclaim responsibility for any injury to people or property resulting from any ideas, methods, instructions or products referred to in the content.

