Article

Exploration of the Functional Constituents of the Substrate of Flammulina velutipes

1
College of Life Sciences, Fujian Normal University, Fuzhou 350108, China
2
Zhangzhou Institute of Agricultural Science, Zhangzhou 363005, China
3
Fujian Wanchen Biotechnology Group Co., Ltd., Zhangzhou 363200, China
*
Author to whom correspondence should be addressed.
Separations 2024, 11(11), 311; https://doi.org/10.3390/separations11110311
Submission received: 25 September 2024 / Revised: 22 October 2024 / Accepted: 26 October 2024 / Published: 28 October 2024

Abstract

:
After harvesting, the substrate of Flammulina velutipes (SFV) is repurposed for uses such as feed, fuel, and culture medium. This study identified four phenolic acids and one flavonoid from the SFV for the first time using solvent extraction and chromatography: ferulic acid (1), ρ-coumaric acid (2), vanillic acid (3), 3-methoxygallic acid (4), and tricin (5). They showed significant activity in the DPPH scavenging test with concentrations determined by HPLC as follows: ferulic acid (218.88 mg/kg), ρ-coumaric acid (157.31 mg/kg), vanillic acid (281.54 mg/kg), 3-methoxygallic acid (33.85 mg/kg), and tricin (713.42 mg/kg). These findings indicate that the SFV is a valuable source of bioactive compounds for medicinal and health-promoting applications.

1. Introduction

In recent years, Flammulina velutipes has mainly been cultivated using bag cultivation methods with a cultivation medium comprising sawdust, bagasse, and wheat bran. As its cultivation grows, so does the amount of spent substrate from the bags, with research showing that about 5 kg of spent substrate is produced for every 1 kg of edible fungi [1,2]. The accumulation or incineration of these residues can lead to soil and groundwater pollution, as well as the release of air pollutants such as carbon monoxide (CO), nitrogen oxides, and carbon dioxide (CO2) [3]. Therefore, recycling the waste from growing edible fungi is very important. Multiple treatment methods are available for the SFV. Common techniques include composting treatment [4], production of biomass energy such as generating biogas through anaerobic fermentation [5], wastewater treatment [6], and reuse as a culture medium for other edible fungi [7]. Additionally, the SFV is used for the extraction of active ingredients. Lin et al. [8] isolated three polysaccharides from the SFV, namely Ac-RPS, Al-RPS, and En-RPS. Among these, En-RPS has antioxidant activity and a renal protective effect. Another polysaccharide extracted from SFV, (UE-FVRP), contained eight monosaccharides and showed strong antioxidant activity and potential as a new prebiotic polysaccharide [9]. Research indicates that peroxidase isolated from the SFV significantly degrades the mycotoxin deoxynivalenol [10]. Notably, the fungal residue also contains other components such as ergosterol which can be used as a dietary supplement and food additive [11], melanin with antioxidant activity [12], and xylooligosaccharides [13]. While traditional treatment methods can achieve some resource utilization, their economic added value is relatively low. Separating active substances from the SFV converts discarded resources into valuable ones, thereby enhancing resource utilization and reducing the excessive exploitation of natural resources. This research aims to fill this gap by systematically exploring the active ingredients in the SFV, providing a theoretical basis and practical foundation for its application in medicine, health products, and biochemical engineering.

2. Materials and Methods

2.1. Materials and Reagents

The SFV was provided by Fujian Wanchen Biotechnology Group Co., Ltd. (Zhangzhou, China). Methanol and ethyl acetate were supplied by AnnJi Pharmaceutical Chemistry Co., Ltd. (Shanghai, China). Chromatographic grade methanol was provided by Zhongpu Technology Co., Ltd. (Shanghai, China). The 1,1-Diphenyl-2-picrylhydrazyl (DPPH) was purchased from Shanghai Aladdin Biochemical Technology Co., Ltd. (Shanghai, China). Ascorbic acid (Vc) was purchased from Shanghai Sine Tianping Pharmaceutical Co., Ltd. (Shanghai, China).

2.2. Extraction Procedures

2.2.1. Preparation of Extracts

The dried SFV (850 g) was mixed with methanol at a 1:2 ratio (SFV–solvent) in an Erlenmeyer flask and treated with ultrasonic power at a specific temperature using a KQ-400DE from Kunshan Ultrasonic Instrument Co., Ltd. (Kunshan, China). The methanol phase was separated through filtration and then concentrated under reduced pressure using an R-300 rotary evaporator from Buchi Labortechnik AG (Flawil, Switzerland). This process was repeated three times. The methanol-free extract was then partitioned with equal volumes of ethyl acetate and water three times. The organic phase was dehydrated with anhydrous sodium sulfate, filtered, and concentrated. As a result, 27.4 g of crude organic extract was obtained from the SFV, with an extraction rate of 3.22%.

2.2.2. Isolation and Purification of Compounds 15

The crude extract (27.4 g) was separated into three fractions as follows: Fr. E (506.8 mg), Fr. H (386.6 mg), and Fr. M (1000 mg) using medium-pressure liquid chromatography (MPLC) (QuikSepP0050D-II, H&E Co., Ltd., Beijing, China) over RP-C18 silica gel (Fuji Silysia Chemical Ltd., Osaka, Japan). The separation was carried out using a stepwise gradient of CH3OH in H2O (0:100, 5:100, 30:100, 50:50, 70:100, and 100:0 v/v) based on thin-layer chromatography (TLC) (Qingdao Bangkai High Tech Materials Co., Ltd., Qingdao, China) analyses. Fr. E was further purified through chromatography over Sephadex LH-20 (Amersham Biosciences, Piscataway, NJ, USA) and eluted with methanol, resulting in the isolation of subfraction Fr. E7 (57.6 mg). Fr. E7 was then subjected to silica gel chromatography using a CH2Cl2-CH3OH solvent gradient, yielding compound 3 (17 mg) and fraction Fr. E71 (7 mg). Fr. E71 was separated by high-performance liquid chromatography (HPLC) (Ultimate 3000, Thermo Scientific, Waltham, MA, USA) with CH3OH:H2O (15:85) as the mobile phase and an absorption wavelength of 220 nm, resulting in the isolation of compound 4 (3.2 mg) at a retention time of 9 min. Fr. H was separated through column chromatography over Sephadex LH-20 (120 g) with a methanol eluant, producing Fr. H6 (76 mg). Fr. H6 was further separated by silica gel chromatography, eluted with CH2Cl2-CH3OH, and yielded compound 1 (13.5 mg) and compound 2 (2.3 mg). Fr. M was chromatographed over Sephadex LH-20 (120 g) and eluted with methanol, resulting in the isolation of Fr. M12 (12 mg). Fr. M12 was isolated through HPLC with CH3OH in H2O (55:45) serving as the mobile phase and an absorption wavelength of 254 nm, resulting in the acquisition of compound 5 (5.0 mg) at a retention time of 10 min.

2.3. NMR Analysis

1H NMR and 13C NMR spectral data were obtained using a nuclear magnetic resonance spectrometer (JNM-ECZL 600 MHz, JEOL Ltd., Tokyo, Japan). Compounds 13 were recorded in methanol-d4 operating at 600/151 MHz. Compounds 45 were recorded in DMSO-d6 operating at 600/151 MHz.

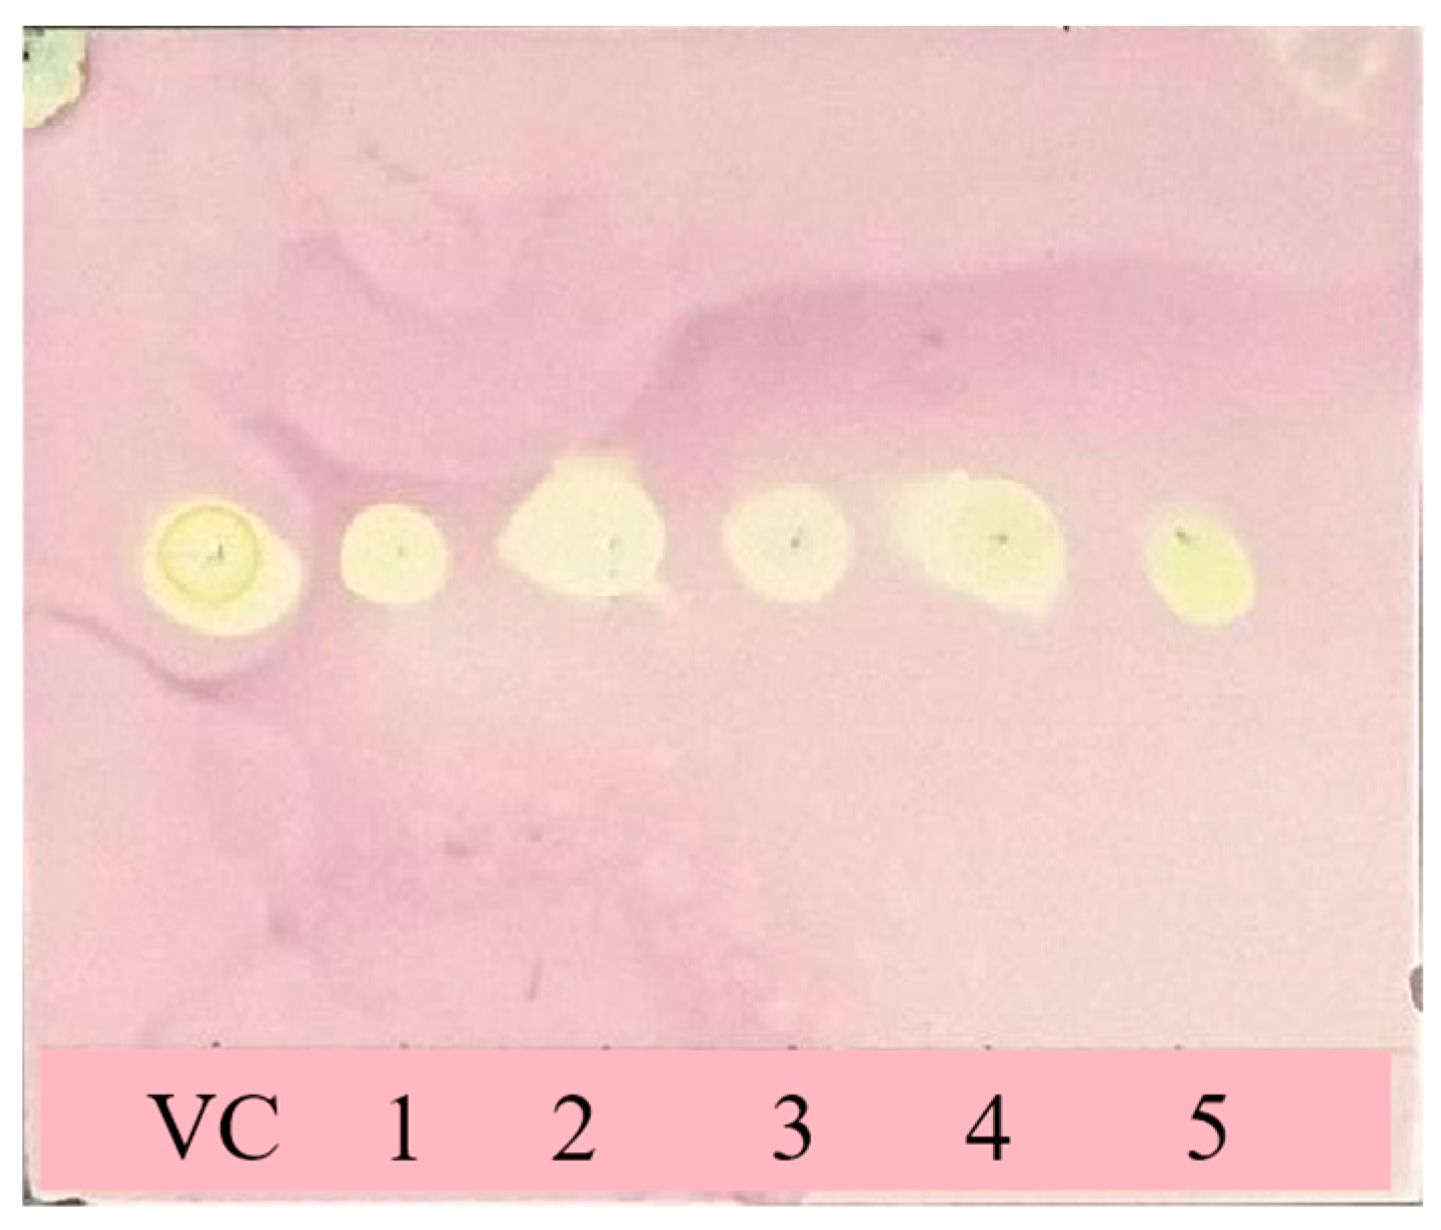
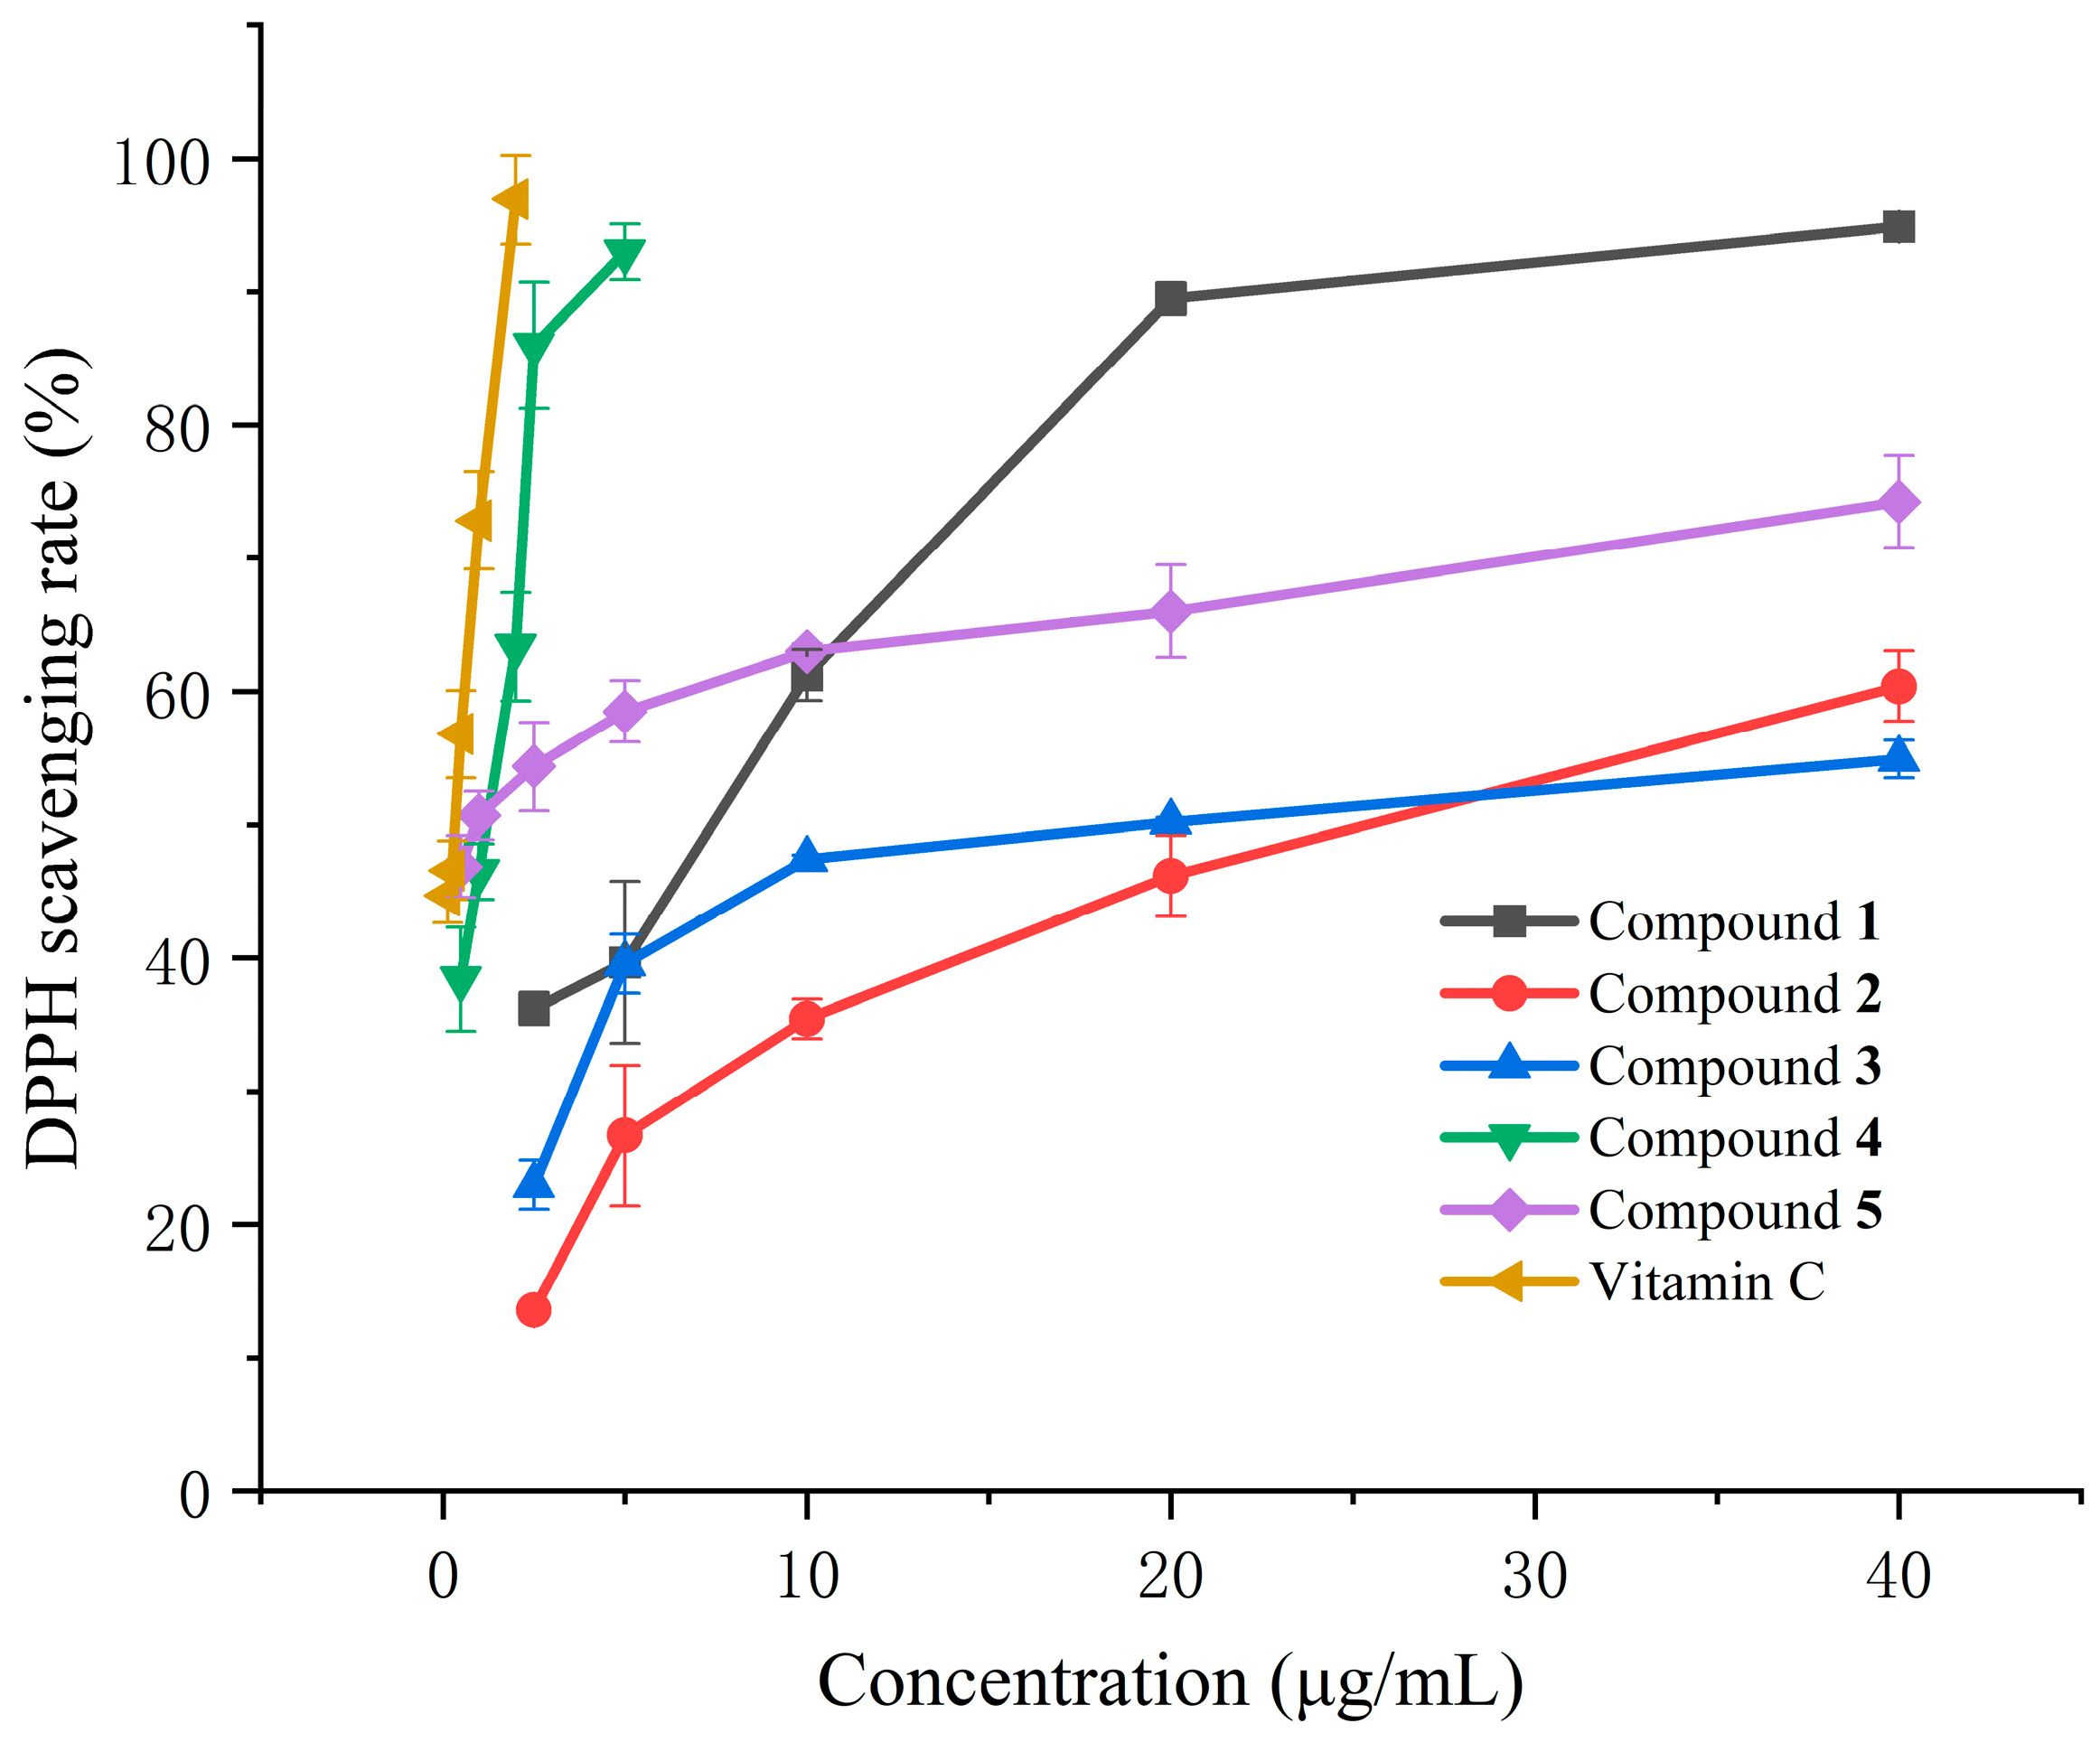
2.4. DPPH Radical Scavenging Capacity

A preliminary evaluation of the antioxidant activities of the compounds was carried out using thin-layer chromatography–bioautography, with vitamin C as the positive control, based on previous research with some modifications [14]. Solutions (1 mg/mL) of these compounds were prepared using methanol. Afterward, 10 μL of these compounds were spotted on a dried silica gel plate. The plate was placed in an ethanol solution containing 0.04% DPPH and incubated at 60 °C for 20 min after the solvent evaporated. Compounds with antioxidant properties will appear white against a purple background.
Subsequently, we used the Brand-Williams method [15] to quantitatively analyze the ability of each compound to scavenge DPPH free radicals. First, we dissolved each compound in methanol to create a stock solution of 100 μg/mL. Then, we diluted each to form five different concentrations in a 96-well plate, with each well containing a volume of 180 μL. The final concentrations of the compounds in each well were 2.5, 5, 10, 20, and 40 μg/mL, respectively. After that, we added 20 μL of DPPH methanol-dissolved solution (concentration: 35.7 μg/mL) to each well. We used ascorbic acid as a positive control group at final concentrations of 0.125, 0.25, 0.5, 1.0, and 2.0 μg/mL. The reaction mixtures were then incubated for 30 min in a dark room at room temperature. We measured the absorbance at 519 nm using a microplate reader (Varioskan LUX, Thermo Scientific, Waltham, USA). Each treatment was repeated three times. Finally, we calculated the DPPH scavenging rate (%) using the following formula:
DPPH scavenging rate (%) = (A0 − A1)/A1 × 100
where A1 represents the absorbance of samples and standards, and A0 represents the absorbance of the solvent.
We also determined the mass of DPPH scavenged by unit mass of the compound using the following equation:
Mass of DPPH scavenged by unit mass of compound = (0.5 × C × V1)/(IC50 × V2)
Here, C is the concentration of DPPH, V1 is the volume of DPPH, IC50 is the concentration of the compound that scavenges half of DPPH, and V2 is the volume of the compound and DPPH.

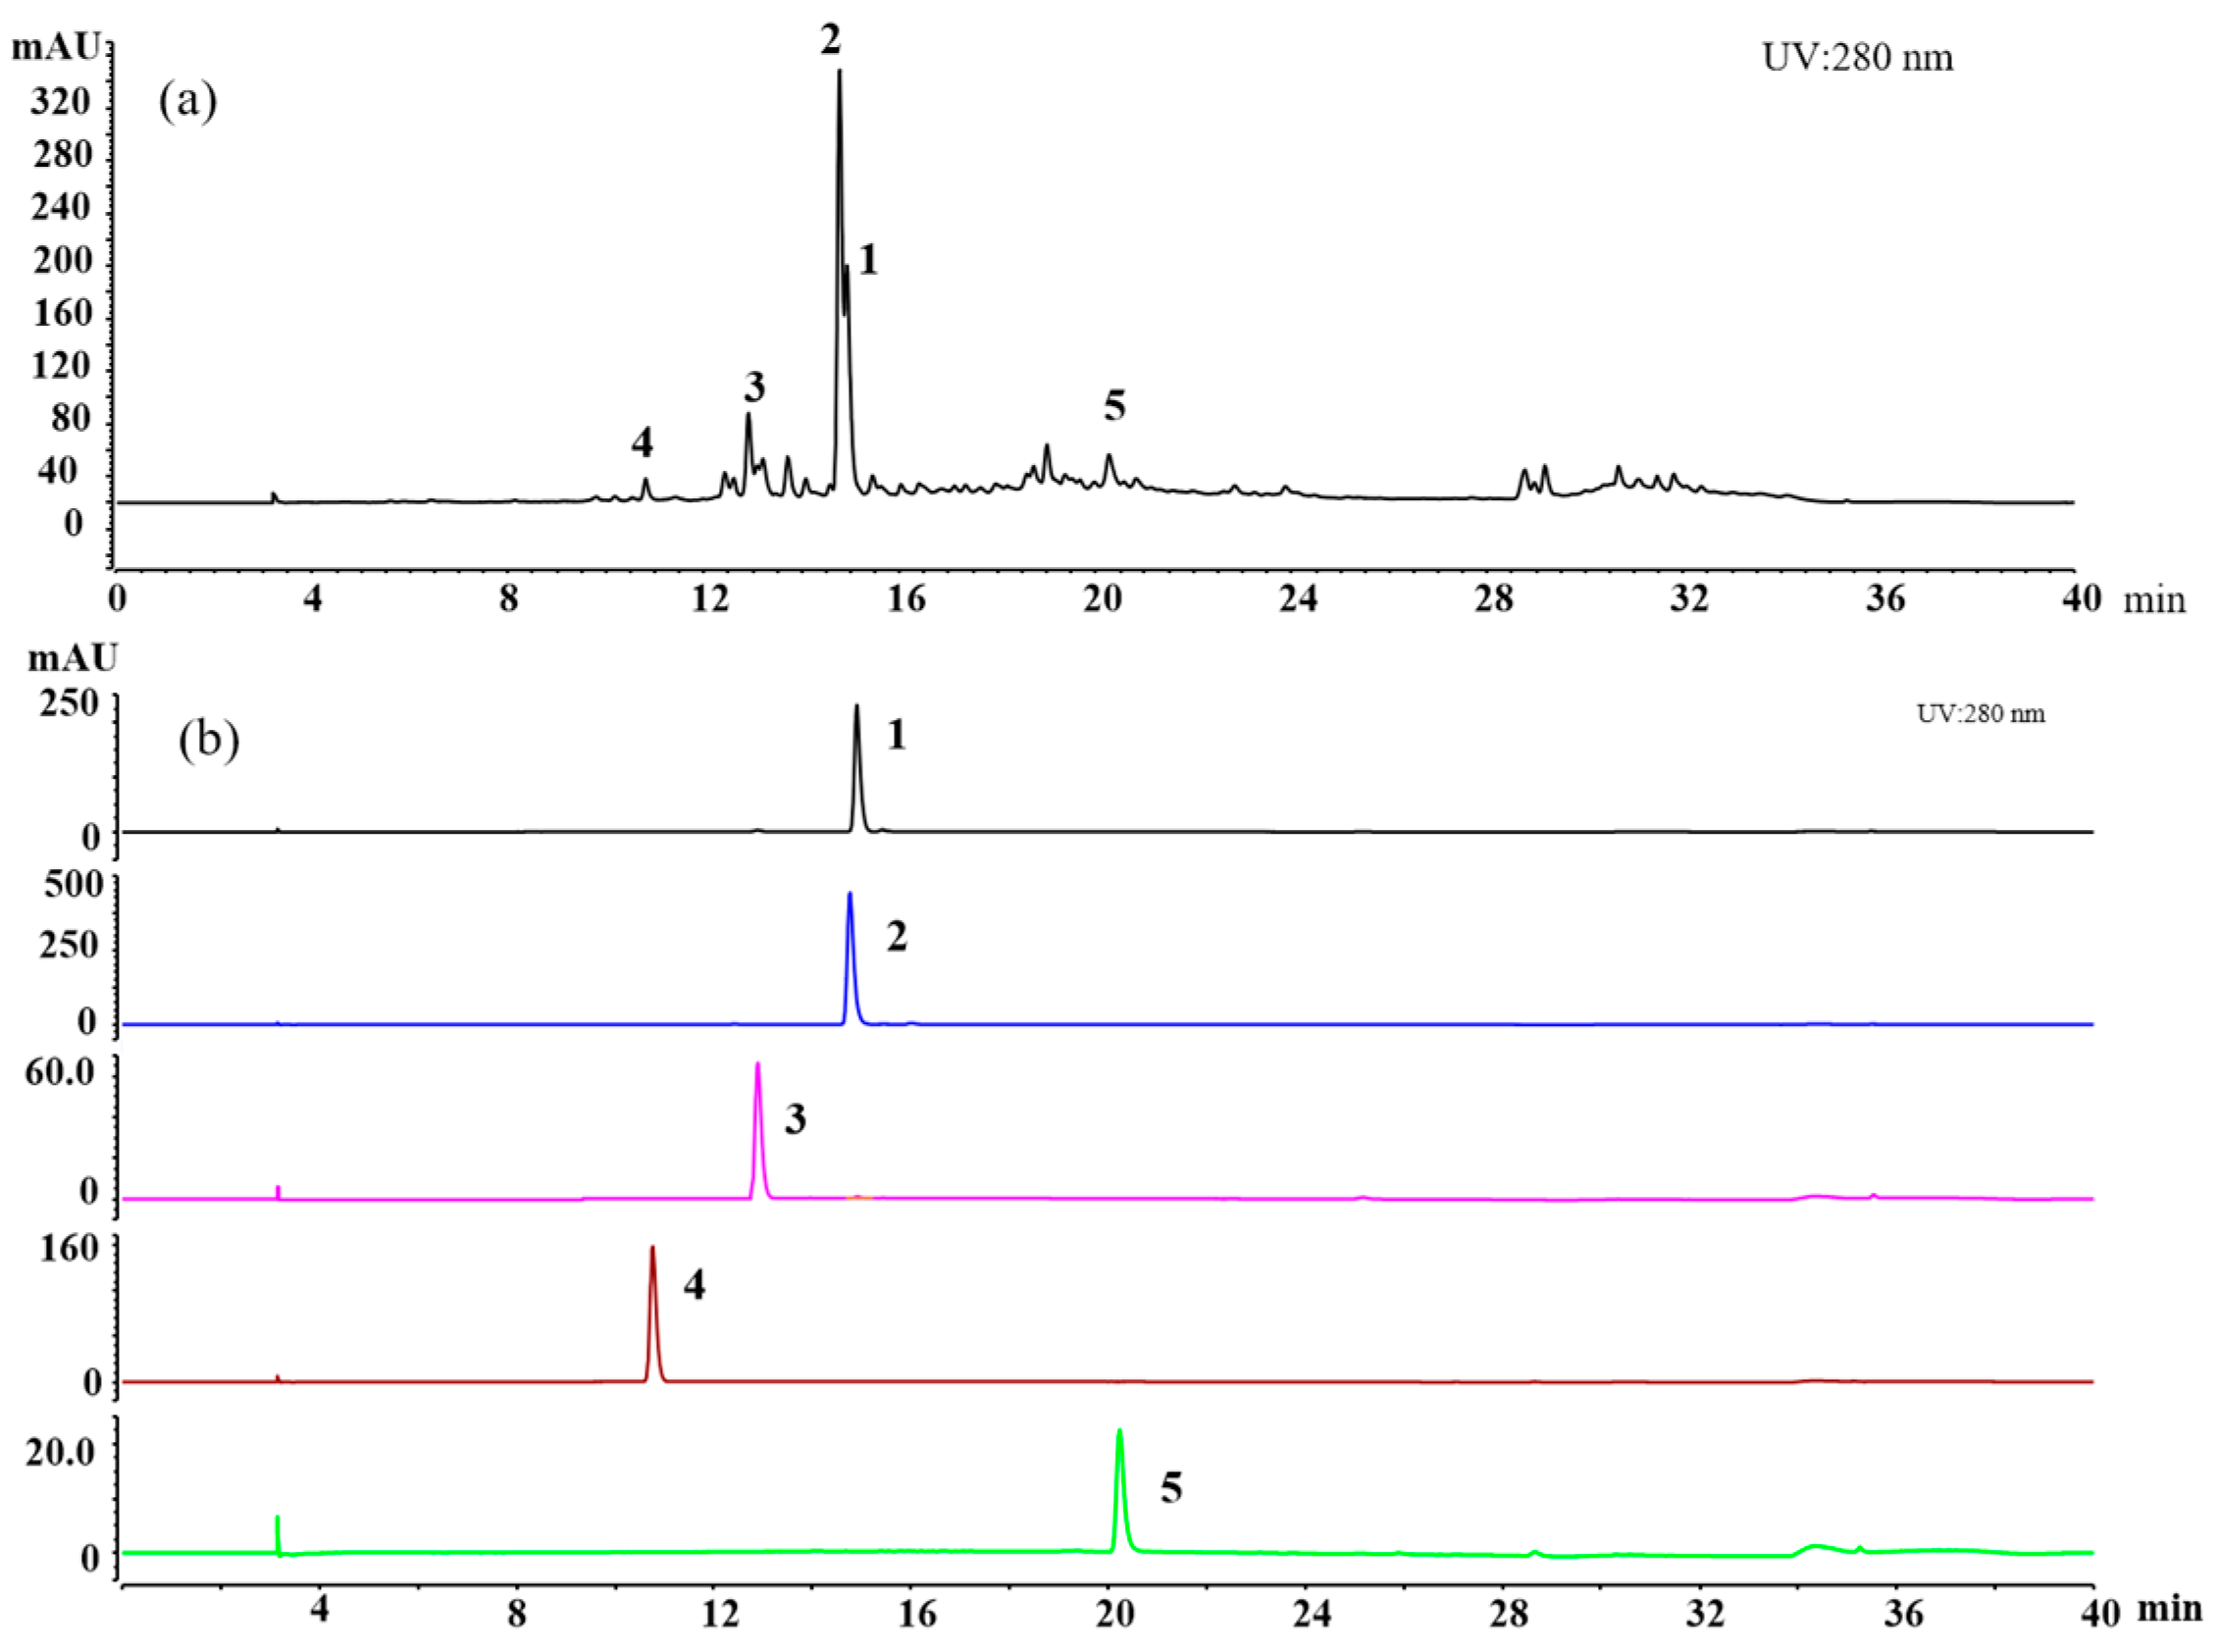
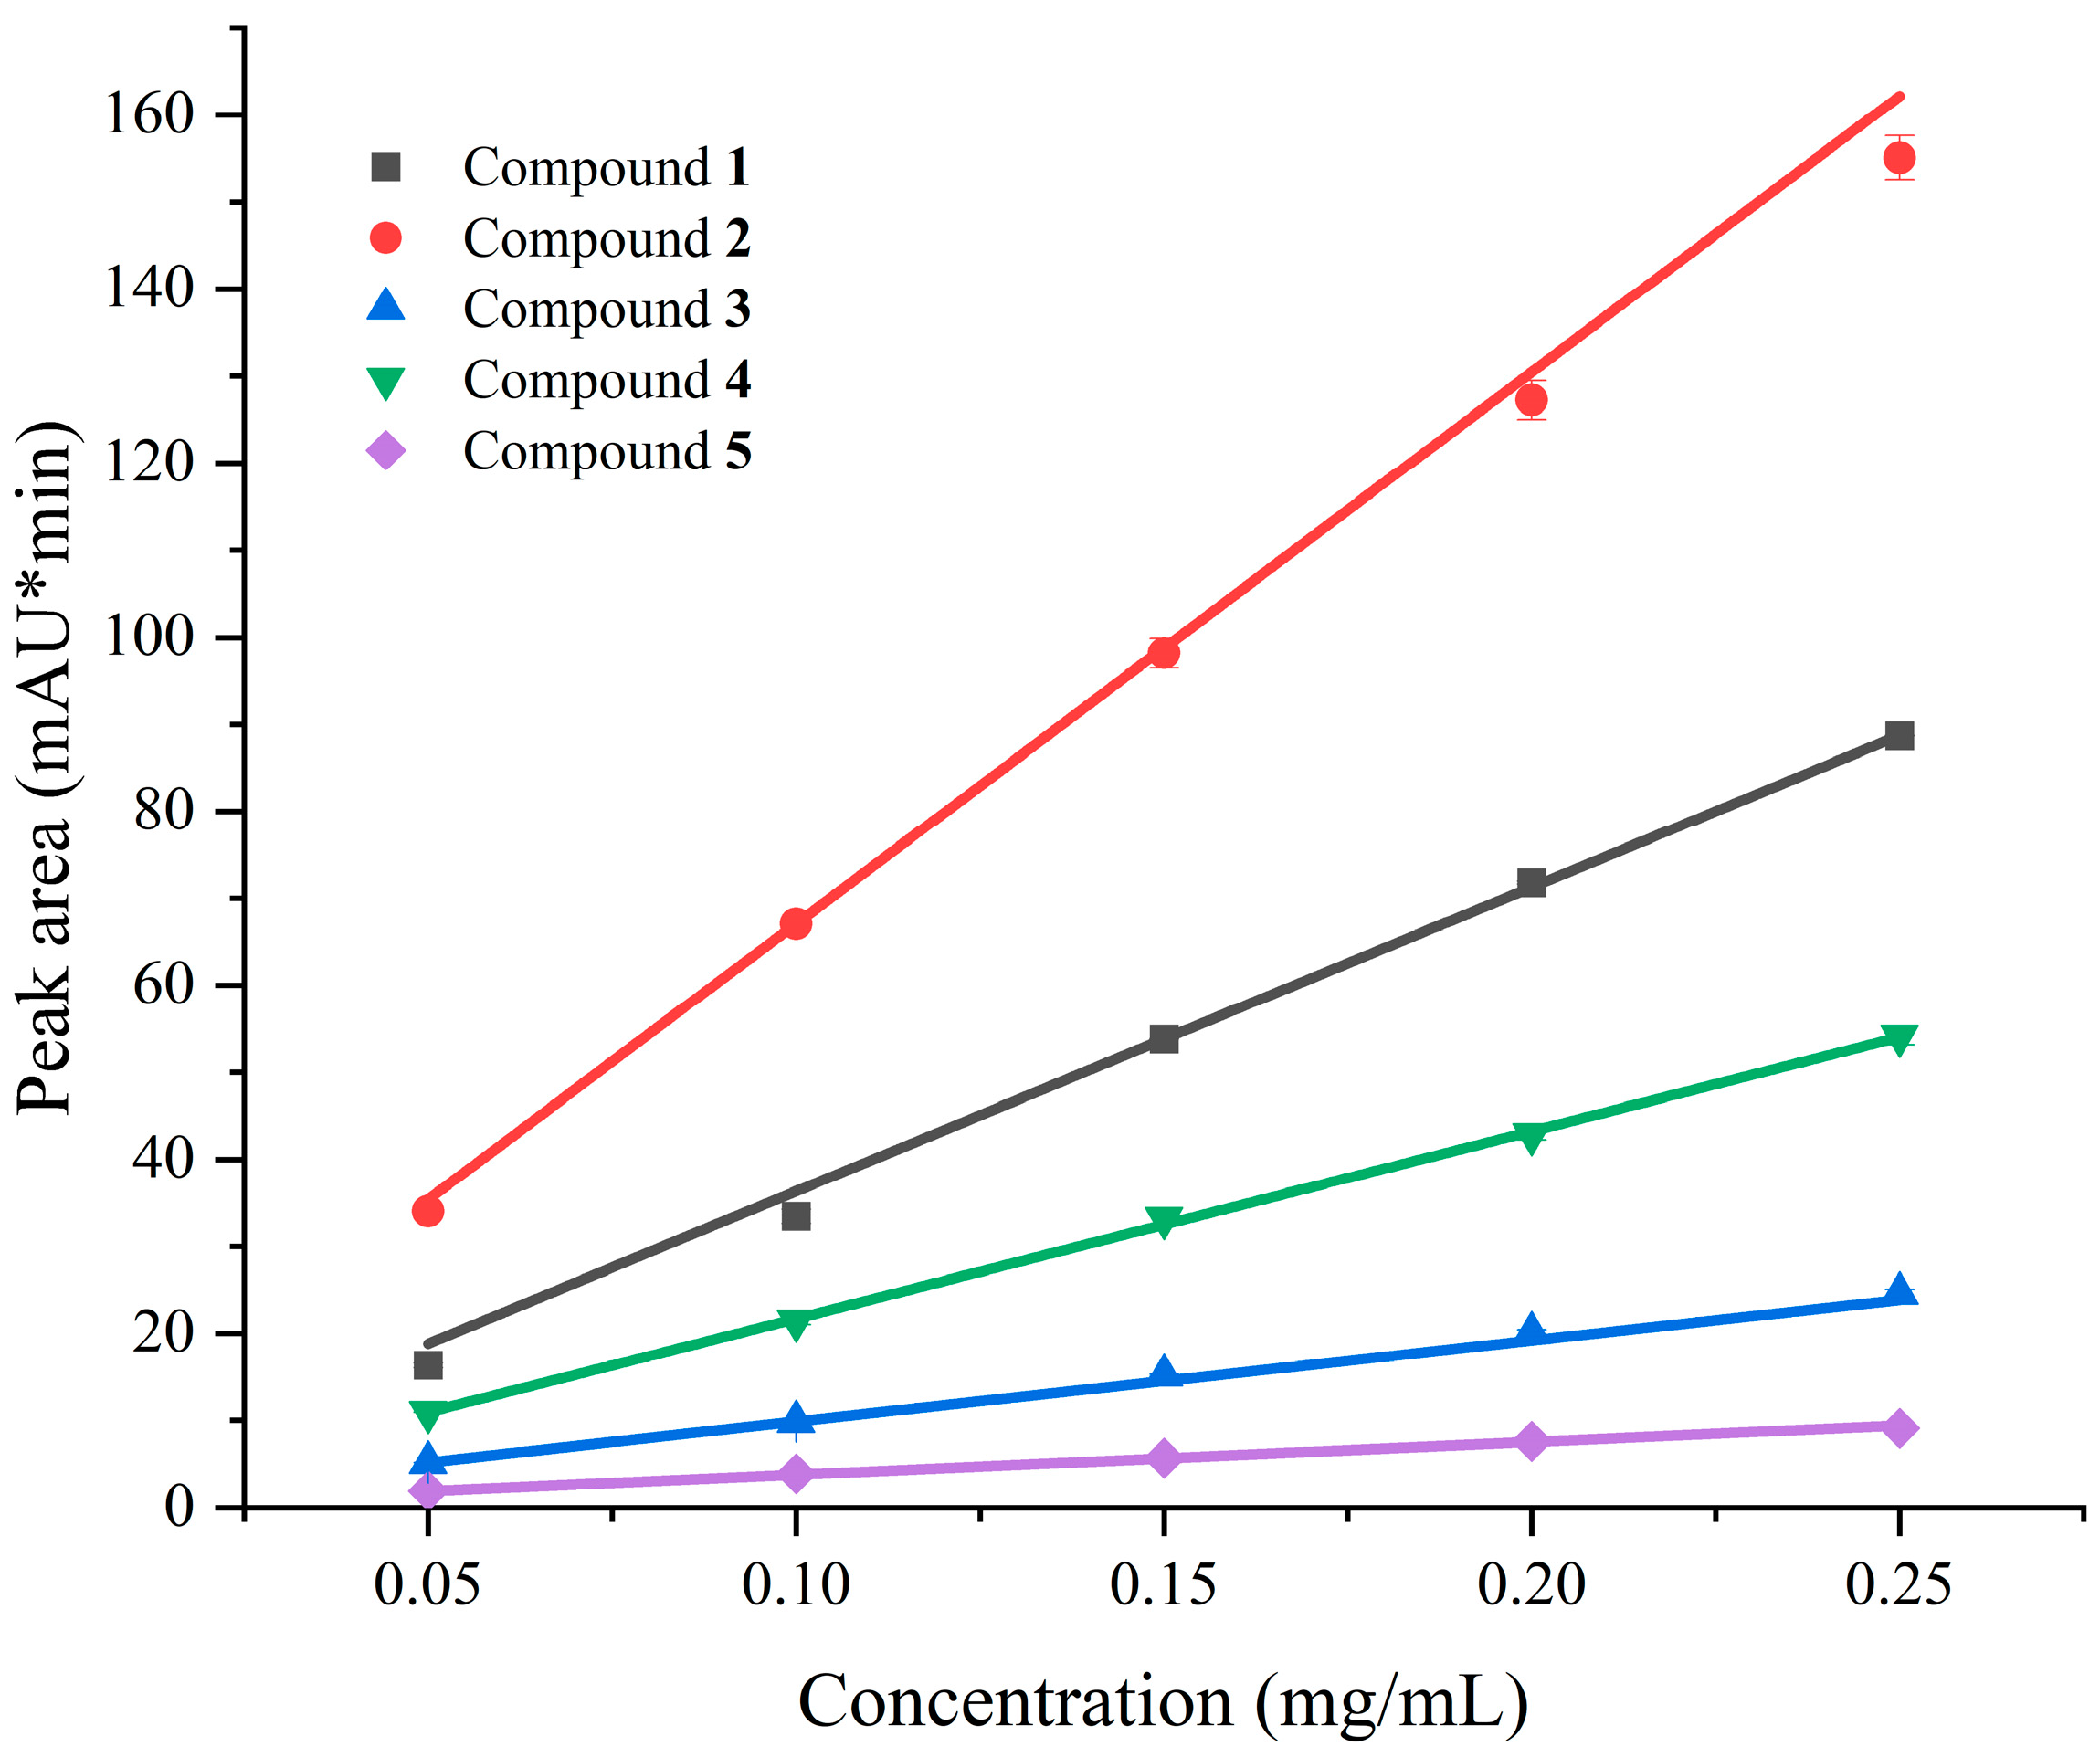
2.5. Quantitative Analysis of Chemical Constituents

The HPLC technique used the external standardization approach to quantify the target components. It was conducted using a Thermo Scientific HPLC system and the C18 column (AcclaimTM 120, 5 μm, 4.6 × 250 mm). The mobile phase consisted of a mixture of solvent A (methanol) and solvent B (water containing 0.1% formic acid), with gradient elution at a flow rate of 1 mL/min. The gradient program used was as follows: 0–15 min, 5–70% A; 15–25 min, 70–90% A; 25–27 min, 90–100% A; 27–30 min, 100% A; 30–35 min, 100-5% A; 35–40 min, 5% A. The column temperature was maintained at 25 °C, and the compounds were detected at wavelengths of 220 nm, 254 nm, 280 nm, and 310 nm. Each compound was dissolved in chromatographic grade methanol to prepare a stock solution of 1 mg/mL, which was then diluted to form standard solutions with concentrations of 0.05 mg/mL, 0.1 mg/mL, 0.15 mg/mL, 0.2 mg/mL, and 0.25 mg/mL, with 10 μL injected in sequence. Each sample was tested three times. The calibration graphs were plotted using linear regression analysis of integrated peak areas (y) and concentrations (x), with the regression equation in the form of y = ax + b, where y and x are the values of the peak area and sample quantity, respectively. The extract was prepared at a concentration of 10 mg/mL and impurity particles were filtered out using a syringe membrane. Then, 10 μL was injected into the HPLC system, and the peak area of the target compound was recorded. The contents of compounds 15 in the SFV were determined using the corresponding standard curve equation.

2.6. Statistical Analysis

The IC50 values of each component were estimated by Probit analysis in SPSS. A p-value less than 0.05 was considered significant.

3. Results and Discussion

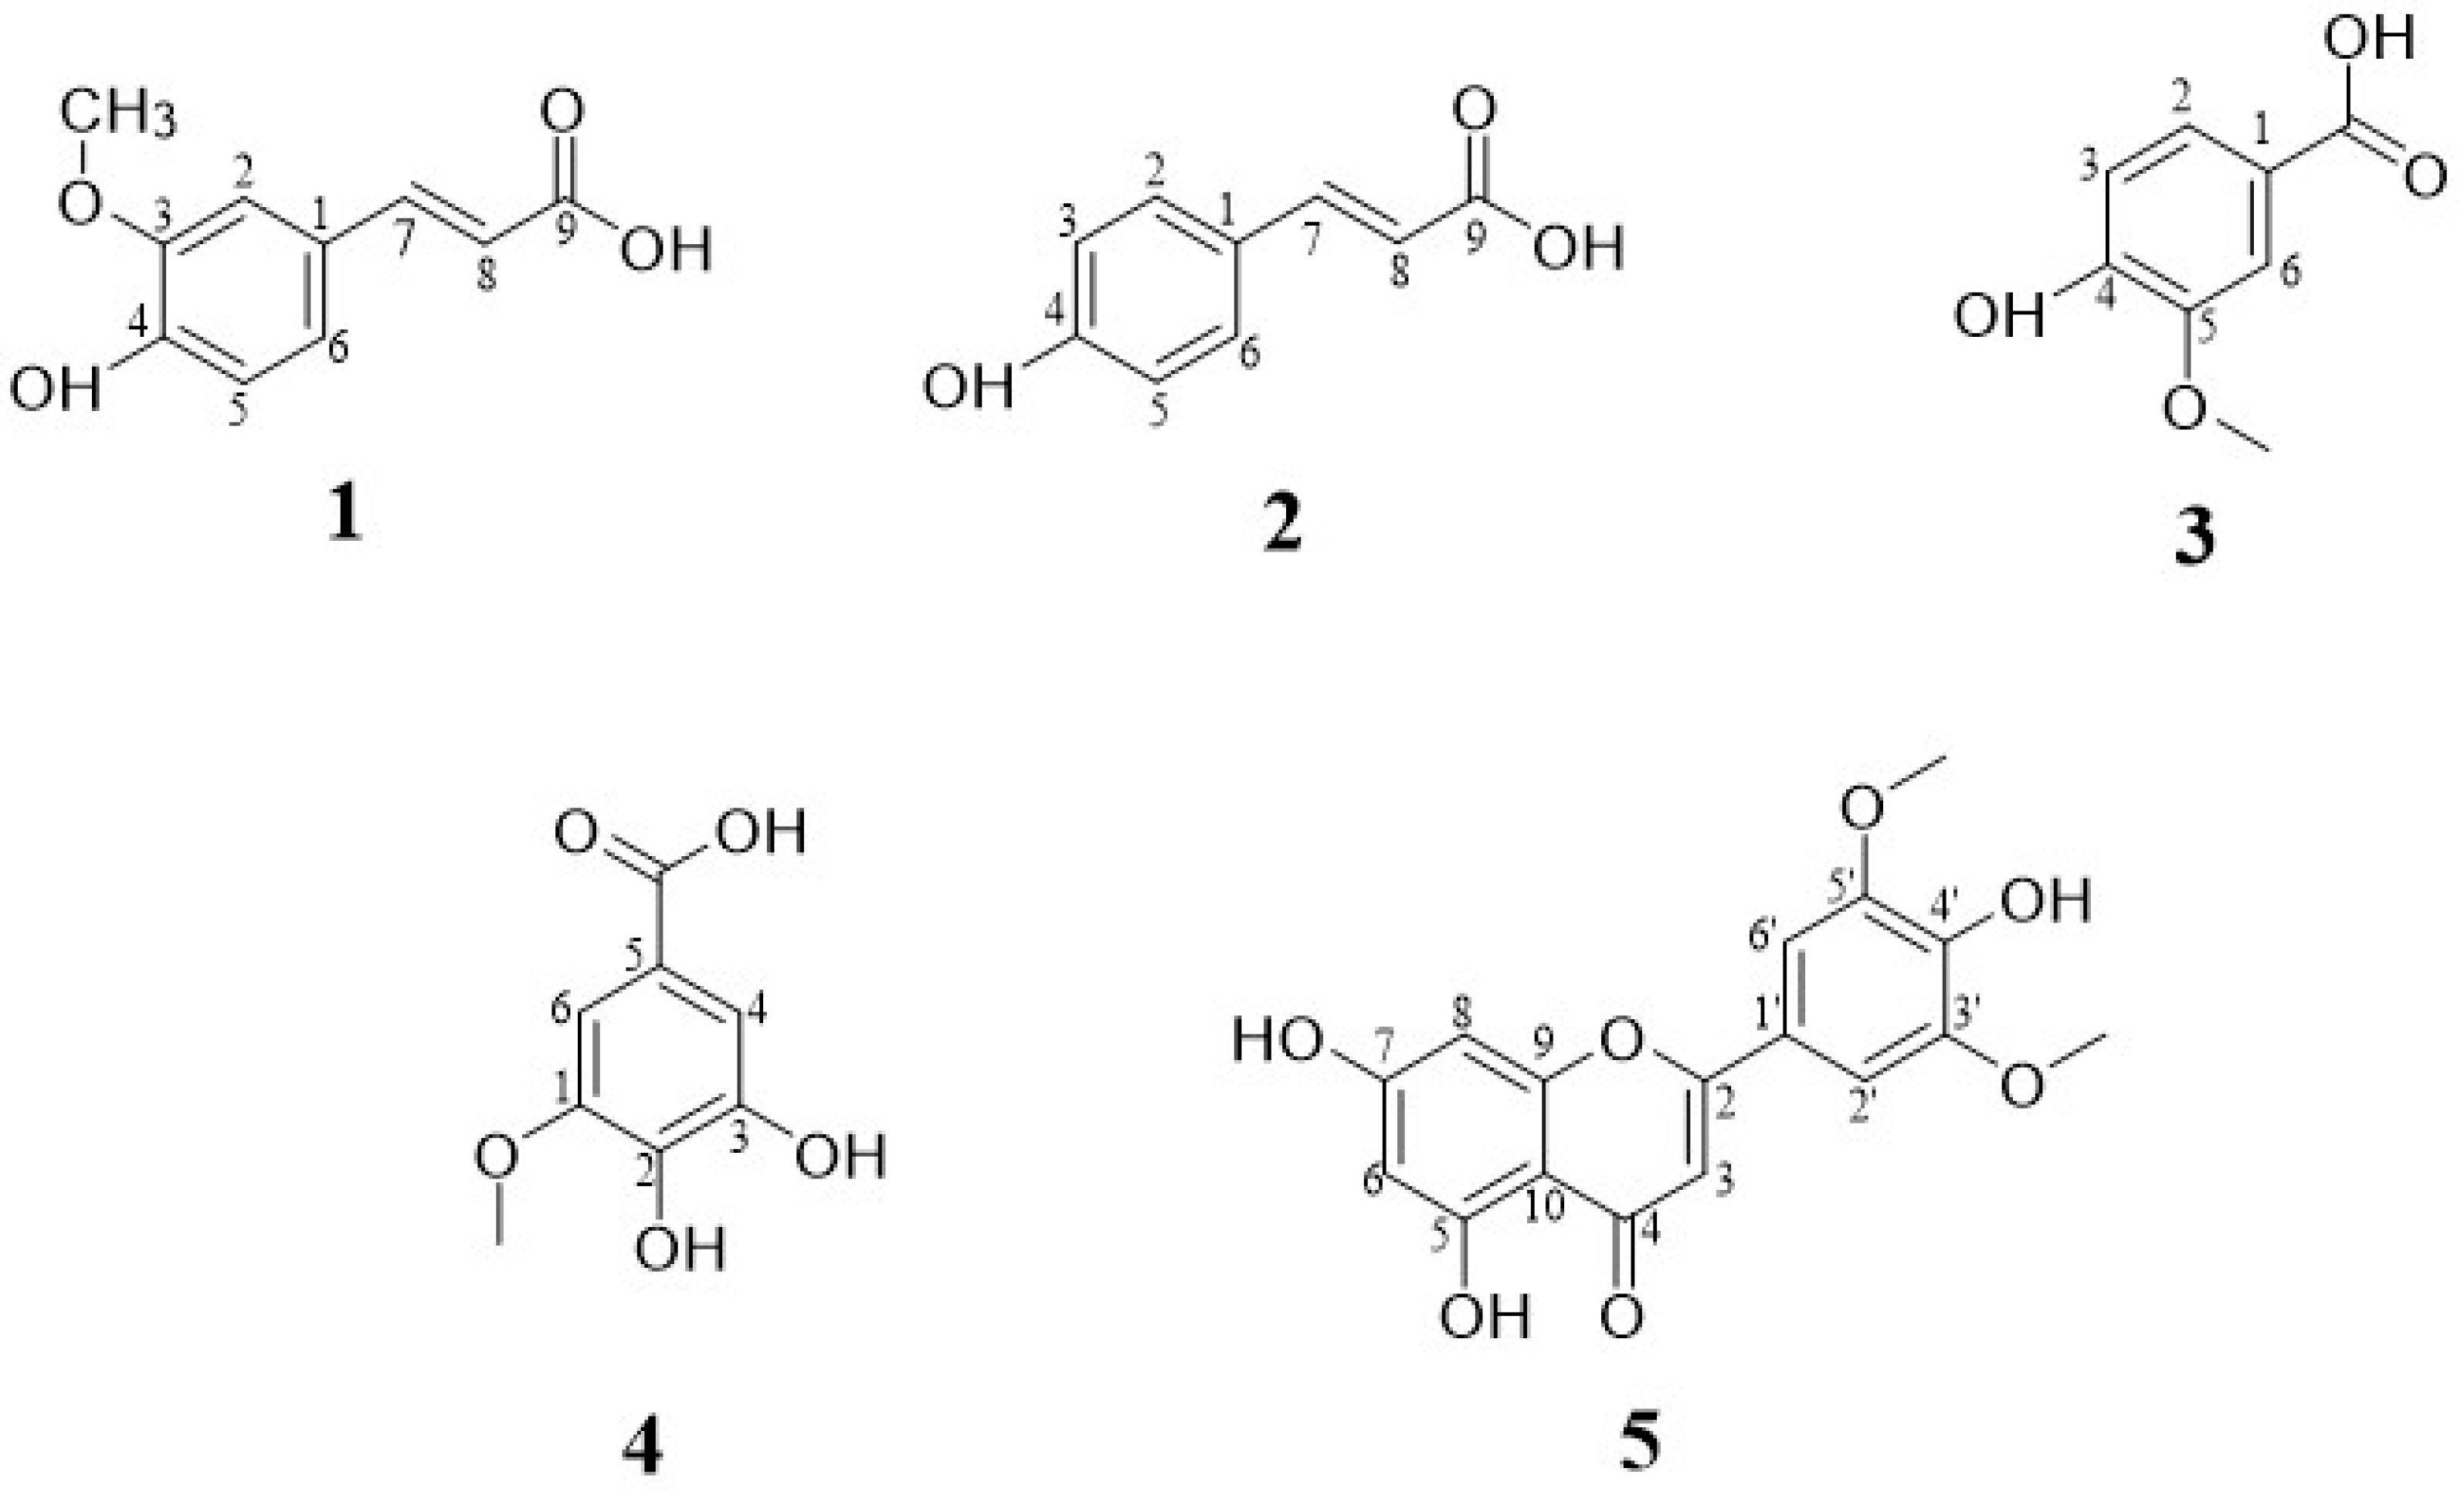
3.1. Structure Identification

Five compounds were isolated from the methanol extract of the SFV, as detailed in the experimental section.
Compound 1 appeared as a yellow powder. The 1H NMR spectrum displayed peaks at δ 7.60 (d, J = 18.1 Hz, 1H, H-7), 7.14 (m, 1H, H-2), 7.00 (m, 1H, H-6), 6.73 (m, 1H, H-5), 6.18 (m, 1H, H-8), and 3.80 (m, 3H, OCH3) (Figure S1). The 13C NMR spectrum showed peaks at δ 171.27 (CO), 150.79 (C-3), 149.65 (C-4), 147.21 (C-7), 128.07 (C-1), 124.28 (C-6), 116.74 (C-5), 116.19 (C-8), 111.94 (C-2), and 56.71 (OCH3) (Figure S2). By comparing with the literature [16], compound 1 was identified as (E)-3-(4-hydroxy-3-methoxyphenyl)acryylic acid, also known as ferulic acid (Figure 1). Ferulic acid is a phenolic acid structure with unsaturated double bonds and hydroxyl groups, commonly found in the cell walls of many plants such as Angelica sinensis [17], sugarcane [18], and Ligusticum chuanxiong [19]. Known for its antioxidant properties, ferulic acid also serves as a whitening agent [20] and an anti-inflammatory [21], and is known for its blood pressure-lowering [22] and kidney-protective effects [23]. It is widely utilized in medicine, food, and cosmetics.
Compound 2 was obtained as a light yellow powder. Its 1H NMR showed peaks at δ 7.57 (d, J = 16.2 Hz, 1H, H-7), 7.34 (m, 2H, H-2, 6), 6.72 (m, 2H, H-3, 5), and 6.17 (m, 1H, H-8) (Figure S3). The 13C NMR exhibited peaks at δ 171.46 (C-9), 161.17 (C-4), 146.58 (C-7), 131.07 (C-2, C-6), 127.56 (C-1), 116.80 (C-3, C-5), and 115.70 (C-8) (Figure S4). Upon comparison with the literature [24], compound 2 was identified as 3-(4-hydroxyphenyl)-2-acrylic acid (ρ-coumaric acid), as illustrated in Figure 1. ρ-Coumaric acid bears a structural similarity to ferulic acid and is a hydroxyl derivative of cinnamic acid. It is commonly found in nature, such as in asparagus [25], sugarcane [18], and other sources. ρ-Coumaric acid exhibits various beneficial activities, including antioxidant properties, prevention of liver and kidney toxicity [26], anti-aging effects [27], anti-inflammatory properties [28], antibacterial activity [29], and lipid-lowering effects [30]. Additionally, it is known for its anti-melanin effects [31] and its ability to keep meat fresh [32].
Compound 3 was obtained as a white powder and its structure was determined using 1H and 13C NMR spectroscopy. The results showed peaks at δ 7.45 (m, 2H, H-6, 2), 6.84 (d, J = 16.5 Hz, 1H, H-3), and 3.76 (m, 3H, OCH3) in the 1H NMR spectrum (Figure S5), and at δ 170.02 (COOH), 152.66 (C-4), 148.65 (-5), 125.27 (C-2), 123.04 (C-1), 115.82 (C-3), 113.76 (C-6), and 56.37 (OCH3) in the 13C NMR spectrum (Figure S6). By comparing these results with the literature [33], compound 3 was identified as 4-hydroxy-5-methoxy-benzoic acid, also known as vanillic acid (Figure 1). Vanillic acid is a natural benzoic acid derivative found in nature, for example in Catalpa bungei [34]. It can also be produced by bio-transforming ferulic acid [35]. Vanillic acid has demonstrated various bioactivities beyond its antioxidation and anti-inflammatory properties. Studies have shown its potential in regulating diabetes and hypertension in rats [36], as well as the neuroprotective effects that make it a promising agent for cerebrovascular insufficiency and vascular dementia [37]. Furthermore, its antimicrobial activities suggest potential applications as a food preservative, especially against Escherichia coli, Sarcina spp., Enterobacter hormaechei, Staphylococcus aureus, and Candida albicans [38].
Compound 4 was isolated as a brown powder. The 1H NMR spectrum showed peaks at δ 7.07 (d, J = 1.8 Hz, 1H, H-6), 7.02 (d, J = 1.9 Hz, 1H, H-4), and 3.77 (s, 3H, OCH3) (Figure S7). The 13C NMR spectrum exhibited signals at δ 167.84 (COOH), 147.73 (C-1), 145.08 (C-3), 138.53 (C-2), 121.58 (C-5), 110.79 (C-4), 104.79 (C-6), and 55.769 (OCH3) (Figure S8). Upon comparison with the literature [39], compound 4 was identified as 3,4-dihydroxy-5-methoxybenzoic acid (3-methoxygallic acid), as shown in Figure 1. 3-Methoxygallic acid is an organic acid with a structure similar to gallic acid. It is widely present in plants and possesses potential value. In the medical field, 3-methoxygallic acid has been found to regulate oncogenic signals, reducing the activity of human colon cancer cells [40]. In terms of chemical synthesis, it can be used as a precursor or intermediate for the synthesis of other compounds. For example, through a series of oxidation reactions, 3-methoxygallic acid can be utilized to synthesize methanol [41].
Compound 5 was isolated as a yellow powder. The 1H NMR showed peaks at δ 7.30 (s, 2H, H-2′,6′), 6.92 (s, 1H, H-3), 6.51 (s, 1H, H-8), 6.17 (s, 1H, H-6), and 3.87 (s, 6H, OCH3 × 2) (Figure S9). The 13C NMR displayed peaks at δ 181.60 (C-4), 163.38 (C-2), 161.38 (C-9), 157.46 (C-5), 148.34 (C-3′, C-5′), 139.36 (C-4′), 120.14 (C-1′), 104.37 (C-2′, C-6′), 103.39 (C-10), 103.26 (C-3), 99.20 (C-6), 94.27 (C-8), and 56.37 (CH3O- × 2) (Figure S10). According to the literature [42], compound 5 was identified as 3′,5′-dimethoxy-4′,5,7-trihydroxy flavone (Tricin, Figure 1). Tricin is a natural flavonoid found in various plants, such as wheat [43], rice bran [44], and willow [45]. Tricin exhibits multiple beneficial effects, including antioxidation, anti-angiogenesis [46], and anti-cancer properties [47]. In terms of antioxidation, tricin treatments have demonstrated the ability to reduce skin damage caused by UV irradiation through the inhibition of lysosomal exocytosis and ROS generation. Consequently, tricin is considered a promising candidate for anti-wrinkle and anti-photoaging treatments [48]. Furthermore, this compound exhibits potent inhibition against human cytomegalovirus [49] and the influenza virus [50]. In a cell model of Parkinson’s disease, tricin shows potential as an adjuvant drug for the treatment of this disease, as it has been observed to alleviate the pathogenesis and symptoms of Parkinson’s disease [51].

3.2. DPPH Free Radical Scavenging Activity

As illustrated in Figure 2, the TLC bioautographic experiment revealed that the spotted areas of each compound appeared white, indicating their potential antioxidant activity. In addition, the dose-dependent effect of compounds 15 on scavenging DPPH free radicals at different concentrations is illustrated in Figure 3. Using Probit analysis in SPSS 22.0 software, the IC50 values for scavenging DPPH free radicals were determined as follows: 0.240 μg/mL for vitamin C, 5.349 μg/mL for compound 1, 22.885 μg/mL for compound 2, 19.236 μg/mL for compound 3, 0.903 μg/mL for compound 4, and 1.01 μg/mL for compound 5, respectively. According to Equation (2), it was found that the masses of DPPH scavenged by unit mass of vitamin C and compounds 15 were 7.44, 0.33 (1), 0.08 (2), 0.09 (3), 1.98 (4), and 1.77 (5), respectively. Compounds 4 and 5 exhibited highly significant anti-DPPH radical potency. In other studies on the scavenging of DPPH free radicals, the IC50 values for ferulic acid (1) were reported as 41.2 μM (8.0 μg/mL) [52], 26.0 μM (5.05 μg/mL) [53], and 35.7 μM (6.93 μg/mL) [54]. For ρ-coumaric acid (2), the IC50 values were 33 μg/mL [55] and 30 μg/mL [56]. The IC50 values for vanillic acid (3), 3-methoxygallic acid (4), and tricin (5) were 96.28 μg/mL [57], 10.69 μg/mL [58], and 3.947 g/g DPPH [59], respectively. These results are consistent with our study findings.

3.3. The Amount of the Isolated Chemical Ingredient

Four phenolic acids and one flavonoid isolated from the SFV were analyzed quantitatively using the HPLC method [60]. We conducted ultraviolet absorption measurements at four different wavelengths: 220 nm, 254 nm, 280 nm, and 310 nm. Among these, 280 nm was found to be the optimal wavelength. We achieved baseline resolution for all compounds under the set analytical conditions. The chromatograms of compounds 15 and the crude extract are illustrated in Figure 4. The standard curves were plotted using Origin 2021 software based on the peak area of compounds 15 at different concentrations (Table S1). The standard curve diagrams for each compound are displayed in Figure 5. The regression equations and the correlation coefficient of the equation “R2” are listed in Table 1. The amount of each compound is based on the corresponding calibration curve and the HPLC data in Table 1. The peak area and content of these compounds 15 showed a strong linear relationship within a specific concentration range, with R2 > 0.996. The peak areas of each compound in the organic extract (Table S2) were substituted into the corresponding regression equation for the calculation. The results indicated that the contents of the five compounds in the SFV were as follows: 218.88 mg/kg (1), 157.31 mg/kg (2), 281.54 mg/kg (3), 33.85 mg/kg (4), and 713.42 mg/kg (5). The constituents mentioned have also been detected in other materials. Comparisons revealed that the levels of ferulic acid (1) and ρ -coumaric acid (2) in the SFV are higher than those found in corn. Specifically, the contents of ferulic acid and ρ -coumaric acid in corn are 181.7 μg/g and 138.6 μg/g, respectively [61]. Vanillic acid (3) was isolated from Paronychia argentea, with a content of 80 mg/kg [62]. Tricin (5) was isolated from various Huperzia species, showing the following content levels: 2.84 mg/g in H. kuestery, 27.4 mg/g in H. brevifolia, 3.95 mg/g in H. espinosana, 0.2 mg/g in H. crassa, and 5.7 mg/g in H. compacta [63]. These data provide a valuable basis for the development and utilization of these functional constituents from the SFV.

4. Conclusions

Ferulic acid, ρ -coumaric acid, vanillic acid, 3-methoxygallic acid, and tricin are valuable compounds with a wide market potential. According to QYResearch, ferulic acid sales reached $94 million in 2023 and are projected to hit $307 million by 2030, with a compound annual growth rate (CAGR) of 18.6% from 2024 to 2030. ρ-Coumaric acid is used in chemicals, food, health, cosmetics, and pharmaceuticals, driving increasing demand. Vanillic acid, important in pharmaceutical intermediates and flavors, is expected to reach $1 million in sales by 2030. 3-Methoxygallic acid has significant value in organic synthesis and is expected to grow in demand. Meanwhile, tricin is also gaining traction due to the rising preference for natural products. In summary, these compounds significantly support the advancement of various industries.
In this study, five compounds were isolated from the SFV: ferulic acid (1), ρ-coumaric acid (2), vanillic acid (3), 3-methoxygallic acid (4), and tricin (5). These compounds showed antioxidant and various biological activities. Ferulic acid is used in cosmetics, ρ-coumaric and vanillic acids as fungicides, 3-methoxygallic acid as a synthesis intermediate, and tricin as an antiviral and anti-tumor agent. The HPLC method confirmed that compounds 15 are abundant in the SFV, indicating that the SFV is a valuable resource worthy of further in-depth research and development. This study provides a strong theoretical foundation and practical guidance for developing medicinal and functional products based on the SFV.

Supplementary Materials

The following supporting information can be downloaded at: https://www.mdpi.com/article/10.3390/separations11110311/s1, Figure S1: 1H-NMR spectrum of compound 1; Figure S2: 13C-NMR spectrum of compound 1; Figure S3: 1H-NMR spectrum of compound 2; Figure S4: 13C-NMR spectrum of compound 2; Figure S5: 1H-NMR spectrum of compound 3; Figure S6: 13C-NMR spectrum of compound 3; Figure S7: 1H-NMR spectrum of compound 4; Figure S8: 13C-NMR spectrum of compound 4; Figure S9: 1H-NMR spectrum of compound 5; Figure S10: 13C-NMR spectrum of compound 5; Figure S11: HPLC analysis of different concentration of compound 1; Figure S12: HPLC analysis of different concentration of compound 2; Figure S13: HPLC analysis of different concentration of compound 3; Figure S14: HPLC analysis of different concentration of compound 4; Figure S15: HPLC analysis of different concentration of compound 5; Table S1: HPLC analytical data for compounds 15; Table S2: HPLC analysis data for compounds 15 in organic extract.

Author Contributions

Conceptualization, R.J., B.Y., B.L. and Y.Z.; data curation, R.J. and B.Y.; methodology, R.J., B.Y., Y.C. and Y.Z.; project administration, B.L.; formal analysis, Y.Z.; supervision, Y.Z.; writing—original draft, R.J. and R.Z.; writing—review and editing, Y.Z. All authors have read and agreed to the published version of the manuscript.

Funding

This research was supported financially by the University–Industry collaboration key program of the Fujian Provincial Department of Science and Technology (2024N5005), the “Open bidding for selecting the best candidates” technology project of the Fuzhou Ocean Research Institute (2024F16), and the Two schools–enterprise cooperation project of the Fujian Provincial Department of Science and Technology (2022N5004 and 2023S0036).

Data Availability Statement

Data will be made available on request.

Conflicts of Interest

Authors Bo Li and Yiyong Chen was employed by the company Fujian Wanchen Biotechnology Group Co., Ltd. The remaining authors declare that the research was conducted in the absence of any commercial or financial relationships that could be construed as a potential conflict of interest.

References

  1. Qin, P.; Li, T.; Liu, C.; Liang, Y.; Sun, H.; Chai, Y.; Yang, T.; Gong, X.; Wu, Z. Extraction and utilization of active substances from edible fungi substrate and residue: A review. Food Chem. 2023, 398, 133872. [Google Scholar] [CrossRef] [PubMed]
  2. Ikeda, S.; Yamauchi, M.; Watari, T.; Hatamoto, M.; Yamada, M.; Maki, S.; Hara, H.; Yamaguchi, T. Development of Enokitake (Flammulina velutipes) mushroom cultivation technology using spent mushroom substrate anaerobic digestion residue. Environ. Technol. Innov. 2021, 24, 102046. [Google Scholar] [CrossRef]
  3. Luo, J.; Chen, L. Status and development of spent mushroom substrate recycling: A review. J. Air Waste Manag. Assoc. 2024, 1–18. [Google Scholar] [CrossRef] [PubMed]
  4. Umor, N.A.; Ismail, S.; Abdullah, S.; Huzaifah, M.H.R.; Huzir, N.M.; Mahmood, N.A.N.; Zahrim, A.Y. Zero waste management of spent mushroom compost. J. Mater. Cycles Waste Manag. 2021, 23, 1726–1736. [Google Scholar] [CrossRef]
  5. Pérez-Chávez, A.M.; Mayer, L.; Albertó, E. Mushroom cultivation and biogas production: A sustainable reuse of organic resources. Energy Sustain. Dev. 2019, 50, 50–60. [Google Scholar] [CrossRef]
  6. Kulshreshtha, S. Removal of pollutants using spent mushrooms substrates. Environ. Chem. Lett. 2018, 17, 833–847. [Google Scholar] [CrossRef]
  7. Jia, C.-W.; Li, C.-T.; Tian, F.-H.; Sun, B.; Tang, L.-D. Research on the Application Effects of Flammulina velutipes Waste and Chicken Embryos in the High-yield and High-quality Cultivation of Pleurotus ostreatus. Mod. Agric. Sci. Technol. 2018, 22, 66–67. [Google Scholar]
  8. Lin, L.; Cui, F.; Zhang, J.; Gao, X.; Zhou, M.; Xu, N.; Zhao, H.; Liu, M.; Zhang, C.; Jia, L. Antioxidative and renoprotective effects of residue polysaccharides from Flammulina velutipes. Carbohydr. Polym. 2016, 146, 388–395. [Google Scholar] [CrossRef]
  9. Yang, Y.; Zhang, X.; Zhang, J.; Wang, T.; Liu, S.; Ma, H.; Inam, M.; Guan, L. Green ultrasonic-assisted enzymatic extraction of polysaccharides from Flammulina velutipes residues by response surface methodology. Sustain. Chem. Pharm. 2024, 41, 101690. [Google Scholar] [CrossRef]
  10. Tso, K.H.; Lumsangkul, C.; Ju, J.C.; Fan, Y.K.; Chiang, H.I. The Potential of Peroxidases Extracted from the Spent Mushroom (Flammulina velutipes) Substrate Significantly Degrade Mycotoxin Deoxynivalenol. Toxins 2021, 13, 72. [Google Scholar] [CrossRef]
  11. Heleno, S.A.; Prieto, M.A.; Barros, L.; Rodrigues, A.; Barreiro, M.F.; Ferreira, I.C.F.R. Optimization of microwave-assisted extraction of ergosterol from Agaricus bisporus L. by-products using response surface methodology. Food Bioprod. Process. 2016, 100, 25–35. [Google Scholar] [CrossRef]
  12. Liu, X.; Hou, R.; Wang, D.; Mai, M.; Wu, X.; Zheng, M.; Fu, J. Comprehensive utilization of edible mushroom Auricularia auricula waste residue-Extraction, physicochemical properties of melanin and its antioxidant activity. Food Sci. Nutr. 2019, 7, 3774–3783. [Google Scholar] [CrossRef] [PubMed]
  13. Sato, N.; Shinji, K.; Mizuno, M.; Nozaki, K.; Suzuki, M.; Makishima, S.; Shiroishi, M.; Onoda, T.; Takahashi, F.; Kanda, T.; et al. Improvement in the productivity of xylooligosaccharides from waste medium after mushroom cultivation by hydrothermal treatment with suitable pretreatment. Bioresour. Technol. 2010, 101, 6006–6011. [Google Scholar] [CrossRef] [PubMed]
  14. Kassim, N.K.; Lim, P.C.; Ismail, A.; Awang, K. Isolation of antioxidative compounds from Micromelum minutum guided by preparative thin layer chromatography-2,2-diphenyl-1-picrylhydrazyl (PTLC-DPPH) bioautography method. Food Chem. 2019, 272, 185–191. [Google Scholar] [CrossRef] [PubMed]
  15. Brand-Williams, W.; Cuvelier, M.E.; Berset, C. Use of a free radical method to evaluate antioxidant activity. LWT—Food Sci. Technol. 1995, 28, 25–30. [Google Scholar] [CrossRef]
  16. Prachayasittikul, S.; Suphapong, S.; Worachartcheewan, A.; Lawung, R.; Ruchirawat, S.; Prachayasittikul, V. Bioactive metabolites from Spilanthes acmella Murr. Molecules 2009, 14, 850–867. [Google Scholar] [CrossRef] [PubMed]
  17. Xi, J.; Luo, S. The mechanism for enhancing extraction of ferulic acid from Radix Angelica sinensis by high hydrostatic pressure. Sep. Purif. Technol. 2016, 165, 208–213. [Google Scholar] [CrossRef]
  18. Li, M.; Jia, Z.; Wan, G.; Wang, S.; Min, D. Enhancing isolation of p-coumaric and ferulic acids from sugarcane bagasse by sequential hydrolysis. Chem. Pap. 2019, 74, 499–507. [Google Scholar] [CrossRef]
  19. Xie, Y.; Liu, H.; Lin, L.; Zhao, M.; Zhang, L.; Zhang, Y.; Wu, Y. Application of natural deep eutectic solvents to extract ferulic acid from Ligusticum chuanxiong Hort with microwave assistance. RSC Adv. 2019, 9, 22677–22684. [Google Scholar] [CrossRef]
  20. Shon, Y.J.; Kim, W.C.; Lee, S.-H.; Hong, S.; Kim, S.-Y.; Park, M.H.; Lee, P.; Lee, J.; Park, K.H.; Lim, W.; et al. Antimelanogenic potential of brewer’s spent grain extract through modulation of the MAPK/MITF axis. Sustain. Mater. Technol. 2023, 38, e00721. [Google Scholar] [CrossRef]
  21. Johnson, E.M.; Jayabalan, L.R.; Patra, S.K.; Suh, J.-W. Self-assembled fructo-oligosaccharide conjugated ferulic acid microparticle: Anticancer, anti-inflammatory and immunomodulatory effects. J. Drug Deliv. Sci. Technol. 2024, 92, 105339. [Google Scholar] [CrossRef]
  22. Alam, M.A. Anti-hypertensive Effect of Cereal Antioxidant Ferulic Acid and Its Mechanism of Action. Front. Nutr. 2019, 6, 121. [Google Scholar] [CrossRef] [PubMed]
  23. Bami, E.; Ozakpinar, O.B.; Ozdemir-Kumral, Z.N.; Koroglu, K.; Ercan, F.; Cirakli, Z.; Sekerler, T.; Izzettin, F.V.; Sancar, M.; Okuyan, B. Protective effect of ferulic acid on cisplatin induced nephrotoxicity in rats. Environ. Toxicol. Pharmacol. 2017, 54, 105–111. [Google Scholar] [CrossRef] [PubMed]
  24. Bergman, M.; Varshavsky, L.; Gottlieb, H.E.; Grossman, S. The antioxidant activity of aqueous spinach extract: Chemical identification of active fractions. Phytochemistry 2001, 58, 143–152. [Google Scholar] [CrossRef]
  25. Kato-Noguchi, H.; Nakamura, K.; Ohno, O.; Suenaga, K.; Okuda, N. Asparagus decline: Autotoxicity and autotoxic compounds in asparagus rhizomes. J. Plant Physiol. 2017, 213, 23–29. [Google Scholar] [CrossRef]
  26. Cha, H.; Lee, S.; Lee, J.H.; Park, J.W. Protective effects of p-coumaric acid against acetaminophen-induced hepatotoxicity in mice. Food Chem. Toxicol. 2018, 121, 131–139. [Google Scholar] [CrossRef]
  27. Sheng, K.; Li, Y.; Wang, Z.; Hang, K.; Ye, Z. p-Coumaric acid suppresses reactive oxygen species-induced senescence in nucleus pulposus cells. Exp. Ther. Med. 2022, 23, 183. [Google Scholar] [CrossRef]
  28. Guo, J.; Su, K.; Wang, L.; Feng, B.; You, X.; Deng, M.; Toh, W.S.; Wu, J.; Cheng, B.; Xia, J. Poly(p-coumaric acid) nanoparticles alleviate temporomandibular joint osteoarthritis by inhibiting chondrocyte ferroptosis. Bioact. Mater. 2024, 40, 212–226. [Google Scholar] [CrossRef] [PubMed]
  29. Li, J.; Zhao, N.; Xu, R.; Li, G.; Dong, H.; Wang, B.; Li, Z.; Fan, M.; Wei, X. Deciphering the antibacterial activity and mechanism of p-coumaric acid against Alicyclobacillus acidoterrestris and its application in apple juice. Int. J. Food Microbiol. 2022, 378, 109822. [Google Scholar] [CrossRef]
  30. Yoon, D.S.; Cho, S.Y.; Yoon, H.J.; Kim, S.R.; Jung, U.J. Protective effects of p-coumaric acid against high-fat diet-induced metabolic dysregulation in mice. Biomed. Pharmacother. 2021, 142, 111969. [Google Scholar] [CrossRef]
  31. Boo, Y.C. p-Coumaric Acid as An Active Ingredient in Cosmetics: A Review Focusing on its Antimelanogenic Effects. Antioxidants 2019, 8, 275. [Google Scholar] [CrossRef]
  32. Chen, X.; Yu, F.; Li, Y.; Lou, Z.; Toure, S.L.; Wang, H. The inhibitory activity of p-coumaric acid on quorum sensing and its enhancement effect on meat preservation. CyTA—J. Food 2020, 18, 61–67. [Google Scholar] [CrossRef]
  33. Gutierrez-Lugo, M.T.; Woldemichael, G.M.; Singh, M.P.; Suarez, P.A.; Maiese, W.M.; Montenegro, G.; Timmermann, B.N. Isolation of three new naturally occurring compounds from the culture of Micromonospora sp. P1068. Nat. Prod. Res. 2005, 19, 645–652. [Google Scholar] [CrossRef] [PubMed]
  34. Kim, S.Y.; Kwon, S.P.; Park, S.; Cho, S.H.; Oh, Y.; Kim, S.H.; Park, Y.H.; Jung, H.S.; Lee, D.C.; Jeong, H.; et al. Effect of Pinoresinol and Vanillic Acid Isolated from Catalpa bignonioides on Mouse Myoblast Proliferation via the Akt/mTOR Signaling Pathway. Molecules 2022, 27, 5397. [Google Scholar] [CrossRef] [PubMed]
  35. Tang, P.L.; Hassan, O. Bioconversion of ferulic acid attained from pineapple peels and pineapple crown leaves into vanillic acid and vanillin by Aspergillus niger I-1472. BMC Chem. 2020, 14, 7. [Google Scholar] [CrossRef]
  36. Vinothiya, K.; Ashokkumar, N. Modulatory effect of vanillic acid on antioxidant status in high fat diet-induced changes in diabetic hypertensive rats. Biomed. Pharmacother. 2017, 87, 640–652. [Google Scholar] [CrossRef]
  37. Khoshnam, S.E.; Sarkaki, A.; Rashno, M.; Farbood, Y. Memory deficits and hippocampal inflammation in cerebral hypoperfusion and reperfusion in male rats: Neuroprotective role of vanillic acid. Life Sci. 2018, 211, 126–132. [Google Scholar] [CrossRef]
  38. Matejczyk, M.; Ofman, P.; Juszczuk-Kubiak, E.; Swislocka, R.; Shing, W.L.; Kesari, K.K.; Prakash, B.; Lewandowski, W. Biological effects of vanillic acid, iso-vanillic acid, and orto-vanillic acid as environmental pollutants. Ecotoxicol. Environ. Saf. 2024, 277, 116383. [Google Scholar] [CrossRef]
  39. Li, D.; Ding, P.; Liu, S.; Yang, X.; Rufeng, W. Screening of An Antibacterial Strain from Human Intestinal Microbes and Investigation on Its Active Metabolites. Mod. Chin. Med. 2020, 22, 26–34. [Google Scholar] [CrossRef]
  40. Forester, S.C.; Choy, Y.Y.; Waterhouse, A.L.; Oteiza, P.I. The anthocyanin metabolites gallic acid, 3-O-methylgallic acid, and 2,4,6-trihydroxybenzaldehyde decrease human colon cancer cell viability by regulating pro-oncogenic signals. Mol. Carcinog. 2014, 53, 432–439. [Google Scholar] [CrossRef]
  41. Donnelly, M.I.; Dagley, S. Bacterial degradation of 3,4,5-trimethoxycinnamic acid with production of methanol. J. Bacteriol. 1981, 147, 471–476. [Google Scholar] [CrossRef]
  42. Kuwabara, H.; Mouri, K.; Otsuka, H.; Kasai, R.; Yamasaki, K. Tricin from a malagasy connaraceous plant with potent antihistaminic activity. J. Nat. Prod. 2003, 66, 1273–1275. [Google Scholar] [CrossRef] [PubMed]
  43. Moheb, A.; Agharbaoui, Z.; Kanapathy, F.; Ibrahim, R.K.; Roy, R.; Sarhan, F. Tricin biosynthesis during growth of wheat under different abiotic stresses. Plant Sci. 2013, 201–202, 115–120. [Google Scholar] [CrossRef] [PubMed]
  44. Ajitha, M.J.; Mohanlal, S.; Suresh, C.H.; Jayalekshmy, A. DPPH radical scavenging activity of tricin and its conjugates isolated from “Njavara” rice bran: A density functional theory study. J. Agric. Food Chem. 2012, 60, 3693–3699. [Google Scholar] [CrossRef]
  45. Santos, A.L.; Yamamoto, E.S.; Passero, L.F.D.; Laurenti, M.D.; Martins, L.F.; Lima, M.L.; Uemi, M.; Soares, M.G.; Lago, J.H.G.; Tempone, A.G.; et al. Antileishmanial Activity and Immunomodulatory Effects of Tricin Isolated from Leaves of Casearia arborea (Salicaceae). Chem. Biodivers. 2017, 14, e1600458. [Google Scholar] [CrossRef] [PubMed]
  46. Han, J.M.; Kwon, H.J.; Jung, H.J. Tricin, 4′,5,7-trihydroxy-3′,5′-dimethoxyflavone, exhibits potent antiangiogenic activity in vitro. Int. J. Oncol. 2016, 49, 1497–1504. [Google Scholar] [CrossRef] [PubMed]
  47. Li, J.X.; Li, R.Z.; Sun, A.; Zhou, H.; Neher, E.; Yang, J.S.; Huang, J.M.; Zhang, Y.Z.; Jiang, Z.B.; Liang, T.L.; et al. Metabolomics and integrated network pharmacology analysis reveal Tricin as the active anti-cancer component of Weijing decoction by suppression of PRKCA and sphingolipid signaling. Pharmacol. Res. 2021, 171, 105574. [Google Scholar] [CrossRef]
  48. An, M.; Kim, H.; Moon, J.M.; Ko, H.S.; Clayton, P.; Lim, Y.H. Enzyme-Treated Zizania latifolia Ethanol Extract Protects from UVA Irradiation-Induced Wrinkle Formation via Inhibition of Lysosome Exocytosis and Reactive Oxygen Species Generation. Antioxidants 2020, 9, 912. [Google Scholar] [CrossRef]
  49. Akuzawa, K.; Yamada, R.; Li, Z.; Li, Y.; Sadanari, H.; Matsubara, K.; Watanabe, K.; Koketsu, M.; Tuchida, Y.; Murayama, T. Inhibitory effects of tricin derivative from Sasa albo-marginata on replication of human cytomegalovirus. Antivir. Res. 2011, 91, 296–303. [Google Scholar] [CrossRef]
  50. Doring, K.; Langeder, J.; Duwe, S.; Tahir, A.; Grienke, U.; Rollinger, J.M.; Schmidtke, M. Insights into the direct anti-influenza virus mode of action of Rhodiola rosea. Phytomedicine 2022, 96, 153895. [Google Scholar] [CrossRef]
  51. Wang, X.; Hu, W.; Qu, L.; Wang, J.; Wu, A.; Lo, H.H.; Ng, J.P.L.; Tang, Y.; Yun, X.; Wu, J.; et al. Tricin promoted ATG-7 dependent autophagic degradation of alpha-synuclein and dopamine release for improving cognitive and motor deficits in Parkinson’s disease. Pharmacol. Res. 2023, 196, 106874. [Google Scholar] [CrossRef]
  52. Kim, Y.J.; Jeong, S.-J.; Seo, C.-S.; Lim, H.-S.; Sohn, E.; Yun, J.; Kim, B.-Y. Simultaneous Determination of the Traditional Herbal Formula Ukgansan and the In Vitro Antioxidant Activity of Ferulic Acid as an Active Compound. Molecules 2018, 23, 1659. [Google Scholar] [CrossRef] [PubMed]
  53. Ahmad, N.A.; Jumbri, K.; Ramli, A.; Abd Ghani, N.; Ahmad, H.; Lim, J.W. A Kinetic Approach of DPPH Free Radical Assay of Ferulate-Based Protic Ionic Liquids (PILs). Molecules 2018, 23, 3201. [Google Scholar] [CrossRef] [PubMed]
  54. Wang, D.; Zhu, J.; Xu, J.R.; Ji, D.D. Synthesis of N-hydroxycinnamoyl amide derivatives and evaluation of their anti-oxidative and anti-tyrosinase activities. Bioorg. Med. Chem. 2019, 27, 114918. [Google Scholar] [CrossRef] [PubMed]
  55. Benbettaieb, N.; Nyagaya, J.; Seuvre, A.-M.; Debeaufort, F. Antioxidant Activity and Release Kinetics of Caffeic and p-Coumaric Acids from Hydrocolloid-Based Active Films for Healthy Packaged Food. J. Agric. Food Chem. 2018, 66, 6906–6916. [Google Scholar] [CrossRef] [PubMed]
  56. Kilic, I.; Yesiloglu, Y. Spectroscopic studies on the antioxidant activity of p-coumaric acid. Spectrochim. Acta A Mol. Biomol. Spectrosc. 2013, 115, 719–724. [Google Scholar] [CrossRef]
  57. Akbar, S.; Ishtiaq, S.; Jahangir, M.; Elhady, S.S.; Bogari, H.A.; Alahdal, A.M.; Ashour, M.L.; Youssef, F.S. Evaluation of The Antioxidant, Antimicrobial, and Anticancer Activities of Dicliptera bupleuroides Isolated Compounds Using In Vitro and In Silico Studies. Molecules 2021, 26, 7196. [Google Scholar] [CrossRef]
  58. Huyut, Z.; Beydemir, Ş.; Gülçin, İ. Antioxidant and Antiradical Properties of Selected Flavonoids and Phenolic Compounds. Biochem. Res. Int. 2017, 2017, 7616791. [Google Scholar] [CrossRef]
  59. Renuka Devi, R.; Arumughan, C. Antiradical efficacy of phytochemical extracts from defatted rice bran. Food Chem. Toxicol. 2007, 45, 2014–2021. [Google Scholar] [CrossRef]
  60. Cheng, H.-T.; Li, X.-L.; Li, X.-R.; Li, Y.-H.; Wang, L.-J.; Xue, M. Simultaneous quantification of selected compounds from Salvia herbs by HPLC method and their application. Food Chem. 2012, 130, 1031–1035. [Google Scholar] [CrossRef]
  61. Zavala-Lopez, M.; Garcia-Lara, S. An improved microscale method for extraction of phenolic acids from maize. Plant Methods 2017, 13, 81. [Google Scholar] [CrossRef]
  62. Muti, H.Y.; Olimat, S. HPLC Method of Analysis for Determination and Standardization of Luteolin and Vanillic Acid in Dry Extract of Paronychia Argentea Lam. Orient. J. Chem. 2018, 34, 2721–2727. [Google Scholar] [CrossRef]
  63. Armijos, C.; Ponce, J.; Ramírez, J.; Gozzini, D.; Vidari, P.V.F. An Unprecedented High Content of the Bioactive Flavone Tricin in Huperzia Medicinal Species Used by the Saraguro in Ecuador. Nat. Prod. Commun. 2016, 11, 1934578X1601100301. [Google Scholar] [CrossRef]
Figure 1. The chemical structures of compounds 15. Note: 1—ferulic acid, 2—ρ-coumaric acid, 3—vanillic acid, 4—3-methoxygallic acid, and 5—tricin.
Separations 11 00311 g001
Figure 2. TLC-bioautography test for DPPH radical scavenging activity of compounds 15. Note: 1—ferulic acid, 2—ρ-coumaric acid, 3—vanillic acid, 4—3-methoxygallic acid, and 5—tricin.
Separations 11 00311 g002
Figure 3. The DPPH scavenging rate curves of compounds 15. Note: 1—ferulic acid, 2—ρ-coumaric acid, 3—vanillic acid, 4—3-methoxygallic acid, and 5—tricin.
Separations 11 00311 g003
Figure 4. The HPLC chromatograms of the crude extract from the SFV (a) and compounds 15 (b). Note: 1—ferulic acid, 2—ρ-coumaric acid, 3—vanillic acid, 4—3-methoxygallic acid, and 5—tricin.
Separations 11 00311 g004
Figure 5. The regression curve between the peak area and content of compounds 15. Note: 1—ferulic acid, 2—ρ-coumaric acid, 3—vanillic acid, 4—3-methoxygallic acid, and 5—tricin. * Expressed as multiplication sign. The peak area is the product of the peak height (mAU) and the retention time (min).
Separations 11 00311 g005
Table 1. HPLC data for the calibration graphs and contents of the five active compounds.
CompoundsRetention Time
(min)
Linear RegressionR2Content in Organic Extract (mg/mL)Content in SFV (mg/kg)
114.90y = 349.63x + 1.350.99980.0679218.88
214.75y = 633.68x + 3.680.99640.0448157.31
312.89y = 93.39x + 0.530.99930.0873281.54
410.75y = 215.34x + 0.180.99960.010533.85
520.24y = 37.45x + 0.040.99850.2213713.42
Disclaimer/Publisher’s Note: The statements, opinions and data contained in all publications are solely those of the individual author(s) and contributor(s) and not of MDPI and/or the editor(s). MDPI and/or the editor(s) disclaim responsibility for any injury to people or property resulting from any ideas, methods, instructions or products referred to in the content.

