Article

Study on an Integrated Water Treatment System by Simultaneously Coupling Granular Activated Carbon (GAC) and Powdered Carbon with Ultrafiltration

School of Chemistry and Chemical Engineering, Beijing Institute of Technology, Beijing 102488, China
*
Author to whom correspondence should be addressed.
Separations 2024, 11(11), 312; https://doi.org/10.3390/separations11110312
Submission received: 2 September 2024 / Revised: 26 October 2024 / Accepted: 28 October 2024 / Published: 30 October 2024
(This article belongs to the Special Issue Advanced Research in Desalination)

Abstract

:
The process of using powdered activated carbon (PAC) in conjunction with ultrafiltration (UF) has been widely adopted for the treatment of various types of water and wastewater. However, during the application of this integrated PAC-UF process, PAC tends to adhere significantly to the surface of the UF membrane, which exacerbates membrane fouling. To tackle this issue, this study proposed an innovative water treatment approach that simultaneously integrated granular activated carbon (GAC) and PAC/biochar with UF. In this setup, PAC/biochar was intended to enhance water quality, while the fluidized GAC particles were aimed at reducing membrane fouling and the deposition of PAC/biochar on the membrane surface. We systematically analyzed the operational performance of the integrated systems concerning fouling formation, PAC/biochar attachment, effluent quality, and foulant components. The results indicate that both PAC and biochar effectively improved effluent quality in terms of chemical oxygen demand (COD) and hardness, although they significantly deposited on the membrane surface during operation. Notably, PAC was more prone to attach to the membrane than biochar, and the fouling in biochar-UF systems was primarily attributed to the attachment of organic foulants rather than biochar itself. By combining with GAC, up to 46.01% of membrane fouling and 96.11% of PAC/biochar attachment were mitigated due to the strong mechanical action of the fluidized GAC particles. Importantly, the inclusion of fluidized GAC did not significantly affect effluent quality. Consequently, the GAC-PAC/biochar systems proposed in this study demonstrated dual benefits of improving effluent quality and ensuring stable operation, thereby providing a viable solution for efficient and sustainable water treatment.

1. Introduction

Ultrafiltration (UF) is currently a widely used approach to treating water and wastewater. Compared with the traditional water treatment methods, UF exhibits desirable solid–liquid separation ability, which can effectively isolate aqueous colloidal substances, fine suspended particles, and microorganisms [1,2,3,4]. In addition, compared with the traditional water treatment processes, the UF process has the advantages of a small footprint, low energy consumption, etc. Powdered activated carbon (PAC) is a common adsorbent with good pollutant removal capacity [5,6]. Therefore, many investigations combined PAC with the UF process, forming an integrated PAC-UF system for water treatment [7,8,9]. Compared with a single UF process, coupling the appropriate concentration of PAC can effectively improve water quality [10]. For example, Tomaszewska et al. found that when 100 mg/L PAC was added into the UF tank, the removal rates of humic acids (HA) and phenol were up to 90% and 100%, respectively [11]. However, the effect of PAC on the UF filtration system is bidirectional, which means that PAC improves water quality but, in the meantime, aggravates membrane fouling formation due to the severe PAC deposition on the membrane surface [12].
Membrane fouling usually refers to the adhesion or deposition of pollutants on the membrane surface, resulting in a decrease in the permeation flux of the membrane [13]. Membrane fouling typically includes organic fouling, inorganic fouling, and biological fouling [2,14]. The main mechanisms of membrane fouling formation involve pore plugging and cake layer [2]. During the operation of the integrated PAC-UF process, PAC usually deposits on the membrane surface, causing membrane pore blockage or forming a filter cake layer on the membrane surface, resulting in membrane fouling [15]. Therefore, when carrying out water treatment, the UF membrane should be regularly maintained through physical cleaning, chemical cleaning, etc. In actual industrial operations, chemical cleaning of membrane modules is cumbersome and usually requires a period of shutdown, which affects the efficiency of the entire operation and increases costs. Also, it was reported that intermittent chemical cleaning of the integrated PAC-UF system could in turn aggravate membrane fouling during next-round operation [16]. Recently, physical and mechanical scouring with fluidized particles has been proven as an effective route to alleviate membrane fouling, which can also reduce energy requirements and operational costs [17,18]. Wu et al. had already shown that granular activated carbon (GAC) could reduce the cake layer resistance by at least 35% when the effluent of an anaerobic bioreactor was treated [19]. Therefore, further coupling fluidized GAC particles with PAC-UF might be a promising strategy to mitigate membrane fouling development and PAC attachment on the membrane surface.
Moreover, compared with PAC, biochar has a lower production cost, which can be generated from green wastes, including agricultural biomass and solid waste [20,21]. Biochar has the characteristics of a high specific surface area, pore volume, and a variety of functional groups and can effectively adsorb organic/inorganic pollutants in water [20,22]. It was reported that biochar showed better adsorption performance than activated carbon for targeted non-steroidal anti-inflammatory drugs [23]. Therefore, biochar is regarded as an alternative that can replace PAC in water treatment. It is necessary to compare the performances of PAC-UF and biochar-UF systems in removing aqueous contaminants as well as their fouling propensity.
In this study, GAC and PAC/biochar were simultaneously coupled with UF to establish innovative water treatment systems, where PAC/biochar was aimed at improving water quality and fluidized GAC particles were targeted for alleviating membrane fouling and PAC/biochar deposition on membrane surfaces. The differences between the two systems in terms of membrane fouling formation and water quality were systematically explored, and the performance of fluidized GAC on fouling control was comprehensively evaluated. It is anticipated that this work will provide a novel strategy that concurrently achieves high water quality and stable operation.

2. Materials and Methods

2.1. Experimental Materials

The surface water used in this study was taken from North Lake of Beijing Institute of Technology, Liang Xiang Campus. The UF membrane used in this work was polyethersulfone (PES) membrane (Beijing Separate Company, Beijing, China) with a nominal molecular weight cutoff (MWCO) of 150 kDa. Before the experiments, the flat-sheet PES membrane was placed in deionized water for 24 h wetting.
Coal-based round GAC (RGAC, Huanyu Company, Pingdingshan, China) was manually screened by using the standard screens of 2.00 mm and 2.30 mm for obtaining the particles with a mean diameter of 2.15 ± 0.15 mm. Afterwards, the collected RGAC particles were washed several times with deionized water until the supernatant was sufficiently clear. The cleaned RGAC particles were then soaked in the aforementioned surface water for 24 h to achieve adsorption saturation in order to avoid their potential impact on PAC adsorption during operation. The PAC with the average particle size of 13.46 μm was purchased from Cabot Corporation of the USA (Boston, MA, USA) [17]. Wheat-based biochar with the size of 70 μm was ordered from Xingnuo Company of China (Zhengzhou, China). A portion of the initial p-biochar was further ground to a smaller size of 15.72 μm with an agate mortar. The average sizes of PAC and biochar mentioned above were determined by a Mastersizer (Malvern, UK) at room temperature.

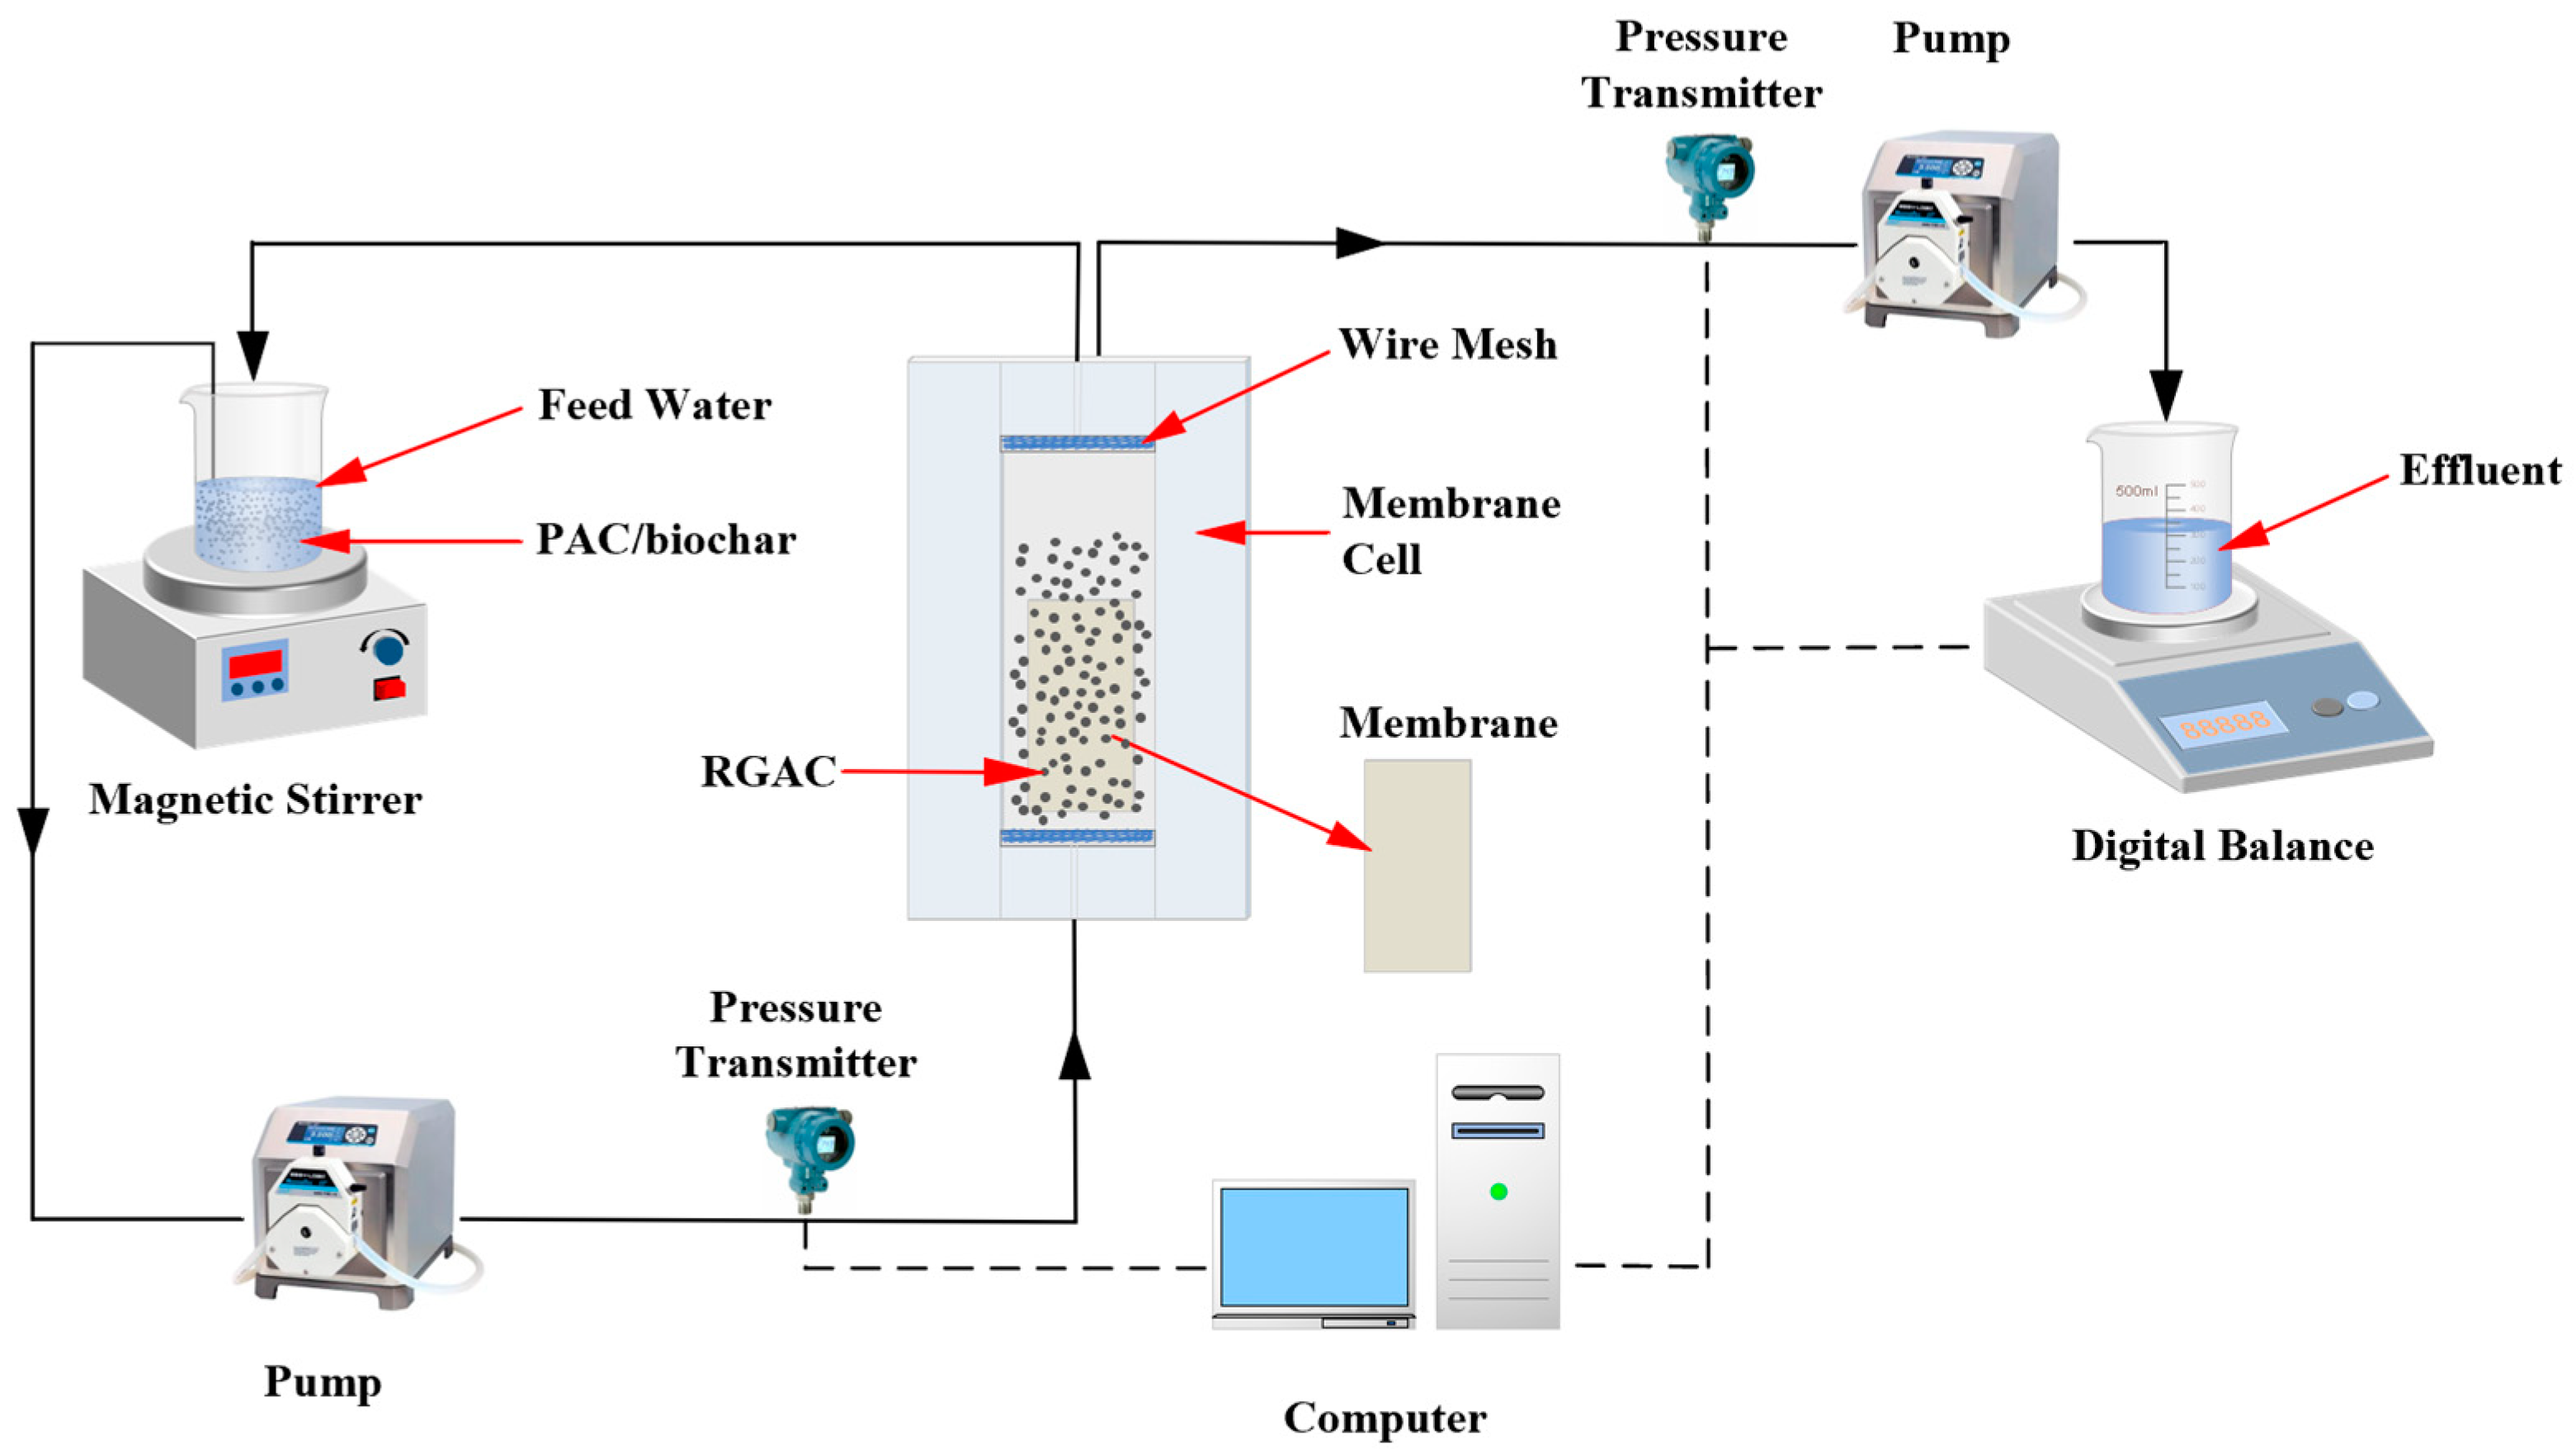
2.2. Experiment Setup and Operation

The lab-scale experiment setup is illustrated in Figure 1. PAC or biochar with a concentration of 300 mg/L was added to 2 L of feed water to adsorb contaminants. The PAC, or biochar, entered the crossflow membrane cell from the bottom along with the feed water. The prepared RGAC particles were placed in the membrane cell with a filling volume of 50% to control membrane fouling during fluidization. Two wire meshes with a diameter of approximately 0.5 mm were placed on both the top and bottom of the membrane cell. These meshes allowed the passage of PAC/biochar through the membrane cell while preventing fluidized RGAC particles from escaping the membrane cell.
The effective membrane area in contact with the feed water was 0.002 m2 (80 mm × 25 mm), and the rest of the membrane surface was covered with tape to prevent PAC or biochar from being trapped in the gap at the edge of the membrane cell and affecting the experimental results. The circulating liquid velocity required for fluidizing RGAC in the membrane cell was provided by the peristaltic pump (Cole-Parmer, Vernon Hills, IL, USA). The liquid rate maintained the fluidization height of RGAC in the membrane cell at 100 mm, which allowed RGAC to fully contact with the membrane surface. The arrows in Figure 1 indicate the direction of the water inlet and outlet for the setup. The peristaltic pump (Cole-Parmer, USA) at the outlet end controlled the constant flux of 30 L/(m2·h) during the 300 min filtration. The water recovery rate for each experiment was 15%. The pressure sensors installed at both ends of the membrane cell were used to monitor the change in the transmembrane pressure (TMP), reflecting membrane fouling development. The TMP was automatically recorded by the Labview software at an interval of 20 s during operation. Each filtration experiment was repeated at least three times with the average value presented.

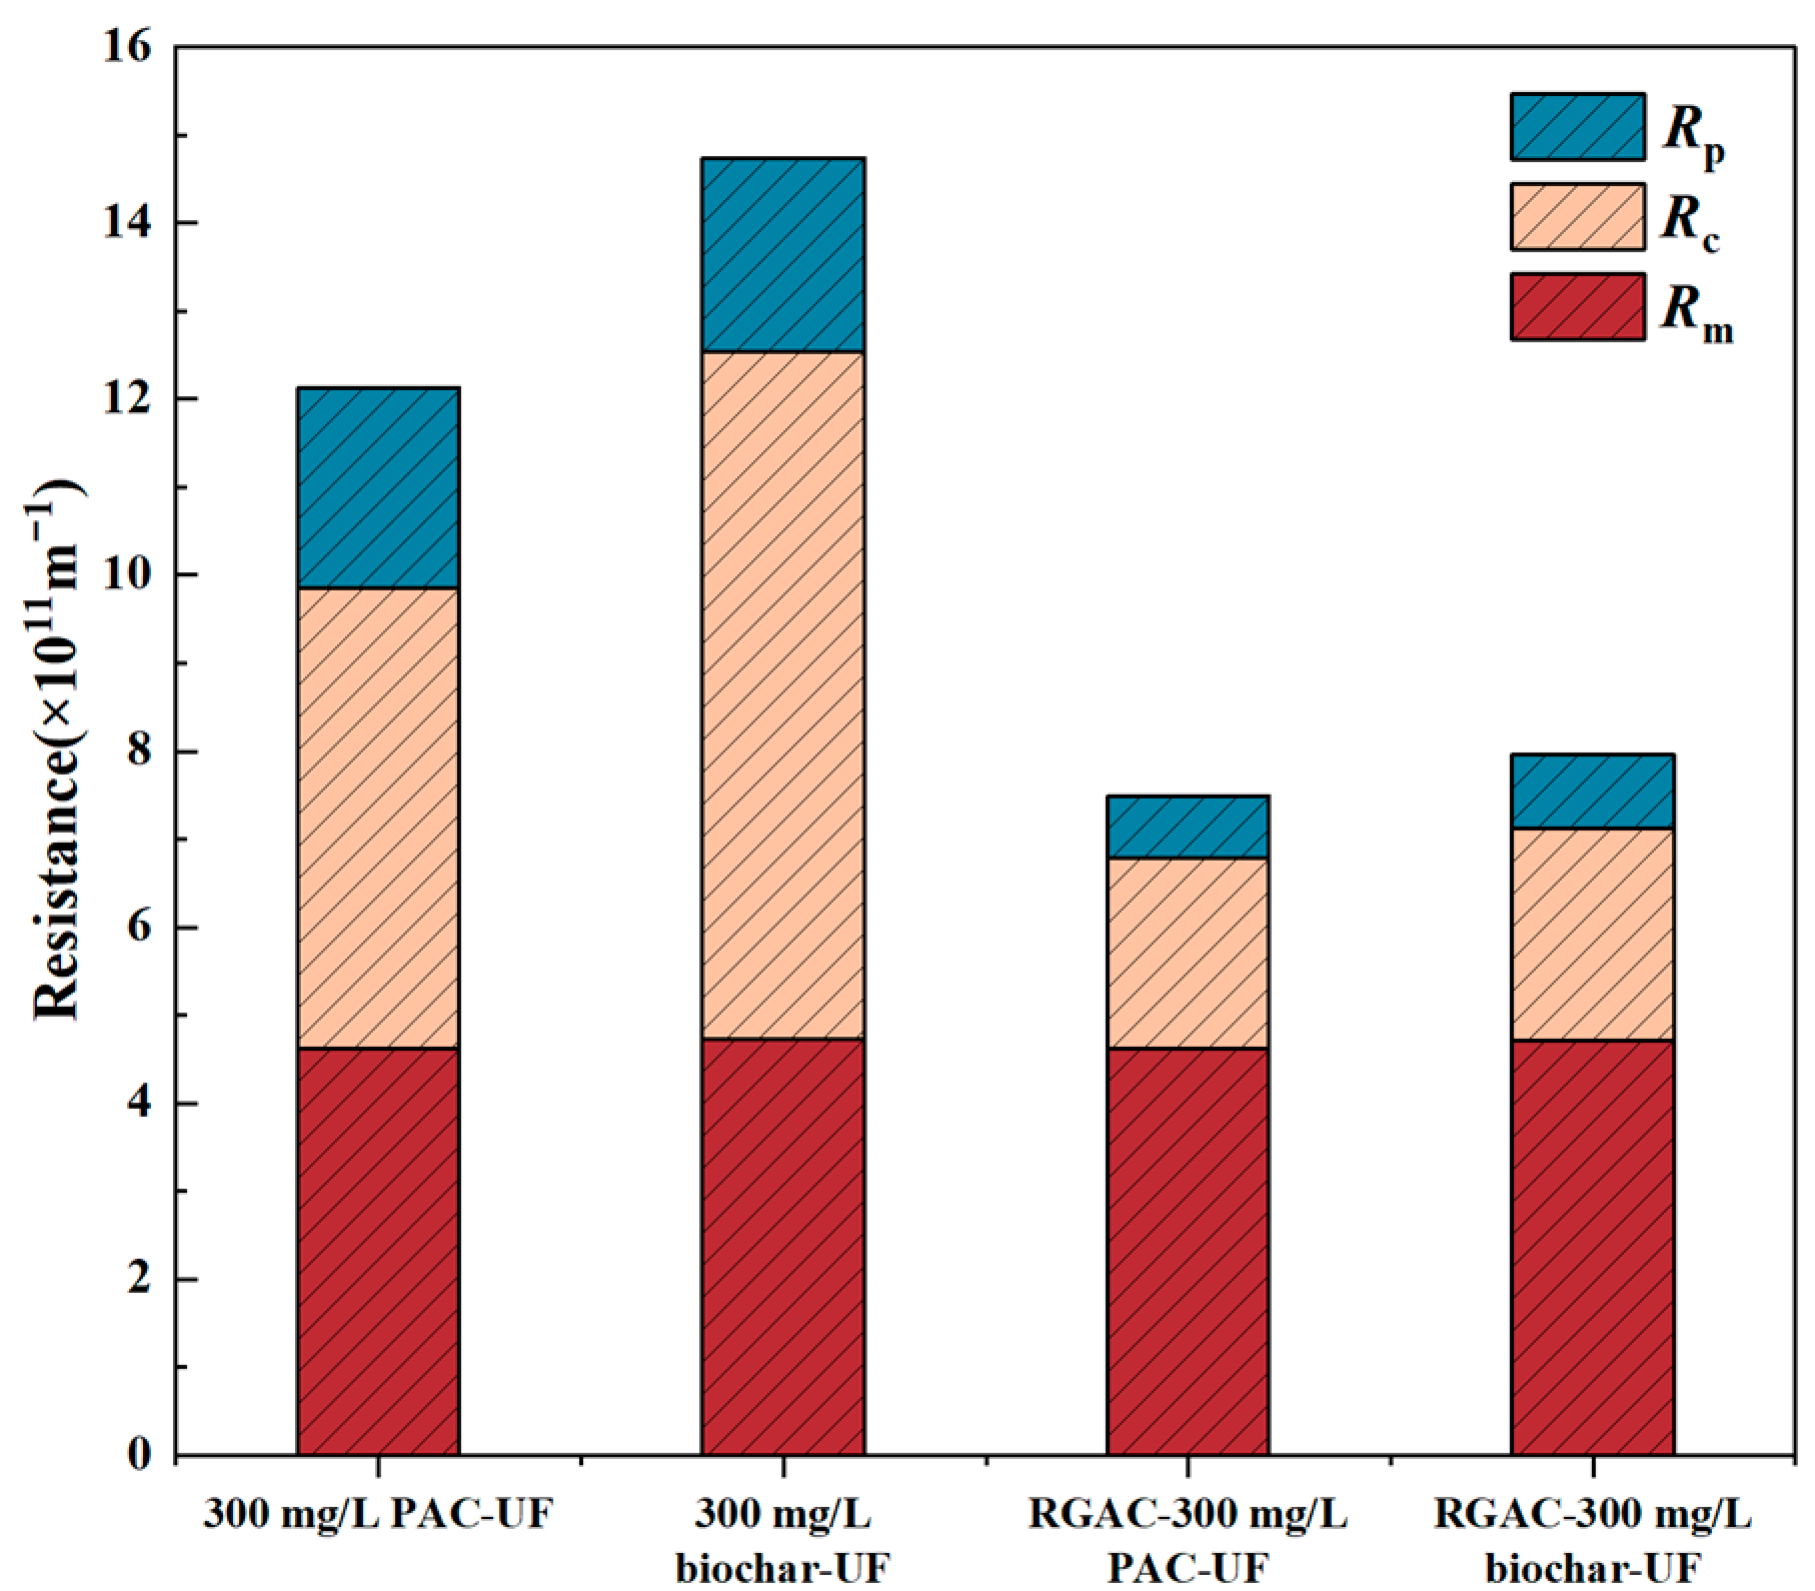
2.3. Measurement of Membrane Resistances

The membrane resistances, which included membrane resistance (Rm), cake layer resistance (Rc), and pore blocking resistance (Rp), were determined using Equations (1)–(4) as follows [24]:
R m = P 0 μ J
R t = P 1 μ J
R c = P 1 μ J P 2 μ J
R p = R t R m R c
where Rt represents the total resistance during filtration, m−1; μ is the viscosity of the feed water, Pa·s; J is the permeate flux, L/(m2·h); P0 represents the TMP obtained by direct filtration of deionized water through virgin membrane, kPa; P1 represents the TMP obtained by direct filtration of deionized water through fouled membrane, kPa; and P2 represents the TMP obtained by direct filtration of deionized water through the membrane after the cake layer was removed with a plastic brush, kPa.

2.4. Determination of PAC/Biochar Amounts and Extraction of Membrane Foulants

After 300 min of the filtration process, a plastic brush was used to scrape off the PAC/biochar and membrane foulants deposited on the membrane surface into 30 mL of deionized water. After centrifuging at 10,000 rpm for 20 min, the separated PAC/biochar sedimented on the bottom was resuspended into 30 mL of deionized water. Then, the turbidity of the PAC/biochar suspension was measured by a turbidity meter (TN150, Shanghai San-Xin Instrumentation, Shanghai, China) and converted to factual concentration according to the pre-calibrated standard curves for quantifying the amount of PAC/biochar deposited on the membrane surface. The supernatant obtained after centrifugation, which contained membrane foulants, was pretreated with a 0.45 μm filter and stored at −20 °C for further determination. The determination of PAC/biochar amounts was repeated at least three times, and the average value was taken to represent the results.

2.5. Analytical Methods for Membrane Foulants Samples and Water Samples

In this study, the excitation emission matrix (EEM) fluorescence spectroscopy was utilized to characterize the components of organic contaminants. Before the testing, the water sample was filtered through a 0.45 μm filter and then determined by a fluorescence spectrophotometer (F-7000, Nitachi, Tokyo, Japan) at room temperature in a 1 cm glass cuvette with the excitation wavelength ranging from 200 nm to 500 nm at 10 nm intervals. At each excitation wavelength, the emission wavelength was scanned from 250 nm to 550 nm at 2 nm intervals. The excitation and emission bandpass were set at 10 nm, and the scan speed was 1200 nm/min. According to a previous study [25], the fluorescence region integration (FRI) method was employed to analyze EEM data. The potential deviation caused by Raman scattering was eliminated by deducting the spectrum of deionized water from each spectrum of the sample.
Additionally, chemical oxygen demand (CODMn) was determined by using the standard methods [26]. The hardness of the sample in terms of Ca2+ and Mg2+ contents was determined by using a Hach spectrophotometer (DR1900, Hach, Loveland, CO, USA) with the kit and protocol provided by the supplier. The measurement was conducted at a wavelength of 522 nm. Each measurement was repeated at least 3 times, and the average value was taken to represent the results.

3. Results and Discussion

3.1. Membrane Fouling Tendency

Figure 2 shows the evolution of TMP in the integrated systems after 300 min filtration. The TMP values in the four systems, i.e., PAC-UF, biochar-UF, RGAC-PAC-UF, and RGAC-biochar-UF, ultimately reached 30.23 kPa, 36.60 kPa, 18.58 kPa, and 19.76 kPa, respectively. Throughout the filtration, the TMP of the PAC-UF system and biochar-UF system showed a continuous increase, indicative of the successive membrane fouling. After being combined with RGAC particles, the TMP showed a slight increase during the first 25 min, after which it gradually stabilized until the filtration process was completed. Comparing the PAC-UF and biochar-UF systems without fluidized RGAC particles, it was found that the membrane fouling in the biochar-UF system was more severe. It was reported that PAC and biochar could cause membrane pore blockage, which could aggravate membrane fouling and decrease membrane flux [15]. However, after coupling with RGAC, the TMP value during 300 min filtration did not rise significantly, with the final TMP of RGAC-PAC/biochar-UF systems decreasing by about 38.54% and 46.01%, respectively. It suggested that coupling fluidized RGAC with both PAC-UF and biochar-UF systems could maintain sustainable permeability and effectively control membrane fouling formation.
Figure 3 illustrates the filtration resistances associated with the virgin membrane (Rm), pore blocking (Rp), and cake layer formation (Rc) after 300 min of filtration. It was evident that fouling was primarily intensified by the formation of the cake layer. In comparison to the PAC-UF system, the biochar-UF system exhibited a higher Rc, likely due to the role of biochar in the development of the cake layer. However, when fluidized RGAC particles were added, both Rc and Rp significantly decreased, with Rc reducing by 58.51% compared to the PAC-UF system and by 69.27% compared to the biochar-UF system.

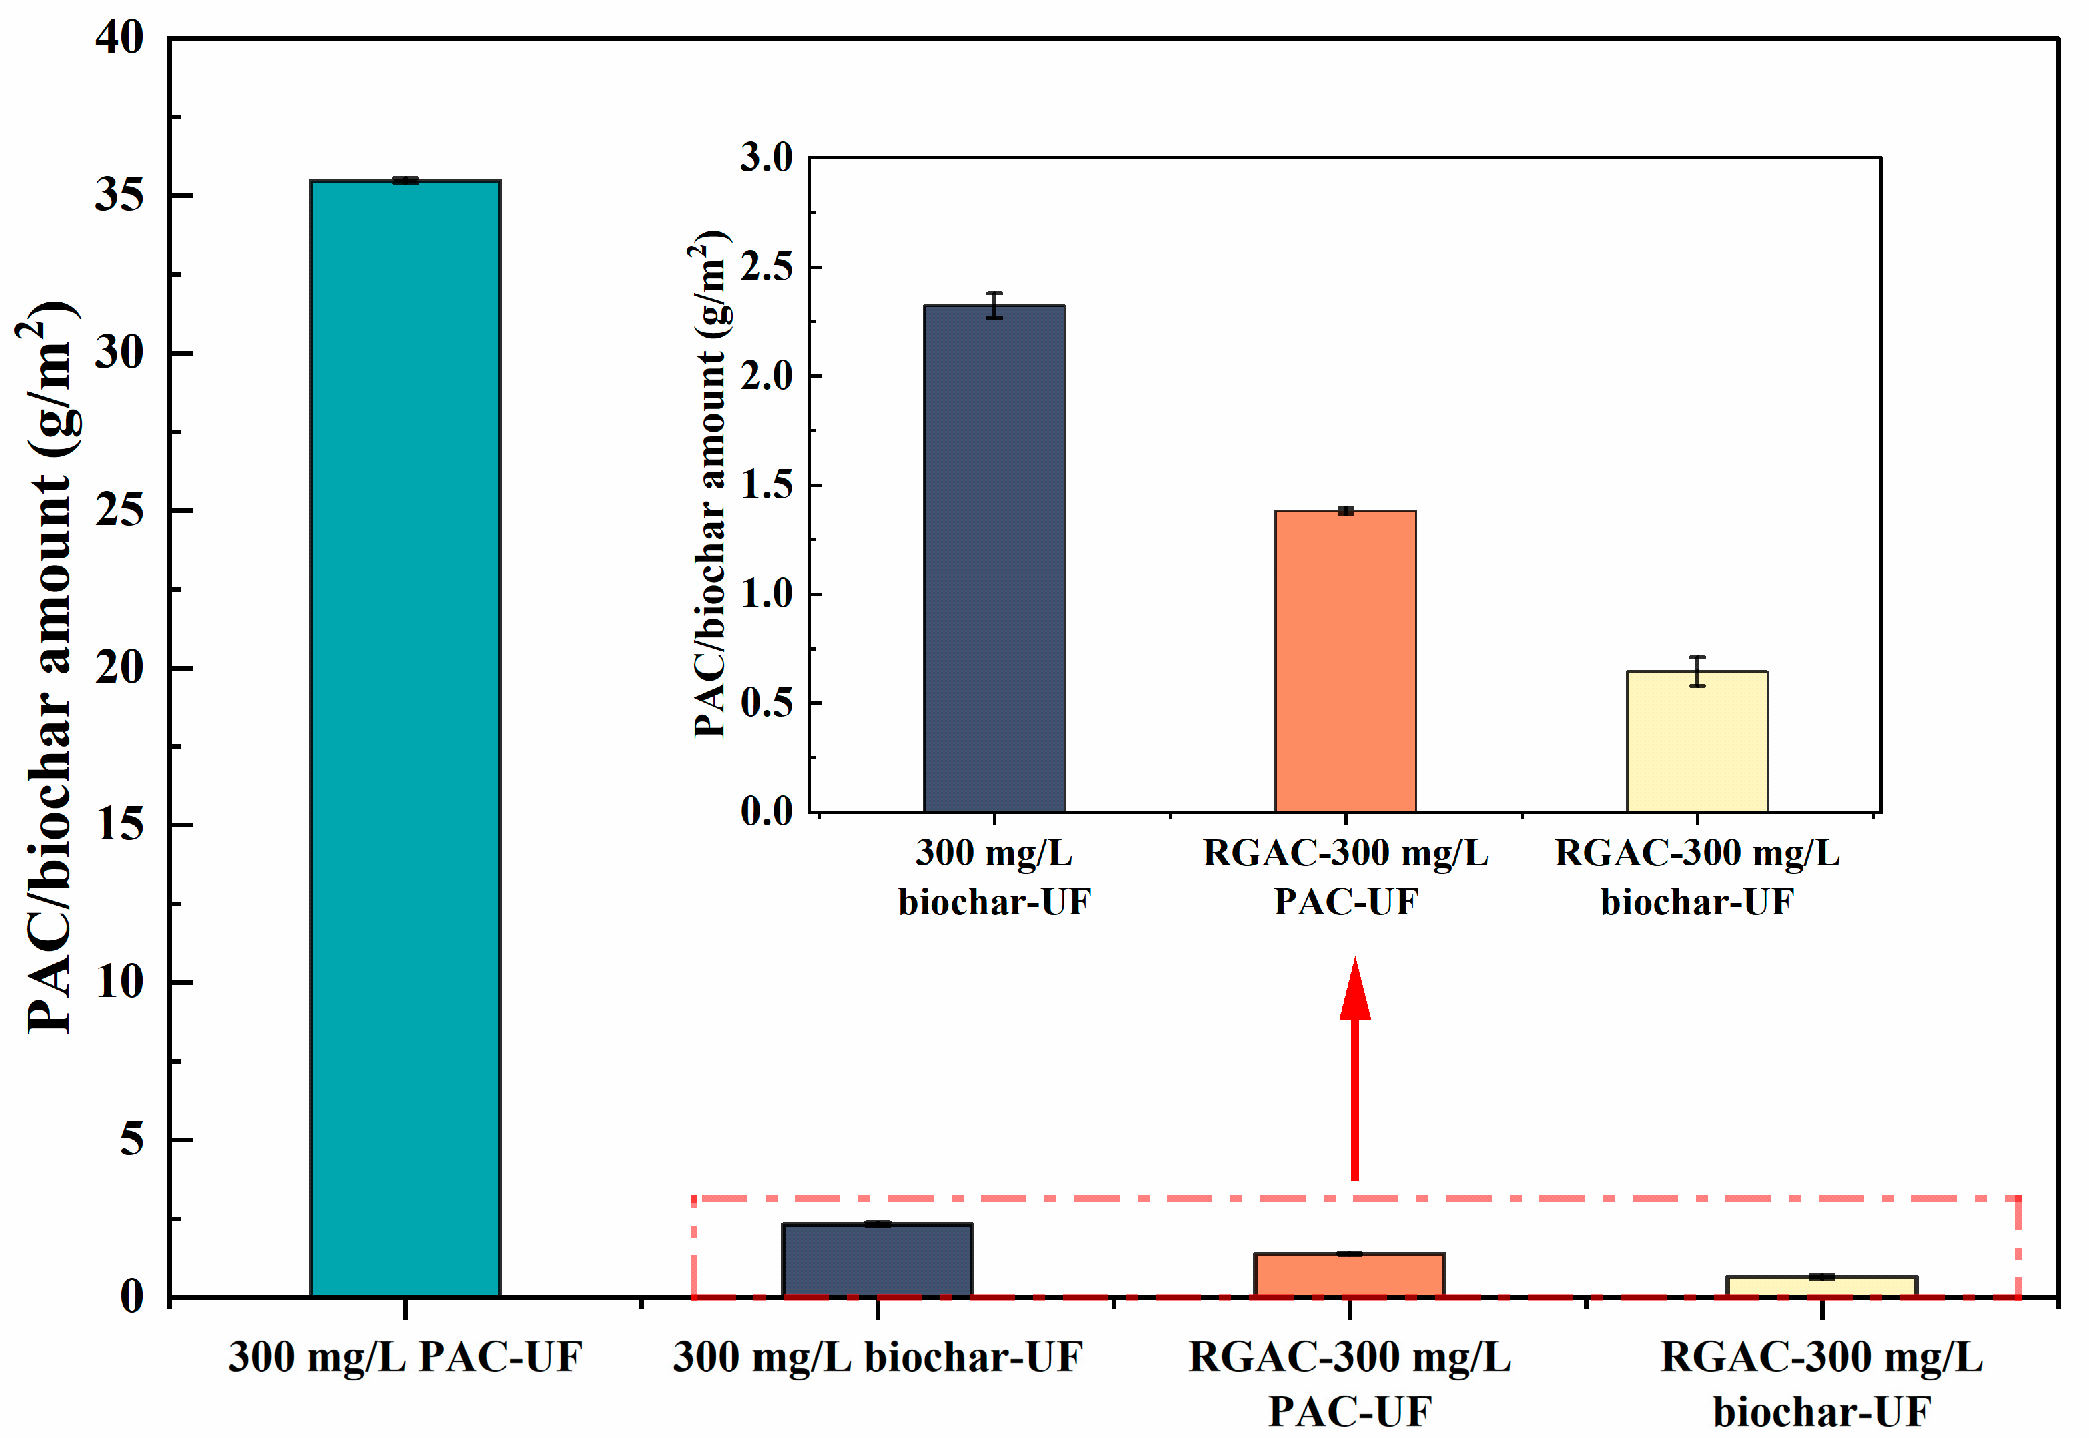
3.2. PAC/Biochar Attachment on Membrane Surface

Previous research had indicated that PAC negatively impacted membrane separation performance by adhering to the membrane surface during filtration [27]. To better understand the characteristics of membrane fouling, we analyzed the amount of PAC and biochar present on the membrane after operation. The membrane used in this experiment was an ultrafiltration membrane with a nominal molecular weight cutoff (MWCO) of 150 kDa (equivalent to around 0.1 μm), provided by the manufacturer. The particle sizes of PAC and biochar used in the experiment were measured as 13.46–70 μm, which was much larger than the membrane pore size. As shown in Figure 4, PAC adhered to the membrane surface more readily than biochar in the absence of RGAC. Specifically, the amount of PAC attached was 35.48 mg/m2, compared to only 2.32 mg/m2 for biochar. This difference might be attributed to the larger average size of the initial biochar particles (70 μm) compared to PAC particles (13.46 μm), which might impede their ability to adhere to the membrane surface. However, when fluidized RGAC was introduced, the amounts of both PAC and biochar significantly decreased by 96.11% and 72.23%, respectively. Therefore, the incorporation of fluidized RGAC particles effectively mitigated membrane fouling caused by the adhesion of PAC and biochar.

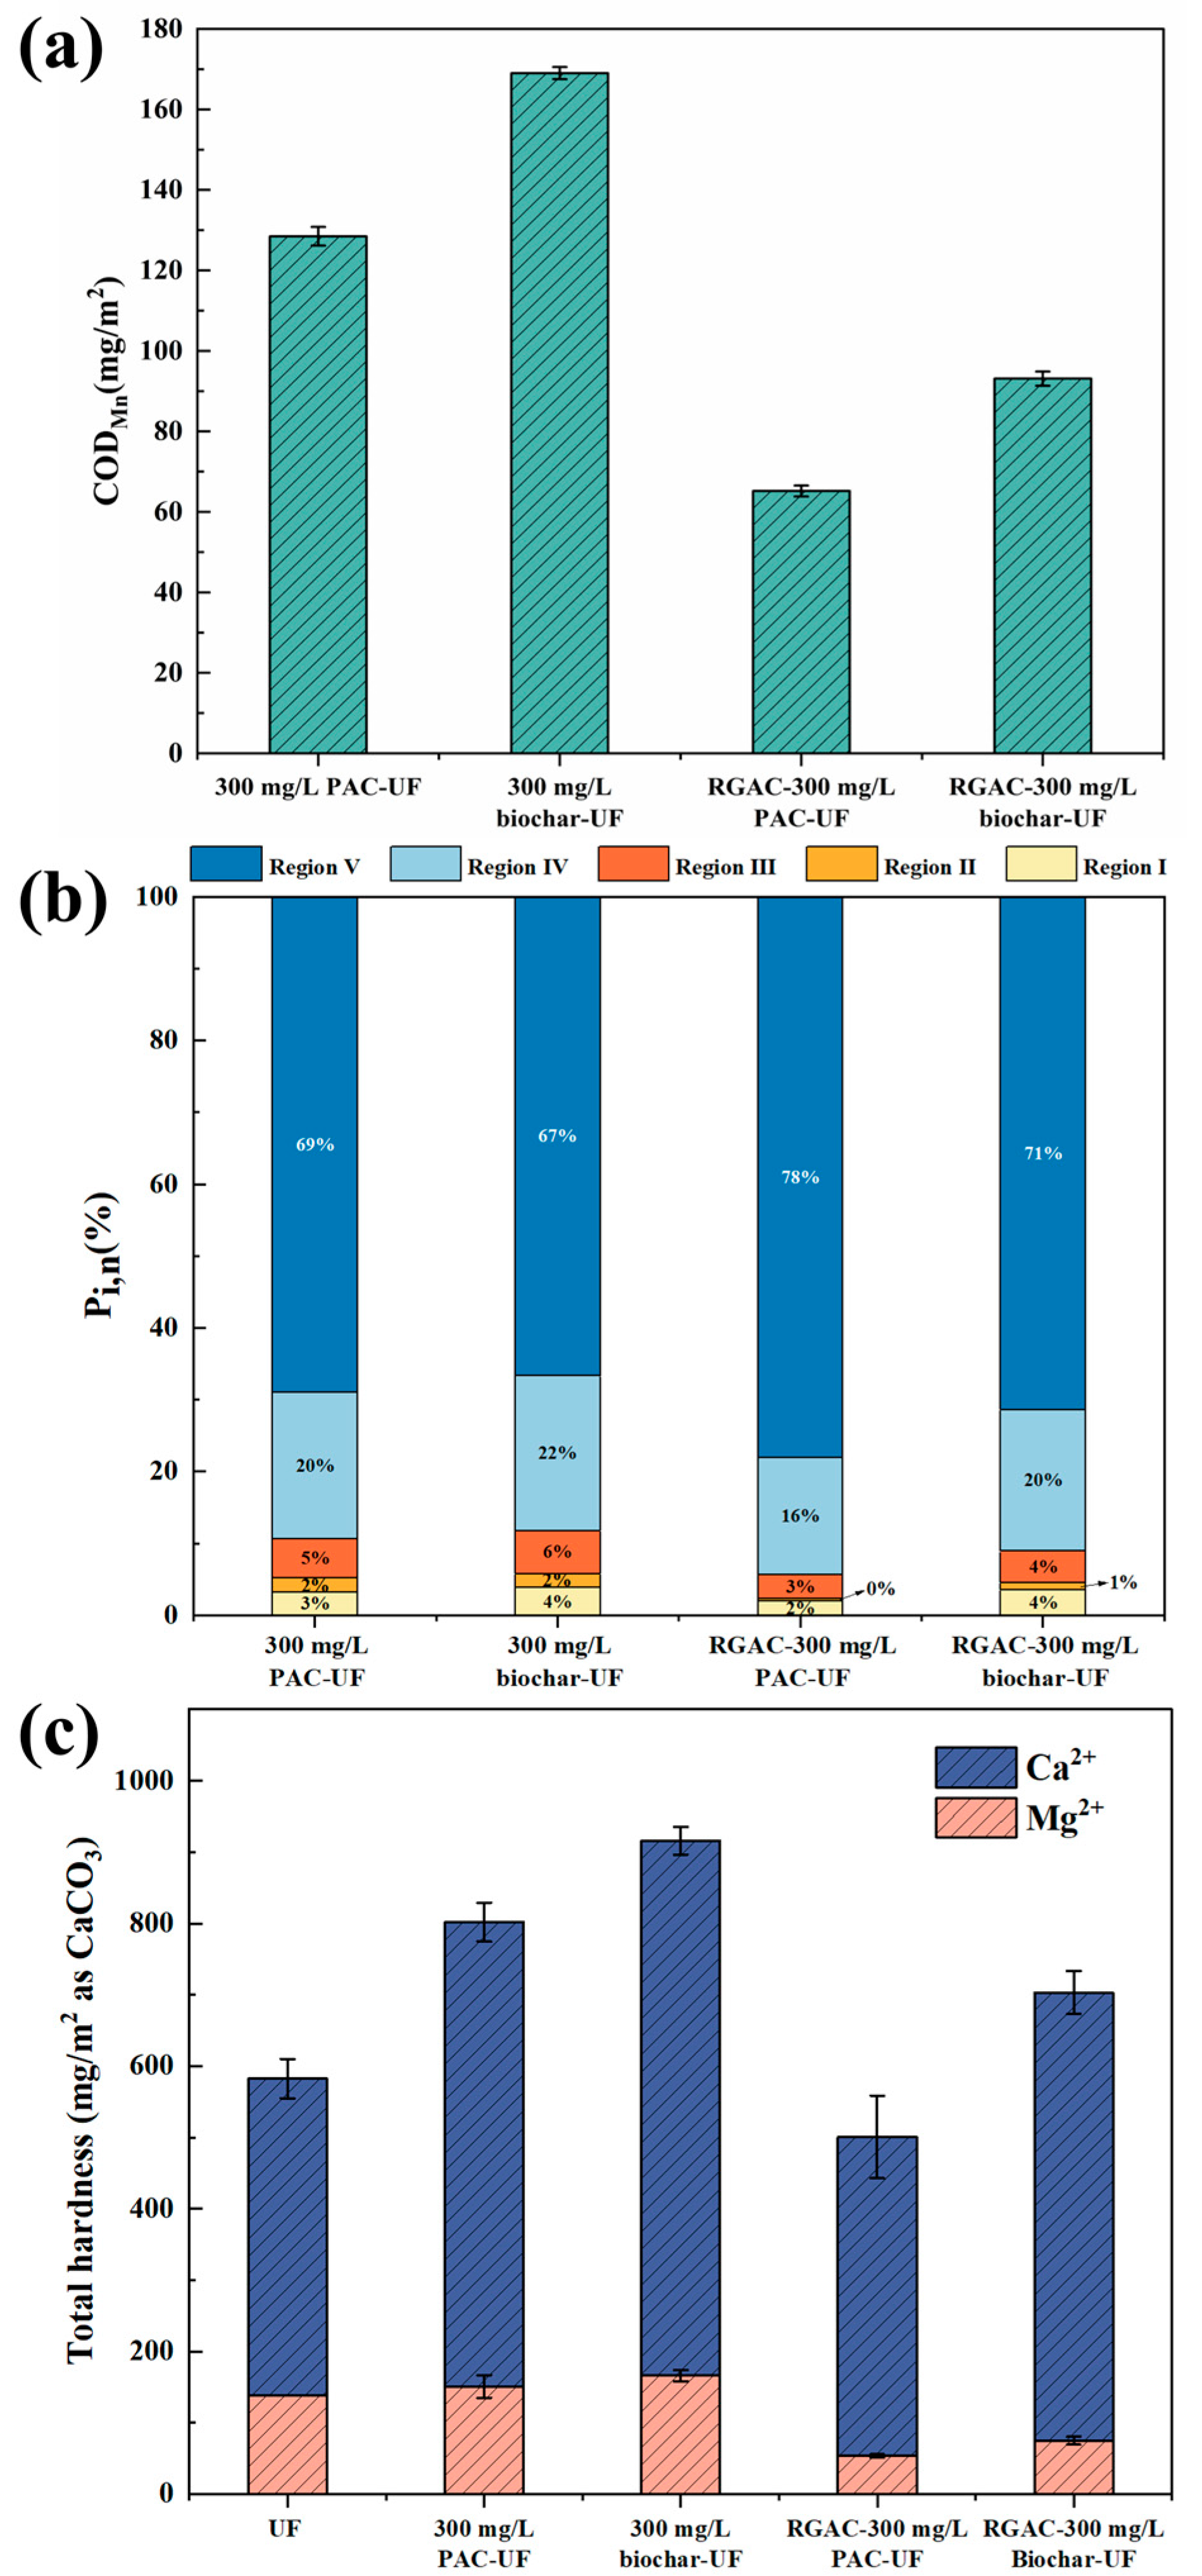
3.3. Componential Analysis of Membrane Foulants

As illustrated above, although the amount of biochar deposited on membrane surface was less than PAC without fluidized RGAC (Figure 4), the overall membrane fouling formation in the biochar-UF system was much severer than PAC-UF system (Figure 2 and Figure 3). This indicated that the increase in TMP observed in the biochar-UF systems was not primarily due to the attachment of biochar but was likely related to other types of membrane foulants.
Figure 5a illustrates the amount of CODMn from membrane foulants after the removal of attached PAC/biochar. As expected, the amount of foulants in the biochar-UF system was significantly higher than that in the PAC-UF system. This supported the idea that the fouling associated with biochar was primarily caused by contaminants found in surface water rather than by the biochar attachment. Furthermore, when fluidized RGAC was introduced, the CODMn values in both the PAC-UF and biochar-UF systems decreased significantly with reductions of 49.25% and 44.91%, respectively. This demonstrated the effectiveness of RGAC in reducing foulant deposition.
Based on EEM spectra, fluorescence regional integration (FRI) was used to give an analysis of the ratios of five types of fluorescent foulants that adhered to the membrane. Regions I and II represent simple aromatic protein-like substances. Regions III, IV, and V represent fulvic acid-like substances, soluble microbial by-product-like substances, and humic acid-like substances, respectively. Figure 5b showed that the proportions of Regions IV and V accounted for over 80% of total fluorescent organics. Therefore, the prevalent membrane foulant belonged to humic acid-like substances and soluble microbial by-products. In Figure 5b, the proportion of humic acid-like substances in Region V of the biochar-UF system was 67%, in contrast to 69% found for the PAC-UF system. However, the actual fluorescence intensities of Region V measured for the PAC-UF system and the biochar-UF system were 7,905,117 and 8,366,014, respectively, indicating the amount of humic acid-like substances found on the fouling layer was higher when biochar was utilized. As suggested from literature, biochar could release low amounts of humic acid-like substances [28], which might have a certain contribution to the fouling formation. It seemed that after coupling with RGAC, the proportions of protein-like contaminants (Regions I and II) on membrane for both PAC/biochar-UF systems decreased, and the decline trend for the PAC-UF system was more obvious than that of the biochar-UF system.
Inorganic ions of surface water played an important role in affecting water quality and the formation of membrane fouling. Figure 5c exhibited that more Ca2+ adhered to the membrane than Mg2+, which might be due to the stronger binding ability of Ca2+ with membrane foulants. Biochar seemed to induce more ions attaching to the membrane surface than PAC. However, after coupling with the fluidized RGAC particles, the contents of both Ca2+ and Mg2+ on the membrane were significantly reduced. Previous studies reported that the crosslinking of Ca2+ with humic acids caused severe membrane fouling, which could promote the massive adherence of Ca2+ to the membrane surface [29,30,31]. According to Figure 5b, humic acid-like substances accounted for 67–78% of membrane foulants, which potentially combined with more Ca2+. Additionally, the Ca2+ level in the PAC-UF system was relatively lower than that in the biochar-UF system (Figure 5c), probably because 78% of humic acid-like substances appeared in the RGAC-PAC-UF system in contrast to 71% found in the RGAC-biochar-UF system (Figure 5b).

3.4. Water Quality Analysis

In order to explore the influences of PAC and biochar as well as fluidized RGAC particles on water treatment, the effluent water quality from the above systems was analyzed. Figure 6a showed that the COD removal rate of single UF was merely 24.37%, while the PAC-UF system and biochar-UF system achieved strikingly higher removal rates of 74.28% and 64.43%, respectively, implying the effectiveness of PAC and biochar to improve effluent quality. However, the capability of biochar to remove pollutants was slightly weaker than PAC in terms of COD removal. It should be noteworthy that there is a relationship between pollutant removal and the formation of membrane fouling. Specifically, the reduced effectiveness of biochar in removing contaminants might result in a greater accumulation of contaminants on the membrane surface for the biochar-UF system, as illustrated in Figure 5a. Meanwhile, coupling with fluidized RGAC particles did not exhibit significant impacts on the COD removal.
Figure 6b showed the FRI analysis results for the feed water and various effluents. The ratios of humic acid-like substances (Region V) in the effluents of PAC-UF, biochar-UF, RGAC-PAC-UF, and RGAC-biochar-UF were 49%, 81%, 57%, and 75%, respectively. The protein-like substances (Regions I and II) accounted for 16%, 5%, 15%, and 5%, respectively. The previous study showed that biochar could release low amounts of humic acid-like substances into the water [28], which was also a possible reason for the high proportion of humic acid-like substances present in effluent. The ratios of different regions in Figure 6b showed that biochar could remove more protein-like pollutants than PAC, while PAC eliminated more humic acid-like contaminants.
Moreover, the coupled RGAC particles did not significantly affect the water treatment performance.
With regard to the hardness of the effluent, it was noteworthy that Ca2+ could not be detected in all of the effluents, which might be explained by the presence of a high amount of Ca2+ on the membrane surface (Figure 5c), resulting in the negligible Ca2+ passing through the UF membrane. As shown in Figure 5c, the Ca2+ content on membrane surface was measured as 444.8–749.9 mg/m2, which might be the reason causing negligible Ca2+ detected in the effluent. Figure 6c demonstrated that the total hardness of the effluent in the biochar-UF system was lower than that of the PAC-UF system, which might be due to the higher ion retention on the membrane in the biochar-UF system shown in Figure 5c. After coupling with RGAC particles, the value of effluent hardness in the PAC-UF system decreased from 24.67 mg/L to 17.97 mg/L. The value of total hardness in the biochar-UF system coupled with RGAC particles declined from 15.7 mg/L to 14.97 mg/L, which showed fluidized RGAC contributed to the removal of hardness.

3.5. Performance Comparison of Different-Sized Biochar in the Integrated Water Treatment System

The mean particle size of purchased biochar used in the above experiments was 70 μm, which was more than five times larger than that of PAC (13.46 μm). The distinct sizes between PAC and biochar might affect the water treatment performance and fouling tendency of the integrated water treatment system. Therefore, we ground the purchased biochar to a smaller average size of 15.72 μm that was similar to the average size of PAC and conducted a set of experiments to compare the performances of ground biochar (g-biochar) and the original purchased biochar (p-biochar) in the integrated system.
Figure 7a showed that after grinding biochar into smaller pieces, the degree of membrane fouling was slightly alleviated. Figure 7b showed that the cake layer formation was the main reason that aggravated membrane fouling. The cake layer resistance of the g-biochar-UF system was lower than that of the p-biochar-UF system. As exhibited in Figure 7c, the COD removal rate of the g-biochar-UF system was lower than that of the p-biochar system. In the meantime, the total hardness of effluent present in the g-biochar-UF system was higher than that of the p-biochar-UF system (Figure 7d), indicative of insufficient hardness removal for g-biochar. Overall, the usage of biochar with a smaller size had better capability to remove aqueous contaminants and slightly alleviated membrane fouling formation. However, in comparison to the p-biochar UF system, the g-biochar UF system slightly decreased membrane fouling formation but demonstrated non-ideal removal for COD and hardness. It meant that the reduction in biochar size did not significantly optimize the water treatment process. Therefore, the initial p-biochar before grinding should be directly coupled with UF and RGAC. Since biochar materials are relatively more environmentally friendly and inexpensive, the option of using biochar to replace PAC in this process should be feasible.

4. Conclusions

In this study, the PAC/biochar and fluidized GAC particles were simultaneously coupled with UF, establishing the innovative GAC-PAC/biochar-UF water treatment processes for improving the water quality and membrane fouling control effectiveness. The main conclusions could be drawn as follows:
(i) In the GAC-PAC/biochar-UF systems, the fluidized GAC particles were effective in minimizing the accumulation of both PAC/biochar and foulants on the membrane surface. This reduction was primarily due to mechanical scraping, which significantly decreased the formation of the cake layer.
(ii) A maximum of 46.01% of fouling mitigation was achieved when fluidized GAC particles were integrated. The coupled GAC particles did not significantly affect the effluent water quality.
(iii) PAC is more easily adhered to the membrane surface than biochar. Coupling with fluidized RGAC particles could effectively alleviate both PAC and biochar adhesions, which were decreased by 96.11% and 72.23%, respectively.
(iv) Biochar-associated fouling was mainly caused by the attachment of organic contaminants rather than biochar deposition on membrane.
(v) The integrated GAC-PAC/biochar systems effectively improved water quality and mitigated membrane fouling formation, which should be a promising technology for practical implications.

Author Contributions

Investigation, validation, formal analysis, Y.W. and S.Y.; writing—original draft preparation, Y.W. and W.C.; methodology, data curation, visualization, Y.W., S.Y. and W.C.; conceptualization, resources, supervision, project administration, funding acquisition, writing—review and editing, W.C. All authors have read and agreed to the published version of the manuscript.

Funding

National Key Research and Development Program of China (2021YFC2102203).

Data Availability Statement

The data presented in this study are available on request from the corresponding author.

Acknowledgments

The authors acknowledge the National Key Research and Development Program of China (2021YFC2102203) for funding this study. Furthermore, we are very grateful to the Micro–nano Center of Beijing Institute of Technology, Beijing, China, as well as the Analysis and Testing Center of Beijing Institute of Technology, Beijing, China, for their support in completing this study.

Conflicts of Interest

The authors declare no conflict of interest.

References

  1. Shi, Y.; Zhang, Z.; Zhang, M.; Ding, G.; Zhao, B.; Wang, L.; Zhang, H. Biological membrane fouling control with the integrated and separated processes of MIEX and UF. Sep. Purif. Technol. 2021, 259, 118151. [Google Scholar] [CrossRef]
  2. Moslehyani, A.; Ismail, A.F.; Matsuura, T.; Rahman, M.A.; Goh, P.S. Chapter 3—Recent Progresses of Ultrafiltration (UF) Membranes and Processes in Water Treatment. In Membrane Separation Principles and Applications; Ismail, A.F., Rahman, M.A., Othman, M.H.D., Matsuura, T., Eds.; Elsevier: Amsterdam, The Netherlands, 2019; pp. 85–110. [Google Scholar]
  3. Chang, H.; Liang, H.; Qu, F.; Liu, B.; Yu, H.; Du, X.; Li, G.; Snyder, S.A. Hydraulic backwashing for low-pressure membranes in drinking water treatment: A review. J. Membr. Sci. 2017, 540, 362–380. [Google Scholar] [CrossRef]
  4. Khanzada, N.K.; Farid, M.U.; Kharraz, J.A.; Choi, J.; Tang, C.Y.; Nghiem, L.D.; Jang, A.; An, A.K. Removal of organic micropollutants using advanced membrane-based water and wastewater treatment: A review. J. Membr. Sci. 2020, 598, 117672. [Google Scholar] [CrossRef]
  5. Zhang, Z.; Wu, J.; Shao, L.; Wang, L.; Yang, X.; Zhao, B.; Li, J.; Ma, C.; Chu, X.; Zhang, P. Comparison between integrated MIEX/UF and PAC/UF in long-term irreversible membrane fouling reduction: Effectiveness and mechanism analysis. Process Saf. Environ. Prot. 2022, 168, 1179–1187. [Google Scholar] [CrossRef]
  6. Mozia, S.; Tomaszewska, M. Treatment of surface water using hybrid processes—Adsorption on PAC and ultrafiltration. Desalination 2004, 162, 23–31. [Google Scholar] [CrossRef]
  7. Liu, Y.; Li, X.; Yang, Y.; Liang, S. Fouling control of PAC/UF process for treating algal-rich water. Desalination 2015, 355, 75–82. [Google Scholar] [CrossRef]
  8. Ivančev-Tumbas, I.; Hoffmann, G.; Hobby, R.; Kerkez, Đ.; Tubić, A.; Babić-Nanić, S.; Panglisch, S. Removal of diclofenac from water by in/out PAC/UF hybrid process. Environ. Technol. 2018, 39, 2315–2320. [Google Scholar] [CrossRef]
  9. Löwenberg, J.; Zenker, A.; Baggenstos, M.; Koch, G.; Kazner, C.; Wintgens, T. Comparison of two PAC/UF processes for the removal of micropollutants from wastewater treatment plant effluent: Process performance and removal efficiency. Water Res. 2014, 56, 26–36. [Google Scholar] [CrossRef]
  10. Campinas, M.; Rosa, M.J. Assessing PAC contribution to the NOM fouling control in PAC/UF systems. Water Res. 2010, 44, 1636–1644. [Google Scholar] [CrossRef]
  11. Tomaszewska, M.; Mozia, S. Removal of organic matter from water by PAC/UF system. Water Res. 2002, 36, 4137–4143. [Google Scholar] [CrossRef]
  12. Shao, S.; Cai, L.; Li, K.; Li, J.; Du, X.; Li, G.; Liang, H. Deposition of powdered activated carbon (PAC) on ultrafiltration (UF) membrane surface: Influencing factors and mechanisms. J. Membr. Sci. 2017, 530, 104–111. [Google Scholar] [CrossRef]
  13. Tanudjaja, H.J.; Anantharaman, A.; Ng, A.Q.Q.; Ma, Y.; Tanis-Kanbur, M.B.; Zydney, A.L.; Chew, J.W. A review of membrane fouling by proteins in ultrafiltration and microfiltration. J. Water Process Eng. 2022, 50, 103294. [Google Scholar] [CrossRef]
  14. Oh, H.; Yu, M.; Takizawa, S.; Ohgaki, S. Evaluation of PAC behavior and fouling formation in an integrated PAC–UF membrane for surface water treatment. Desalination 2006, 192, 54–62. [Google Scholar] [CrossRef]
  15. Li, Q.; Snoeyink, V.L.; Mariñas, B.J.; Campos, C. Pore blockage effect of NOM on atrazine adsorption kinetics of PAC: The roles of PAC pore size distribution and NOM molecular weight. Water Res. 2003, 37, 4863–4872. [Google Scholar] [CrossRef] [PubMed]
  16. Gao, Z.; Zhao, Z.-P.; Cai, W. Chemically induced alteration in PAC characteristics and its influences on PAC/UF water treatment: Implications for on-line membrane cleaning with NaClO. Sep. Purif. Technol. 2022, 294, 121130. [Google Scholar] [CrossRef]
  17. Zhang, J.; Yu, S.; Wang, J.; Zhao, Z.-P.; Cai, W. Advanced water treatment process by simultaneous coupling granular activated carbon (GAC) and powdered carbon with ultrafiltration: Role of GAC particle shape and powdered carbon type. Water Res. 2023, 231, 119606. [Google Scholar] [CrossRef]
  18. Yu, S.; Wang, J.; Zhao, Z.; Cai, W. Simultaneous coupling of fluidized granular activated carbon (GAC) and powdered activated carbon (PAC) with ultrafiltration process: A promising synergistic alternative for water treatment. Sep. Purif. Technol. 2022, 282, 120085. [Google Scholar] [CrossRef]
  19. Wu, B.; Zamani, F.; Lim, W.; Liao, D.; Wang, Y.; Liu, Y.; Chew, J.W.; Fane, A.G. Effect of mechanical scouring by granular activated carbon (GAC) on membrane fouling mitigation. Desalination 2017, 403, 80–87. [Google Scholar] [CrossRef]
  20. Ahmad, M.; Rajapaksha, A.U.; Lim, J.E.; Zhang, M.; Bolan, N.; Mohan, D.; Vithanage, M.; Lee, S.S.; Ok, Y.S. Biochar as a sorbent for contaminant management in soil and water: A review. Chemosphere 2014, 99, 19–33. [Google Scholar] [CrossRef]
  21. Wang, X.; Guo, Z.; Hu, Z.; Zhang, J. Recent advances in biochar application for water and wastewater treatment: A review. PeerJ 2020, 8, e9164. [Google Scholar] [CrossRef]
  22. Shankar, V.; Heo, J.; Al-Hamadani, Y.A.J.; Park, C.M.; Chu, K.H.; Yoon, Y. Evaluation of biochar-ultrafiltration membrane processes for humic acid removal under various hydrodynamic, pH, ionic strength, and pressure conditions. J. Environ. Manag. 2017, 197, 610–618. [Google Scholar] [CrossRef] [PubMed]
  23. Jung, C.; Boateng, L.K.; Flora, J.R.V.; Oh, J.; Braswell, M.C.; Son, A.; Yoon, Y. Competitive adsorption of selected non-steroidal anti-inflammatory drugs on activated biochars: Experimental and molecular modeling study. Chem. Eng. J. 2015, 264, 1–9. [Google Scholar] [CrossRef]
  24. Cheng, X.; Liang, H.; Ding, A.; Qu, F.; Shao, S.; Liu, B.; Wang, H.; Wu, D.; Li, G. Effects of pre-ozonation on the ultrafiltration of different natural organic matter (NOM) fractions: Membrane fouling mitigation, prediction and mechanism. J. Membr. Sci. 2016, 505, 15–25. [Google Scholar] [CrossRef]
  25. Cai, W.; Liu, J.; Zhang, X.; Ng, W.J.; Liu, Y. Generation of dissolved organic matter and byproducts from activated sludge during contact with sodium hypochlorite and its implications to on-line chemical cleaning in MBR. Water Res. 2016, 104, 44–52. [Google Scholar] [CrossRef] [PubMed]
  26. Rice, E.W.; Baird, R.B.; Eaton, A.D.; American Public Health Association. Standard Methods for the Examination of Water and Wastewater; American Public Health Association: Washington, DC, USA, 2012; Volume 10. [Google Scholar]
  27. Jiang, Y.; Liu, Y.; Shi, D.; Fu, W.; Sun, P.-F.; Li, J.; Shao, S. Membrane fouling in a powdered activated carbon—Membrane bioreactor (PAC-MBR) for micro-polluted water purification: Fouling characteristics and the roles of PAC. J. Clean. Prod. 2020, 277, 122341. [Google Scholar] [CrossRef]
  28. Zhang, J.N.; Lü, F.; Luo, C.H.; Shao, L.M.; He, P.J. Humification characterization of biochar and its potential as a composting amendment. J. Environ. Sci. 2014, 26, 390–397. [Google Scholar] [CrossRef]
  29. Tang, C.Y.; Chong, T.H.; Fane, A.G. Colloidal interactions and fouling of NF and RO membranes: A review. Adv. Colloid Interface Sci. 2011, 164, 126–143. [Google Scholar] [CrossRef]
  30. Seidel, A.; Elimelech, M. Coupling between chemical and physical interactions in natural organic matter (NOM) fouling of nanofiltration membranes: Implications for fouling control. J. Membr. Sci. 2002, 203, 245–255. [Google Scholar] [CrossRef]
  31. Ahn, W.-Y.; Kalinichev, A.G.; Clark, M.M. Effects of background cations on the fouling of polyethersulfone membranes by natural organic matter: Experimental and molecular modeling study. J. Membr. Sci. 2008, 309, 128–140. [Google Scholar] [CrossRef]
Figure 1. The lab-scale experimental setup.
Separations 11 00312 g001
Figure 2. TMP development files of PAC-UF and biochar-UF systems in the presence and absence of fluidized RGAC particles during 300 min operation.
Separations 11 00312 g002
Figure 3. The membrane fouling resistances of PAC-UF and biochar-UF systems in the presence and absence of fluidized RGAC particles after 300 min operation.
Separations 11 00312 g003
Figure 4. Amount of PAC/biochar deposited on membrane surface for PAC-UF and biochar-UF systems in the presence and absence of fluidized RGAC particles after 300 min operation.
Separations 11 00312 g004
Figure 5. Componential analysis of membrane foulants after 300 min operation: (a) CODMn amount, (b) FRI distribution, and (c) Ca2+ and Mg2+ contents of UF, PAC-UF, and biochar-UF systems in the presence and absence of fluidized RGAC particles.
Separations 11 00312 g005
Figure 6. Effluent quality parameters about (a) COD removal rate after filtrations; (b) FRI distribution; and (c) total hardness of UF, PAC-UF, and biochar-UF systems in the presence and absence of fluidized RGAC particles after 300 min operation.
Separations 11 00312 g006
Figure 7. The comparative experimental results between p-biochar and g-biochar: Fouling tendency in terms of (a) TMP files (TMP0 data were the initial TMP before filtration) and (b) membrane fouling resistances. Effluent quality parameters in terms of (c) COD removal rate and (d) total hardness.
Separations 11 00312 g007
Disclaimer/Publisher’s Note: The statements, opinions and data contained in all publications are solely those of the individual author(s) and contributor(s) and not of MDPI and/or the editor(s). MDPI and/or the editor(s) disclaim responsibility for any injury to people or property resulting from any ideas, methods, instructions or products referred to in the content.

