Article

Effect of Fly Ash on the Mass Transfer Performance of CO2 Removal Using MEA and DEA Solutions in a Packed Tower

1
School of Intelligent Manufacturing and Information Engineering, Shaanxi Energy Institute, Xianyang 712000, China
2
Shaanxi Investment Group Co., Ltd., Xi’an 710061, China
3
School of Energy and Environment, Southeast University, Nanjing 210096, China
4
College of Electrical, Energy and Power Engineering, Yangzhou University, Yangzhou 225127, China
*
Author to whom correspondence should be addressed.
Separations 2024, 11(1), 20; https://doi.org/10.3390/separations11010020
Submission received: 28 November 2023 / Revised: 29 December 2023 / Accepted: 3 January 2024 / Published: 5 January 2024
(This article belongs to the Section Purification Technology)

Abstract

:
The accumulation of uncollected fly ash from flue gas in post-combustion CO2 capture processes is a significant concern in current coal-fired power plants due to its potential impact on the performance of CO2 absorbent and absorption towers. In order to determine the effect of fly ash on the mass transfer performance of CO2 absorption into monoethanolamine (MEA) and diethanolamine (DEA) aqueous solutions, experimental studies were carried out using a small-sized packed tower equipped with θ-ring random packing. These studies were conducted under various operating parameters, including solution temperature, liquid/gas ratio (L/G), packing height, and fly ash concentration. The results show that the effect of fly ash on the outlet CO2 concentration was primarily observed during the initial stages of the experimental process. Moreover, the presence of fly ash leads to a reduction in the volumetric overall mass transfer coefficient (KGav) when using MEA and DEA solution, and increasing the fly ash concentration further exacerbates this negative impact. However, the effect of fly ash on the reduction in KGav is not significantly related to its chemical composition but rather depends on the operational parameters. With increasing solution temperature, liquid/gas ratio (L/G), and packing height, the KGav values for different solutions exhibit an upward trend. The negative effect of fly ash on KGav remains relatively stable for MEA as solution temperature and packing height increase. Compared to MEA, fly ash has a greater negative effect on DEA solution under the same experimental conditions. The analysis reveals that the detrimental effect of fly ash on KGav primarily stems from its ability to alter the distribution state of the absorption liquid within the packed tower.

1. Introduction

Undoubtedly, global warming has become a real problem we face today. The combustion of fossil fuels, which results in the release of CO2, serves as the primary source of greenhouse gases [1]. Global energy related to CO2 emissions reached a new high of over 36.8 Gt in 2022 [2]. In order to effectively control and reduce CO2 emissions, numerous solutions have been proposed, such as enhancing energy efficiency, advancing energy technologies, implementing CO2 capture and utilization, and developing new sustainable energy solutions [3,4,5]. China’s energy structure is expected to continue to be dominated by coal for a significant period of time in the future. In 2020, China’s CO2 emissions were 9.899 billion tons, with coal-fired power contributing to approximately half of this total [6]. Therefore, it is necessary to control CO2 emissions from coal-fired power plants in order to achieve the goals of “carbon peaking and carbon neutrality” effectively. The chemical absorption method has been a hot spot of research in CO2 capture due to its simplicity and cost-effectiveness. Among the various absorbents, amine solutions such as MEA and DEA are widely used and considered the most common and popular choices for CO2 absorption [7,8,9]. Extensive research has been conducted on the kinetics of the absorption and desorption of CO2 to evaluate the capture performance of amine-based absorbents [10,11]. Heidaryan E et al. [1] carried out experimental research to investigate the performance of carbon dioxide absorption in alkanolamine systems in an oscillatory baffled reactor. Aghel B et al. [12,13,14] investigated the process of CO2 desorption from aqueous solutions of MEA and DEA in a microchannel reactor.
Coal-fired flue gas has a complex composition and contains certain amounts of impurities such as SO2, O2, water vapor, and fly ash. Several researchers have conducted investigations on the effects of SO2 and O2 on the degradation of amine solvents used in CO2 capture [11,15,16,17,18]. Liu et al. [11] studied the effect of SO2 on CO2 absorption using an amine solution experimentally and theoretically. Results showed that the overall CO2 mass transfer coefficient decreased under exposure to SO2. Despite the high efficiency of the currently used dust equipment, there is no guarantee that the uncollected fly ash will not be carried over into the downstream CO2 capture system. Additionally, there is a possibility of generating new desulfurization agent particles during the flue gas desulfurization process [19,20]. As a result, the flue gas entering the CO2 removal tower and the absorbent solution (due to recycling) will contain a certain number of particles, which can potentially impact the performance of the CO2 absorbent. Chen et al. [19] found that fly ash in flue gas can change the hydrodynamic performance, such as the flooding point, liquid holdup, and pressure drop of CO2 absorption using K2CO3 solution and MEA solution in a packed tower. Silva et al. [21] studied the effect of fly ash on MEA oxidative degradation, and the results showed that, compared to MEA alone, the stability of MEA was lower in the presence of fly ash under oxidative conditions. Huang et al. [22] investigated the influence of flue gas contaminants on the thermal degradation of MEA solvent, and the results revealed that the presence of fly ash significantly increased the activation energy for MEA degradation. During the shutdown and maintenance of a power plant, it was discovered that a significant accumulation of solid particles had deposited in the pipeline at the bottom of the CO2 absorption tower. These deposits accelerated the degradation of amine absorbents and increased the corrosion rate of the absorption equipment, particularly under the high temperature and oxygen conditions within the system [23].
Currently, the packed tower is the preferred reactor for CO2 capture in coal-fired power plants due to its advantages of low pressure, small liquid holdup, and high production capacity [24,25]. Lydonrochelle’s research showed that CO2 absorption in packed towers can be considered a typical gas–liquid reaction and mass transfer problem [26]. However, the presence of solid particles carried by the flue gas can potentially lead to blockage of the packing material in the tower. This blockage can have adverse effects on the wetting degree and film formation rate of the packing surface, ultimately impacting the mass transfer performance of the CO2 absorbent. So far, there is a lack of reports on the specific impact of fly ash on the mass transfer performance of CO2 removal using MEA and DEA within packed towers. Therefore, an experimental study was conducted to investigate the effect of fly ash on KGav of CO2 absorption using MEA and DEA in a θ-ring packed tower. The relationship between the KGav and the main process conditions was also studied.

2. Experimental Section

2.1. Experimental Setup

The experimental setup utilized in this study primarily comprises three components: a simulated flue gas system, a CO2 reaction system, and an analysis system (see Figure 1 for details). The reaction system consists of a small-sized packed tower (inside diameter, 3.5 cm; height, 130 cm) that is filled with 3 mm × 3 mm stainless steel θ-ring packing. The packing material was loaded into the tower by opening the top cover of the packed tower. The packing specifications are given in Table 1. The simulated gas used in the experiments is a mixture of N2 and CO2, which are supplied by steel cylinders. The concentration of CO2 in the flue gas emitted via coal-fired power plants is approximately 14% (volume fraction). Therefore, a fixed parameter of 14% CO2 concentration is used in the experiments. Two glass rotor flowmeters are used to measure and regulate the flow rate of N2 and CO2 gases. N2 and CO2 gases are fully mixed in a blending tank to create the simulated gas required for the experiments. The concentration of CO2 at the outlet and inlet was analyzed using a flue gas analyzer (MRU-VARIO PLUS, Neckarsulm, Germany), which has a minimum resolution of 0.1%.
To simplify the experimental process, fly ash is directly introduced into the liquid phase. Additionally, a higher concentration of fly ash is used to reduce the duration of the experiment. A magnetically heated stirrer is used to heat the solution to the desired temperature and ensure thorough mixing of the solution and fly ash. Meanwhile, in order to achieve uniform distribution of the liquid, a custom-made small liquid distributor is installed at the top of the packing layer. This distributor helps ensure that the liquid is evenly distributed throughout the packing material. The gas–liquid countercurrent processes generate chemical absorption reactions, and the waste liquid produced as a result of these reactions is directed into the waste liquid tank.

2.2. Properties and Principle of Absorbent

Absorbents used in experiments, MEA and DEA, were supplied by Aladdin Chemical Reagents Co., Ltd. (Shanghai, China). These absorbents were of analytical purity. MEA and DEA are widely used as CO2 absorbents in various industrial applications. Both of them are strong organic bases that offer several advantages, such as a fast absorption speed, strong absorption ability, and low levels of CO2 residue. However, MEA and DEA do have some significant differences in terms of viscosity, absorption capacity, and other properties. The comparison data for viscosity, absorption capacity, and reaction constant between MEA and DEA are listed in Table 2.
Due to the complexity of the reaction between CO2 and ethanolamine, there is no accurate and complete chemical equation currently. Generally, the reactions can be roughly divided into two steps. First, CO2 and ethanolamine react to form the zwitterion RR′NH+COO [27], as shown in Equation (1):
R R N H + C O 2 R R N H + C O O
The zwitterion RR’NH+COO further reacts with MEA (DEA) to generate carbamate ion RR’NCOO (rate-controlling step) [28], as shown in Equation (2):
R R N H + C O O + R R N H R R C O O + R R N H 2 +
Equations (1) and (2) combine to form the total equation, as shown in Equation (3):
2 R R N H + C O 2 R R N C O O + R R N H 2 +

2.3. Fly Ash Used in Experiments

The fly ash particles used in experiments were directly collected from the fine ash of the last two stages of the dust collector in a power plant in Yulin city. The pH value of fly ash was measured using the method outlined by the US Environmental Protection Agency (SW-846 Method 9045C), and the measurement result was approximately 13, indicating that it is alkaline ash. The size distribution of fly ash was measured using an LS Particle Size Analyzer, and the median/average particle size was determined to be 5.466/14.25 μm. The chemical composition of fly ash was analyzed using EDXRF, and the results are presented in Table 3.

2.4. Experimental Methods and Processes

Before the start of the experiments, 1000 mL of MEA (DEA) aqueous solution with and without fly ash particles was prepared. To ensure that the influence of fly ash is not weakened because of the rapid absorption of two absorbents, the solution concentrations of MEA and DEA purchased for the experiment were set at 5% (mass fraction, similarly hereinafter). The prepared solutions were heated to the desired temperature using a magnetic stirrer. Subsequently, the flow rate of N2 and CO2 was adjusted in a specific proportion to create a simulated gas. The simulated gas mixture consisted of approximately 86% volume of N2 and 14% volume of CO2. The simulated gas was introduced into the bottom of the packed tower. Simultaneously, a counter-current flow of gas and liquid was established, and the gas–liquid reaction took place after the aqueous solution was dispensed onto the packed column using a peristaltic pump. After the chemical absorption reaction, the reacting gas was dried using a silica gel desiccant. A flue gas analyzer was used to measure the CO2 concentration in the exhaust flow. Following each group of experiments, the reactor interior and “dirty” packing were rinsed before beginning the next group of experiments. Each experimental run was kept for about 30 min. The main parameters of the experimental device are shown in Table 4. To reduce the changes in the packing state caused by cleaning and improve the repeatability of the experiment, a smaller packing with dimensions of 3 mm × 3 mm was selected for the experiment. In addition, the packing state was verified using an ash-free solution under the same conditions each time after refilling the packing, which ensured the errors in the outlet concentration of CO2 were limited to within 0.5%.

2.5. The Establishment of KGav Mathematical Relationship

The differential method is a widely employed approach for determining the overall mass transfer coefficient (KGav) of absorbents in a packed tower. Aroonwilas et al. [29] and Maneeintr et al. [30] successfully employed this method to measure the KGav of CO2 absorbed using AMP and MEA aqueous solutions.
In steady-state, according to the two-film theory and the equation of single-phase mass transfer rate, the overall mass transfer rate equation can be expressed using the gas phase concentration difference as follows [31]:
N A = K G P y A y A *
NA—the mass-flux of component A;
KG—the overall mass transfer coefficient for the gas phase;
P—the total pressure (which is the atmospheric pressure in this paper);
yA—the mole fraction of component A in the gas phase;
y A * —the equilibrium mole fraction of component A in the gas phase.
For a packed tower, the effective gas–liquid interface area per unit volume (av) is regarded as an important parameter in the mass transfer process. When designing packed towers, the mass transfer coefficient per unit volume (KGav) is used to calculate the tower height, as expressed in Equation (5) [32]:
K G a V = ( N A a V [ P ( y A y A * ) ] )
In a packed tower with continuous gas–liquid countercurrent contact, the differential method is used to take the height dz of the microelement at any cross-section, based on material balance principles. Therefore, the mass balance equation can be shown as follows:
N A a V d z = G d y A 1 y A
G—the inert gas molar flow rate;
av—the effective interfacial area per unit volume of packing.
The combination of Equations (5) and (6) infers the final expression of KGav, as shown in Equation (7):
K G a V = G P y A y A * d Y A d z
During the absorption process, which involves chemical reactions, the KGav generally exhibits a continuous variation with the height of the packing. A total of 5 sampling points were established along the base of the packed tower, and a flue gas analyzer was used to measure the fitting curve of CO2 concentration at various heights within the tower. A Y-z diagram was constructed, and the derivative of z was calculated to determine dYA/dz at different levels within the tower. In addition, the gas-phase CO2 concentration, which reaches equilibrium with the liquid-phase CO2 concentration, tends to approach zero during the continuous countercurrent gas–liquid absorption process. This is primarily due to the fast reaction between MEA (or DEA) and CO2. In other words, y A * ≈ 0 [26]. Therefore, y A * is considered to be zero in this paper.

3. Result and Discussion

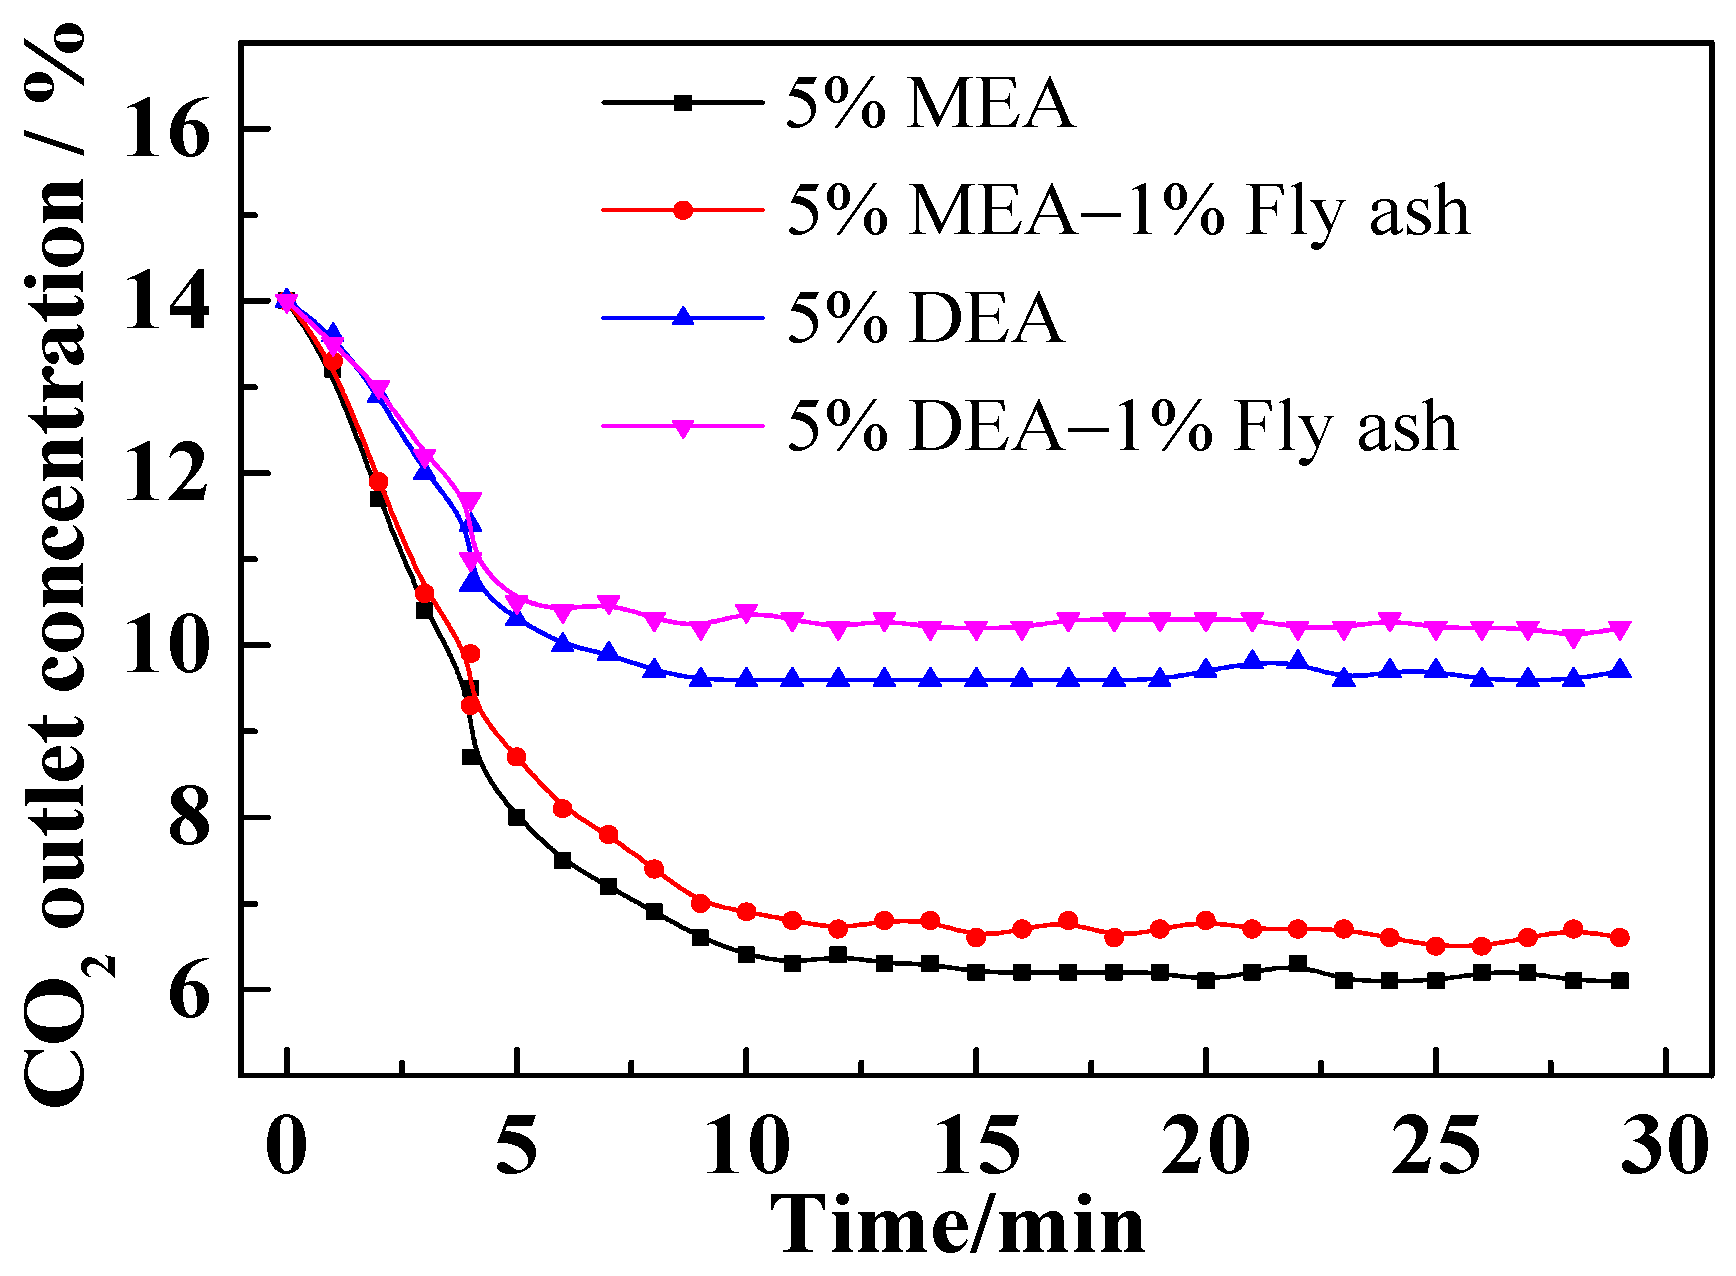
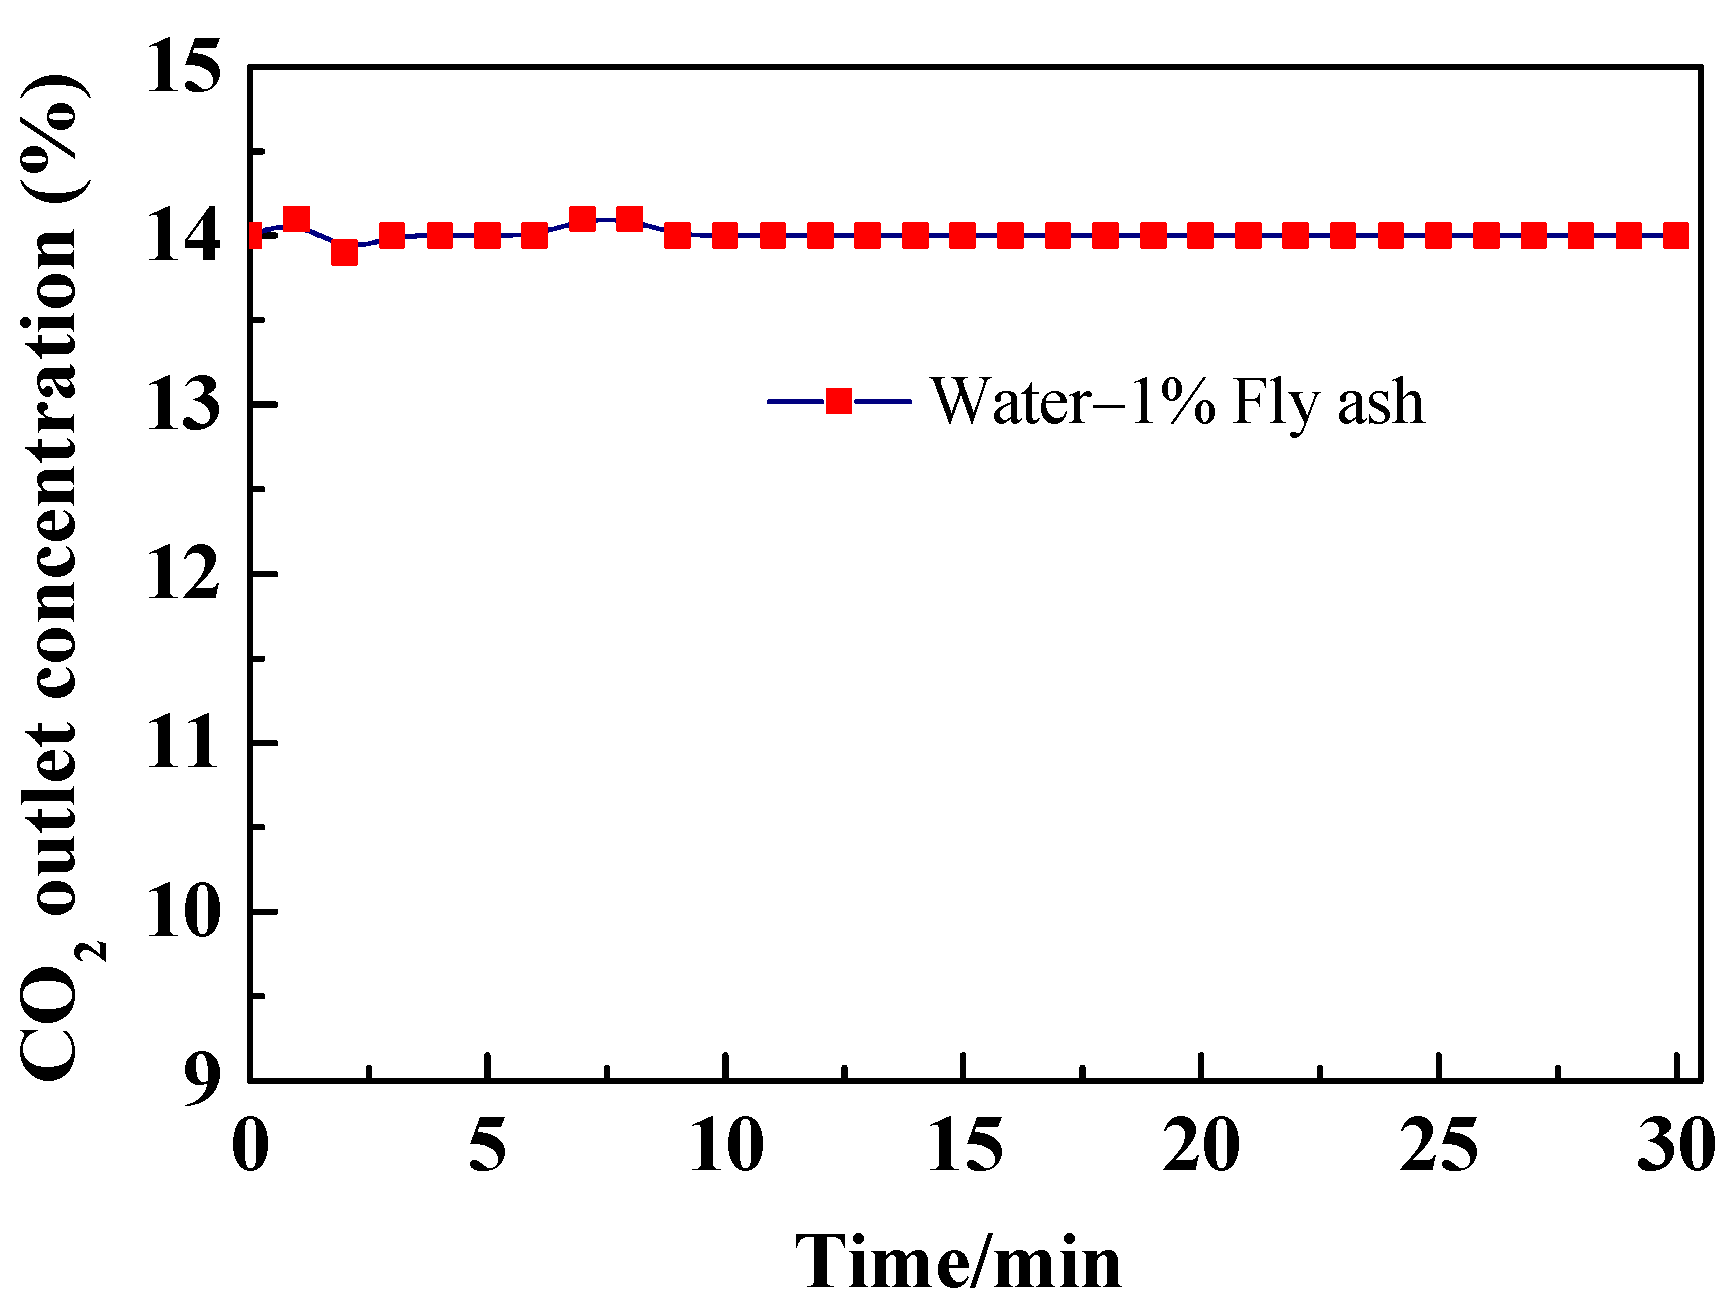
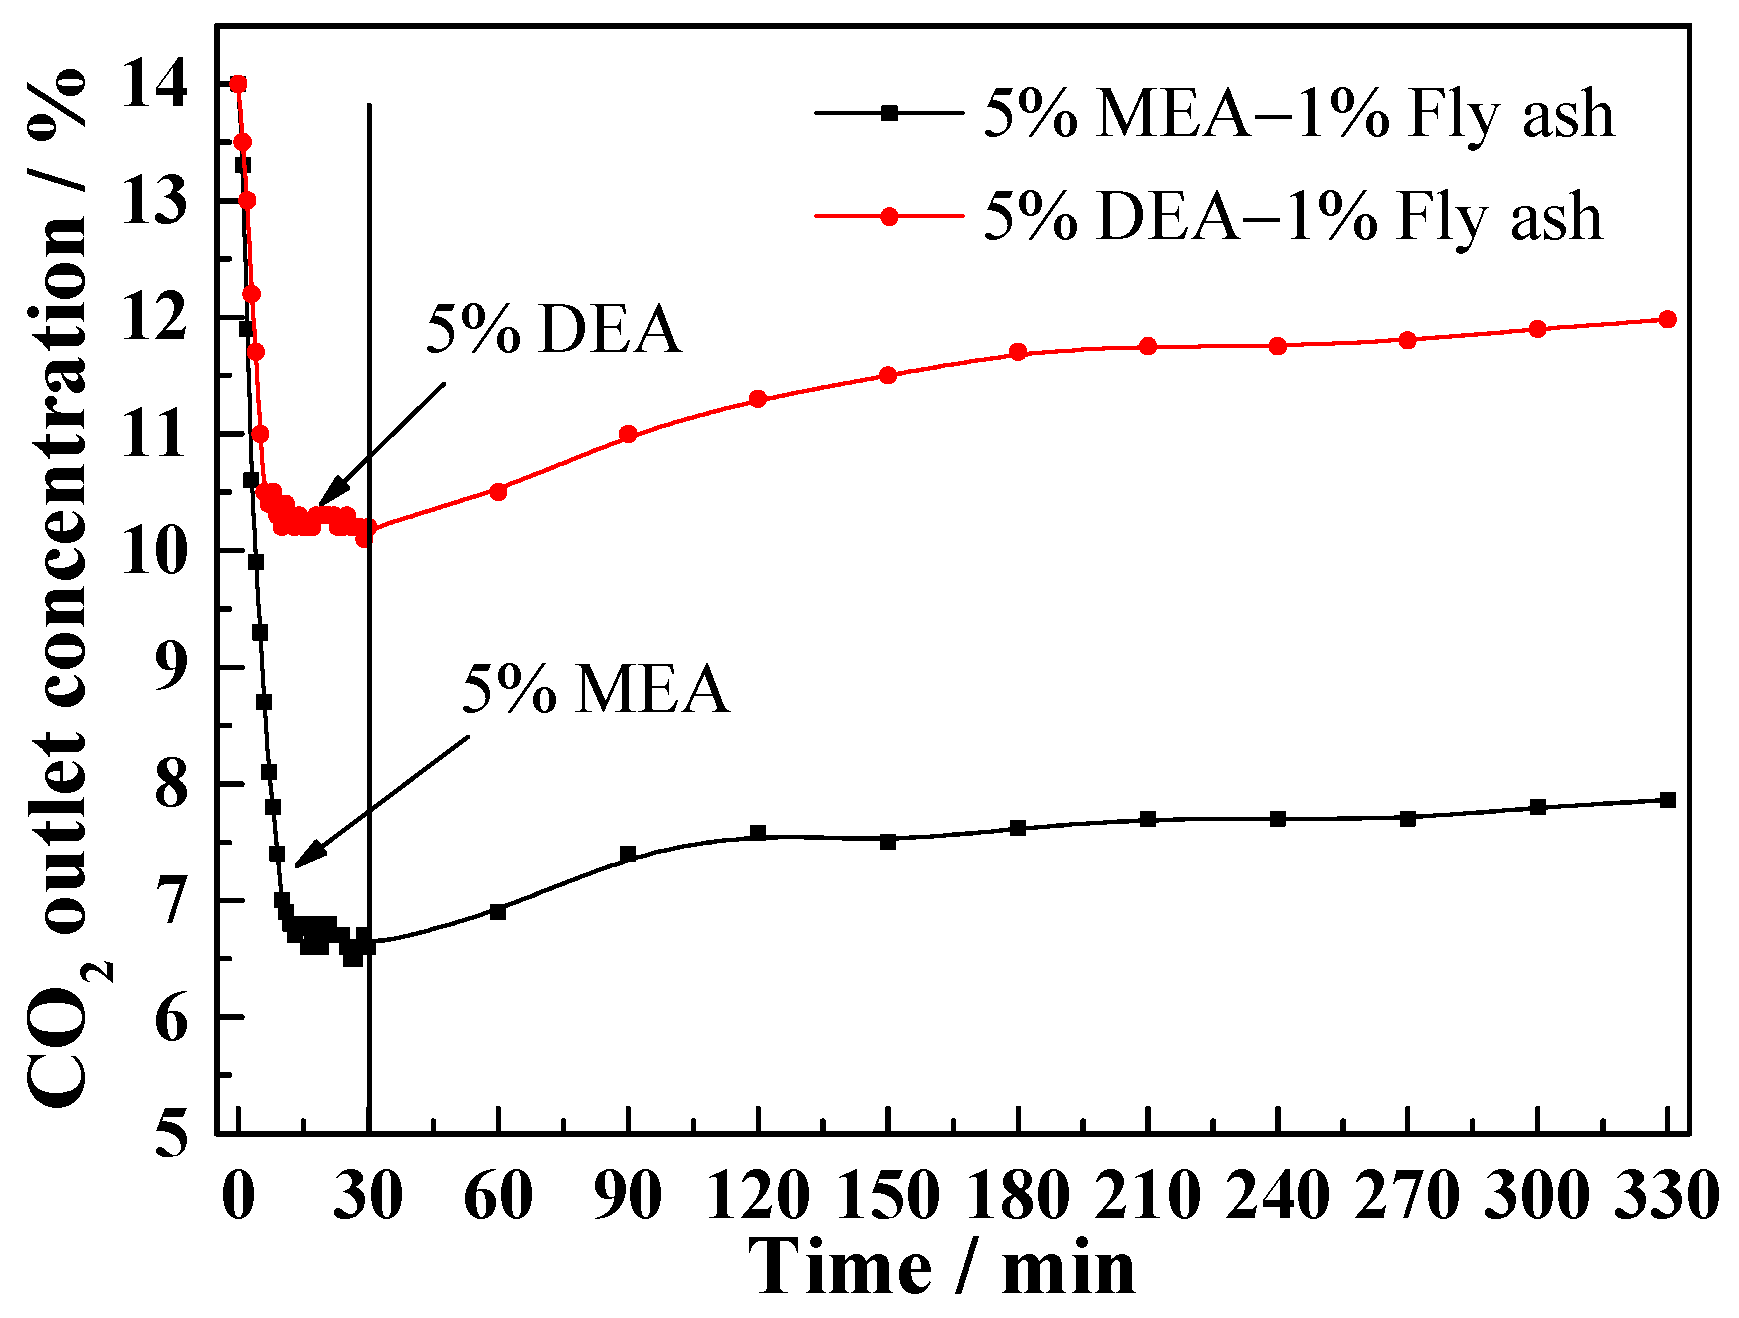
3.1. Effect of Fly Ash on CO2 Outlet Concentration

The variations in CO2 outlet concentration with different solvents are shown in Figure 2. Figure 2 clearly demonstrates that the addition of fly ash to MEA and DEA solutions leads to a significant increase in the outlet concentration of CO2, indicating that the presence of fly ash has a detrimental effect on CO2 absorption.
The pH value of the fly ash used in this study is approximately 13, indicating its alkaline nature. In order to investigate the impact of fly ash properties on CO2 absorption, further experiments on CO2 absorption were conducted using ash water alone, without the presence of any additional absorbents. The ash water used had a fly ash mass concentration of 1%. The results are presented in Figure 3. From Figure 3, it can be seen that the chemical properties of fly ash have minimal influence on the outlet concentration of CO2 and can even be disregarded.
Based on the aforementioned results and analysis, it is evident that the ash water does not possess a significant capacity for CO2 absorption. The negative effect of fly ash on CO2 absorption primarily manifests during the early stages of experiments and does not exhibit a substantial increase over time. In order to further explore the impact of fly ash properties on CO2 absorption, experiments were conducted with longer operating times, and the corresponding results are displayed in Figure 4. Figure 4 illustrates that the outlet concentration of CO2 gradually increases in both ash-contained solutions within the range of 30–120 min, and then the upward trend slows down. For the DEA solution, the outlet concentration of CO2 exhibits a gradual increase over 30–180 min, followed by stabilization.
The above experimental phenomena depicted in Figure 2, Figure 3 and Figure 4 can be explained in two aspects. Firstly, it was found that in the early stage of the experiment (within 0–15 min in Figure 2), fly ash contained in the MEA/DEA solution was mainly deposited on the upper end of the packing layer. This uneven distribution of the absorption liquid resulted in a decrease in the effective gas–liquid contact area (av). Consequently, the significant variation in the outlet concentration of CO2 occurred during the initial stage of the reaction. Secondly, as the experimental process continued, the fluid carried the fly ash into the lower packing layer. In the packing layer, the fluid flow channels may not be fully utilized; even if certain channels are blocked by fly ash, the gas–liquid reaction can still take place in channels that have less resistance. In other words, the deposition of fly ash in the packing layer will reduce the available surface area for gas–liquid contact. However, the impact on the effective surface area (av) required for the absorption reaction is relatively limited. Therefore, as the experiments continue over the long term, the increasing trend of CO2 outlet concentration becomes slower.
Based on the above analysis, we can conclude that the impact of fly ash on CO2 removal is mainly achieved by changing the distribution state of the absorption liquid within the packed tower, leading to changes in the effective gas–liquid contact area (av).

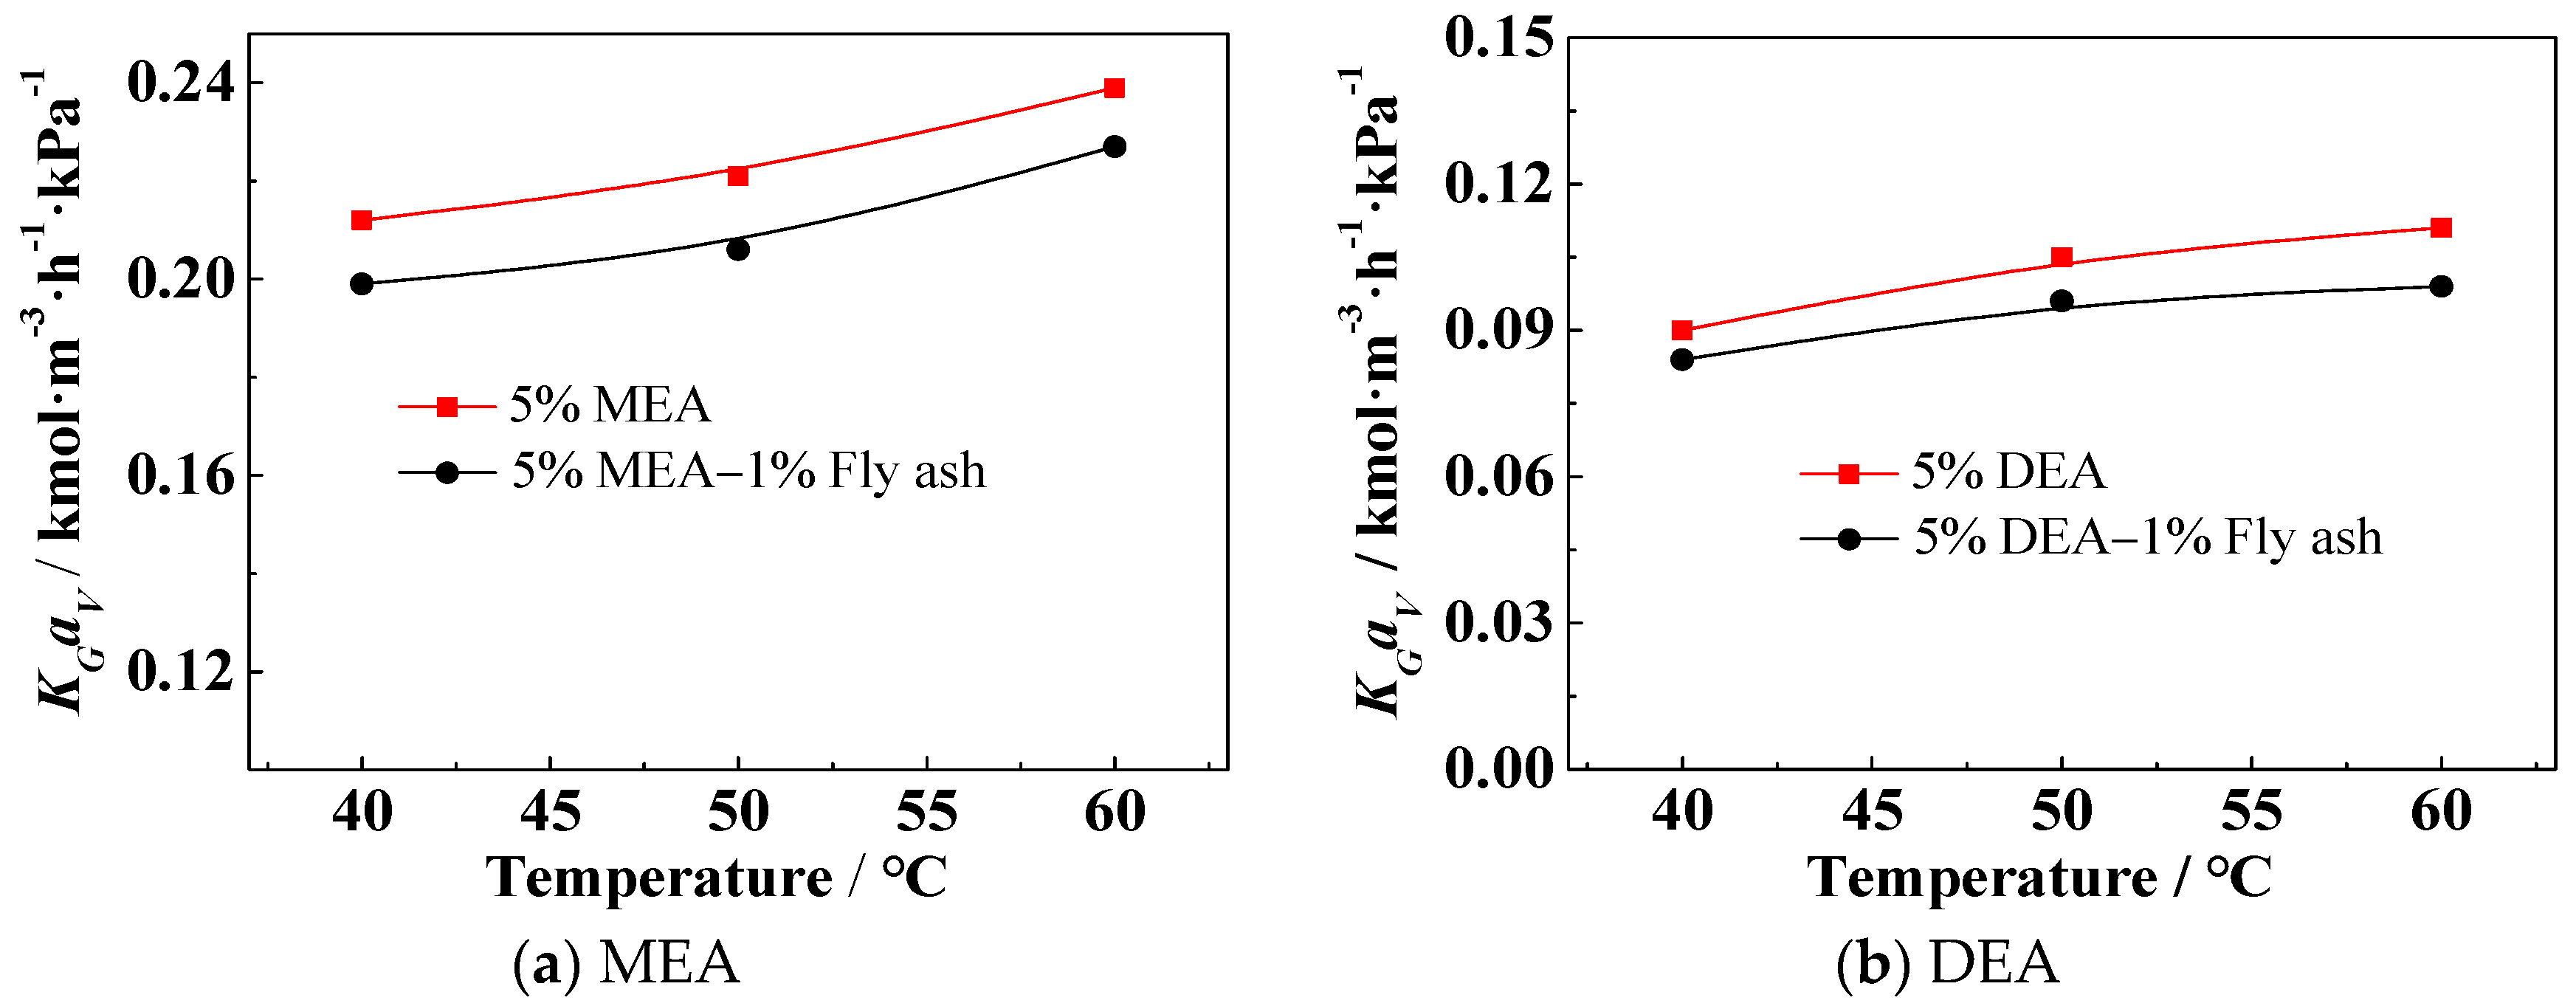
3.2. Effect of the Solution Temperature on KGav

The effect of solution temperature on KGav using different solutions is shown in Figure 5. As the solution temperature gradually increases from 40 °C to 60 °C, the KGav values of all solutions exhibit a consistent upward trend. KGav can be affected by the solution temperature through various mechanisms and factors. Firstly, the solution temperature has a significant impact on thermochemical reactions. According to the Arrhenius law, for every 10 °C increase in temperature, the chemical reaction rate is increased by about 2–4 times [33]. Secondly, higher liquid temperatures can reduce the viscosity of liquid and increase kinetic constants, CO2 diffusion coefficients, and Henry’s Constant (H), allowing for more intense contact between the gas and liquid phases [34,35,36]. As a result, the effective gas–liquid contact area (av) is increased, leading to higher KGav values. Lastly, the increase in solution temperature also increases the partial pressure of CO2 at the surface, which in turn provides more CO2 available in the solution for chemical reactions [1], thus increasing KGav.
In addition, as the solution temperature increases, the negative impact of fly ash on DEA shows an increasing trend. For a packed tower, the initial liquid distribution is one of the important factors that affects its performance in actual operation [37]. In the experiments, the fly ash was pumped into the packed tower along with the solution and primarily accumulated in the upper section of the packing layer. This led to liquid maldistribution and a decrease in the actual gas–liquid contact area, ultimately resulting in a reduction in KGav. This is the main reason for the decrease in KGav caused by fly ash. Furthermore, the viscosity of a solution can be decreased by increasing its temperature [34,35]. According to Table 2, it can be observed that the viscosity of the DEA solution is considerably higher than that of MEA. As the solution temperature increases, the viscosity of the DEA solution experiences a significant decrease. This enhances the flowability of the DEA solution, resulting in a more uneven distribution of the liquid at the upper inlet of the packing material; thereby, the effective mass transfer area of the packing material is significantly reduced. Therefore, the effect of increasing temperature on DEA is more pronounced in terms of the influence of fly ash.

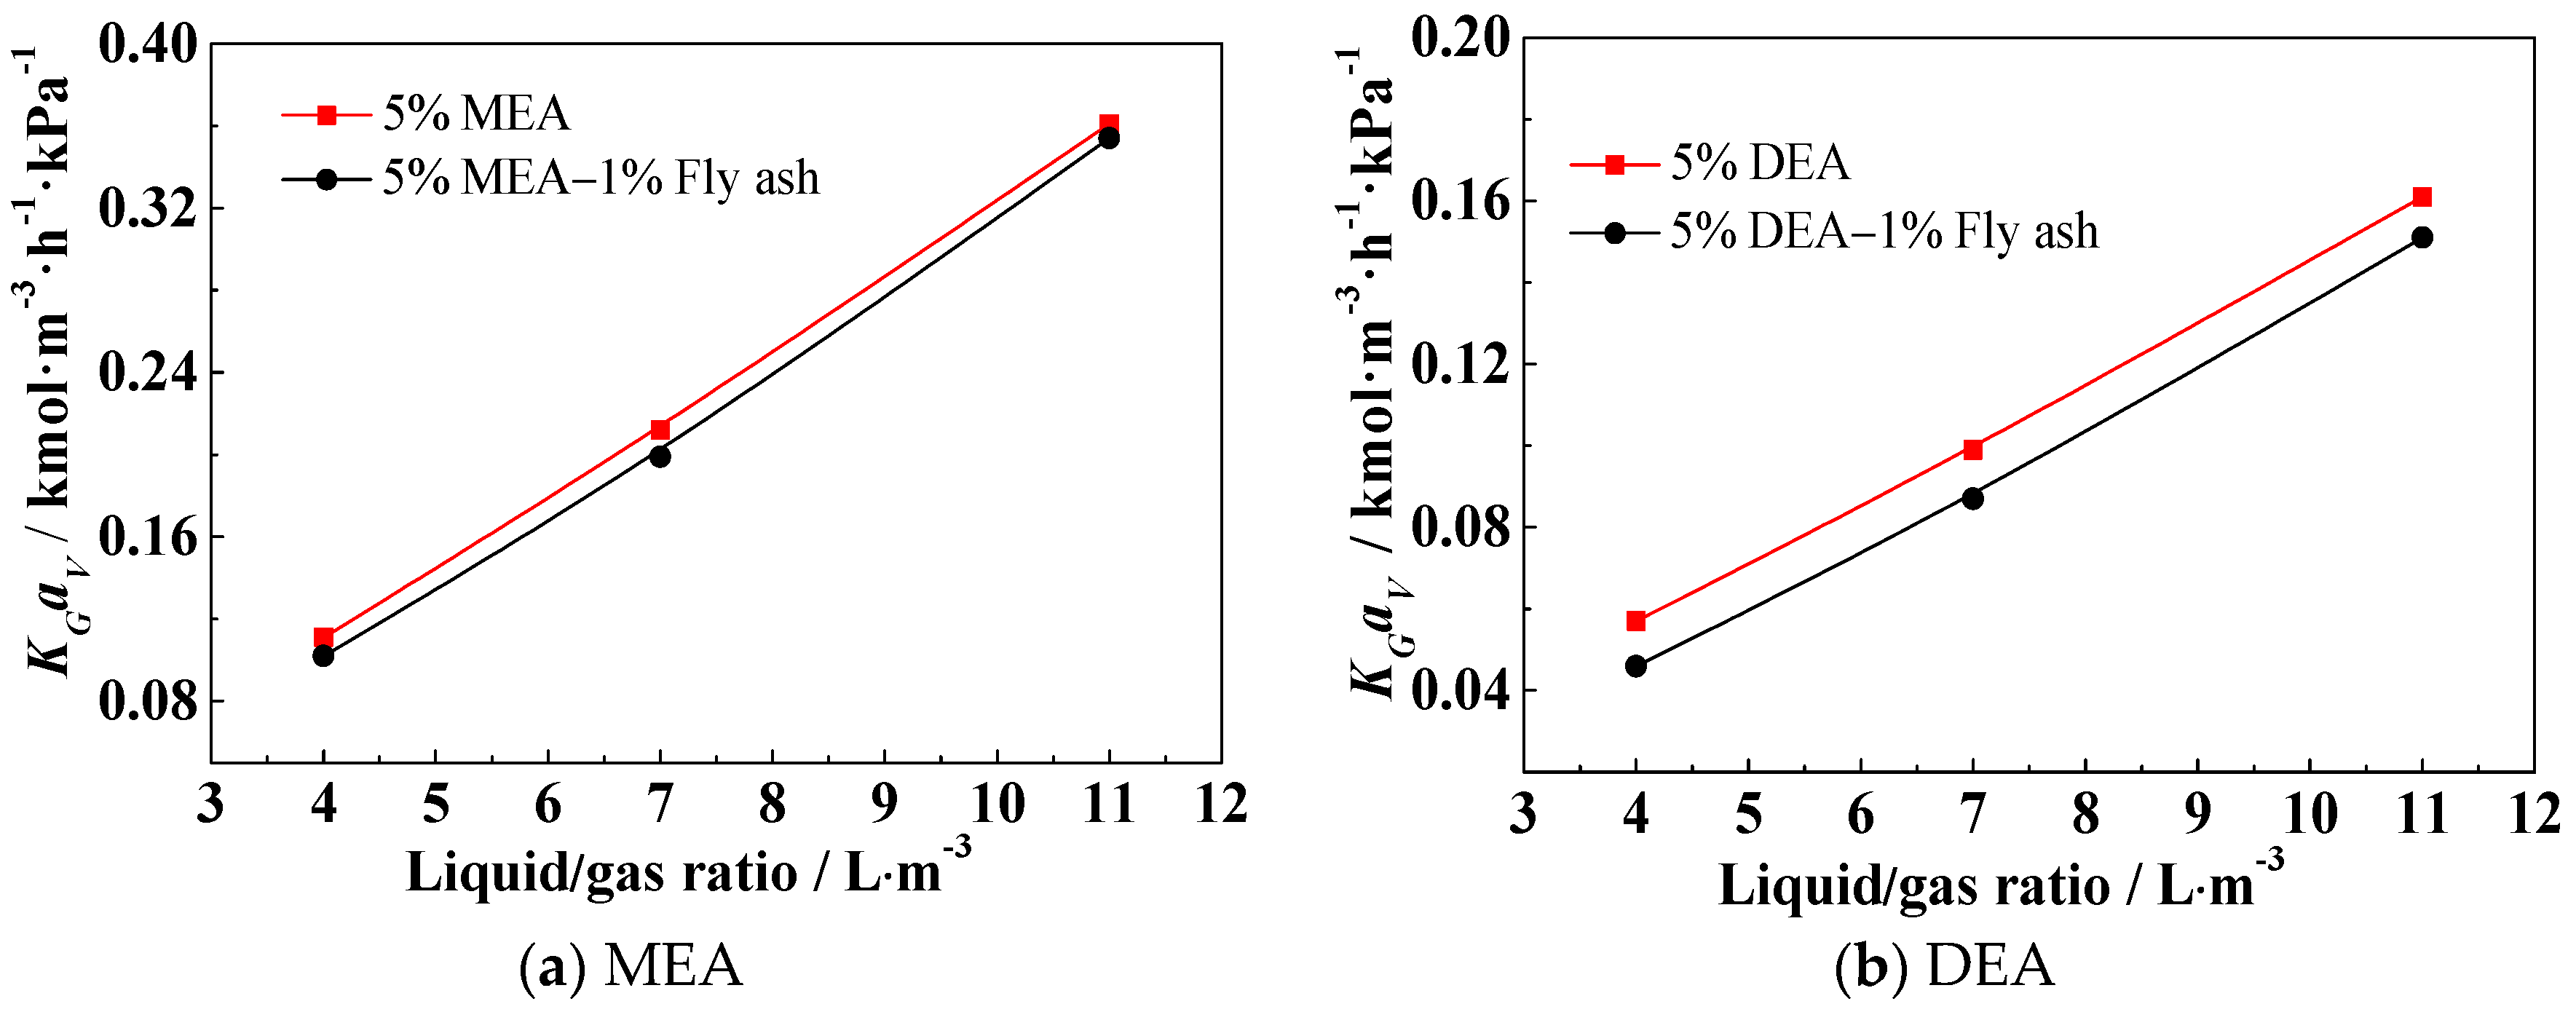
3.3. Effect of the Liquid/Gas Ratio (L/G) on KGav

The effect of the liquid/gas ratio (L/G) on the KGav is illustrated in Figure 6. Figure 6 shows that the KGav exhibited a nearly proportional relationship with the liquid/gas ratio (L/G), regardless of the presence or absence of fly ash in the solution. This suggests that the liquid/gas ratio (L/G) has a very significant effect on KGav in terms of the mass transfer performance for CO2 absorption into aqueous solutions of MEA and DEA. The reasons for the observed relationship between KGav and the liquid/gas ratio (L/G) are that an increase in the liquid/gas ratio (L/G) leads to a higher amount of solution being sprayed onto the packing. This increased amount of solution enhances the wettability of the packing material, resulting in improved mass transfer performance. Consequently, the effective gas–liquid contact area (av) increases, and there is more thorough contact between the gas and the liquid. Furthermore, increasing the liquid/gas ratio (L/G) not only results in an increase in the liquid-side mass transfer coefficient (kL) but also leads to a decrease in the thickness of the liquid film, particularly when the mass transfer is controlled by the liquid phase [29,38,39]. As a result, KGav increases rapidly.
In Figure 6, it can also be seen that the addition of fly ash to MEA and DEA solutions reduces the values of KGav. However, as the liquid/gas ratio (L/G) further increases, the negative effect of fly ash on MEA becomes less pronounced compared to DEA. This is because the increase in the liquid/gas ratio (L/G) significantly enhances the driving force of gas–liquid mass transfer, effectively counteracting the negative effects of fly ash on CO2 absorption processes caused by altering the distribution state of the absorbent solution and reducing the effective contact area between the two phases. In addition, DEA has a lower absorption rate and higher viscosity compared to MEA. As a result, any alterations in the initial distribution state of gas–liquid and the effective contact area have a more pronounced impact on DEA.

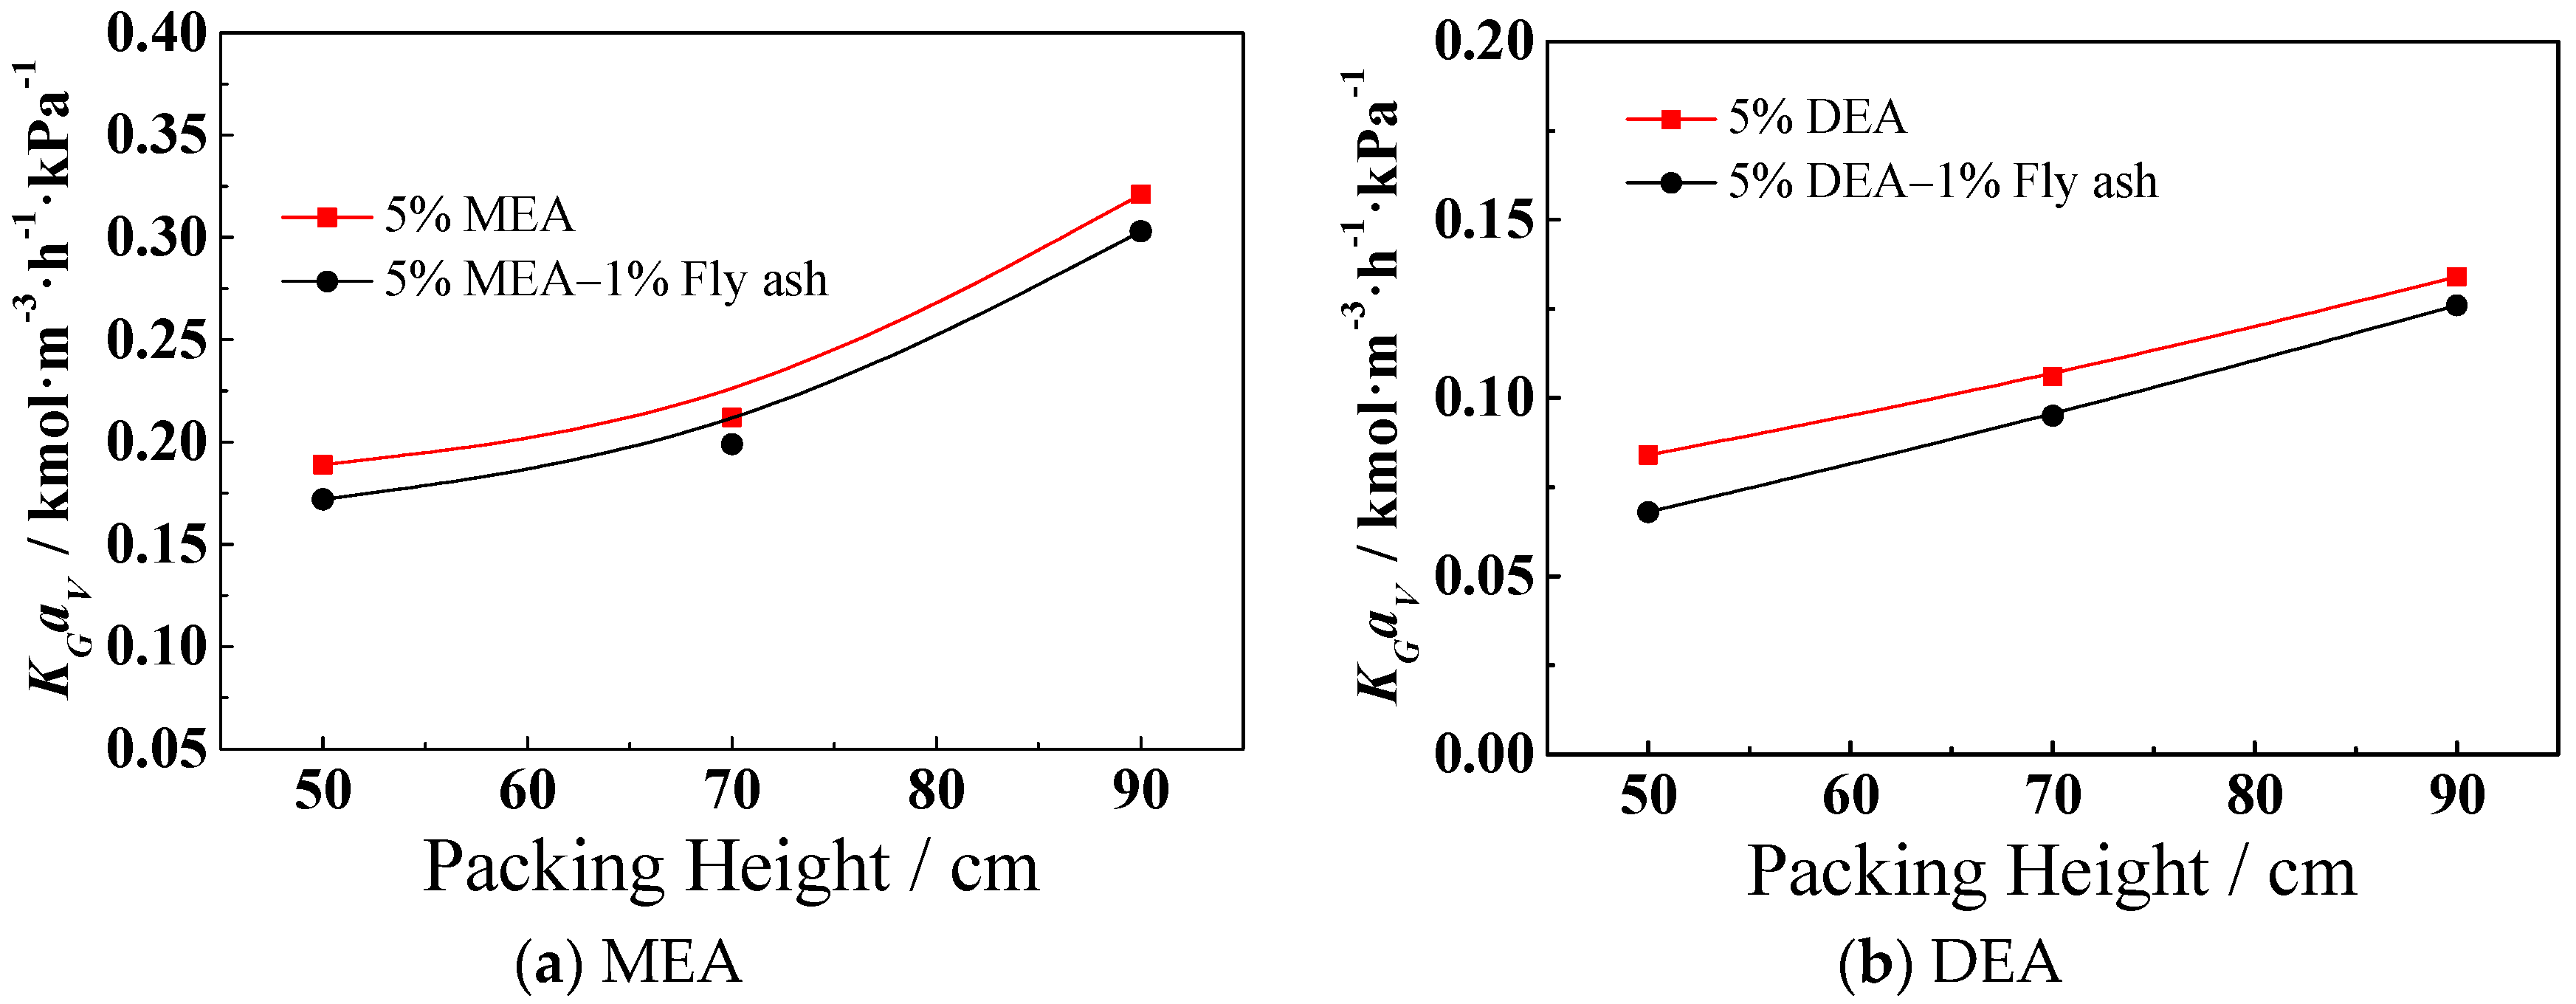
3.4. Effect of the Packing Height on KGav

The effect of the packing height on the KGav is shown in Figure 7. As shown in Figure 7, the values of KGav demonstrated an upward trend as the packing height increased. By increasing the packing height, both the gas–liquid residence time and the surface area of packing are increased, which can offer several benefits. First, this longer residence time allows for more thorough gas–liquid contact, facilitating mass transfer and chemical reactions. Second, the increased surface area provides more contact points for the gas and liquid phases, enhancing their interaction and improving overall mass transfer efficiency. Therefore, as the packing height increases, the KGav increases.
In Figure 7, it is evident that at the same packing height, particularly at low packing heights, the negative impact of fly ash on DEA is more significant compared to MEA. For instance, when the packing height is 50 cm, the addition of fly ash to the solution led to a reduction of 8.9% in KGav for the MEA solution, while the DEA solution experienced a larger reduction of 19% in KGav. This may be attributed to the higher viscosity of the DEA absorbent, resulting in its inferior flowability compared to MEA. However, the negative effect on the KGav gradually decreases as the packing height increases. This could be due to the opening of flow channels with relatively low resistance for gas and liquid, leading to an increased flow passage for the solution. Furthermore, the flow path of the absorption liquid is lengthened, leading to a certain degree of redistribution of the absorption liquid within the packing layer. This results in a reduction in the effective area caused by the uneven distribution of the inlet liquid.

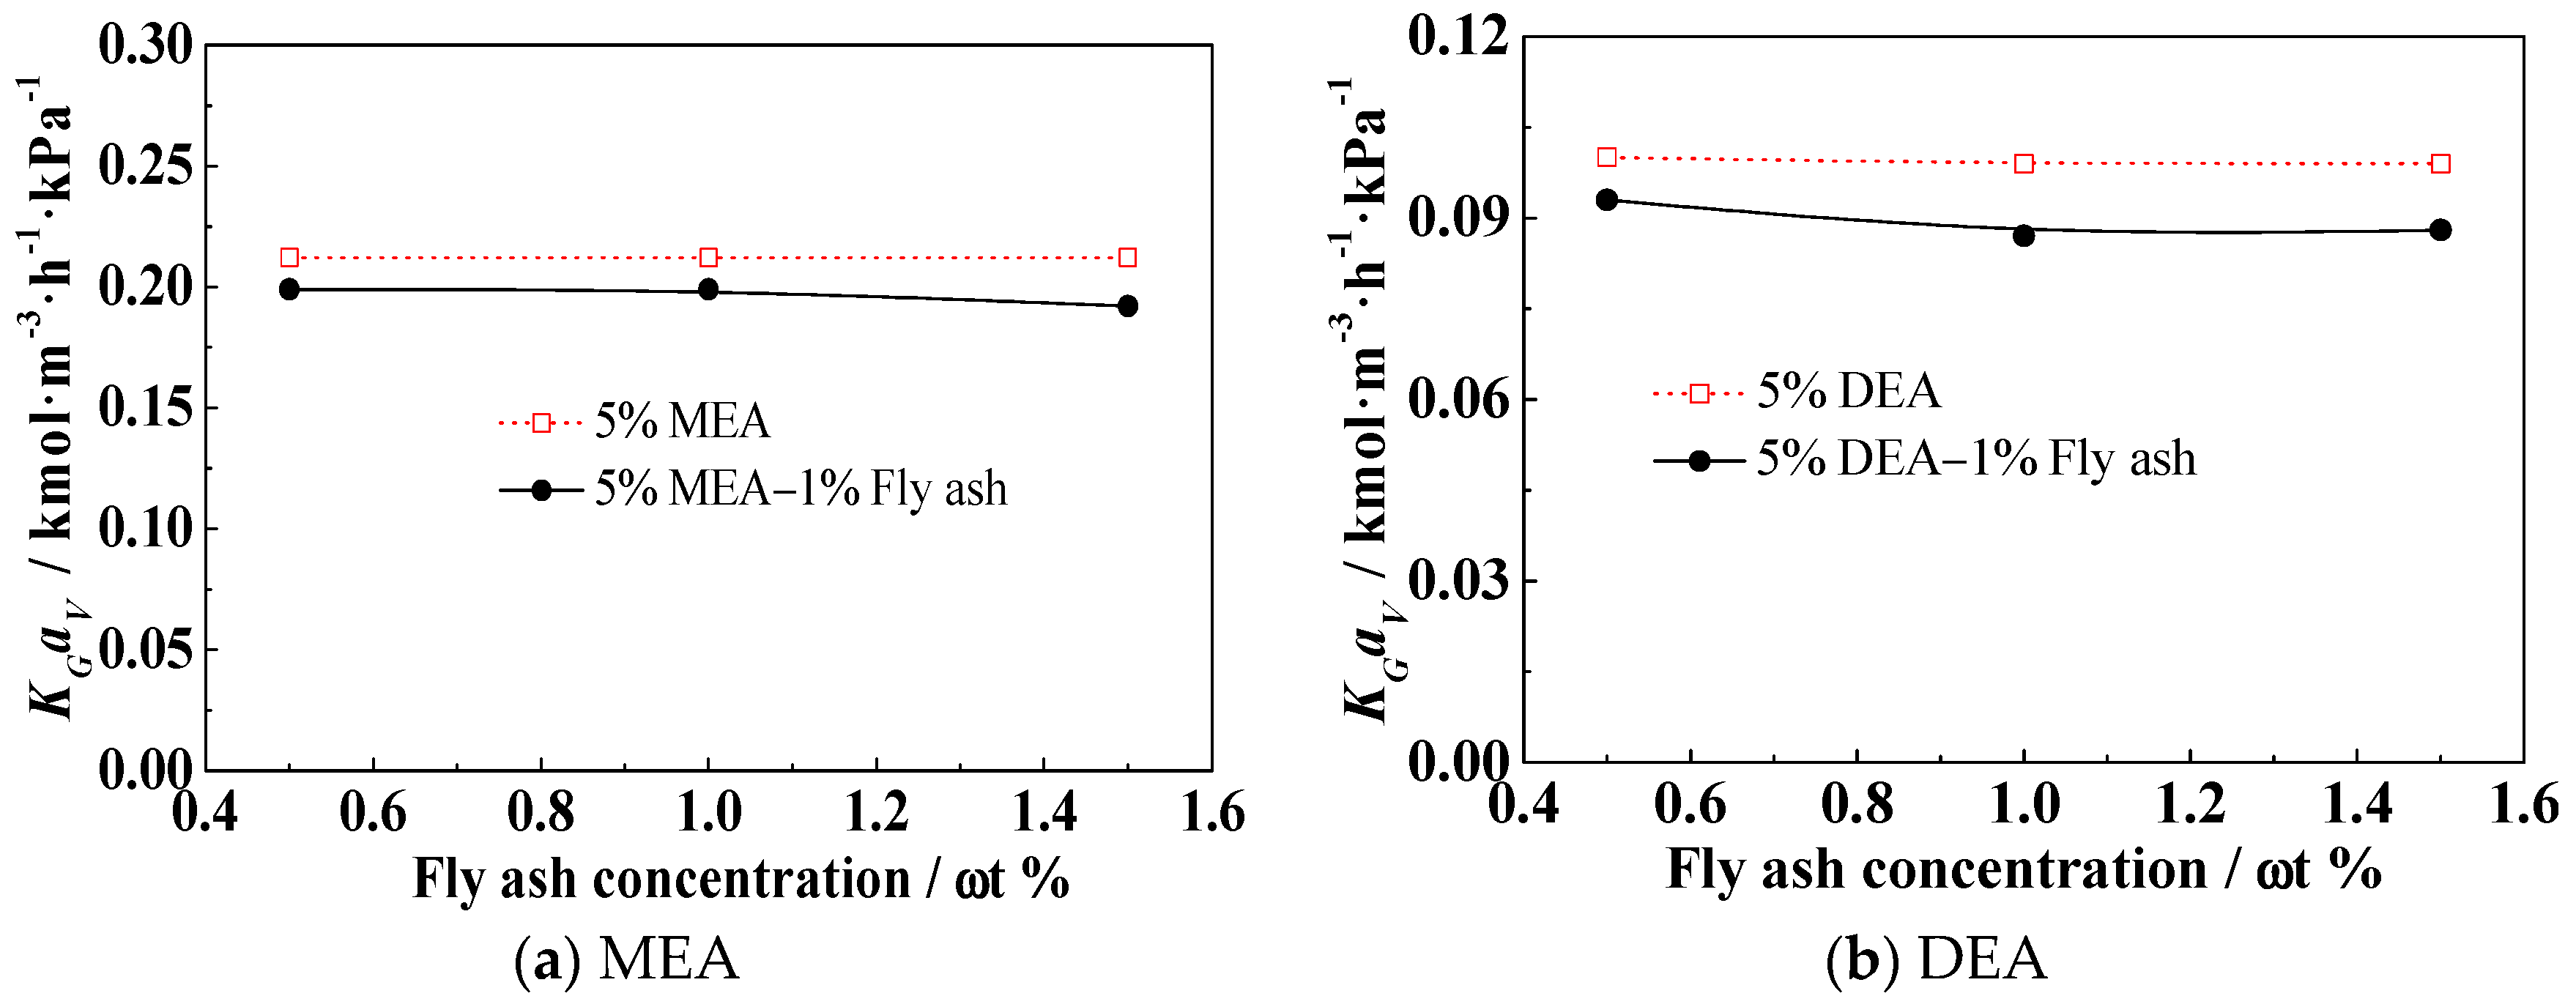
3.5. Effect of the Fly Ash Concentration on KGav

The effect of a high concentration of fly ash on the KGav was investigated, and the results are shown in Figure 8. Figure 8 shows that increasing the concentration of fly ash in the solution leads to a significant decrease in KGav. Based on the experimental results and analysis presented in Section 3.1, it is evident that fly ash does not possess the capability to effectively remove CO2. The negative impact of fly ash on KGav primarily arises from the uneven distribution of the absorption solution and the reduction in the effective gas–liquid contact area (av) due to the deposition of fly ash on the packing surface. Therefore, in industrial operations, it is crucial to implement effective measures to minimize the presence of solid grain impurities such as fly ash, carbon black, and desulfurizing agent particles in the solutions. This is necessary to mitigate their adverse effects on the CO2 removal system.

4. Conclusions

In a self-designed packed tower filled with θ-ring stainless steel packing, the effect of fly ash on KGav of CO2 absorption using MEA and DEA was studied, and the relationship between KGav and main process conditions was also studied. The results indicate that the effect of fly ash on the outlet CO2 concentration was primarily observed during the initial stages of the experimental process. Moreover, the presence of fly ash leads to a reduction in KGav when using MEA and DEA solutions, and increasing the fly ash concentration further exacerbates this negative impact. However, the effect of fly ash on the reduction in KGav is not significantly related to its chemical composition but rather depends on the operational parameters. As the solution temperature, liquid/gas ratio (L/G), and packing height increase, the KGav shows an increasing trend. With the increase in liquid/gas ratio (L/G) and packing height, the negative impact of fly ash on MEA and DEA is weakened. Analysis results revealed that the effect of fly ash on KGav was achieved by altering the initial distribution of the absorption solution, resulting in a decrease in the effective gas–liquid contact area (av). Therefore, under the most economical operating conditions, it is desirable to maximize the liquid/gas ratio (L/G) and packing height. Increasing the liquid/gas ratio (L/G) enhances the flushing force of the solution on the fly ash deposited on the packing, effectively cleaning the packing. Meanwhile, increasing the packing height provides more gas–liquid flow channels, aiming to mitigate the impact of fly ash on the CO2 absorption process. Furthermore, in future research work, the flow behavior of ash-contained fluid inside the packed tower can be explored by utilizing simulation software, which will enable us to obtain the effect of fly ash on the mass transfer performance of CO2 absorbents from a microscopic perspective.

Author Contributions

Conceptualization, W.X.; data curation, W.X. and C.X.; investigation, C.T. and C.X.; project administration, W.X. and C.T.; resources, J.Z.; supervision, J.Z.; validation, J.Z.; writing—original draft preparation, W.X., C.T., C.X. and J.Z.; writing—review and editing, W.X. and J.Z. All authors have read and agreed to the published version of the manuscript.

Funding

This research was funded by the General Special Scientific Research Project of Education Department of Shaanxi Provincial Government, Shaanxi Province, China [Grant No. 21JK0580] and the Scientific Research and Innovation Team of Shaanxi Energy Institute [Grant No. 2021KYTD06].

Data Availability Statement

Data are contained within the article.

Acknowledgments

We would like to express our sincere gratitude to Yangxian Liu for his invaluable guidance and advice.

Conflicts of Interest

Author Chunmin Tu was employed by the company Shaanxi Investment Group Co., Ltd. The remaining authors declare that the research was conducted in the absence of any commercial or financial relationships that could be construed as a potential conflict of interest.

References

  1. Heidaryan, E.; Gouran, A.; Nejati, K.; Aghel, B. Enhancement of CO2 capture operation in oscillatory baffled reactor. Sep. Purif. Technol. 2023, 324, 124536. [Google Scholar] [CrossRef]
  2. IEA CO2 Emissions in 2022. IEA Paris. 2023. Available online: https://www.iea.org/reports/co2-emissions-in-2022 (accessed on 5 July 2023).
  3. Liu, F.; Guan, J.; Qi, Z.; Fang, M.; Shen, Z.; Li, C. Technology route selection for carbon capture utilization and storage in coal fired power plants. J. Huazhong Univ. Sci. Technol. 2022, 50, 1–13. [Google Scholar]
  4. Yuan, X.; Su, C.W.; Umar, M.; Shao, X.; LobonŢ, O.R. The Race to zero emissions: Can renewable energy be the path to carbon neutrality. Environ. Manag. 2022, 308, 114648. [Google Scholar] [CrossRef]
  5. Yoshimoto, Y.; Kishimoto, K.; Sen, K.K.; Mochida, T.; Chapman, A. Toward Economically Efficient Carbon Reduction: Contrasting Greening Plastic Supply Chains with Alternative Energy Policy Approaches. Sustainability 2023, 15, 13229. [Google Scholar] [CrossRef]
  6. British Petroleum. BP Statistical Review of World Energy; British Petroleum: London, UK, 2021. [Google Scholar]
  7. Liang, Z.; Fu, K.; Idem, R.; Tontiwachwuthikul, P. Review on current advances, future challenges and consideration issues for post-combustion CO2 capture using amine-based absorbents. Chin. J. Chem. Eng. 2016, 24, 278–288. [Google Scholar] [CrossRef]
  8. Wen, L.; Liu, H.; Rongwong, W.; Liang, Z.; Fu, K.; Idem, R.; Tontiwachwuthikul, P. Comparison of overall gas-phase mass transfer coefficient for CO2 absorption between tertiary amines in a randomly packed column. Chem. Eng. Technol. 2015, 38, 1435–1443. [Google Scholar] [CrossRef]
  9. Shukla, C.; Mishra, P.; Dash, S.K. A review of process intensified CO2 capture in RPB for sustainability and contribution to industrial net zero. Front. Energy Res. 2023, 11, 1135188. [Google Scholar] [CrossRef]
  10. Wang, R.; Liu, S.; Li, Q.; Zhang, S.; Wang, L.; An, S. CO2 capture performance and mechanism of blended amine solvents regulated by N-methylcyclohexyamine. Energy 2021, 215, 119209. [Google Scholar] [CrossRef]
  11. Liu, C.; Zhao, Z.; Shao, L.; Zhu, L.; Xu, F.; Jiang, X.; Zheng, C.; Gao, X. Experimental study and modified modeling on effect of SO2 on CO2 absorption using amine solution. Chem. Eng. J. 2022, 448, 137751. [Google Scholar] [CrossRef]
  12. Aghel, B.; Sahraie, S.; Heidaryan, E. Carbon dioxide desorption from aqueous solutions of monoethanolamine and diethanolamine in a microchannel reactor. Sep. Purif. Technol. 2020, 237, 116390. [Google Scholar] [CrossRef]
  13. Aghel, B.; Sahraie, S.; Heidaryan, E. Comparison of aqueous and non-aqueous alkanolamines solutions for carbon dioxide desorption in a microreactor. Energy 2020, 201, 117618. [Google Scholar] [CrossRef]
  14. Aghel, B.; Maleki, M.; Sahraie, S.; Heidaryan, E. Desorption of carbon dioxide from a mixture of monoethanolamine with alcoholic solvents in a microreactor. Fuel 2021, 306, 121636. [Google Scholar] [CrossRef]
  15. Islam, M.S.; Yusoff, R.; Ali, B.S.; Islam, M.N.; Chakrabarti, M.H. Degradation studies of amines and alkanolamines during sour gas treatment process. Int. J. Phys. Sci. 2011, 6, 5877–5890. [Google Scholar]
  16. Lawal, A.O.; Idem, R.O. Effects of operating variables on the product distribution and reaction pathways in the oxidative degradation of CO2-loaded aqueous MEA−MDEA blends during CO2 absorption from flue gas streams. Ind. Eng. Chem. Res. 2005, 44, 986–1003. [Google Scholar] [CrossRef]
  17. Supap, T.; Idem, R.; Tontiwachwuthikul, P.; Saiwan, C. Kinetics of sulfur dioxide- and oxygen-induced degradation of aqueous monoethanolamine solution during CO2 absorption from power plant flue gas streams. Int. J. Greenh. Gas Control 2009, 3, 133–142. [Google Scholar] [CrossRef]
  18. Yang, J.; Yu, X.; An, L.; Tu, S.T.; Yan, J. CO2 capture with the absorbent of a mixed ionic liquid and amine solution considering the effects of SO2 and O2. Appl. Energy 2017, 194, 9–18. [Google Scholar] [CrossRef]
  19. Chen, Z.; Yates, D.; Neathery, J.K.; Liu, K. The effect of fly ash on fluid dynamics of CO2 scrubber in coal-fired power plant. Chem. Eng. Res. Des. 2012, 90, 328–335. [Google Scholar] [CrossRef]
  20. Budzianowski, W.M.; Koziol, A. Stripping of ammonia from aqueous solutions in the presence of carbon dioxide: Effect of negative enhancement of mass transfer. Chem. Eng. Res. Des. 2005, 83, 196–204. [Google Scholar] [CrossRef]
  21. da Silva, E.F.; Lepaumier, H.; Grimstvedt, A.; Vevelstad, S.J.; Einbu, A.; Vernstad, K.; Svendsen, H.F.; Zahlsen, K. Understanding 2-ethanolamine degradation in postcombustion CO2 capture. Ind. Eng. Chem. Res. 2012, 51, 13329–13338. [Google Scholar] [CrossRef]
  22. Huang, Q.; Thompson, J.; Bhatnagar, S.; Chandan, P.; Remias, J.E.; Selegue, J.P.; Liu, K. Impact of flue gas contaminants on monoethanolamine thermal degradation. Ind. Eng. Chem. Res. 2013, 53, 553–563. [Google Scholar] [CrossRef]
  23. Zhang, X.; Zhang, A.; Li, S.; Li, J.; Zhang, Y.; Zhang, X.; He, Y. Analysis and countermeasures on deterioration of amine in CO2 removal system from flue gas. J. Northwest Univ. 2015, 45, 68–72. [Google Scholar]
  24. Salten, A.H.; Maćkowiak, J.F.; Maćkowiak, J.K.; Kenig, E.Y.A. New hydrodynamic analogy model for the determination of transport phenomena in random packings. Chem. Eng. Sci. 2021, 233, 116246. [Google Scholar] [CrossRef]
  25. Flagiello, D.; Parisi, A.; Lancia, A.; Di Natale, F. A Review on gas-liquid mass transfer coefficients in packed-bed columns. ChemEngineering 2021, 5, 43. [Google Scholar] [CrossRef]
  26. Lydonrochelle, M.T. Amine scrubbing for CO2 capture. Science 2009, 325, 1652–1654. [Google Scholar]
  27. Danckwerts, P.V. The reaction of CO2 with ethanolamines. Chem. Eng. Sci. 1979, 34, 443–446. [Google Scholar] [CrossRef]
  28. Vaidya, P.D.; Kenig, E.Y. CO2-alkanolamine reaction kinetics: A review of recent studies. Chem. Eng. Technol. 2007, 30, 1467–1474. [Google Scholar] [CrossRef]
  29. Aroonwilas, A.; Veawab, A.; Tontiwachwuthikul, P. Behavior of the mass-transfer coefficient of structured packings in CO2 absorbers with chemical reactions. Ind. Eng. Chem. Res. 1999, 38, 2044–2050. [Google Scholar] [CrossRef]
  30. Maneeintr, K.; Idem, R.O.; Tontiwachwuthikul, P.; Wee, A.G. Comparative mass transfer performance studies of CO2 absorption into aqueous solutions of DEAB and MEA. Ind. Eng. Chem. Res. 2010, 49, 2857–2863. [Google Scholar] [CrossRef]
  31. Treybal, R.E. Mass Transfer Operations; McGraw Hill: Kuala Lumpur, Malaysia, 1980; p. 466. [Google Scholar]
  32. Liang, Z.H.; Sanpasertparnich, T.; Tontiwachwuthikul, P.P.; Gelowitz, D.; Idem, R. Part 1: Design, modeling and simulation of postcombustion CO2 capture systems using reactive solvents. Carbon Manag. 2011, 2, 265–288. [Google Scholar] [CrossRef]
  33. Afkhamipour, M.; Mofarahi, M. Review on the mass transfer performance of CO2 absorption by amine-based solvents in low-and high-pressure absorption packed columns. RSC Adv. 2017, 7, 17857–17872. [Google Scholar] [CrossRef]
  34. Ling, H.; Gao, H.; Liang, Z. Comprehensive solubility of N2O and mass transfer studies on an effective reactive N,N-dimethylethanolamine (DMEA) solvent for post-combustion CO2 capture. Chem. Eng. J. 2019, 355, 369–379. [Google Scholar] [CrossRef]
  35. Gao, H.; Xu, B.; Han, L.; Luo, X.; Liang, Z. Mass transfer performance and correlations for CO2 absorption into aqueous blended of DEEA/MEA in a random packed column. AIChE J. 2017, 63, 3048–3057. [Google Scholar] [CrossRef]
  36. Ling, H.; Liu, S.; Wang, T.; Gao, H.; Liang, Z. Characterization and correlations of CO2 absorption performance into aqueous amine blended solution of monoethanolamine (MEA) and N, N-dimethylethanolamine (DMEA) in a packed column. Energy Fuels 2019, 33, 7614–7625. [Google Scholar] [CrossRef]
  37. Xie, W.; Zhang, J.; Xu, L.; Lv, J.; Zhong, H.; Sheng, C. Influence of particles on mass transfer performance for CO2 absorption using K2CO3 solution in a random θ-ring packed column. Int. J. Greenh. Gas Control 2017, 58, 81–86. [Google Scholar] [CrossRef]
  38. Zou, L.; Gao, H.; Wu, Z.; Liang, Z. Fast screening of amine/physical solvent systems and mass transfer studies on efficient aqueous hybrid MEA/Sulfolane solution for postcombustion CO2 capture. J. Chem. Technol. Biotechnol. 2020, 95, 649–664. [Google Scholar] [CrossRef]
  39. Naami, A.; Sema, T.; Edali, M.; Liang, Z.; Idem, R.; Tontiwachwuthikul, P. Analysis and predictive correlation of mass transfer coefficient KGav of blended MDEA-MEA for use in post-combustion CO2 capture. Int. J. Greenh. Gas Control 2013, 19, 3–12. [Google Scholar] [CrossRef]
Figure 1. Flow diagram of the experimental setup.
Separations 11 00020 g001
Figure 2. Effect of fly ash on CO2 outlet concentration using different solutions.
Separations 11 00020 g002
Figure 3. Effect of ash water on outlet concentration of CO2.
Separations 11 00020 g003
Figure 4. Outlet concentration of CO2 during long-time running.
Separations 11 00020 g004
Figure 5. Effect of solution temperature on KGav.
Separations 11 00020 g005
Figure 6. Effect of liquid/gas ratio on KGav.
Separations 11 00020 g006
Figure 7. Effect of packing height on KGav.
Separations 11 00020 g007
Figure 8. Effect of fly ash concentration on KGav.
Separations 11 00020 g008
Table 1. Physical property and parameters of the packing materials.
TypeSize
(mm × mm)
Bulk Density (kg/m3)Surface Area (m2/m3)Void Fraction (%)
θ-ring3 × 3520180093
Table 2. Comparison of selected chemical properties between MEA and DEA.
NameViscosity (298 K)/mPa·sAbsorption Capacity
(CO2/amine)/mol·mol−1
Reaction Constan
(298 K)/m3·kmol−1·s−1
MEA18.950.355400
DEA351.90.43000–4000
Table 3. Mass fraction of fly ash components (%).
ω(Na2O)ω(MgO)ω(Al2O3)ω(SiO2)
1.31.3323.256.6
ω(CaO)ω(K2O)ω(Fe2O3)ω(others)
6.12.47.31.77
Table 4. The main parameters of experimental device.
ParameterBasic Conditions of Experiments
Packed towerInside diameter (mm)35
Height (mm)1300
MEA concentration5% (mass fraction)
DEA concentration5% (mass fraction)
CO2 initial concentration14% (volume fraction)
Concentration of fly ash1%
Solution temperature40 °C
Packed height70 cm
Flue gas flow7 L/min
Liquid/gas ratio (L/G)7 L/m3
Disclaimer/Publisher’s Note: The statements, opinions and data contained in all publications are solely those of the individual author(s) and contributor(s) and not of MDPI and/or the editor(s). MDPI and/or the editor(s) disclaim responsibility for any injury to people or property resulting from any ideas, methods, instructions or products referred to in the content.

