Abstract
Emerging contaminants are being detected at a high frequency, posing significant environmental and human health challenges. This study aimed to investigate the potential of using commercial granular activated carbon for adsorbing nine aqueous emerging contaminants (carbamazepine, phenacetin, pentoxifylline, norfloxacin, iprobenfos, isoprothiolane, metolachlor, tebuconazole, and hexaconazole). The adsorption study involved employing kinetic and isotherm models, using various concentrations of emerging contaminants and sorbents in a batch system. Additionally, the study explored the correlation between the characteristics of emerging contaminants and their adsorption values, which displayed a relatively linear relationship. While some previous papers have evaluated the performance of one or two substances, there is a lack of research on the adsorption mechanisms of all nine aqueous emerging contaminants. Therefore, the findings from this study on the adsorption potential of granular activated carbon can serve as a valuable foundation for further investigations into its effectiveness in adsorbing emerging contaminants.
1. Introduction
In recent years, emerging contaminants have become significant organic pollutants in drinking water, leading to their detection in various public drinking water systems [1]. Natural and anthropogenic trace organic contaminants have also been identified in raw water bodies worldwide. Pesticides and pharmaceutical compounds play crucial roles in enhancing the quality of modern life; unfortunately, these substances also contribute to environmental water contamination [2]. These emerging contaminants are organic compounds that persist in the environment due to their resistance to biodegradation or breakdown processes. Previously, such contaminants, including pharmaceuticals and pesticides, were continuously discharged into the environment without proper recognition owing to limited detection capabilities. However, recent advancements in analytical technology now enable the detection and analysis of trace concentrations in the parts per trillion (ppt) range, leading to the discovery of these issues [3]. Emerging contaminants have the potential to continuously expose ecosystems and public health to bioaccumulation, even at trace concentrations [4]. This ongoing research is vital because the maximum allowable concentration of these contaminants, concerning their long-term exposure to the human body in the environment, remains unknown [4,5].
The treatment of emerging contaminants in raw water presents a significant challenge to researchers due to the diverse chemical characteristics of pesticides and pharmaceutically active compounds. To address this issue, various technologies have been proposed and evaluated, including biological, physical–chemical treatments, ion exchange, membrane processes, and adsorption, each yielding different results [6,7,8,9]. Among these technologies, adsorption using activated carbons is a commonly employed method for removing emerging contaminants. This preference is due to its straightforward design, ease of operation and handling, the possibility of adsorbent regeneration, and the absence of sludge generation [10].
The main objective of this study was to explore the potential of using commercial granular activated carbon for treating and adsorbing nine aqueous emerging contaminants: carbamazepine (CBZ), phenacetin (PHE), pentoxifylline (PEN), norfloxacin (NOR), iprobenfos (IPB), isoprothiolane (ISP), metolachlor (MET), tebuconazole (TEB), and hexaconazole (HEX). We conducted batch experiments to assess the kinetic and isotherm parameters at varying contact times and adsorbent doses. Additionally, we performed batch adsorption experiments and theoretical model investigations to analyze the adsorption kinetics and equilibrium. The results obtained from this adsorption study using granular activated carbon are expected to serve as a valuable foundation for further investigations into the effectiveness of its adsorbent function for removing emerging contaminants.
2. Experimental
2.1. Adsorbents
The adsorbent employed in this study was Norit1240 commercial granular activated carbon (GAC) obtained from Cabot Corporation, Boston, MA, USA. To prepare the GAC, it was dried in an oven (C-Do, Chang Shin Scientific Co., Hwaseongsi, Republic of Korea) at 105 °C for 24 h and then stored in an aluminum bottle. Subsequently, the dried GAC was kept in a desiccator until used for the batch experiments.
2.2. Chemicals and Reagents
The emerging contaminants utilized in this experiment included CBZ, PHE, PEN, NOR, IPB, ISP, MET, TEB, and HEX, all of which were procured from Sigma-Aldrich, St. Louis, MO, USA. These chemicals were of analytical grade, ensuring the highest available purity. To prepare the stock solutions, 100 mg/L of each contaminant was dissolved in their respective solvents: CBZ in 10% acetonitrile, PHE in 6% acetonitrile, PEN in deionized water, NOR in 0.4% HOAc, IPB in 30% acetonitrile, ISP in 10% acetonitrile, MET in 40% acetonitrile, TEB in 6% acetonitrile, and HEX in 6% acetonitrile solution. The stock solutions were stored in brown bottles to prevent light degradation. For further information on the physical and chemical properties of these emerging contaminants, refer to Table 1.

Table 1.
Physical and chemical properties of the investigated pharmaceutical and pesticide compounds in emerging contaminants.
2.3. Batch Experiments
The removal of emerging contaminants via GAC was assessed through the measurement of both initial and time-dependent concentrations of the contaminants in a batch system. Each trial involved mixing 0.01–2.0 g of GAC with 50 mL of the emerging contaminants solution within a 50 mL conical tube. The initial concentration of the contaminants was set at 100 mg/L, and the initial solution pH was adjusted to 7.0 by adding 1.0 N NaOH or H2SO4, as required. To promote the reaction, the conical tubes were horizontally agitated on a shaker (Vision Co., Yeosusi, Republic of Korea) at a constant speed of 200 rpm while maintaining the reaction temperature at 25 ± 1 °C. Periodically, 1 mL of the samples was collected and filtered using a 0.2 μm cellulose acetate membrane syringe filter (MACHEREY-NAGEL GmbH & Co. KG, Heilbronn, Germany). Subsequently, the filtered samples were stored in a refrigerator at a temperature below 5 °C until the analysis was conducted. The total volume of withdrawn samples did not exceed 15% of the working volume (50 mL).
The amount of emerging contaminants per unit mass of adsorbent (qe) at equilibrium was calculated using the following Equation (1):
where C0 and Ce are initial and equilibrium concentrations of adsorbate (mg/L), respectively; W is the dry mass of adsorbent (g); and V is the volume of solution (L).
2.4. Kinetic Models
To assess the capacity of the adsorption process, pseudo-first-order and pseudo-second-order kinetic models were employed to interpret the experimental data. The pseudo-first-order kinetic model can be expressed using the following Equation (2) [11]:
where qe is the amount of adsorbate adsorbed (mg/g) at equilibrium, qt is the amount of adsorbate adsorbed (mg/g) at time t (h), and k1 is the pseudo-first-order rate constant (1/h).
The pseudo-second-order kinetic model can be defined as follows in Equations (3) and (4) [11]:
And
where h (g/mg·h) is the initial sorption rate, and k2 (g/mg·h) is the rate constant for the pseudo-second-order equation.
In the adsorption process, the kinetic data were analyzed using the Weber and Morris intraparticle diffusion models to elucidate the diffusion mechanism. The dynamic process of solid–liquid adsorption can be described in three steps. The Weber and Morris intraparticle diffusion model can be expressed as follows in Equation (5) [12]:
where kp is the intra-particle diffusion rate constant (mg/g·h1/2), and C is a constant relating to the thickness of the boundary layer (mg/g), which can be determined from the plot of qt versus t1/2. In general, adsorption in this model involves the following steps: (1) migration of adsorbate from the bulk of the solution to the surface of the adsorbent (bulk diffusion), (2) the diffusion of the adsorbate through the boundary layer to the surface of the adsorbent (film diffusion), (3) the transport of the adsorbate from the surface to the interior pores of the adsorbent (intra-particle diffusion), and (4) adsorption at an active site on the surface of adsorbent (chemical reaction via ion-exchange complexation).
2.5. Equilibrium Isotherm Model
The equilibrium adsorption isotherm holds fundamental significance in optimizing the use of adsorbents. Analyzing isotherm data by fitting the data to models is a crucial step in identifying a suitable model for the design of adsorption systems. In this study, Langmuir and Freundlich isotherm models were employed to determine the adsorption equilibrium for various emerging contaminants.
The Langmuir model equation is based on the assumptions that the adsorption site is homogeneous and that each site accommodates one adsorbate molecule or ion; adsorption is monolayer coverage, and there is no interaction between adsorbed molecules or ions [13]. The Freundlich model equation is an empirical equation used for heterogeneous systems and is not restricted to formation of a monolayer [13]. The Langmuir isotherm equations can be expressed as follows in Equation (6):
and the Freundlich isotherm equations can be expressed as follows in Equation (7):
where Ce is the equilibrium concentration of emerging contaminants (mg/L), qe is the number of emerging contaminants adsorbed at equilibrium (mg/g), qm is the maximum adsorption capacity (mg/g), and bL (L/g) is the Langmuir isotherm constant. KF (mg/g) (L/mg)1/n and 1/n (dimensionless) are Freundlich constants representing adsorption capacity and adsorption intensity (level of favorability), respectively. When 1/n < 0.01 between adsorbate and adsorbent, adsorption is pseudo-irreversible; 0.01 < 1/n < 0.1, strongly favorable; 0.1 < 1/n < 0.5, favorable; 0.5 < 1/n < 1, pseudo-linear; 1/n = 1, linear; and 1/n > 1, unfavorable [14].
2.6. Analysis
The Brunauer, Emmett, and Teller (BET) surface area and pore size distributions were measured using a Surface Area Analyzer ASAP 2010 (Micromeritics, Norcross, GA, USA) through nitrogen adsorption at −196 °C in the range of relative pressure (P/P0). The pore volume distribution as a function of pore size was calculated based on the Barret, Joyner, and Halenda (BJH) method.
Methylene blue capacity analysis was performed in Erlenmeyer flasks (100 mL) using 25 mL solutions of dye with an initial concentration of 500 mg/L. A mass of 0.1 g of GAC adsorbent was added to the solution and placed in a shaker at 200 rpm with a constant reaction temperature of 25 ± 1 °C for 30 min. The concentration of methylene blue in the supernatant solution before and after adsorption was determined using a UV-VIS spectrophotometer (Vision Co., Yeosusi, Republic of Korea) at 665 nm.
Iodine number analysis was performed in Erlenmeyer flasks (100 mL) with solutions of iodine (50 mL) at initial concentrations of 0.1 N. A mass of 0.5 g of adsorbent GAC was added to the solution and placed in a shaker at 200 rpm with a constant reaction temperature of 25 ± 1 °C for 15 min. The iodine in the supernatant solution after adsorption was added to 1.0 mL soluble starch (1%), and the concentration of iodine was determined using 0.1 M sodium thiosulfate by the titration method.
The solid addition method was used to determine the zero surface charge characteristics (pHpzc) of the GAC [15]. The initial pH (pHi) of each solution was adjusted to between 2.0 and 12.0 by adding 0.1 N HCl and 0.1 N NaOH solutions using deionized water. The volume of the solution in each capped glass vial was adjusted to 50 mL. The pHi of each solution was accurately recorded, and 0.5 g of unique GAC was added to each vial. The tubes were horizontally agitated on a shaker at 200 rpm with a constant reaction temperature of 25 ± 1 °C for 24 h. The final pH (pHf) of the supernatant liquid was noted. The ΔpH, the difference between the pHi and pHf, was plotted against pHi. The point of intersection of the resulting curve with the abscissa, at which ΔpH = 0, determined pHpzc.
The concentrations of emerging contaminants were determined in the collected samples using Ultra Performance Liquid Chromatography UPLC-Orbitrap MS (EQuan Max, Thermo Fisher Scientific Inc., Waltham, MA, USA) with a Thermo Scientific™ Hypersil GOLD aQ™ pre-concentration column (20 × 2.1 mm, 12 μm particle size) and a Thermo Scientific™ Hypersil GOLD™ analytical column (50 × 2.1 mm, 1.9 μm particle size). The allowable liquid sample injection range was 1.0 to 20 mL, and the sample injection amount was set at 1.0 mL after considering the WHO guidelines, equipment sensitivity, peak shape, and concentration ratio of online injection. The standard material for the calibration curve and all the samples used in the analysis were filtered through a 0.2 μm GHP (hydrophilic polypropylene) membrane syringe filter.
3. Results and Discussion
3.1. Characterization of the Adsorbent
The activated carbon Norit1240 was derived from bituminous coal, known for its high surface area and significant adsorption capacity. Its porous properties, including BET surface area, pore size, pore volume, iodine number, and methylene blue number, are presented in Table 2. The BET surface area and micro-pore areas were determined to be 930.5 m2/g and 676.0 m2/g, respectively. The average pore widths from the BJH adsorption and desorption measurements were also recorded. Figure 1 illustrates the distributions of pore volume (a), pore area (b), and N2 adsorption–desorption isotherms (c). The isotherm exhibits the characteristics of a typical type I isotherm, indicating the presence of microporous material in Norit1240. Notably, the slope changes in the region around 0.1 and 0.9, suggesting unique adsorption characteristics in this specific range.

Table 2.
Physicochemical characterization of sorbent for commercial Norit1240 GAC.
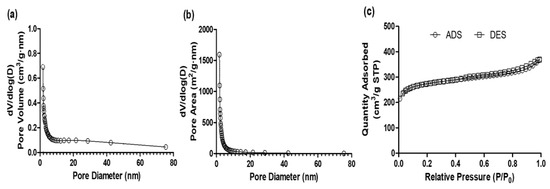
Figure 1.
Distributions of (a) pore-volume and (b) pore-area with pore-size diameter, and (c) nitrogen adsorption–desorption isotherm at −196 °C for granular activated carbon.
3.2. Adsorption Kinetic Model
The kinetics parameters of emerging contaminants’ adsorption are presented in Table 3 using the pseudo-first-order and pseudo-second-order kinetic models. In all cases, the concentrations of the nine emerging contaminants in the solution decreased rapidly within the first 12 h and continued to decrease gradually until reaching equilibrium within 24 h. Table 3 provides the calculated parameters of the kinetic models for each adsorbate, along with the corresponding correlation coefficients (r2) for the data and the two kinetic models, offering a comprehensive summary of the adsorption of emerging contaminants.

Table 3.
Kinetic parameters of various emerging contaminants for pseudo-first- order model and pseudo-second-order model.
Based on the correlation coefficients, it appears that the adsorptions of all emerging contaminants onto the GAC are better represented by pseudo-second-order kinetics. Although reasonable correlations were observed for the pseudo-first-order rate model, the pseudo-second-order model provides a more suitable fit to the experimental data. Consequently, it is assumed that physical–chemical adsorption is involved in the adsorption process. Figure 2 illustrates the kinetics of emerging contaminants’ adsorption, presenting the equilibrium concentration (Ce) for each adsorbate over time (h). The graph visually portrays the adsorption behavior of the contaminants, further supporting the findings obtained from the kinetic model analyses. The initial sorption rates for the emerging contaminants exhibited the fastest adsorption rates and were ranked in descending order as follows: TEB (121.27 g/mg·h) > NOR (99.61 g/mg·h) > IPR (89.95 g/mg·h) > CBZ (78.39 g/mg·h) > ISO (68.44 g/mg·h) > PHE (63.19 g/mg·h) > HEX (62.33 g/mg·h) > PEN (55.27 g/mg·h) > MET (47.70 g/mg·h). However, when considering the adsorption capacity, differences were observed for the initial sorption rates. Notably, some adsorbates, such as NOR, IPR, MET, and HEX, did not undergo complete adsorption. This variation in adsorption capacity indicates different adsorption mechanisms between the adsorbates and the adsorbent, signifying complexities in their interactions during the adsorption process.

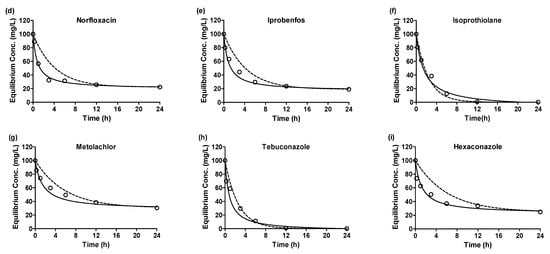
Figure 2.
Adsorption kinetics plots emerging contaminants (a) carbamazepine, (b) phenacetin, (c) pentoxifylline, (d) norfloxacin, (e) iprobenfos, (f) isoprothiolane, (g) metolachlor, (h) tebuconazole, (i) hexaconazole by granular active carbon of experiments data, pseudo-1st-order model and pseudo-2nd-order model (empty circle: experiment data, dot-line: pseudo-1st-order, solid-line: pseudo-2nd-order).
3.3. Diffusion Mechanism
Among the kinetic models, the Weber and Morris intraparticle diffusion model is recognized as the most suitable for describing adsorption via physical sorption. The plots of qt vs. t1/2 are presented for the adsorption of emerging contaminants onto adsorbents at a 100 mg/L concentration (Figure 3) and model parameter values are shown in Table 4.
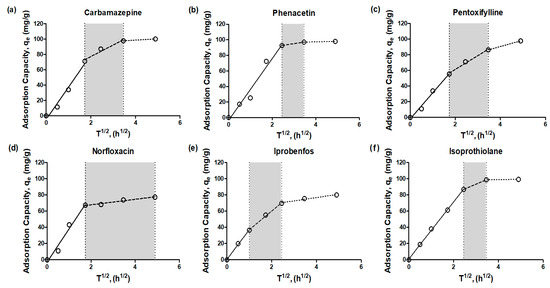

Figure 3.
Intra-particle diffusion model (Weber and Morris model) for emerging contaminants (a) carbamazepine, (b) phenacetin, (c) pentoxifylline, (d) norfloxacin, (e) iprobenfos, (f) isoprothiolane, (g) metolachlor, (h) tebuconazole, (i) hexaconazole) adsorption by granular active carbon (empty circle: experiment data, solid-line: 1st-stage, dash-line: 2nd-stage, dot-line: 3rd-stage).

Table 4.
Coefficients of various emerging contaminants for Weber–Morris diffusion model.
The intraparticle plots exhibited an asymptotic pattern, which could be divided into a multi-linearity pattern comprising three distinct stages in the adsorption process of GAC. This model proves effective when the external solute concentration lies within the plateau region of the adsorption isotherm of the material. The plots displayed consistent features across all cases, with three linear segments followed by a plateau. The first segment, represented by a solid line with a short adsorption period, indicated the involvement of outer diffusion during the early stage of adsorption for the emerging contaminants. The second segment, represented by a dashed line, corresponded to inner diffusion, signifying the transport of adsorbate from the external surface to the interior pores of the adsorbent. The third segment, illustrated by a dotted line, characterized the final plateau, which indicated a state of adsorption equilibrium, where the adsorption rate and desorption rate reached a balance [16].
In the section marked with a gray background (dashed line), it was observed that the time required for inner diffusion varied depending on the type of adsorbent and adsorbate. Particularly, NOR exhibited different periods of inner and outer diffusion compared to other emerging contaminants. As we mentioned earlier, this discrepancy could be attributed to different intra-diffusion phases for each emerging contaminant, leading to enhanced resistance in terms of diffusion between the adsorbent and adsorbate. For all adsorbates, the adsorption plots of emerging contaminants did not intersect at the origin, indicating that intraparticle diffusion alone was not the sole rate-limiting step. Instead, external mass transfer also played a significant role in influencing the adsorption process [17,18]. Indeed, Figure 3 clearly demonstrates that the time required for inner diffusion is significantly longer than that for outer diffusion. This observation suggests that the adsorption process is influenced by both outer and inner diffusion, indicating a control mechanism involving both types of diffusion. As a result, the overall mass transfer in the adsorption process appears to be predominantly governed by inner diffusion rather than outer diffusion.
This finding emphasizes the crucial role of intra-particle diffusion in the adsorption of emerging contaminants onto the adsorbents studied in this research. The extended time required for inner diffusion indicates that the transport of adsorbate from the external surface to the interior pores of the adsorbent plays a key role in determining the overall rate of adsorption. Understanding and characterizing the contribution of both inner and outer diffusion are essential for optimizing and designing effective adsorption systems for the removal of emerging contaminants.
3.4. Equilibrium of Emerging Contaminants
The equilibrium adsorption isotherm plays a fundamental role in optimizing the use of adsorbents, and analyzing isotherm data by fitting it to various isotherm models is a crucial step in identifying the most suitable model for the design of the adsorption system. The distribution of emerging contaminants between the adsorbent and solution at equilibrium was expressed using isotherm equations (Figure 4). Two widely used forms in adsorption equilibrium conditions are the Freundlich and Langmuir isotherm models. The calculated values of the isotherm parameters (qm, bL, KF, and n), along with the coefficient of determination r2 values, are summarized in Table 5. In all cases, the Freundlich isotherm consistently displayed a higher correlation coefficient than the Langmuir isotherm, implying that the Freundlich isotherm provides a more suitable description of the data for the adsorption of emerging contaminants. This higher correlation coefficient indicates a better fit of the experimental data to the Freundlich isotherm model. The Langmuir isotherm model is typically associated with monolayer sorption on homogeneous surface sites, where all pore sites possess equal affinity for the adsorbate [19]. On the other hand, the Freundlich isotherm is more suitable for describing the adsorption of organic compounds on heterogeneous surface sorbents, such as activated carbon, and is generally recognized for multi-layer sorption [20].
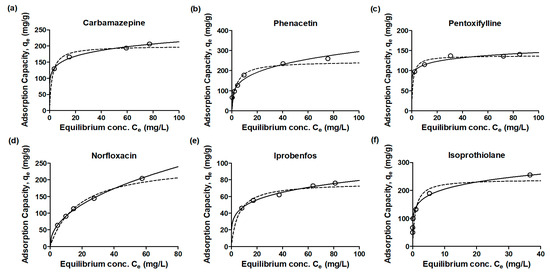

Figure 4.
Adsorption isotherm plots for emerging contaminants (a): carbamazepine, (b): phenacetin, (c): pentoxifylline, (d): norfloxacin, (e): iprobenfos, (f): isoprothiolane, (g): metolachlor, (h): tebuconazole, (i): hexaconazole) by granular active carbon experiment data, Langmuir and Freundlich models (empty circle: experiment data, dot-line: Langmuir model; solid-line: Freundlich model).

Table 5.
Isotherm parameters of various emerging contaminants for Langmuir and Freundlich models.
The slope range observed for the equilibrium concentration versus adsorption capacity was between 0 and 1, indicating an increase in surface heterogeneity as the slope approached zero. Moreover, the values close to zero for the adsorption intensity parameter (1/n) suggested a strong chemisorption process [14,20]. The low 1/n values (<0.2) obtained for CBZ, PEN, ISO, and TEB indicated chemisorption as the dominant adsorption mechanism for these contaminants. Conversely, the high 1/n values (>0.4) observed for NOR, MET, and HEX suggested physisorption as the predominant adsorption mechanism for these contaminants. The results of this study highlight the importance of considering adsorption properties to determine the most suitable adsorbent for the specific adsorption mechanism involved in removing emerging contaminants using activated carbon. Understanding the adsorption mechanisms can aid in selecting the appropriate adsorbent and optimizing the efficiency of the adsorption process for different types of emerging contaminants.
3.5. Relationship of between Emerging Contaminants and Adsorption
The adsorption of emerging contaminants onto adsorbents is significantly influenced by factors such as hydrophobicity, hydrophilicity, molecular weight, and acid dissociation constant (pKa) of the compound (Table 6). A general rule of thumb, as explained by Rogers [21], suggests that the octanol-water partition coefficient (KOW) can be used to estimate adsorption potential. Specifically, log KOW values below 2.5 indicate low adsorption potential, values between 2.5 and 4 indicate medium adsorption potential, and values above 4 indicate high adsorption potential. Additionally, the pKa, determined by the functional group of a compound, plays a crucial role in the chemisorption and/or electrostatic adsorption of emerging contaminants. For instance, at a pH higher than the pKa, the phenolic hydroxyl group of compounds becomes negatively charged, leading to charge repulsion with negatively charged adsorbents [22]. This charge repulsion can also occur between negatively charged emerging contaminants and negatively charged adsorbents, hindering the removal of emerging contaminants. Considering the hydrophobicity, pKa, and other molecular properties of emerging contaminants is essential when selecting the appropriate adsorbent and designing effective adsorption processes for the removal of these contaminants from water systems.

Table 6.
Relationship parameters for emerging contaminants in adsorption.
The properties of emerging contaminants can significantly influence their behaviors during the adsorption process. Previous research has demonstrated that adsorption can effectively remove emerging contaminants [23,24,25,26]. However, only a limited number of studies have explored the relationship between adsorption and the properties of emerging contaminants [27]. Figure 5 illustrates the relationship between the pseudo-second-order rate constant (k2, g/mg·h) of emerging contaminants during adsorption and their properties in terms of log Kow. The results show a relatively linear correlation between the rate constant and log Kow (r2 = 0.5710). Previous studies have attempted to directly relate log Kow to observed adsorption rates and found such relations in systems containing hydrophobic solutes and a hydrophobic adsorbent [27]. Since the GAC surface properties generally appear hydrophobic, increasing log Kow values were associated with higher adsorption rates on GAC. Figure 6 depicts the relationship between the maximum adsorption capacity (qmax, mg/g) of emerging contaminants during adsorption and their properties in terms of pKa. The results show a relatively linear correlation between the removal of emerging contaminants during adsorption and pKa (r2 = 0.6055). High pKa values indicate strong acidity and correspond to high pHpzc values on the GAC surface. Consequently, adsorption capacity increased for contaminants with high pKa values. Emerging contaminants with both high pKa and log Kow values could be easily removed through adsorption, primarily due to electrostatic attraction with the positively charged adsorbent. These findings highlight the importance of considering the properties of emerging contaminants, such as log Kow and pKa, in predicting their adsorption behavior and designing effective adsorption processes for their removal from water systems. Understanding these relationships can aid in the selection of appropriate adsorbents and the optimization of adsorption systems for the removal of specific emerging contaminants.
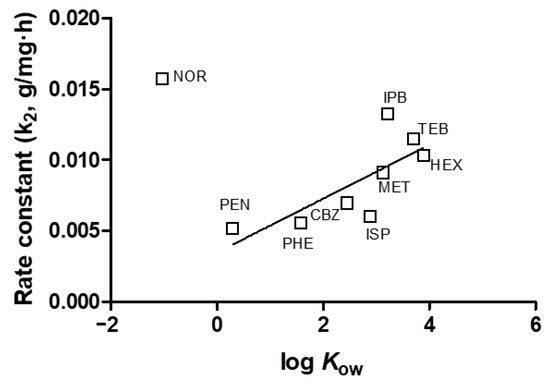
Figure 5.
Relationship between emerging contaminants pseudo 2nd order rate constant during adsorption and log Kow.
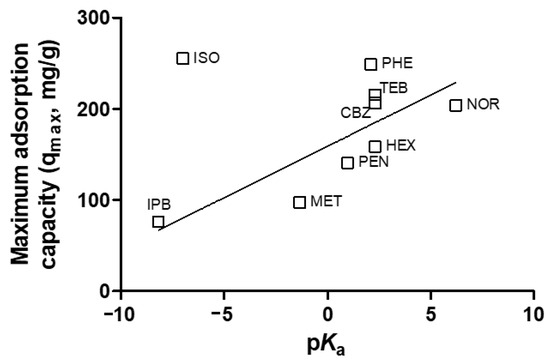
Figure 6.
Relationship between emerging contaminants maximum adsorption capacity during adsorption and pKa.
4. Conclusions
In this study, the adsorption potential of granular activated carbon (GAC) for nine emerging contaminants was investigated. The findings revealed that GAC achieved adsorption equilibrium within 12 h, with maximum adsorption capacities ranging from 76 to 206 mg/g. The adsorption processes were better described by the pseudo-second-order kinetic equation, and they were governed by outer diffusion at the initial stage, followed by inner diffusion during subsequent periods. The adsorption isotherms demonstrated that the adsorption of emerging contaminants adhered more closely to the Freundlich model than the Langmuir model. Furthermore, the molecular properties of the emerging contaminants, such as Kow and pKa, were correlated with their behaviors during adsorption, influencing the rate constant and maximum adsorption capacity of the removal process. Overall, the results from this adsorption study of granular activated carbon provide valuable insights for further exploring the effectiveness of the adsorbent in removing emerging contaminants.
Author Contributions
Conceptualization, D.P.; Methodology, S.-H.L. and N.K.; Invesigation, S.-H.L.; Data curation, S.-H.L. and N.K.; Writing-original drafe, S.-H.L. and N.K.; Review & editing, D.P. All authors have read and agreed to the published version of the manuscript.
Funding
This study was supported in part by the Korean Ministry of Environment as the Eco-Innovation Project (Global Top Project; GT-SWS-11-01-006-0), and this work was also partially supported by the Ministry of Education of Korea (2019R1A6A3A01096685).
Data Availability Statement
All data generated or analyzed during this study are included in this published article.
Conflicts of Interest
The authors declare no conflict of interest.
References
- Yu, Z.; Peldszus, S.; Huck, P.M. Adsorption characteristics of selected pharmaceuticals and an endocrine disrupting compound—Naproxen, carbamazepine and nonylphenol—On activated carbon. Water Res. 2008, 42, 2873–2882. [Google Scholar] [CrossRef] [PubMed]
- Farré, M.L.; Pérez, S.; Kantiani, L.; Barceló, D. Fate and toxicity of emerging pollutants, their metabolites and transformation products in the aquatic environment. TrAC Trends Anal. Chem. 2008, 27, 991–1007. [Google Scholar] [CrossRef]
- Daughton, C.G. Non-regulated water contaminants: Emerging research. Environ. Impact Assess. Rev. 2004, 24, 711–732. [Google Scholar] [CrossRef]
- Schriks, M.; Heringa, M.B.; van der Kooi, M.M.E.; de Voogt, P.; van Wezel, A.P. Toxicological relevance of emerging contaminants for drinking water quality. Water Res. 2010, 44, 461–476. [Google Scholar] [CrossRef] [PubMed]
- Bolong, N.; Ismail, A.F.; Salim, M.R.; Matsuura, T. A review of the effects of emerging contaminants in wastewater and options for their removal. Desal. 2009, 239, 229–246. [Google Scholar] [CrossRef]
- Comerton, A.M.; Andrews, R.C.; Bagley, D.M.; Yang, P. Membrane adsorption of endocrine disrupting compounds and pharmaceutically active compounds. J. Membr. Sci. 2007, 303, 267–277. [Google Scholar] [CrossRef]
- Rakić, V.; Rac, V.; Krmar, M.; Otman, O.; Auroux, A. The adsorption of pharmaceutically active compounds from aqueous solutions onto activated carbons. J. Hazard. Mater. 2015, 282, 141–149. [Google Scholar] [CrossRef]
- Rivera-Utrilla, J.; Sánchez-Polo, M.; Ferro-García, M.Á.; Prados-Joya, G.; Ocampo-Pérez, R. Pharmaceuticals as emerging contaminants and their removal from water. A review. Chemosphere 2013, 93, 1268–1287. [Google Scholar] [CrossRef]
- Rosal, R.; Rodríguez, A.; Perdigón-Melón, J.A.; Petre, A.; García-Calvo, E.; Gómez, M.J.; Agüera, A.; Fernández-Alba, A.R. Occurrence of emerging pollutants in urban wastewater and their removal through biological treatment followed by ozonation. Water Res. 2010, 44, 578–588. [Google Scholar] [CrossRef]
- Rodriquez-Narvaez, O.M.; Peralta-Hernandez, J.M.; Goonetilleke, A.; Bandala, E.R. Treatment technologies for emerging contaminants in water: A review. Chem. Eng. J. 2017, 323, 361–380. [Google Scholar] [CrossRef]
- Ho, Y.S.; McKay, G. Sorption of dye from aqueous solution by peat. Chem. Eng. J. 1998, 70, 115–124. [Google Scholar] [CrossRef]
- Weber, W.J.; Morris, J.C. Kinetics of adsorption on carbon from solution. J. Sanit. Eng. Div. 1963, 89, 31–60. [Google Scholar] [CrossRef]
- Tan, I.A.W.; Hameed, B.H.; Ahmad, A.L. Equilibrium and kinetic studies on basic dye adsorption by oil palm fibre activated carbon. Chem. Eng. J. 2007, 127, 111–119. [Google Scholar] [CrossRef]
- Tseng, R.-L.; Wu, F.-C. Inferring the favorable adsorption level and the concurrent multi-stage process with the freundlich constant. J. Hazard. Mater. 2008, 155, 277–287. [Google Scholar] [CrossRef]
- Khan, M.A.; Lee, S.-H.; Kang, S.; Paeng, K.-J.; Lee, G.; Oh, S.-E.; Jeon, B.-H. Adsorption studies for the removal of methyl tert-butyl ether on various commercially available gacs from an aqueous medium. Sep. Sci. Technol. 2011, 46, 1121–1130. [Google Scholar] [CrossRef]
- Lu, S.; Song, Z.; He, J. Diffusion-controlled protein adsorption in mesoporous silica. J. Phys. Chem. B 2011, 115, 7744–7750. [Google Scholar] [CrossRef]
- Gao, Q.; Zhu, H.; Luo, W.-J.; Wang, S.; Zhou, C.-G. Preparation, characterization, and adsorption evaluation of chitosan-functionalized mesoporous composites. Microporous Mesoporous Mater. 2014, 193, 15–26. [Google Scholar] [CrossRef]
- Vinhal, J.O.; Lage, M.R.; Carneiro, J.W.M.; Lima, C.F.; Cassella, R.J. Modeling, kinetic, and equilibrium characterization of paraquat adsorption onto polyurethane foam using the ion-pairing technique. J. Environ. Manag. 2015, 156, 200–208. [Google Scholar] [CrossRef]
- Saeed, M.M.; Rusheed, A.; Ahmed, N. Modeling of iron adsorption on htta-loaded polyurethane foam using freundlich, langmuir and d-r isotherm expressions. J. Radioanal. Nucl. Chem. 1996, 211, 283–292. [Google Scholar] [CrossRef]
- Foo, K.Y.; Hameed, B.H. Insights into the modeling of adsorption isotherm systems. Chem. Eng. J. 2010, 156, 2–10. [Google Scholar] [CrossRef]
- Rogers, H.R. Sources, behaviour and fate of organic contaminants during sewage treatment and in sewage sludges. Sci. Total Environ. 1996, 185, 3–26. [Google Scholar] [CrossRef] [PubMed]
- Schäfer, A.I.; Akanyeti, I.; Semião, A.J.C. Micropollutant sorption to membrane polymers: A review of mechanisms for estrogens. Adv. Colloid Interface Sci. 2011, 164, 100–117. [Google Scholar] [CrossRef]
- Boyd, G.R.; Reemtsma, H.; Grimm, D.A.; Mitra, S. Pharmaceuticals and personal care products (ppcps) in surface and treated waters of Louisiana, USA and Ontario, Canada. Sci. Total Environ. 2003, 311, 135–149. [Google Scholar] [CrossRef] [PubMed]
- Loraine, G.A.; Pettigrove, M.E. Seasonal variations in concentrations of pharmaceuticals and personal care products in drinking water and reclaimed wastewater in southern california. Environ. Sci. Technol. 2006, 40, 687–695. [Google Scholar] [CrossRef] [PubMed]
- Ternes, T.A.; Meisenheimer, M.; McDowell, D.; Sacher, F.; Brauch, H.-J.; Haist-Gulde, B.; Preuss, G.; Wilme, U.; Zulei-Seibert, N. Removal of pharmaceuticals during drinking water treatment. Environ. Sci. Technol. 2002, 36, 3855–3863. [Google Scholar] [CrossRef]
- Vieno, N.M.; Härkki, H.; Tuhkanen, T.; Kronberg, L. Occurrence of pharmaceuticals in river water and their elimination in a pilot-scale drinking water treatment plant. Environ. Sci. Technol. 2007, 41, 5077–5084. [Google Scholar] [CrossRef]
- Westerhoff, P.; Yoon, Y.; Snyder, S.; Wert, E. Fate of endocrine-disruptor, pharmaceutical, and personal care product chemicals during simulated drinking water treatment processes. Environ. Sci. Technol. 2005, 39, 6649–6663. [Google Scholar] [CrossRef]
Disclaimer/Publisher’s Note: The statements, opinions and data contained in all publications are solely those of the individual author(s) and contributor(s) and not of MDPI and/or the editor(s). MDPI and/or the editor(s) disclaim responsibility for any injury to people or property resulting from any ideas, methods, instructions or products referred to in the content. |
© 2023 by the authors. Licensee MDPI, Basel, Switzerland. This article is an open access article distributed under the terms and conditions of the Creative Commons Attribution (CC BY) license (https://creativecommons.org/licenses/by/4.0/).


