Article

Mycotoxins and Maize Value Chain: Multi-Matrix and Multi-Analyte Tools towards Global Feed and Food Safety

1
Faculty of Pharmacy, University of Coimbra, Health Science Campus, Azinhaga de Santa Comba, 3000-548 Coimbra, Portugal
2
National Institute for Agricultural and Veterinary Research (INIAV), Rua dos Lágidos, Lugar da Madalena, 4485-655 Vila do Conde, Portugal
3
Associated Laboratory for Green Chemistry of the Network of Chemistry and Technology (REQUIMTE/LAQV), Rua D. Manuel II, Apartado 55142, 4051-401 Oporto, Portugal
*
Author to whom correspondence should be addressed.
Separations 2023, 10(9), 486; https://doi.org/10.3390/separations10090486
Submission received: 31 July 2023 / Revised: 31 August 2023 / Accepted: 2 September 2023 / Published: 5 September 2023

Abstract

:
Maize value chains represent invaluable end-consumer products in food systems worldwide. Mycotoxin contamination along these chains causes severe economic and health impacts from the plant, animal and human safety points of view. This work aimed to develop a single standardized methodology that fulfilled extraction and detection procedures for 22 mycotoxins in maize chain matrices. The main goal concerned the validation of a QuEChERS-based ultra-high-performance liquid chromatography coupled to the tandem mass spectrometry (UHPLC-MS/MS) method in compliance with established performance criteria for mycotoxin determination. Validation parameters encompassing specificity/selectivity, linearity, precision, recovery, Limits of Detection (LOD) and Limits of Quantification (LOQ) were evaluated, and acceptable data were found for all the mycotoxins in the matrices under study, namely, seeds, flowering plants, silage and feed. The applied method presented LODs and LOQs lower than 40.3 and 42.1 ng g−1, respectively, and recoveries ranging from 80.7 to 118.1%, with precision values below 20.5%. A first-time full analytical procedure in a multi-matrix and multi-analyte approach was successfully validated, representing a valuable control tool for mycotoxin monitoring in maize chains. This approach will ultimately allow a response to the need for integrated risk assessments encompassing full, comprehensive analysis of whole food chains in compliance with the maximum levels established in European regulations, and the establishment of accurate solutions in each chain-specific critical point, helping to provide more sustainable, safer and healthy food systems.

1. Introduction

Cereal supply chains are critically important from the increasing population and food security points of view, confirming the need for cereal productivity growth in the coming years to ensure adequate calorie and protein intake in human diets. Maize is one of the worldwide cereal crops that provides these necessary dietary components, and that can help to address problems of undernutrition, micronutrient malnutrition and overnutrition [1,2]. This cereal is one of the four main crops that make up the total production of primary crops with a high societal and economic impact [2,3]. New strategies have been applied to maize production, with an overall global food security improvement as a main target. This has led to new production processes that increase maize productivity by breeding varieties with specific characteristics, such as high-yield, stress-tolerant and adaptation features, while performing new farming practices [1]. Global maize production is a very complex food chain, forming part of the process of different heavily consumed end products, both directly (e.g., processed cereals) or indirectly (e.g., meat, milk). Its production has trebled in the period from 2000 to 2019, making it the second most produced crop worldwide [3]. Average annual global maize production is 1.1 billion tons, with 61% used for livestock feed, 17% for biofuel use, 13% for human consumption and 9% for other industrial uses [1].
Along this food chain system, raw, intermediate and end-product materials can be colonized by fungal species and, consequently, contaminated by mycotoxins, with severe socio-economic and health impacts for farmers, livestock workers and the general population. Such contamination can occur either in the field or in post-harvest settings, with direct losses in crops, production profitability, product safety, and plant, animal and human health [4,5]. These negative effects are not stage-specific since the appearance and bioaccumulation of these toxic compounds represent their own “mycotoxin chain”. As the supply chain progresses, mycotoxin contamination increases in rate, frequency and intensity, which leads to levels that exceed the maximum tolerable threshold levels defined by Commission Regulations (EC) No. 1881/2006 and No. 1126/2007, Commission Recommendations No. 2013/165/EU and No. 2006/576/EC and Directive 2002/32/EC [6,7,8,9,10]. Due to the worldwide and broad-ranging nature of the issue, control, management and prevention strategies, as well innovative solutions for mycotoxin decontamination, have been developed, but most of these are considered and applied up-front at the animal feeding and product processing stage, with little focus on seed systems and agricultural fields, i.e., on plant growth stages from the vegetative (V) to the reproductive stage (R) [11]. However, agricultural crops represent the basis for the presence of different mycotoxins and the point of mycotoxin entry in the feed and food chain [12]. Moreover, in many regions of developing and low-income countries, and in smallholder farming facilities, the field maize produced is directly consumed without any processing or industrial interference, even though this is a crucial stage for mycotoxin contamination and starting the bioaccumulation process. Accordingly, further research is needed on mycotoxin occurrence and its impact on soil and plants, and on the development of seed-to-seedling and maize plant growth strategies for the prevention and/or reduction of mycotoxin levels.
The validation of analytical methods that can determine multiple mycotoxins from a multi-analyte point of view and as a multi-matrix process is crucial for comprehensive and accurate assessments throughout the food value chain, consequently allowing the development of mitigation and/or prevention strategies for the reduction of these toxic compounds in the different stages of the chain. Officially validated methods for regulating mycotoxins in maize, established by the European Committee for Standardization and the Association of Official Analytical Chemists, are already available [13]. However, these methods concern only a few mycotoxins, namely, aflatoxins (AFs) such as aflatoxin B1 (AFB1), aflatoxin B2 (AFB2), aflatoxin G1 (AFG1) and aflatoxin G2 (AFG2), fumonisins (FBs) such as fumonisin B1 (FB1), fumonisin B2 (FB2) and fumonisin B3 (FB3), ochratoxin A (OTA), deoxynivalenol (DON) and zearalenone (ZEA), and are limited to method principles comprising enzyme-linked immunosorbent assay, thin-layer chromatography, fluorimetry and high-performance liquid chromatography. To enforce the regulatory thresholds set by the European Commission, and to assess and manage the continuously changing mycotoxin patterns, which include the introduction of new incident mycotoxins with relevance from the safety and economic points of view—the so-called emerging mycotoxins—it is very important to establish accurate and precise performance criteria that lead towards the validation of new, rapid and green analytical methodologies that include all the steps needed for a food security enhancement.
The aim of the present study was to validate a single new approach for the detection of regulated mycotoxins, including AFs, FBs, OTA and ZEA, as well as emerging mycotoxins, such as beauvericin (BEA), enniatins (ENNs) and moniliformin (MON), using the gold-standard method for multi-compound analysis—ultra-high-performance liquid chromatography coupled to tandem mass spectrometry (UHPLC-MS/MS)—in agricultural field and dairy farm samples encompassing the maize feed and food chain. The method was then applied to real samples from Portuguese agricultural crop cultivars and dairy farms to assess the presence of mycotoxins in the samples, giving a new insight into mycotoxin behavior in field and farm practices.

2. Materials and Methods

2.1. Materials, Reagents and Standard Solutions

The materials used in the present work included SPE C18 sorbent (Agilent Technologies, Santa Clara, CA, USA), Gemini NX C18 110 Å 3.0 μm (100 × 2.0 mm i.d.) separation column (Phenomenex, Torrance, CA, USA) and HPLC vials and Syringeless Device Mini UniPrep filters (0.45 µm PVDF, polypropylene) (Whatman, Maidstone, UK). The solvents used included ultrapure H2O obtained from Millipore System (Darmstadt, Germany), acetonitrile (ACN) from Carlo Erba (Val de Reuil, France) and formic acid from Chem-Lab (Zedelgem, Belgium); the general reagents included anhydrous magnesium sulfate (MgSO4), sodium chloride (NaCl) and methanol (MeOH) supplied by Honeywell (Seelze, Germany).
The mobile phase solvents were of high-performance liquid chromatography (HPLC) grade and the remnant reagents were of analytical grade. The mycotoxin standards were acquired from Sigma-Aldrich (Steinheim, Germany), namely AFB1, AFG1 and AFM1 (from Aspergillus flavus, ≥98% purity), AFB2 and AFG2 (≥98% purity), BEA (≥97% purity), citrinin (CIT) (from Penicillium citrinum, ≥98% purity), DON (≥98% purity), enniatin A (ENNA) and enniatin B (ENNB) (from Gnomonia errabunda, ≥95% purity), FB1 and MON sodium salt (from Fusarium moniliforme, ≥98% purity), FB2 (from Fusarium moniliforme, ≥96% purity), HT-2 toxin (≥98% purity), OTA (from Petromyces albertensis, ≥98% purity), patulin (PAT) (≥98% purity), T-2 toxin (from Fusarium sp., ≥98% purity), tenuazonic acid (TEA) (≥98% purity), tentoxin (TTX) (from Alternaria tenuis, ≥95% purity) and ZEA (≥99% purity). Additional materials were sourced from Supelco (Bellefonte, PA, USA), including mycophenolic acid (MPA) (≥98.5% purity) and nivalenol (NIV) (≥98% purity), and from Santa Cruz Biotechnology (Dallas, TX, USA), namely, penicillic acid (PA) (Supplementary Materials S1 and S2). All the analytical standards were prepared in ACN 100% (v/v), excluding the FBs, which were prepared in ACN:H2O (50:50, v/v), and OTA, AFB1 and G2, which were prepared in MeOH 100% (v/v). Moreover, 1 mg per mL stock solutions were further diluted to achieve a multi-mycotoxin standard solution in ACN:H2O (80:20, v/v) for spiking procedures, and stored in amber vials at −20 ± 2 °C, protected from light. The blank samples of seeds (2.0 ± 0.1 g), flowering plants, forage, silage and animal feed (5.0 ± 0.1 g) were fortified by adding appropriate amounts of the multi-standard solution for method validation.

2.2. Instrumentation
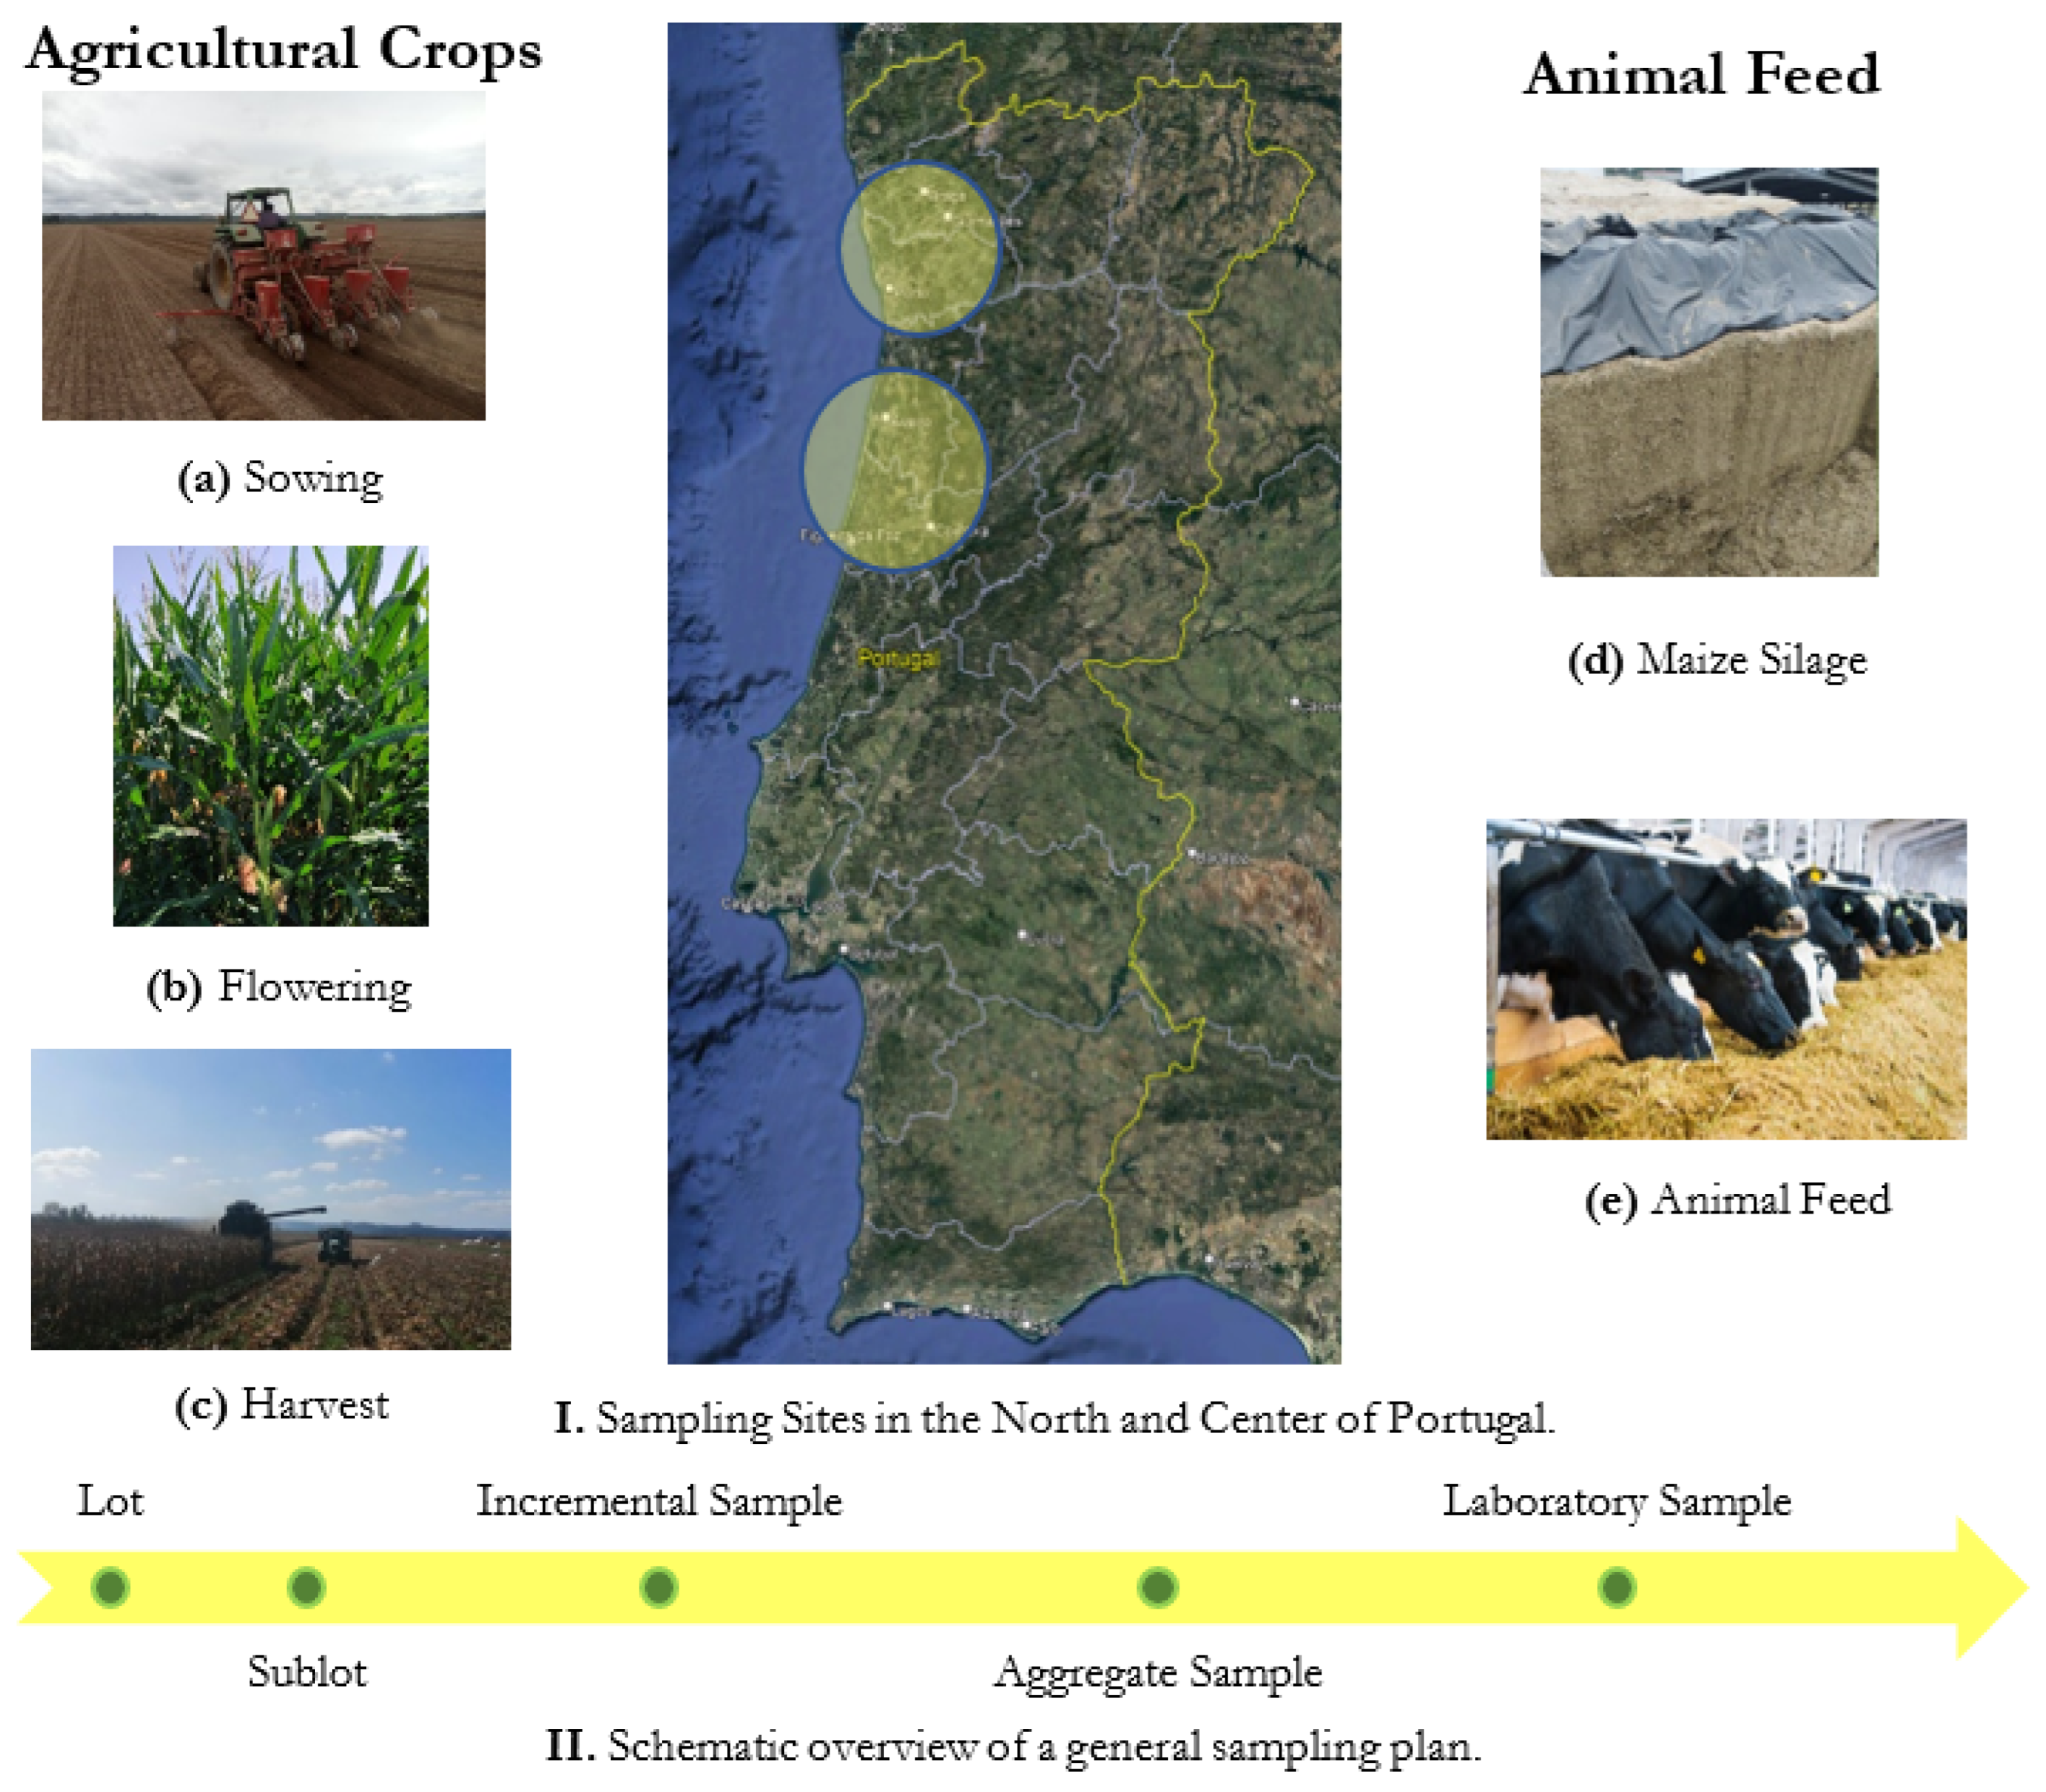
Chromatographic separation and mass spectrometry determination were accomplished by using a liquid chromatographic system coupled to a tandem mass detector (UHPLC-MS/MS), characterized by an UHPLC Nexera X2 Shimadzu system (AB Sciex, Foster City, CA, USA) coupled to a QTRAP 5500+ detector (AB Sciex, Foster City, CA, USA). An electrospray ion source (ESI) was operated in positive and negative ion modes in a single run (ESI+/ESI−) with data acquisition performed in Multiple Reaction Monitoring (MRM) and data processing by MultiQuantTM software (AB Sciex, Foster City, CA, USA). The MRM conditions were optimized according to Leite et al. (2023) [14]. The UPHLC system consisted of a variable-volume autosampler with a refrigeration system, a binary pump and a thermostatic column compartment with an analytical reverse-phase Gemini NX C18 110 Å 3.0 μm (100 × 2.0 mm i.d.). A mobile composition of (A) 0.1% formic acid and (B) acetonitrile was used at a flow rate of 0.2 mL min−1 and with a gradient elution protocol of 95% A to 30% A (15 min), 30% A to 0% A (5 min, 2 min hold) and 0% A to 95% A (3 min). A volume of 20 μL per sample was injected into the analytical column, with a total run time of 25 min. The autosampler and column compartment were maintained at 10 and 30 °C, respectively.

2.3. Samples

All the samples were obtained from agricultural crops and dairy farms from Portugal (Figure 1). The seeds, flowering plants and forage maize samples were collected from several agricultural producers in the northern and central regions of Portugal in 2019. Silage maize and complete animal feed were collected from the main Portuguese dairy region in the north of Portugal, in the years 2020 and 2021. A sampling plan was previously established according to Commission Regulation (EC) No. 401/2006 on the official control of the levels of mycotoxins in foodstuffs to guarantee the precision of the determination of the levels of mycotoxins, which are heterogeneously distributed in a lot [15]. For the flowering plants, since these are not described in the regulation, the sampling plan was defined considering the dimensions of the agricultural fields, namely, for fields larger than 5 hectares, 100 samples were individually and randomly collected covering the full area, while for fields of less or equal to 5 hectares, 25 samples were collected. All the samples were collected with appropriate sterile material and stored in sterile bags.

2.4. Sample Preparation

Sample preparation was performed and adjusted according to Leite et al. (2023) [14]. This step was performed in all complete volume samples by grinding in the laboratory with 1 and 5 mm sieves. The freshly ground matrices were weighed (2.0 ± 0.1 g for seeds; 5.0 ± 0.1 g for flowering plants, forage, silage and animal feed) into a 50 mL centrifuge tube. An initial extraction solvent consisting of ACN:H2O (80:20, v/v) was added to the samples in a volume of 20 mL and homogenized in a rotary shaker for 60 min at room temperature.
A salting-out step for water removal by subsequently adding a mixture of 0.5 g of NaCl and 2.0 g of MgSO4 to the samples (1:4, w/w) was performed. After homogenization for 1 min by vortex, a centrifugation step at 4500× g for 10 min at 4 °C was completed. Next, 10 mL of the organic layer was collected and transferred to a dSPE tube with 150 mg C18 and 900 mg MgSO4, with subsequent shaking by vortex and centrifugation at 4500× g for 10 min at 4 °C. The final extract was submitted to an evaporation step to complete dryness under nitrogen at 40 °C, using a Turbovap Zymark Evaporator system (Hopkinton, MA, USA). The dried residue was reconstituted in 500 µL of ACN 40%, and 500 µL extract solution was filtered to HPLC vials. Then, 20 µL of the reconstituted extract was injected into the UHPLC-MS/MS system. Prior to the validation process, the samples were tested for blank matrices to be used as quality control (QC) and for spiking purposes.

2.5. Method Validation

In-house validation was performed in compliance with performance criteria guidelines defined by the European Commission (EC), European Medicines Agency (EMA) and Food and Drug Administration (FDA) [15,16,17,18,19], which require evaluation of the analytical methodology regarding specificity/sensibility, linearity, precision, recovery and Limits of Detection and Quantification (LOD and LOQ, respectively) for identification and quantification purposes regarding regulated, non-regulated and emerging mycotoxins in samples from maize agricultural fields and dairy farms. Twenty blank samples per matrix from different sources were analyzed to evaluate possible interferents with the analytes under study at their respective retention time (R.T.) to assess the specificity and sensitivity of the method. The corresponding blank matrices were homogenized to a single bulk sample as quality control (QC) and further spiked with a multi-standard solution to evaluate the signal-to-noise ratios of 3:1 and 10:1 for LOD and LOQ determination, respectively. The QC samples were spiked at five concentration levels to assemble calibration curves, thus allowing the assessment of linearity according to the method of least squares and the respective correlation coefficients (R2). Replicates of the spiked QC samples at medium concentration level (ML) (n = 6) were analyzed for determination of the method’s precision, expressed as the coefficient of variation (%). Recovery was estimated on the basis of trueness by the analysis of the aforementioned replicates, estimated as the ratio between the measured concentration and the spiking level (theoretical concentration).

3. Results and Discussion

Major challenges in multi-mycotoxin determination are represented by the complexity of the different feed and food matrices, leading to the potential carry-over of matrix components, and by the very low concentration levels at which they can occur, frequently found in the µg kg−1 range; consequently, this can lead to the sample preparation undertaking co-extraction of a wide range of chemical compounds [20]. To respond to such challenges, a previous optimization process was thoroughly performed regarding a defined scope of mycotoxins characteristic of the maize value chain [14]. In this previous work, different extraction/clean-up procedures were tested, including appropriate extraction solvents for the target compounds, with QuEChERS technology representing the best option for mycotoxin extraction. Although SPE showed comparable results, the cost and time-effectiveness of QuEChERS-based methods have made it a frequent choice for mycotoxin analysis in foodstuffs [21]. On this basis, a new methodology was extended and applied to further studies as a starting point for the analysis of seeds, flowering plants, silage maize and animal feed, to achieve an innovative multi-matrix and multi-analyte standardized methodology. All the preparations were performed on the basis of guaranteeing a homogenization of the samples, with further extraction and clean-up being performed on representative subsamples of 2.0 ± 0.1 g for the seeds and 5.0 ± 0.1 g for the flowering plants, silage and animal feed. An initial solid–liquid extraction using an organic extractant composed of ACN 80% with an aqueous portion of 20% was therefore used in this work, since, in terms of recovery, this represents the equilibrium required for the extraction of, for example, AFs, OTA, ZEA and trichothecenes (TCTs) (soluble in organic solvents), and, simultaneously, acidic compounds, namely, FBs and MPA (soluble in aqueous phase) in different food matrices [22,23,24]. The addition of ACN as the organic solvent selected, besides its recognizable extraction efficiency, is also an important promotor of protein precipitation, allowing a cleaner extract, being similarly reported in other studies for mycotoxin extraction in comparison with MeOH [25,26,27]. Water removal was further accomplished by adding the common QuEChERS inorganic salts, namely, MgSO4 and NaCl, to the previous extract in a ratio of 4:1. Several authors report the use of this technique without the additional dispersive Solid-Phase Extraction (dSPE) step, which allows the analysis of a wider range of polarities, though it may result in increased LOQs. In this work, dSPE was included to promote better sensitivity and specificity, as well as higher purification of the extract. For this step, selection of the type of sorbent used is also crucial for a positive effect of the clean-up procedure to accomplish good recoveries of the analytes under study. The use of the C18 sorbent for dSPE was chosen due to its inherent properties concerning the removal of fatty and organic acids, lipids and non-polar interferents, whilst the Primary Secondary Amine application was not considered due to its low recoveries in mycotoxins containing carboxylic groups, such as CIT, FBs and OTA, as reported in our previous study and in other published studies [14,28,29]. The final extraction was followed by a concentration step achieved by complete evaporation under a N2 stream and reconstituted in the mobile phase for further UHPLC-MS/MS analysis.
The use of these LC-MS/MS methods has been increasing over recent decades due to their ability as multi-analyte and multi-class platforms, with QTRAP mass spectrometric analyzers ensuring compliance with performance criteria established by regulatory entities, since they combine the quantitative workflow ability of a tripe quadrupole analyzer (QqQ) with the sensitivity advantages of multi-functional linear ion trap. In the analytical area concerning mycotoxins, the first reported multi-analyte method dates back to 2006, describing a validation process for 39 mycotoxins in wheat and maize, including A- and B-TCTs, ZEA and related derivatives, FBs, OTA, AFs and the emerging mycotoxins BEA and ENNs [24]. Chromatographic and detection parameters were previously optimized [14] by using the gold-standard technique, UHPLC-QTRAP-MS/MS, identifying mobile phase composition, flow rate and gradient elution program as the most suitable for the determination of the 22 analytes under study in a single run of 25 min, operating simultaneously in both ESI+ and ESI− modes. The use of formic acid in the mobile phase was used as a promoter of positive ionization, therefore improving the detection of ESI+ compounds. Performance criteria were fulfilled by following the respective regulatory guidelines for validation purposes, with identification criteria defined as two ion transitions for each compound, as thoroughly described below. Matrix-matched calibration was chosen as a calibration approach to address the possible matrix effects that can affect the ionization efficiency of the analytes due to the use of ESI sources for quantitative analysis by LC-MS/MS methods.
The remainder of this section is divided by subheadings. It provides a concise and precise description of the experimental results and their interpretation, as well as the experimental conclusions that can be drawn.

3.1. Method Validation

A QuEChERS-based UHPLC-MS/MS method was validated for mycotoxins, including regulated, non-regulated and emerging mycotoxins, in maize agricultural field samples as well as in dairy farm samples. Experimental verification for fulfillment of the specific requirements of the developed method was in accordance with the regulatory frameworks for regulated mycotoxins, namely Commission Regulation (EC) No. 401/2006 and Commission Regulation (EU) No. 519/2014, which establishes the performance criteria for sample preparation and the methods of analysis for mycotoxins in feed and foodstuffs, specifically for AFB1, the sum of AFs (AFB1, AFB2, AFG1, and AFG2), OTA, PAT, DON, ZEA, FB1 and FB2, T-2 and HT-2 toxins, and CIT [15,18]; and, for the non-regulated and regulated mycotoxins, the performance of analytical methods was carried out in compliance with the ICH guidelines and CIR 808/2021 [19,30]. In this regard, the following performance criteria were assessed to demonstrate the method’s validation for each sample type: specificity/selectivity, Limits of Detection (LOD) and Limits of Quantification (LOQ), linearity, precision and recovery. To accomplish this assessment in line with the application of a matrix-matched approach, all types of matrices used in this work were initially evaluated for blank samples by submitting such samples to the previously described method. After proper identification, the validation process followed as further described. Complete performance criteria data are presented in the following tables for the maize seeds (Table 1), flowering plants (Table 2), maize silage (Table 3) and animal feed (Table 4).

3.1.1. Method Specificity and Selectivity

Individual blank matrices from different origins were analyzed to prove the ability of the method to assess unequivocally the target compounds in the presence of matrix interferents, by the injection of non-spiked blank samples and corresponding spiked blank samples. The method was revealed to be specific and selective for all the matrices for each mycotoxin in analysis since no interfering peaks at a S/N > 3 were within a range of ±0.5 min of the retention time (R.T.) in the blank samples, and, simultaneously, the direct relation between the measured signal of spiked samples to the target compound was guaranteed, thus allowing an accurate identification and quantification of the compounds. The identification criteria were therefore fulfilled and, consequently, the method’s specificity and selectivity were proven, which ultimately gave rise to a single bulk of blank samples for each matrix to be used in the subsequent validation steps.

3.1.2. Limits of Detection (LOD) and Limits of Quantification (LOQ)

Twenty blank QCs were sampled for background intensity analysis at the respective RT for each mycotoxin [14] to evaluate the limits of the method concerning its ability to detect (LOD) and quantify (LOQ) the compounds under study in the seeds, flowering plants, maize silage and animal feed. As shown in Table 1, Table 2, Table 3 and Table 4, this method allowed the determination of trace levels of mycotoxins in four matrices, with LOD and LOQ values ranging from 0.03 to 40.3 and from 0.04 to 42.1 ng g−1, respectively. In line with the EU maximum permitted and guidance levels for regulated mycotoxins in foodstuffs and animal feed, all the presented values were below the defined limits, which demonstrates the method’s ability to detect these compounds at levels compliant with the regulations for control purposes. According to the European Commission (2019), the EU permitted levels of AFB1 are set at 20 ng g−1 for feed materials, 10 ng g−1 for complete feed and 5 ng g−1 for compound feed for dairy cattle, these being the lowest levels established in these matrices [10]. The LOD and LOQ of AFB1 ranged between 1.31 (seeds) and 2.71 (flowering plants) ng g−1 and between 1.58 (seeds) and 7.77 (maize silage) ng g−1, respectively. For DON, guidance levels are established for products intended for animal feed, which range from 5000 to 8000 ng g−1. The limits obtained for this mycotoxin are approximately 300–500-fold lower than the established limits, with average values of 15.92 and 20.97 ng g−1 for LOD and LOQ, respectively. Guidance limits are also established for feed materials and complete feed regarding ZEA (2000 ng g−1), the sum of HT-2 and T-2 toxins (250 to 500 ng g−1), OTA (250 ng g−1) and total FBs (60,000 ng g−1), with values that are capable of detection by the validated method in this work.
Overall, the LODs were in the range 0.53–40.30 ng g−1 for the seeds, 0.09–17.90 ng g−1 for the flowering plants, 0.03–15.21 ng g−1 for the silage maize and 0.03–15.70 ng g−1 for the complete animal feed. To the best of the authors’ knowledge, this is the first validation method to have demonstrated the determination of mycotoxins in seeds and flowering plants; therefore, it is not possible to make a comparison with other studies. Nevertheless, concerning the method validation for silage maize and complete animal feed, the values obtained are in line with other published works. For instance, Panasiuk et al. [26] obtained LOD and LOQ values of 0.06–15 ng g−1 and 0.2–50 ng g−1, respectively, for 24 mycotoxins in maize silage, including emerging mycotoxins. In another study including these matrices for feed purposes, much higher values were obtained, ranging from 5 to 348 ng g−1 and from 11 to 695 ng g−1 for LOD and LOQ, respectively, concerning the determination of 26 analytes [31]. In a more mycotoxin-specific approach using Mycospin 400 columns for silage matrices, the LOD and LOQ values obtained were, respectively, between 0.02 and 17.1 ng g−1 and between 0.06 and 57 ng g−1 [32].
In our work, NIV presented the highest LODs, with values above 11.7 ng g−1 in all the matrices, while DON presented high LODs in the seeds and silage maize at values of 40.30 and 14.82 ng g−1, respectively. The LOD values were also greater in the seeds and silage maize, with 5 analytes presenting values above 10.64 (TEA) and 11.05 (HT-2 toxin) ng g−1, respectively, for each matrix. Notwithstanding these findings, average values of LOD of 6.85, 5.07, 5.24 and 3.70 ng g−1 were found for the seeds, flowering plants, maize silage and complete feed, respectively, with minimum values of 0.03 ng g−1 for ENNB in both the maize silage and animal feed, 0.09 for BEA in the flowering plants and 0.53 ng g−1 in the seeds. Background noise, accounting for the higher LOD values in the seeds, was observed, which could have occurred not only because of the complexity of this matrix, but also since these matrices are characterized by being treated with high amounts of pesticides for preservation and storage until the seedling phase. In this matter, the LOQ values for the seed matrices were also between 1.00 (ENNA) and 42.13 (DON) ng g−1, with an average of 11.73 ng g−1 for all the compounds. The flowering plants, silage and complete feed presented ranges lower than those for the seed matrices, with ranges of 0.21 (BEA)–26.31 (FB1), 0.05 (ENNB)–33.82 (TEA), and 0.04 (ENNB)–32.27 (NIV) ng g−1, respectively.

3.1.3. Calibration and Linearity

For linearity purposes, a five-point calibration curve was prepared by spiking blank samples with successive dilutions of a standard mix solution to obtain the defined working ranges for each mycotoxin. The response function of the analytical procedure was assessed by measuring the relationship between the measured signal of the spiked samples in terms of peak area, with defined concentrations of the analytes of interest within suitable concentration ranges per mycotoxin [33]. The mathematical relationship between the two parameters is represented by calibration curves through the least square model (Table 1, Table 2, Table 3 and Table 4), which was showed to be linear for all compounds, with R2 values higher than 0.95 for most compounds. In the seed samples, PAT and ZEA presented values of 0.92 and 0.94, respectively; in the silage, values of 0.92 and 0.90 were obtained for OTA and TEA; and, for the animal feed, values of 0.94 and 0.93 were obtained for BEA and DON. An appropriate response function was therefore obtained considering the range of chemically different compounds, which allows accurate measurements of mycotoxins in the matrices represented in this study. Overall, good linearity values were obtained for the majority of the mycotoxins and corresponding matrices, with values ranging from 0.920 (pat) to 0.998 (T-2) for the seeds (Table 1), 0.967 (BEA) to 0.999 (HT-2 toxin) for the flowering plants (Table 2), 0.902 (TEA) to 0.996 (FB1) for the silage and 0.928 (DON) to 0.996 (PA) for the complete animal feed (Table 4).
The matrix-matched approach applied allowed the construction of calibration curves spiked at five concentration levels for each mycotoxin, thus resulting in the attainment of good linearities for further quantitative measures, while compensating for the possible effects of the matrix components on the LC-MS/MS analysis [34].

3.1.4. Precision and Recovery

Precision was evaluated as the coefficient of variation (CV) (%) at the medium concentration level (ML) with overall values lower than 20.5%. Higher variation was found in the seed samples, namely for the HT-2 toxin (20.5%), though the regulated RSDr is 30% for this mycotoxin at the evaluated concentration level. The CV values for the animal feed were below 10.61% (TTX), for the silage they were below 10.91 (TEA) and for the flowering plants they were below 19.07% (OTA). The variation values were compliant with the regulatory frameworks, thus confirming the fulfillment of the acceptance criteria for all compounds at the specific concentration levels for seeds, flowering plants, silage and complete feed.
The evaluation of recovery, expressed in percentage units, was also set at the ML. The recovery values varied between 80.7 and 118.1%, also fulfilling the performance criteria as defined by Commission Regulation No. 401/2006 and Commission Regulation No. 519/2014 [15,18] for regulated mycotoxins, and by CIR 808/2021 for non-regulated and emerging mycotoxins, except for PAT in the seeds, which presented a recovery of 110.3%, with the regulatory limit established at 105.0% for levels higher than 50 ng g−1. Nonetheless, the method displays acceptable recovery values for validation purposes for all the other mycotoxins in the four matrices under analysis.

3.2. Application to Real Samples

Mycotoxin contamination can begin at the first stage of crop cultivation, the sowing stage, which can contribute to a seed-to-seedling contamination process due to contaminated seeds subsequently resulting in infected plants and production [35]. As a standard, maize seeds are treated with a fungicide and, frequently, with an insecticide, or with both. This treatment is to ensure the protection of emerging seedlings from soil-borne fungal diseases and insect pests. Nonetheless, “raw” seeds intended for sowing are already contaminated by mycotoxins in the field. At the growing cultivation stage as well as in storage, harvested plants and maize silage are contaminated with different mycotoxins, whose composition is ultimately transferred to animal feed, forming a bulk of mycotoxins known to cause severe adverse effects in animal health, thus possibly being carried over to final consumer products. Assessing the mycotoxin profile at the outset and throughout the food chain is therefore crucial for the understanding of these current changing patterns, and the present work is the first to conduct this analysis.
Regarding the overall occurrence data, regulated and emerging mycotoxins were identified in all the types of samples. At the sowing stage (n = 3), only one regulated mycotoxin, ZEA, was found to be present, with a percentage of positive samples of 76%. Regarding emerging mycotoxins, the presence of ENNs and BEA was identified, with the latter presenting the highest percentage of occurrence (100.0%). FB1 was found in all the maize silage samples (n = 11) (100.0%), with 81.8% of the samples also presenting FB2. The occurrence of ENNs and BEA was also observed for this stage of the maize value chain, with 100.0% of samples positive for ENNB and BEA. The mycotoxin TTX was identified in nine samples (81.8%).
In the samples from two dairy farms, namely, grass silage, maize silage and animal feed, high contamination was found at the level of the maize silage, with a consequent major contribution to the occurrence of mycotoxins in the final product, the complete animal feed. Overall, the highest percentage of positives (100.0%) was found for the mycotoxins FB1 and FB2 in the maize silage, DON in the animal feed, ENNB in all the samples analyzed, and BEA and TTX in the maize silage and animal feed. Other mycotoxins were identified with occurrence percentages higher than 40%.

4. Conclusions

To achieve an integrated approach to controlling mycotoxin contamination throughout food value chains, it is necessary to develop and optimize analytical methods that include the several matrices that characterize such chains. The validation of methods that allow not only multi-analyte analysis but also a uniformized extraction and determination process for several matrices contributes to a full and comprehensive assessments of these stable hazardous compounds. In this matter, a single standardized method was validated by incorporating 22 mycotoxins, including regulated, non-regulated and emerging mycotoxins that are known to be ubiquitous in raw and intermediate crop materials, storage, processing and end products in the maize value chain. Samples of seeds for sowing, flowering plants, maize silage and animal feed were submitted to a sensitive and reproducible method by a QuEChERS-based protocol followed by UHPLC-MS/MS. The method was successfully validated according to international guidelines and compliant performance criteria data were achieved for linearity, recovery, precision, LOD, LOQ and robustness. This study also revealed, as a preliminary qualitative assessment, the presence of regulated and emerging mycotoxins in representative samples along the maize value chain, which made a great contribution to the profile characterization of mycotoxins in Portuguese agricultural fields and dairy farms.
The assessment of mycotoxins in the maize value chain is therefore of great importance as it will allow the definition and development of correct prevention and mitigation strategies to reduce these fungal toxins and, ultimately, animal and human exposure to multiple mycotoxins along this important food chain. As such, increased efforts should be made in terms of quality control for mycotoxins in the maize food chain, as well as monitoring studies of different classes of mycotoxins in various products to assess their real impact.

Supplementary Materials

The following supporting information can be downloaded at: https://www.mdpi.com/article/10.3390/separations10090486/s1, S1. Chemical Structures of the mycotoxins in study; S2. UPLC-MS/MS MRM chromatograms of the mycotoxins in study for (a) multi-standard mycotoxin, (b) blank and (c) contaminated samples in ESI+ and ESI−, respectively.

Author Contributions

Conceptualization, M.L. and A.F.; methodology, M.L. and A.F.; validation, M.L. and A.F.; formal analysis, M.L. and A.F.; investigation, M.L. and A.F.; writing—original draft preparation, M.L.; writing—review and editing, A.F., J.B. and F.R.; supervision, A.F., J.B. and F.R. All authors have read and agreed to the published version of the manuscript.

Funding

This work was financially supported by the FCT—Portuguese Foundation for Science and Technology, I.P. [Grant No. UIDB/50006/2020].

Data Availability Statement

Not applicable.

Acknowledgments

Marta Leite acknowledges FCT, I.P., for the support of this research (Ph.D. Grant No. SFRH/BD/141778/2018).

Conflicts of Interest

The authors declare no conflict of interest.

References

  1. Grote, U.; Fasse, A.; Nguyen, T.T.; Erenstein, O. Food Security and the Dynamics of Wheat and Maize Value Chains in Africa and Asia. Front. Sustain. Food Syst. 2021, 4, 617009. [Google Scholar] [CrossRef]
  2. Leite, M.; Freitas, A.; Silva, A.S.; Barbosa, J.; Ramos, F. Maize Food Chain and Mycotoxins: A Review on Occurrence Studies. Trends Food Sci. Technol. 2021, 115, 307–331. [Google Scholar] [CrossRef]
  3. Food and Agriculture Organization (FAO). FAO World Food and Agriculture—Statistical Yearbook 2021; FAO: Rome, Italy, 2021; ISBN 9789251343326. [Google Scholar]
  4. Munkvold, G.P.; Arias, S.; Taschl, I.; Gruber-Dorninger, C. Mycotoxins in Corn: Occurrence, Impacts, and Management, 3rd ed.; Elsevier Inc.: Amsterdam, The Netherlands, 2019; ISBN 9780128119716. [Google Scholar]
  5. Neme, K.; Mohammed, A. Mycotoxin Occurrence in Grains and the Role of Postharvest Management as a Mitigation Strategies. A Review. Food Control 2017, 78, 412–425. [Google Scholar] [CrossRef]
  6. European Commission (EC). Consolidated Text: Commission Regulation (EC) No 1881/2006 of 19 December 2006 Setting Maximum Levels for Certain Contaminants in Foodstuffs. Off. J. Eur. Union 2020, 364, 5–24. [Google Scholar]
  7. European Commission. Commission Regulation (EC) No 1126/2007 of 28 September 2007 Amending Regulation (EC) No 1881/2006 Setting Maximum Levels for Certain Contaminants in Foodstuffs as Regards Fusarium Toxins in Maize and Maize Products. Off. J. Eur. Union 2007, 255, 14–17. [Google Scholar]
  8. European Commission (EC). Commission Recommendation No 2013/165/EU of 27 March 2013 on the Presence of T-2 and HT-2 Toxin in Cereals and Cereal Products. Off. J. Eur. Union 2013, 91, 12–15. [Google Scholar]
  9. European Commission (EC). Consolidated Text: Commission Recommendation of 17 August 2006 on the Presence of Deoxynivalenol, Zearalenone, Ochratoxin A, T-2 and HT-2 and Fumonisins in Products Intended for Animal Feeding (2006/576/EC). Off. J. Eur. Union 2016, 229, 7–10. [Google Scholar]
  10. European Commission (EC). Consolidated Text: Directive 2002/32/EC of the European Parliament and of the Council of 7 May 2002 on Undesirable Substances in Animal Feed. Off. J. Eur. Union 2019, 140, 10–22. [Google Scholar]
  11. Čolović, R.; Puvača, N.; Cheli, F.; Avantaggiato, G.; Greco, D.; Đuragić, O.; Kos, J.; Pinotti, L. Decontamination of Mycotoxin-Contaminated Feedstuffs and Compound Feed. Toxins 2019, 11, 617. [Google Scholar] [CrossRef]
  12. Ismaiel, A.A.; Papenbrock, J. Mycotoxins: Producing Fungi and Mechanisms of Phytotoxicity. Agriculture 2015, 5, 493–537. [Google Scholar] [CrossRef]
  13. Leite, M.; Freitas, A.; Sanches, A.; Barbosa, J.; Ramos, F. Maize (Zea mays L.) and Mycotoxins: A Review on Optimization and Validation of Analytical Methods by Liquid Chromatography Coupled to Mass Spectrometry. Trends Food Sci. Technol. 2020, 99, 542–565. [Google Scholar] [CrossRef]
  14. Leite, M.; Freitas, A.; Barbosa, J.; Ramos, F. Comprehensive Assessment of Different Extraction Methodologies for Optimization and Validation of an Analytical Multi-Method for Determination of Emerging and Regulated Mycotoxins in Maize by UHPLC-MS/MS. Food Chem. Adv. 2023, 2, 100145. [Google Scholar] [CrossRef]
  15. European Commission (EC). Commission Regulation (EC) No 401/2006 of 23 February 2006 Laying down the Methods of Sampling and Analysis for the Official Control of the Levels of Mycotoxins in Foodstuffs. Off. J. Eur. Union 2006, 70, 12–34. [Google Scholar]
  16. Food and Drug Administration (FDA). Bioanalytical Method Validation: Guidance for Industry; Food and Drug Administration (FDA): Silverspring, MD, USA, 2018. [Google Scholar]
  17. European Medicines Agency (EMA). Guideline on Bioanalytical Method Validation; European Medicines Agency (EMA): Amsterdam, The Netherlands, 2012. [Google Scholar]
  18. European Commission (EC). Commission Regulation (EU) No 519/2014 of 16 May 2014 Amending Regulation (EC) No 401/2006 as Regards Methods of Sampling of Large Lots, Spices and Food Supplements, Performance Criteria for T-2, HT-2 Toxin and Citrinin and Screening Methods of Analysis. Off. J. Eur. Union 2014, L147, 29–43. [Google Scholar]
  19. European Commission (EC). Commission Implementing Regulation (EU) 2021/808 of 22 March 2021 on the Performance of Analytical Methods for Residues of Pharmacologically Active Substances Used in Food-Producing Animals and on the Interpretation of Results as Well as on the Methods To. Off. J. Eur. Union 2021, L180, 84–109. [Google Scholar]
  20. Shephard, G.S. Current Status of Mycotoxin Analysis: A Critical Review. J. AOAC Int. 2016, 99, 842–848. [Google Scholar] [CrossRef]
  21. Rausch, A.; Brockmeyer, R.; Schwerdtle, T. Development and Validation of a QuEChERS-Based Liquid Chromatography Tandem Mass Spectrometry Multi-Method for the Determination of 38 Native and Modified Mycotoxins in Cereals. J. Agric. Food Chem. 2020, 68, 4657–4669. [Google Scholar] [CrossRef]
  22. Garon, D.; Richard, E.; Sage, L.; Bouchart, V.; Pottier, D.; Lebailly, P. Mycoflora and Multimycotoxin Detection in Corn Silage: Experimental Study. J. Agric. Food Chem. 2006, 54, 3479–3484. [Google Scholar] [CrossRef]
  23. Lattanzio, V.M.; Solfrizzo, M.; Powers, S.; Visconti, A. Simultaneous Determination of Aflatoxins, Ochratoxin A and Fusarium Toxins in Maize by Liquid Chromatography/ Tandem Mass Spectrometry after Multitoxin Immunoaffinity Cleanup. Rapid Commun. Mass Spectrom. 2007, 21, 3253–3261. [Google Scholar] [CrossRef] [PubMed]
  24. Sulyok, M.; Berthiller, F.; Krska, R.; Schuhmacher, R. Development and Validation of a Liquid Chromatography/Tandem Mass Spectrometric Method for the Determination of 39 Mycotoxins in Wheat and Maize. Rapid Commun. Mass Spectrom. 2006, 24, 2649–2659. [Google Scholar] [CrossRef]
  25. Abdallah, M.F.; Girgin, G.; Baydar, T. Mycotoxin Detection in Maize, Commercial Feed, and Raw Dairy Milk Samples from Assiut City, Egypt. Vet. Sci. 2019, 6, 57. [Google Scholar] [CrossRef]
  26. Panasiuk, L.; Jedziniak, P.; Pietruszka, K.; Piatkowska, M.; Bocian, L. Frequency and Levels of Regulated and Emerging Mycotoxins in Silage in Poland. Mycotoxin Res. 2019, 35, 17–25. [Google Scholar] [CrossRef] [PubMed]
  27. Scarpino, V.; Reyneri, A.; Blandino, M. Development and Comparison of Two Multiresidue Methods for the Determination of 17 Aspergillus and Fusarium Mycotoxins in Cereals Using HPLC-ESI-TQ-MS/MS. Front. Microbiol. 2019, 10, 361. [Google Scholar] [CrossRef] [PubMed]
  28. Malachová, A.; Stránská, M.; Václavíková, M.; Elliott, C.T.; Black, C.; Meneely, J.; Hajšlová, J.; Ezekiel, C.N.; Schuhmacher, R.; Krska, R. Advanced LC–MS-Based Methods to Study the Co-Occurrence and Metabolization of Multiple Mycotoxins in Cereals and Cereal-Based Food. Anal. Bioanal. Chem. 2018, 410, 801–825. [Google Scholar] [CrossRef] [PubMed]
  29. Jettanajit, A.; Nhujak, T. Determination of Mycotoxins in Brown Rice Using QuEChERS Sample Preparation and UHPLC–MS-MS. J. Chromatogr. Sci. 2016, 54, 720–729. [Google Scholar] [CrossRef]
  30. European Medicines Agency (EMA). ICH Guideline Q2(R2) on Validation of Analytical Procedures; European Medicines Agency: Amsterdam, The Netherlands, 2022; Volume 2. [Google Scholar]
  31. Van Pamel, E.; Verbeken, A.; Vlaemynck, G.; De Boever, J.; Daeseleire, E. Ultrahigh-performance liquid chromatographic-tandem mass spectrometric multimycotoxin method for quantitating 26 mycotoxins in maize silage. J. Agric. Food Chem. 2011, 59, 9747. [Google Scholar] [CrossRef]
  32. Dagnac, T.; Latorre, A.; Fernández Lorenzo, B.; Llompart, M. Validation and application of a liquid chromatography-tandem mass spectrometry-based method for the assessment of the co-occurrence of mycotoxins in maize silages from dairy farms in NW Spain. Food Addit. Contam. Part A Chem. Anal. Control. Expo. Risk Assess. 2016, 33, 1850. [Google Scholar] [CrossRef]
  33. De Beer, J.O.; Van Poucke, C. Ensuring the Quality of Results from Food Control Laboratories: Laboratory Accreditation, Method Validation and Measurement Uncertainty; Woodhead Publishing Limited: Sawston, UK, 2011; ISBN 9781845696740. [Google Scholar]
  34. Debevere, S.; De Baere, S.; Haesaert, G.; Rychlik, M.; Fievez, V.; Croubels, S. Development of an UPLC-MS/MS Method for the Analysis of Mycotoxins in Rumen Fluid with and without Maize Silage Emphasizes the Importance of Using Matrix-Matched Calibration. Toxins 2019, 11, 519. [Google Scholar] [CrossRef]
  35. Biemond, P.C.; Stomph, T.J.; Kumar, P.L.; Struik, P.C. How Maize Seed Systems Can Contribute to the Control of Mycotoxigenic Fungal Infection: A Perspective. Agronomy 2021, 11, 2168. [Google Scholar] [CrossRef]
Figure 1. Schematic representation of the samples collected from agricultural crops (ac) and dairy farms (d,e) from Portuguese sampling sites (I), and overview of the general sampling plan applied for the sample collection (II).
Separations 10 00486 g001
Table 1. Performance criteria for method validation of regulated and emerging mycotoxins in seed samples.
MycotoxinRange
(ng g−1)
LinearityConcentration Level
(ng g−1)
Precision (%)Recovery
(%)
LOD
(ng g−1)
LOQ
(ng g−1)
AFB15 to 250.994209.50102.501.311.58
AFB25 to 250.997201.13102.005.2313.33
AFG15 to 250.983151.8397.233.124.13
AFG25 to 250.978154.8398.011.904.04
BEA100 to 5000.95020011.8389.008.1610.99
CIT250 to 12500.9817501.30103.771.744.37
DON375 to 18750.99615002.05103.6040.3042.13
ENNA75 to 3750.9973003.1898.800.841.00
ENNB75 to 3750.9653001.5497.100.531.31
FB1250 to 12500.9917501.48100.752.294.72
FB2250 to 12500.9647503.0192.304.307.45
HT-250 to 2500.98820020.52106.400.832.06
MPA100 to 5000.9933000.3198.1313.7613.85
MON250 to 12500.9767501.53110.844.8510.90
NIV200 to 10000.9835001.92105.5120.4139.00
OTA10 to 500.9564018.2390.201.251.35
PAT12.5 to 62.50.92037.57.04110.253.808.03
PA150 to 7500.9934503.76102.644.468.71
T-250 to 2500.99820017.4297.104.659.24
TEA51 to 2500.9681504.06101.3210.6419.25
TTX12.5 to 62.50.98637.52.1486.522.412.46
ZEA100 to 5000.9414000.66102.100.741.24
AFB1—Aflatoxin B1; AFB2—Aflatoxin B2; AFG1—Aflatoxin G1; AFG2—Aflatoxin G2; BEA—Beauvericin; CIT—Citrinin; DON—Deoxynivalenol; ENNA—Enniatin A; ENNB—Enniatin B; FB1—Fumonisin B1; FB2—Fumonisin B2; MON—Moniliformin; MPA—Mycophenolic acid; NIV—Nivalenol; LOD—Limit of Detection; LOQ—Limit of Quantification; OTA—Ochratoxin; PA—Penicillic Acid; PAT—Patulin; TEA—Tenuazonic acid; TTX—Tentoxin; ZEA—Zearalenone.
Table 2. Performance criteria for method validation of regulated and emerging mycotoxins in flowering plant samples.
MycotoxinRange
(ng g−1)
LinearityConcentration Level
(ng g−1)
Precision (%)Recovery
(%)
LOD
(ng g−1)
LOQ
(ng g−1)
AFB15 to 250.997201.83104.180.140.32
AFB25 to 250.993204.7498.890.471.04
AFG15 to 250.989205.55104.403.146.42
AFG25 to 250.990200.1596.202.713.18
BEA100 to 5000.9674007.20104.800.090.21
CIT250 to 12500.9817502.1086.884.3310.55
DON375 to 18750.985150014.52102.401.823.82
ENNA75 to 3750.9853000.07101.501.071.93
ENNB75 to 3750.9903002.47104.000.220.57
FB1250 to 12500.9987502.09102.248.7726.31
FB2250 to 12500.9787501.9990.1011.7226.01
HT-250 to 2500.9992001.56100.209.9020.88
MPA100 to 5000.9923001.1798.790.781.66
MON250 to 12500.9897505.3699.115.6012.07
NIV200 to 10000.9865002.35106.7517.9023.35
OTA10 to 500.9794019.0794.2014.4419.35
PAT12.5 to 62.50.98237.56.6699.042.605.08
PA150 to 7500.9924501.24103.702.634.52
T-250 to 2500.9832002.8893.808.1014.56
TEA51 to 2500.98215011.94109.1011.3815.17
TTX12.5 to 62.50.99437.52.3598.921.671.71
ZEA100 to 5000.9874002.2194.302.074.06
AFB1—Aflatoxin B1; AFB2—Aflatoxin B2; AFG1—Aflatoxin G1; AFG2—Aflatoxin G2; BEA—Beauvericin; CIT—Citrinin; DON—Deoxynivalenol; ENNA—Enniatin A; ENNB—Enniatin B; FB1—Fumonisin B1; FB2—Fumonisin B2; MON—Moniliformin; MPA—Mycophenolic acid; NIV—Nivalenol; LOD—Limit of Detection; LOQ—Limit of Quantification; OTA—Ochratoxin; PA—Penicillic Acid; PAT—Patulin; TEA—Tenuazonic acid; TTX—Tentoxin; ZEA—Zearalenone.
Table 3. Performance criteria for method validation of regulated and emerging mycotoxins in silage maize samples.
MycotoxinRange
(ng g−1)
LinearityConcentration Level
(ng g−1)
Precision (%)Recovery
(%)
LOD
(ng g−1)
LOQ
(ng g−1)
AFB15 to 250.991204.78104.102.667.77
AFB25 to 250.984200.5198.102.469.04
AFG15 to 250.987151.4196.152.693.19
AFG25 to 250.985154.85107.331.627.88
BEA100 to 5000.96440010.23108.902.984.93
CIT250 to 12500.9687502.7180.654.6511.00
DON375 to 18750.98915008.87106.3014.8222.75
ENNA75 to 3750.9733005.0499.900.971.22
ENNB75 to 3750.9903001.03103.300.030.05
FB1250 to 12500.9967502.9899.793.1111.52
FB2250 to 12500.9747503.6789.766.9012.60
HT-250 to 2500.9922008.4996.0011.0511.49
MPA100 to 5000.9923001.0998.140.691.45
MON250 to 12500.9927502.3480.654.6511.00
NIV200 to 10000.9475001.55118.0611.7314.14
OTA10 to 500.916400.2898.301.351.38
PAT12.5 to 62.50.97837.51.9797.874.907.87
PA150 to 7500.9944502.19102.164.228.21
T-250 to 2500.9772001.12108.202.522.94
TEA51 to 2500.90215010.9187.983.825.21
TTX12.5 to 62.50.99437.51.3699.795.335.39
ZEA100 to 5000.9944001.0999.900.751.73
AFB1—Aflatoxin B1; AFB2—Aflatoxin B2; AFG1—Aflatoxin G1; AFG2—Aflatoxin G2; BEA—Beauvericin; CIT—Citrinin; DON—Deoxynivalenol; ENNA—Enniatin A; ENNB—Enniatin B; FB1—Fumonisin B1; FB2—Fumonisin B2; MON—Moniliformin; MPA—Mycophenolic acid; NIV—Nivalenol; LOD—Limit of Detection; LOQ—Limit of Quantification; OTA—Ochratoxin; PA—Penicillic Acid; PAT—Patulin; TEA—Tenuazonic acid; TTX—Tentoxin; ZEA—Zearalenone.
Table 4. Performance criteria for method validation of regulated and emerging mycotoxins in animal feed samples.
MycotoxinRange
(ng g−1)
LinearityConcentration Level
(ng g−1)
Precision (%)Recovery
(%)
LOD
(ng g−1)
LOQ
(ng g−1)
AFB15 to 250.990202.0394.501.782.67
AFB25 to 250.977202.40107.801.852.54
AFG15 to 250.984151.0295.013.234.41
AFG25 to 250.952157.6198.361.055.02
BEA100 to 5000.9434001.2795.000.280.61
CIT250 to 12500.9757501.30103.901.834.63
DON375 to 18750.92815000.84106.006.7515.19
ENNA75 to 3750.9503001.02103.803.516.81
ENNB75 to 3750.9903000.5297.800.030.04
FB1250 to 12500.9897503.57106.515.1415.41
FB2250 to 12500.9757505.3290.407.5524.92
HT-250 to 2500.9602001.0399.803.033.34
MPA100 to 5000.9933000.3198.130.751.46
MON250 to 12500.9917501.81105.664.359.22
NIV200 to 10000.9525004.50113.1415.7032.27
OTA10 to 500.995405.06104.200.3912.28
PAT12.5 to 62.50.98637.53.89105.533.844.91
PA150 to 7500.9964501.88102.833.756.37
T-250 to 2500.9592000.7999.601.5314.07
TEA51 to 2500.9821508.5199.448.8714.38
TTX12.5 to 62.50.97737.510.6188.875.356.38
ZEA100 to 5000.9884000.4095.300.862.16
AFB1—Aflatoxin B1; AFB2—Aflatoxin B2; AFG1—Aflatoxin G1; AFG2—Aflatoxin G2; BEA—Beauvericin; CIT—Citrinin; DON—Deoxynivalenol; ENNA—Enniatin A; ENNB—Enniatin B; FB1—Fumonisin B1; FB2—Fumonisin B2; MON—Moniliformin; MPA—Mycophenolic acid; NIV—Nivalenol; LOD—Limit of Detection; LOQ—Limit of Quantification; OTA—Ochratoxin; PA—Penicillic Acid; PAT—Patulin; TEA—Tenuazonic acid; TTX—Tentoxin; ZEA—Zearalenone.
Disclaimer/Publisher’s Note: The statements, opinions and data contained in all publications are solely those of the individual author(s) and contributor(s) and not of MDPI and/or the editor(s). MDPI and/or the editor(s) disclaim responsibility for any injury to people or property resulting from any ideas, methods, instructions or products referred to in the content.

