Abstract
Catha edulis Forsk., commonly known as Khat, is a stimulant plant that is chewed in the Horn of Africa and the southern regions of the Arabian Peninsula. It is often used alongside conventional drugs, but there is a lack of research on its interactions with other drugs. In this study, our aim was to investigate the possibility of an herb–drug interaction between KT extract and metformin (MT) by exploring the effect of KT on the in vivo pharmacokinetics of MT in diabetic Wistar albino rats and monitoring blood glucose levels through time intervals, comparing when MT was given alone and co-administered with KT. Rats were given 500 mg/kg of KT extract and 300 mg/kg of MT daily for 7 days. The pharmacokinetic parameters of MT were analyzed using UPLC-MS/MS. The quantification was conducted using multiple reaction monitoring (MRM) in positive ion mode. The transitions used were (m/z) 130.006→59.939 for MT and 260.125→116.018 for propranolol as an internal standard (IS). An Acquity UPLC BEH HSS T3 C18 column was used with isocratic elution, and the mobile phase was formic acid (0.1%): acetonitrile (70:30 v/v) at a flow rate of 0.25 mL/min. In addition, the study delved into the in vitro impact of KT on the CYP3A4 enzyme, seeking to identify any potential disruptions in MT’s metabolism that could alter its pharmacokinetics. The effect of KT extract on CYP3A4 enzyme activity was investigated using fluorescence-based enzyme assays and a CYP3A4 Inhibitor Screening Kit. The results indicated that the combined treatment showed increased systemic exposure to MT, with Cmax and AUC levels increasing by 33.42% and 45.23%, respectively. Additionally, the combination treatment led to significantly lower fasting blood glucose (FBG) levels compared to the groups treated with MT alone. It was found that at a concentration of 500 µg/mL, the CYP3A4 enzyme activity was maximally suppressed by approximately 57%, while at 250 µg/mL, it was inhibited by almost 50%. In comparison, the standard Ketoconazole only inhibited CYP3A4 activity by approximately 58%. Therefore, the in vitro results suggest that KT extract has the potential to affect CYP3A4 activity at high doses. In conclusion, the combination treatment resulted in a significant increase in MT’s blood sugar-lowering effects. Therefore, it is important to be aware of this potential interaction and to monitor blood sugar levels closely when using KT alongside MT.
1. Introduction
Type 2 diabetes is a metabolic disease caused by insulin receptor insensitivity, leading to chronically high blood sugar levels [1]. Uncontrolled levels of high blood sugar can cause damage to multiple organs over time. Therefore, managing blood glucose levels is crucial for patients with type 2 diabetes. This can be achieved through a combination of oral hypoglycemic drugs and lifestyle adjustments, such as exercise training and a healthy diet [2]. Diverse classes of oral hypoglycemic agents have been developed that have various mechanisms of action, among which metformin (MT) is the most frequently used drug. It is first-line management for type 2 diabetes and is effective as monotherapy and in combination with other glucose-lowering medications [3].
Catha edulis Forsk., commonly known as Khat (KT), is a wild shrub species of the family Celastraceae. It is native to the Horn of Africa and the southern regions of the Arabian Peninsula, and it has been chewed for its euphoric effects for centuries. It is considered a “natural amphetamine,” containing amphetamine-like stimulant substances such as cathinone and cathine [4]. In addition to alkaloids, C. edulis has various phytochemicals such as flavonoids, terpenoids, volatile aromatic compounds, sterols, glycosides, vitamins, amino acids, and minerals. [5,6]. KT is traditionally used during social events to help with communication, enhance performance, and beat fatigue. People also believe it improves memory, relieves headaches, alleviates the common cold, and improves mental clarity [7]. According to estimates, there are around 10–20 million KT consumers worldwide. In recent decades, the consumption of KT has spread to other regions of the world, ranging from Australia to the USA, primarily due to migration [8]. In regions where KT is popularly chewed, it is not unusual for individuals to take it alongside conventional drugs. However, there is a scarcity of research regarding how KT may interact with other drugs, especially those used to control chronic diseases.
The use of traditional and complementary medicine, including herbal medicines, supplements, and nutritional advice, has seen a significant increase worldwide as a way to manage chronic diseases such as diabetes. Reports suggest that up to 72.8% of diabetic patients have turned to alternative traditional medicine for treatment [9,10]. In the southern regions of Saudi Arabia, the majority of KT consumers are found in Jazan; approximately 33.2% of individuals have a habit of chewing KT [11]. Interestingly, people also believe that KT has the potential to lower high blood sugar levels in both diabetic and non-diabetic chewers [12].
The task of maintaining consistent glycemic control in diabetes treatment can be a challenge. Utilizing a combination of MT and herbal remedies may produce a synergistic effect and lead to improved blood glucose levels [13]. However, it is crucial to be aware that concomitant administration of KT alongside hypoglycemic drugs, such as MT, can affect their pharmacokinetic or pharmacodynamic properties. As a result, investigating interactions between herbal medicine and prescribed drugs has become essential for safe and effective treatment.
Cytochrome P450 (CYP) enzymes are responsible for metabolizing many different substances in the body, including drugs, toxins, and hormones [14]. CYP3A4 is one of the most important CYP enzymes in the human body, and it metabolizes up to 70–80% of all clinically used drugs [15]. If CYP3A4 is inhibited, the levels of drugs in the blood can increase, which can lead to side effects or toxicity. Therefore, it is important to study the effects of KT on CYP3A4 to prevent drug interactions and toxicity.
In this study, our aim was to investigate the possibility of herb–drug interaction between KT extract and MT by exploring the effect of KT on the in vivo pharmacokinetics of MT in diabetic Wistar albino rats, monitoring blood glucose levels at time intervals, comparing when MT was given alone and co-administered with KT, and comparing the in vitro inhibition activity of KT on the CYP3A4 enzyme. We anticipate that the findings of this study will shed light on the safety and effectiveness of administering MT and KT together to patients with diabetes. Additionally, it will help clarify the possible benefits and risks associated with this approach.
2. Materials and Methods
2.1. Plant Material
KT is an evergreen shrub or tree that stands 2–25 m tall. It has glossy green leaves, reddish stems, and white flowers. On flowering shoots, the leaves of the plant are positioned in an opposite arrangement, while on older shoots, they are positioned in an alternate arrangement. Fresh aerial parts and leaves of KT were identified in the Medicinal, Aromatic, and Poisonous Plants Research Center (MAPPRC), College of Pharmacy, King Saud University, in collaboration with forensic laboratories in the Ministry of Interior. A voucher specimen was then deposited at MAPPRC, College of Pharmacy, King Saud University.
2.2. Drugs, Chemicals, Solvents, and Reagents
The standard of MT was obtained from Sigma-Aldrich (St. Louis, MO, USA), propranolol hydrochloride (PR) from The Arab Pharmaceutical Manufacturing Co., Ltd. (Amman, Jordan), and streptozotocin (STZ) from biotechnology grade (bioPLUS, bioWORLD, Dublin, OH, USA). Extraction and chromatographic separation were carried out using LC-MS-grade solvents such as methanol, acetonitrile, and formic acid. All these solvents were purchased from Sigma-Aldrich (St. Louis, MO, USA). Deionized water was obtained from the Purelab Flex water purification system (Veolia Ltd., High Wycombe, UK). The CYP3A4 Screening assay was performed using the commercial CYP3A4 Inhibitor Screening Kit (PromoKine, PromoCell, Heidelberg, Germany), following the manufacturer’s instructions. Citrate buffer, nicotinamide, and normal saline were used in the animal study.
2.3. Apparatuses
- For drying the fresh aerial part of the plant: Labconco Freeze Dryer (Prospect Avenue, NY, USA).
- For powdering the dried plant: Huge Grinder Machine (Sujiayuan, Zhejiang, China).
- For extract evaporation: A rotary evaporator (BUCHI Labortechnik AG, Flawil, Switzerland).
- For taking different volumes from the separated plasma samples: Transferpette variable-volume micropipettes.
- For measurement of blood glucose levels: OneTouch glucometer (New Brunswick, NJ, USA).
- For mixing the collected plasma samples: SYBRON Thermolyne vortex mixer (Dubuque, IA, USA).
- For centrifugation and removal of the precipitated plasma protein: High-speed Eppendorf centrifuge (Freshwater Blvd, Enfield, CT, USA).
- For sample weighting: Mettler digital balance (Greifensee, Zurich, Switzerland).
- For florescence measurements: BioTek Microplate plate reader (Winooski, VT, USA).
- For the UPLC-MS/MS method: UPLC-MS/MS (Waters Acquity, Milford, CT, USA).
2.4. Plant Extraction
The aerial parts of C. edulis (KT) were washed gently with distilled water and then subjected to freeze-drying at −20 °C for 2 days using a freeze-dry system. The dried material was then ground using a Huge Grinder Machine, and the resulting powder was weighed and placed into a conical flask wrapped with aluminum foil to avoid light-induced decomposition. Next, 80% methanol was added to the flask to cover the ground material, and the mixture was shaken for 48 h in the dark at 20 °C using a rotary shaker. To filter the mixture, cotton gauze was used first, and then grade-I Whatman filter paper (Whatman TM 1001-150, Merck KGaA, Darmstadt, Germany) was used. The solvent was then evaporated using a rotary evaporator at a controlled temperature and pressure. The remaining water in the KT extract was removed through lyophilization to yield the dry powder extract. TLC profiling was conducted on the methanolic extract of KT to specifically analyze the alkaloids cathinone and cathine. These alkaloids have been identified as the primary active components responsible for the effects of Khat. The TLC procedure employed in this study followed the method established by Ketema et al. [16], where the plant extract was applied as spots onto a pre-coated silica gel plate. For reference, drug standards of d-cathinone-HCL and d-cathine-HCL were dissolved in methanol. The plate was developed using a solvent composition of ethyl acetate, methanol, and aqueous ammonia (85:10:5) and visualized under a UV lamp (254 nm). The spots were made visible by treating the plate with a 0.5% ninhydrin solution.
2.5. Animals
From the Animal Care Center at the College of Pharmacy, King Saud University in Riyadh, Saudi Arabia, a group of eighteen adult female Wistar albino rats weighing between 200 and 250 g was obtained for the study. The rats were housed in a controlled environment within a pathogen-controlled animal room, with the temperature maintained at 25 ± 1 °C. They were provided with a standard chow diet and allowed a two-week period to acclimate to their new surroundings before the commencement of the experiments. This adaptation phase aimed to identify any potential variations in the pharmacokinetic characteristics between the treatment and control groups. The rats had unrestricted access to food and water from the tap. All animal procedures followed the guidelines set forth by the animal care and use committee at King Saud University, and the research ethics committee at King Saud University, Riyadh, Saudi Arabia (KSU-SE-22-89), approved the protocol for this study.
2.6. Interaction of KT with MT in Diabetic Rats
2.6.1. Induction of Diabetes
To induce diabetes mellitus, a single intraperitoneal injection of freshly prepared STZ (60 mg/kg) in 0.1 M citrate buffer (pH 4.5) at a volume of 1 mL/kg was administered, followed by nicotinamide (120 mg/kg), which was prepared in normal saline. Blood samples were taken from the tail vein of each rat after 72 h, and their glucose levels were measured using a glucometer. Rats with fasting blood glucose (FBG) levels of 13.5 mmol/L or higher (equivalent to 250 mg/dL or more) were considered diabetic [17].
2.6.2. Animal Experiments and Drug Administration
The diabetic rats were randomly divided into three groups of six animals each. Group I consisted of STZ-induced diabetic rats (the diabetic control) administered with normal saline (1 mL/kg) daily for 7 days. Group II diabetic rats were treated with MT alone for 7 days at a dose of 300 mg/kg/day [13], and Group III diabetic rats received KT extract solution (500 mg/kg/day; based on the average amount of KT leaves estimated to be chewed daily by KT chewers) [18,19] and MT (300 mg/kg/day) for 7 days. The solutions of KT extract and MT were freshly prepared in normal saline and administered orally using an oral stainless-steel gavage needle.
2.6.3. Preparation of the Collected Plasma Samples and Pharmacokinetic Study
On the seventh day following treatment, blood samples were collected from Groups II and III at predetermined time intervals (0, 0.5, 1, 2, 4, 8, and 24 h) by collecting 250–300 µL of blood from the orbital sinus of the rat’s eye. We used standard pharmacokinetic study strategies to determine the time intervals for blood withdrawal. Specifically, we ensured that the total blood withdrawal did not exceed 10% of the total blood volume. Following this, the blood samples were put through centrifugation at a speed of 3000 rpm for 10 min in order to separate the plasma. The plasma was then transferred into a prelabeled Eppendorf, which was kept at −80 °C until the analysis using the UPLC-MS/MS method. A non-compartmental pharmacokinetic analysis was conducted to estimate various pharmacokinetic parameters composed of Cmax (concentration maximum), Tmax (time to reach Cmax), AUC (area under the plasma concentration–time curve), t1/2 (terminal elimination half-life), Kel (elimination rate constant), and MRT (mean residence time).
2.6.4. Estimation of Rat Blood Glucose Levels
Blood glucose levels were measured in Groups II and III immediately after the seventh day of treatment. Blood samples at predetermined time intervals (0, 0.5, 1, 2, 4, and 8 h) were measured using a glucometer. The results were compared between the two groups, with one group receiving MT alone and the other group receiving MT co-administered with KT. A graph was created showing the estimated blood glucose level in the collected samples versus the corresponding collection time.
2.6.5. Chromatographic and Mass Spectrometric Conditions
The UPLC-MS/MS method was employed and validated for quantification of MT in rat plasma using PR as an internal standard (IS). The liquid chromatography system (Waters Acquity UPLC) consisted of a quaternary solvent transfer pump, an automatic sampler, and tandem mass spectrometry using a TQ detector (Waters Corp., Milford, CT, USA) equipped with an electrospray ionization (ESI) source. The stationary phase used was a BEH HSS T3 C18 column with dimensions of 100 mm × 2.1 mm, 1.7 µm. On the other hand, the used mobile phase was a mixture of acetonitrile and deionized water with 0.1% formic acid (30:70 v/v) in an isocratic elution running at a flow rate of 0.25 mL/min in a total run time of 3 min. Electrospray positive ionization (ESI) was utilized to acquire data in multiple reaction monitoring modes, using a precursor-product ion transition of 260.125→116.018 for PR (IS) and 130.006→59.939 for MT. The instrumental parameters used were a capillary voltage of 3.50 kV, a desolvation temperature of 400 °C, and a desolvation gas flow of 800 L/h.
2.6.6. Preparation of Standard Stocks, Calibrators, and Spiking Solutions
To create the standard stock solutions of MT and PR (IS), precise amounts of each compound were dissolved in methanol. This resulted in a final concentration of 500 μg/mL. The MT solution was further diluted to generate a working solution with concentrations ranging from 5 to 250 μg/mL, while the PR solution remained at a concentration of 500 μg/mL, both using methanol as the diluent. These solutions were stored at −5 °C and brought to room temperature prior to use. For the calibration standards, 10 μL of the MT working solutions were added to 90 μL of blank rat plasma in a series of test tubes. This led to final concentrations of 0.5, 1, 5, 10, 15, 20, and 25 μg/mL of MT.
Then, 10 μL of PR (IS) was added to 50 μL of blank plasma containing MT in each sample to give a final concentration of 25 μg/mL of PR (IS). Next, 200 μL of methanol was added to each sample to recover MT and PR (Is) from plasma. The samples were vortexed for 1 min and centrifuged at 15,000 rpm for 5 min. The supernatant was withdrawn, evaporated to dryness, and reconstituted with 100 μL of mobile phase. Finally, 5 μL was injected into the UPLC/MS/MS. For every sample, the ratio of peak areas (MT peak area divided by IS peak area) was recorded. Subsequently, a calibration curve was constructed using these values, allowing for the determination of the regression equation, slope, and intercept. The method was validated for linearity, detection limits, accuracy, and precision by following the chromatographic conditions mentioned previously.
2.6.7. Pretreatment of the Collected Plasma Samples
After thawing to room temperature, the plasma samples (50 µL each) were transferred to a centrifuge tube. To each sample, 10 µL of PR (IS) working solution (25 µg/mL) was added, followed by the addition of 200 µL of methanol as the extracting solvent. The materials were mixed for one minute and then centrifuged for five minutes. The supernatant of each sample was accurately transferred to a clean test tube and evaporated until the tube was nearly empty. The remaining portion of each sample was then reconstituted with 100 μL of a solvent mixture consisting of the mobile phase.
2.7. In Vitro Study of KT’s Effects on CYP450 Enzyme
2.7.1. Assessment of the Cytotoxicity of KT on HepG2 Liver Cancer Cells by MTT Assay
The cytotoxicity of KT was evaluated on HepG2 cells, a liver cancer cell line, using the MTT assay. The cells were seeded in 24-well plates and incubated for 24 h at 37 °C with 5% CO2. Following this, the cells were exposed to varying concentrations of KT (1000, 500, 250, and 125 µg/mL) for a duration of 48 h. Following a 48-h incubation period, 100 µL of a 5 mg/mL MTT solution was introduced into each well and left to incubate for an additional 2–4 h at a temperature of 37 °C. Subsequently, 100 µL of acidified isopropanol was added to dissolve the formazan product. A microplate ELISA reader was used to measure the reduced MTT at 540 nm. The dose–response curves were used to calculate the IC50 (the concentration of the tested extract required to inhibit cell growth by 50%). The calculation of cell viability was determined using the following mathematical equation [20]:
Cell survival (%) = (O.D of treated sample)/(O.D of untreated sample) × 100
2.7.2. CYP3A4 Inhibitor Screening
The assay was performed using the commercial CYP3A4 Inhibitor Screening Kit (PromoKine, PromoCell), following the manufacturer’s instructions. This test allows for the quick evaluation of interactions between drugs and other new chemical entities (NCEs) with compound-CYP3A4 enzymes. It is a reliable, high-throughput assay based on fluorescence. The kit includes a preparation of human CYP3A4 and cytochrome P450 reductase (CPR) enzymes. The assay employs a non-fluorescent substrate for CYP3A4, which is converted into a highly fluorescent metabolite that can be detected in the visible range (EX/EM = 535/587 nm). This ensures a strong signal-to-background ratio and minimizes interference from autofluorescence. The concentration of the fluorogenic substrate used in screening is approximately equal to its Km (Michaelis constant) for CYP3A4, making it easier to identify weak competitive inhibitors.
2.7.3. Reagents Preparation
The reagents were brought to room temperature (RT) from −20 °C and spined briefly prior to use in their reconstitution as described by the manufacturer. CYP3A4 Inhibitor (Ketoconazole), the inhibitor A 5 mM stock solution of Ketoconazole, was created by dissolving it in 220 μL of acetonitrile and then vortexing it. This stock solution was used as a standard or positive control. To prepare a working solution of Ketoconazole at a concentration of 150 μM (5X the final concentration), 30 μL of the 5 mM stock solution was added to 970 μL of CYP3A4 Assay Buffer. The NADPH Generating System (100X) was reconstituted with 220 μL of CYP3A4 Assay Buffer and kept on ice during use. A 10 mM stock solution of β-NADP+ was created by adding 220 μL of CYP3A4 Assay Buffer to the β-NADP+ Stock and thoroughly vortexing it. This stock solution was stored at −20 °C. To obtain a 2 mM stock solution of CYP3A4 Substrate, 220 μL of acetonitrile was added and vortexed until fully dissolved. The Recombinant Human CYP3A4 was reconstituted immediately before use, as described below. Acetonitrile alone acted as an untreated or negative control.
2.7.4. KT and CYP3A4 Enzyme Preparation
A stock solution of 10 mg of powdered KT extract was created by dissolving it in 1 mL of acetonitrile. To prepare five different doses or concentrations (500, 250, 125, 62.5, and 31.2 μg/mL), serial dilution was performed in CYP3A4 Assay Buffer. The Recombinant Human CYP3A4 stock (2x) was then reconstituted with 0.5 mL of CYP3A4 Assay Buffer and thoroughly mixed by vortexing to achieve a homogeneous solution. This solution was transferred to a 15 mL conical tube. The volume was adjusted to 2.45 mL with CYP3A4 Assay Buffer, and 50 μL of the NADPH Generating System (100x) was added to reach a final total volume of 2.5 mL.
2.7.5. Reaction and Measurements
Minor modifications were made to the protocol to accommodate 25 samples or wells (in triplicate). The reaction was set up in a 96-well plate, with each reaction well containing KT and corresponding no-inhibitor controls. The plate was then incubated for approximately 10 min to allow the test compounds to penetrate the microsomal membranes and interact with CYP3A4 without P450 catalytic turnover occurring. In the meantime, a mixture of CYP3A4 Substrate/NADP+ (3x) was prepared by combining 2.5 μL of the reconstituted 2 mM CYP3A4 Substrate stock solution and 25 μL of the reconstituted β-NADP+ Stock (100x) with 722.5 μL of CYP3A4 Assay Buffer, resulting in a total volume of 0.75 mL. The reaction was initiated by mixing 30 μL of the CYP3A4 Substrate/NADP+ (3x) mixture into each well, resulting in a final reaction volume of 100 μL per well. Immediately after 30 min of incubation, the plate was subjected to fluorescence measurement at the optical density (OD; λ = 535 nm). The mean values for each reading were calculated, and the value of background control was subtracted from each. The final data were analyzed in relation to no-inhibitor or negative control (NC) using the formula:
% Inhibition = [OD (Test) − OD (NC)/OD (Test)] × 100.
3. Results
3.1. Interactions of KT with MT in Diabetic Rats
3.1.1. UPLC-MS/MS Method for MT
To measure the concentration of MT in rat plasma, a validated LC-MS/MS method was employed. The small size and highly polar nature of MT pose a challenge for its quantitative analysis in biological fluids. Separating it on reversed-phase chromatography columns is a challenge as it tends to have poor retention. Meanwhile, PR (IS) is relatively less polar and has adequate retention on RP chromatography. To overcome this challenge, different analytical columns and mobile phases were tested. The optimal retention of both analytes and IS was achieved using a BEH HSS T3 C18 column (100 mm × 2.1 mm, 1.7 µm) with a mobile phase of formic acid (0.1%) and acetonitrile (70:30, v/v) at a flow rate of 0.25 mL/min in a total run time of 3 min. The retention times for PR (IS) and MT were found to be 2.48 and 0.88 min, respectively. Specificity was assessed by contrasting blank rat plasma with plasma that was spiked with MT. Figure 1a,b depict the representative chromatograms of PR (IS) and MT, respectively. The combination of liquid chromatography and MS/MS detection is a highly selective technique that minimizes interference from natural impurities. LC-MRM is particularly useful for pharmacokinetic studies due to its high sensitivity and selectivity. This technique monitors only the ions derived from the target analytes in the MRM mode, making it the optimal choice for developing the current method. To optimize the mass parameters, a positive ionization mode was employed owing to the basic nature of MT, which can only be ionized positively. In addition, the positive ionization mode was found to generate stronger signals and higher intensity for PR (IS) compared to the negative ionization mode. This could be attributed to the capability of both the target analytes and the IS to acquire protons [21]. The capillary (electrospray voltage), cone, collision voltages, cone gas flow, desolation gas flow, and source temperature conditions for the mass spectrometer were optimized based on the methodology described by Patel et al. [22]. An optimized ionization of MT was accomplished by utilizing a cone voltage of 20 V and a collision energy of 12 V. The MT parent ion (precursor) was observed at m/z 130, while fragments were detected at m/z 88, 85, 71, 60, and 46 (Figure 2b). For PR (IS), the mass spectrometry spectrum demonstrated optimal results with a cone voltage of 32 V, revealing [M + H]+ at m/z 260. Fragmentation of PR through MS/MS analysis, with a collision energy of 20 V, resulted in fragments at m/z 116, 98, 74, and 58 (Figure 2a). These specific values were employed to establish MRM transitions at 260.125→116.018 for PR (IS) and 130.006→59.939 for MT, enabling their detection in rat plasma.
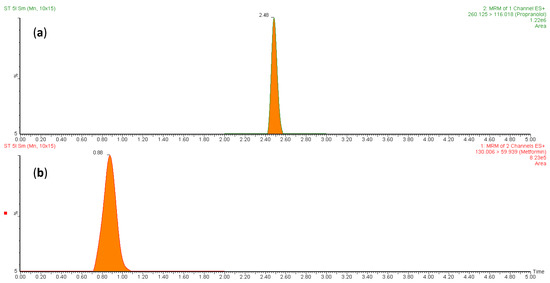
Figure 1.
MRM chromatograms of (a) PR (IS) in blank plasma and (b) plasma spiked with MT at the lower limit of quantification.


Figure 2.
The ESI-MS and ESI-MS/MS spectra of (a) PR (IS) and (b) MT.
3.1.2. Calibration Curve and Method Validation
The correlation between the area (y-axis) and MT concentration (x-axis) in the spiked plasma concentration range of 0.5–25 µg/mL was used to establish the calibration curve. The calibration peaks of MT with PR (IS) are shown in Figure 3. A linear regression equation (y = bx + a) was used to determine the relationship between the peak area ratio of the drug to the internal standard (Y) and the analyte concentration in plasma (x). The linearity of the calibration curve was assessed using the correlation coefficient (r-value). The results of the linear regression analysis showed that the analytical method had a good correlation (r2 > 0.996). The regression equation was found to be Y = 0.0092 X − 0.0034 (Figure 4). The observed correlation between the detector response and the variations in analyte concentration suggests that the analytical method demonstrated a proportional relationship. The proposed approach produced an LLOD of 0.5 µg/mL and an LLOQ of 1 µg/mL. The percentage recovery was used to indicate accuracy, with an acceptable limit of ± 15% from the actual concentration. The calculated percentage recovery fell within the range of 90% to 110%. In addition, the precision was evaluated using % RSD (coefficient of variation (CV)) and found to be within the acceptance criteria, with a %CV below 15%, except for the LLOQ of 20%. These results confirm the accuracy and precision of the developed method, as per FDA guidelines [23]. This method was utilized to conduct a quantitative analysis of MT in rat plasma samples that were obtained during pharmacokinetic studies.
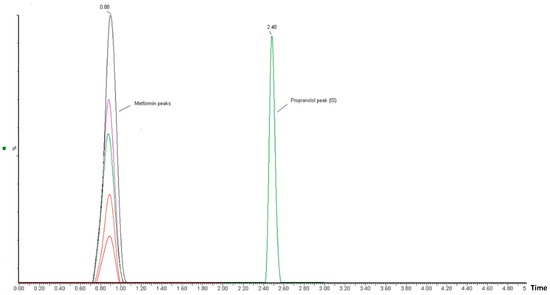
Figure 3.
Chromatographic peaks obtained from UPLC-MS/MS analysis in calibration-level solutions of MT and PR (internal standard). The MT chromatographic peaks, represented by different colors, correspond to different concentrations of MT.
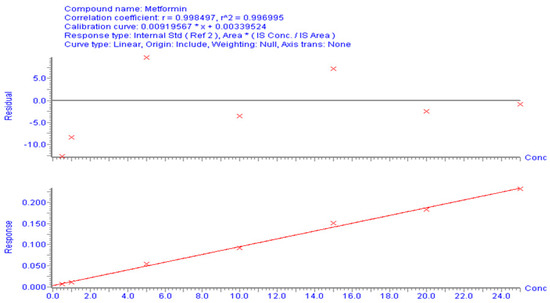
Figure 4.
Calibration curves for MT using UPLC/MS/MS to analyze the correlation between concentration and peak area.
3.1.3. Effect of KT Extract on MT Pharmacokinetics
We conducted pharmacokinetic interaction studies on diabetic rats rather than normal rats to better relate the results to real-life conditions. Recent research has suggested the disease system approach, which recognizes that various diseases and pathological conditions associated with the disease can affect drug disposition [24]. The plasma concentrations of the administered drug were measured in Groups II and III, which received the drug without and with KT extract, respectively. The results were compared using a mean plasma concentration versus time graph (Figure 5). A non-compartmental pharmacokinetic analysis was then carried out to estimate various pharmacokinetic parameters of MT [25], both alone and in combination with KT extract. As shown in Figure 5, MT was rapidly absorbed after oral administration in both Groups II and III. However, the calculated pharmacokinetic parameters in Table 1 showed that the bioavailability of MT was significantly increased when administered with KT extract. This was evident from the higher values of the maximum drug plasma concentration (Cmax) and area under the curve (AUC). According to the results, there was a 33.42% increase in the Cmax of Group III as compared to Group II (from 34.91 ± 9.76 µg/mL to 46.58 ± 10.66 µg/mL). Additionally, the AUC0-t of Group III increased by approximately 45.23% (from 214.06 ± 172.9 µg/mL to 310.89 ± 172.9 µg/mL). To put it differently, the simultaneous administration of KT extract caused a significant increase in systemic exposure to MT. This outcome is likely because of the inhibition of CYP metabolizing enzymes, which are known to play a key role in the metabolism of MT [26]. On the other hand, in Group III, there was a 15.67% rise in MT’s half-life (t1/2) and a 13.45% increase in mean residence time (MRT) compared to Group II. Conversely, the elimination rate constant (Kel) was reduced by 20%. In consideration of the results from the pharmacokinetic study detailed above, it can be concluded that the combined consumption of KT and MT may substantially and immediately affect FBG levels.

Figure 5.
Plasma concentration–time profile of MT in rats treated with MT alone (300 mg/kg) and MT (300 mg/kg) + KT extract (500 mg/kg). Values are expressed as the mean ± SEM of six rats.

Table 1.
Pharmacokinetic parameters of MT in diabetic rats (n = 6) treated with MT (300 mg/kg) and MT + KT extract (500 mg/kg).
3.1.4. Effect of MT Alone and in Combination with KT Extract on Fasting Blood Glucose Levels
The FBG levels of STZ-induced diabetic rats (Groups II and III) were considerably elevated, equivalent to or exceeding 400 mg/dL, in comparison to the normal control rats. The graph in Figure 6 illustrates a correlation between the blood glucose levels of the collected samples and the time of their collection. A notable decrease in FBG levels can be seen within 30 min of administering MT alone or in combination with KT extract, as compared to the levels before administration. In accordance with the pharmacokinetic study, the concomitant administration of MT and KT extract resulted in a significantly lower FBG level (290 mg/dL) than when MT was used alone (345 mg/dL).
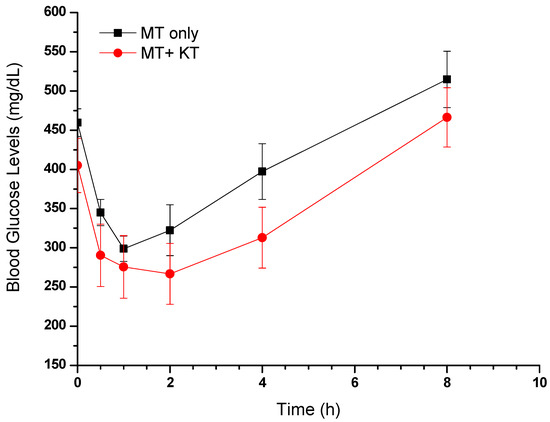
Figure 6.
Effects of MT alone and MT + KT extract on fasting blood glucose levels in rats (mean ± SEM, n = 6).
3.2. In Vitro Study of KT’s Impact on CYP450 Enzyme
3.2.1. Effect of KT on HepG2 Cells
The MTT assay was employed to determine the survival of HepG2 cells after exposure to various concentrations of KT. Cells were treated with 1000, 500, 250, and 125 µg/mL concentrations of KT and compared with untreated cells. Our results showed that lower doses (125 and 250 µg/mL) did not demonstrate remarkable cytotoxicity. However, at the highest doses, i.e., 500 and 1000 µg/mL, KT extract showed notable cell death (Figure 7). The obtained IC50 value for KT extract was 423.5 ± 3.5 µg/mL.
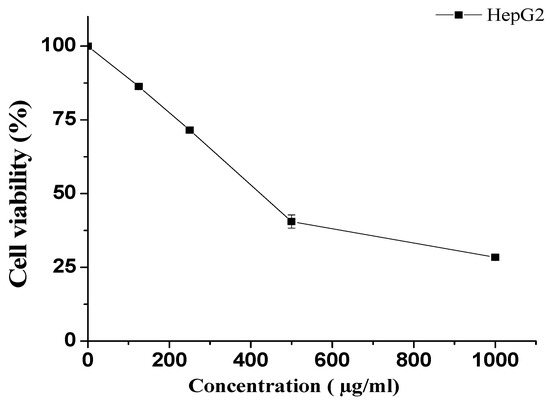
Figure 7.
Effect of KT extract on HepG2 cell viability. Cell viability was determined after incubation with the indicated concentrations using the MTT assay. The data represent the mean ± SD of three independent experiments.
3.2.2. Effect of KT on the CYP3A4 Enzyme
The reaction was prepared in a 96-well plate with reaction wells containing KT. The corresponding no-inhibitor controls and background are shown in Table 2. The KT extract used at different concentrations (doses: 31.12–500 µg/mL) showed in vitro inhibition of CYP3A4 enzymatic activity in a dose-dependent manner. KT extract at 500 µg/mL maximally suppressed the enzyme activity by about 57%, whereas at 250 µg/mL, it inhibited the activity by almost 50% (IC50 = 250 µg/mL). In comparison, the standard Ketoconazole inhibited CYP3A4 activity by approximately 58%. Therefore, this in vitro observation suggested a potential effect of KT at high doses that might significantly inhibit liver drug-metabolizing enzymes (Figure 8).
Table 2.
Reaction preparation quantities of CYP3A4.
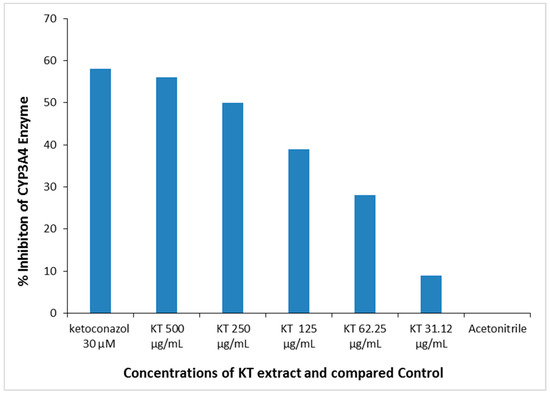
Figure 8.
In vitro dose-dependent inhibition of liver CYP3A4 enzyme activity by KT extract. Positive control: Ketoconazole; Negative control: Acetonitrile.
4. Discussion
Elevated blood glucose levels are a hallmark of diabetes mellitus, a metabolic disease that comes in two main types: type 1 and type 2. In type 1 diabetes, insufficient insulin secretion is responsible for the condition, which usually afflicts children and teenagers. Type 2 diabetes, on the other hand, is most likely to affect adults and the elderly and is typically caused by insulin resistance due to poor dietary and lifestyle choices leading to chronic hyperglycemia [27]. The World Health Organization (WHO) states that Saudi Arabia has the second-highest prevalence of diabetes in the Middle East and ranks seventh globally. Approximately seven million individuals in the population have diabetes, and almost three million have pre-diabetes [28].
Oral hypoglycemic agents are classified into different groups with unique mechanisms of action, and MT stands out as the most frequently prescribed drug for managing type 2 diabetes. It has been found to be effective as a first-line treatment, either alone or in combination with other glucose-lowering medications [29]. As the popularity of MT increases, the likelihood of it interacting with other medicinal or cultural herbs also increases. Several scientific studies have been conducted on the herb–drug interactions between MT and various natural products, including Carica papaya [30], Trigonella seeds (fenugreek) [13], Green rooibos [22], Cassia auriculata L. [31], Red Ginseng [32], Brassica rapa (turnip) [33], St. John’s wort [34], and Allium sativum (garlic) [35]. Herbs can have a variety of effects on drugs, such as altering their bioavailability and/or inhibiting cytochrome P450 (CYP) enzymes. These enzymes are responsible for metabolizing many drugs in the liver, so any disruption can impact the drug’s pharmacokinetics [36].
Even with global and local restrictions on the use of KT, it is still being consumed in Saudi Arabia, predominantly in the southern regions of the kingdom. Furthermore, those who chew KT believe that it could potentially aid in the reduction of blood glucose levels. Due to a lack of sufficient studies regarding KT’s possible interaction with MT, the current study was designed as a way to explore the possible effects of KT on the in vivo pharmacokinetics of MT in Wistar rats. Alongside this exploration, the study also delved into the potential impact of KT on the CYP3A4 enzyme, seeking to identify any potential disruptions in MT’s metabolism that could alter its pharmacokinetics.
Cathinone and cathine are the primary active ingredient compounds responsible for the action of KT. Other than these, KT also contains several phytochemicals such as alkaloids (phenylalkylamines and cathedulins), triterpenoids, monoterpenes, flavonoids, steroids, volatile aromatic compounds, and miscellaneous compounds such as vitamins and amino acids [5]. These constituents may have a potential impact on the bioavailability of MT. Cathinone was found to have inhibitory effects on several important human drug-metabolizing enzymes, including CYP1A2, CYP2A6, CYP3A5, CYP2B6, CYP2C8, CYP2C19, CYP2E1, and CYP2J2. These enzymes are responsible for metabolizing a wide range of commonly used medications, such as antibiotics, immunosuppressive drugs, anticoagulants, anticancer drugs, and painkillers [37].
After conducting a comprehensive literature review, several techniques are available for analyzing MT alone in various samples such as plasma, urine, liver, brain, kidney, and muscles. These techniques include HILIC [38], HPLC [39,40,41], LC/MS/MS [42,43,44,45], GC/MS [46], and HILIC/MS [47]. In addition, the combination of MT with different medications in different plasma samples has been estimated using HPLC [48,49,50,51], HILIC/MS [52,53], LC/MS/MS [21,54,55,56,57,58], and UPLC-MS/MS [59,60] methods. In the present study, the pharmacokinetic investigation was conducted using a validated UPLC-MS/MS method.
The results of the study showed that when KT was used in combination with MT, the plasma drug concentrations were significantly higher than when MT was used alone. This was evidenced by an increase in Cmax and AUC levels of 33.42% and 45.23%, respectively, along with a 20% reduction in the elimination rate constant. This was correlated with a significant decrease in FBG levels of 290 mg/dL compared to 345 mg/dL when MT was used alone. In our study, we investigated the effect of different doses of KT extract on cell viability. It was observed that higher doses (500 and 1000 µg/mL) of KT extract resulted in notable cell death, with an IC50 value of 423.5 ± 3.5 µg/mL. The in vitro effect of KT on the inhibition of CYP3A4 was also significant, with an inhibition of about 57% at a dose of 500 µg/mL. In other words, KT appears to increase the blood levels of MT, which in turn leads to a decrease in blood sugar levels. This suggests that KT may be a useful adjunct therapy for the treatment of diabetes. Additionally, there may be concerns resulting in more pronounced hypoglycemic effects and, ultimately, inconsistent management of blood glucose levels.
Through this in vivo and in vitro analysis, it was found that there is a noteworthy pharmacokinetic interaction between KT and MT. It implies that KT may have an impact on the safety and efficacy profile of MT. While more research is necessary to understand the exact mechanism of this interference, patients who take MT should be aware of the possibility of an herb–drug interaction if they also chew KT.
5. Conclusions
In conclusion, this study investigated the potential herb–drug interaction between KT extract and MT in diabetic rats. The results showed that the combined treatment resulted in increased systemic exposure to MT, with Cmax and AUC levels increasing by 33.42% and 45.23%, respectively. Additionally, the combination treatment led to significantly lower fasting blood glucose (FBG) levels compared to the groups treated with MT alone. The in vitro results suggest that KT extract has the potential to affect CYP3A4 activity at high doses. Therefore, it is important to be aware of the potential for KT to interact with hypoglycemic drugs and to monitor blood sugar levels closely when using KT alongside these medications.
Author Contributions
Conceptualization, A.S.A. and O.I.F.; Methodology, M.K.P., A.M.A., R.N.H., E.M.E., E.E. and M.R.; Software, E.E.; Formal analysis, A.M.A.; Resources, M.M.A.; Data curation, F.A.N.; Writing—original draft, A.M.A.; Writing—review & editing, R.N.H.; Supervision, A.S.A., O.I.F. and M.K.P.; Project administration, A.S.A. and O.I.F.; Funding acquisition, A.S.A. All authors have read and agreed to the published version of the manuscript.
Funding
This research was funded by the Researchers Supporting Project number (RSP2023R132) at King Saud University, Riyadh, Saudi Arabia.
Institutional Review Board Statement
The study was conducted after approval by the Research Ethics Committee, King Saud University (Reference no. KSU-SE-22-89).
Informed Consent Statement
Not applicable.
Data Availability Statement
Data are contained within the article.
Acknowledgments
The authors are thankful to the Researchers Supporting Project number (RSP2023R132) at King Saud University, Riyadh, Saudi Arabia.
Conflicts of Interest
The authors declare no conflict of interest.
References
- Galicia-Garcia, U.; Benito-Vicente, A.; Jebari, S.; Larrea-Sebal, A.; Siddiqi, H.; Uribe, K.B.; Ostolaza, H.; Martín, C. Pathophysiology of type 2 diabetes mellitus. Int. J. Mol. Sci. 2020, 21, 6275. [Google Scholar] [CrossRef] [PubMed]
- Gupta, R.; Chang, D.; Nammi, S.; Bensoussan, A.; Bilinski, K.; Roufogalis, B. Interactions between antidiabetic drugs and herbs: An overview of mechanisms of action and clinical implications. Diabetol. Metab. Syndr. 2017, 9, 59. [Google Scholar] [CrossRef] [PubMed]
- Baker, C.; Retzik-Stahr, C.; Singh, V.; Plomondon, R.; Anderson, V.; Rasouli, N. Should metformin remain the first-line therapy for treatment of type 2 diabetes? Ther. Adv. Endocrinol. Metab. 2021, 12, 2042018820980225. [Google Scholar] [CrossRef]
- Ye, S.; Hu, J.; Liu, Z.; Liang, M. Progress and research trends on Catha edulis (Vahl) Endl.(Catha edulis): A review and bibliometric analysis. Front. Pharmacol. 2021, 12, 705376. [Google Scholar] [CrossRef] [PubMed]
- Getasetegn, M. Chemical composition of Catha edulis (khat): A review. Phytochem. Rev. 2016, 15, 907–920. [Google Scholar] [CrossRef]
- Gholami, M.; Esmaeilzadeh Bahabadi, S. Kaurene as the major constituent of the essential oils of the narcotic plant, Khat (Catha edulis Forsk). Nat. Prod. Res. 2019, 33, 126–129. [Google Scholar] [CrossRef]
- Ageely, H.M. Health and socio-economic hazards associated with khat consumption. J. Fam. Community Med. 2008, 15, 3. [Google Scholar]
- Thomas, S.; Williams, T. Khat (Catha edulis): A systematic review of evidence and literature pertaining to its harms to UK users and society. Drug Sci. Policy Law 2013, 1, 2050324513498332. [Google Scholar] [CrossRef]
- Chang, H.Y.; Wallis, M.; Tiralongo, E. Use of complementary and alternative medicine among people living with diabetes: Literature review. J. Adv. Nurs. 2007, 58, 307–319. [Google Scholar] [CrossRef]
- Chang, H.-Y.A.; Wallis, M.; Tiralongo, E. Use of complementary and alternative medicine among people with type 2 diabetes in Taiwan: A cross-sectional survey. Evid.-Based Complement. Altern. Med. 2010, 2011, 983792. [Google Scholar] [CrossRef]
- Mahfouz, M.S.; Rahim, B.-E.E.; Solan, Y.M.; Makeen, A.M.; Alsanosy, R.M. Khat chewing habits in the population of the Jazan region, Saudi Arabia: Prevalence and associated factors. PloS ONE 2015, 10, e0134545. [Google Scholar] [CrossRef] [PubMed]
- Alsalahi, A.; Chik, Z.; Mohamed, Z.; Giribabu, N.; Alshawsh, M.A. Cathinone: An alkaloid of Catha edulis (Khat) exacerbated hyperglycemia in diabetes-induced rats. Saudi J. Biol. Sci. 2021, 28, 4633–4643. [Google Scholar] [CrossRef] [PubMed]
- Abdelwahab, N.S.; Morsi, A.; Ahmed, Y.M.; Hassan, H.M.; AboulMagd, A.M. Ecological HPLC method for analyzing an antidiabetic drug in real rat plasma samples and studying the effects of concurrently administered fenugreek extract on its pharmacokinetics. RSC Adv. 2021, 11, 4740–4750. [Google Scholar] [CrossRef] [PubMed]
- Lynch, T.; Neff, A.P. The effect of cytochrome P450 metabolism on drug response, interactions, and adverse effects. Am. Fam. Physician 2007, 76, 391–396. [Google Scholar]
- Lim, S.Y.M.; Binti Azidin, A.R.; Ung, Y.T.; Al-Shagga, M.; Alshawsh, M.A.; Mohamed, Z.; Ong, C.E.; Pan, Y. Effect of 95% ethanol khat extract and cathinone on in vitro human recombinant cytochrome P450 (CYP) 2C9, CYP2D6, and CYP3A4 activity. Eur. J. Drug Metab. Pharmacokinet. 2019, 44, 423–431. [Google Scholar] [CrossRef]
- Ketema, T.; Yohannes, M.; Alemayehu, E.; Ambelu, A. Evaluation of immunomodulatory activities of methanolic extract of khat (Catha edulis, Forsk) and cathinone in Swiss albino mice. BMC Immunol. 2015, 16, 9. [Google Scholar] [CrossRef]
- Barik, R.; Jain, S.; Qwatra, D.; Joshi, A.; Tripathi, G.S.; Goyal, R. Antidiabetic activity of aqueous root extract of Ichnocarpus frutescens in streptozotocin-nicotinamide induced type-II diabetes in rats. Indian J. Pharm. 2008, 40, 19–22. [Google Scholar] [CrossRef]
- Dallak, M.A.; Bin-Jaliah, I.; Al-Khateeb, M.A.; Nwoye, L.O.; Shatoor, A.S.; Soliman, H.S.; Al-Hashem, F.H. In vivo acute effects of orally administered hydro-ethanol extract of Catha edulis on blood glucose levels in normal, glucose-fed hyperglycemic, and alloxan-induced diabetic rats. Saudi Med. J. 2010, 31, 627–633. [Google Scholar]
- Kelly, J.P. Cathinone derivatives: A review of their chemistry, pharmacology and toxicology. Drug Test. Anal. 2011, 3, 439–453. [Google Scholar] [CrossRef]
- Nasr, F.A.; Noman, O.M.; Alqahtani, A.S.; Qamar, W.; Ahamad, S.R.; Al-Mishari, A.A.; Alyhya, N.; Farooq, M. Phytochemical constituents and anticancer activities of Tarchonanthus camphoratus essential oils grown in Saudi Arabia. Saudi Pharm. J. 2020, 28, 1474–1480. [Google Scholar] [CrossRef]
- Mohamed, D.; Elshahed, M.S.; Nasr, T.; Aboutaleb, N.; Zakaria, O. Novel LC–MS/MS method for analysis of metformin and canagliflozin in human plasma: Application to a pharmacokinetic study. BMC Chem. 2019, 13, 82. [Google Scholar] [CrossRef]
- Patel, O.; Muller, C.J.F.; Joubert, E.; Rosenkranz, B.; Taylor, M.J.C.; Louw, J.; Awortwe, C. Pharmacokinetic Interaction of Green Rooibos Extract With Atorvastatin and Metformin in Rats. Front. Pharm. 2019, 10, 1243. [Google Scholar] [CrossRef] [PubMed]
- Singh, A.; Thatikonda, T.; Kumar, A.; Wazir, P.; Vijayabhaskar, V.; Nandi, U.; Singh, P.P.; Singh, S.; Gupta, A.P.; Tikoo, M.K. Determination of ZSTK474, a novel Pan PI3K inhibitor in mouse plasma by LC–MS/MS and its application to Pharmacokinetics. J. Pharm. Biomed. Anal. 2018, 149, 387–393. [Google Scholar] [CrossRef]
- Shengule, S.; Kumbhare, K.; Patil, D.; Mishra, S.; Apte, K.; Patwardhan, B. Herb-drug interaction of Nisha Amalaki and Curcuminoids with metformin in normal and diabetic condition: A disease system approach. Biomed. Pharmacother. 2018, 101, 591–598. [Google Scholar] [CrossRef]
- Khare, V.; Singh, A.; Mahajan, G.; Alam, N.; Kour, S.; Gupta, M.; Kumar, A.; Singh, G.; Singh, S.K.; Saxena, A.K. Long-circulatory nanoparticles for gemcitabine delivery: Development and investigation of pharmacokinetics and in-vivo anticancer efficacy. Eur. J. Pharm. Sci. 2016, 92, 183–193. [Google Scholar] [CrossRef]
- Choi, Y.; Lee, U.; Lee, B.; Lee, M. Pharmacokinetic interaction between itraconazole and metformin in rats: Competitive inhibition of metabolism of each drug by each other via hepatic and intestinal CYP3A1/2. Br. J. Pharmacol. 2010, 161, 815–829. [Google Scholar] [CrossRef] [PubMed]
- Hinault, C.; Caroli-Bosc, P.; Bost, F.; Chevalier, N. Critical Overview on Endocrine Disruptors in Diabetes Mellitus. Int. J. Mol. Sci. 2023, 24, 4537. [Google Scholar] [CrossRef] [PubMed]
- Abdulaziz Al Dawish, M.; Alwin Robert, A.; Braham, R.; Abdallah Al Hayek, A.; Al Saeed, A.; Ahmed Ahmed, R.; Sulaiman Al Sabaan, F. Diabetes mellitus in Saudi Arabia: A review of the recent literature. Curr. Diabetes Rev. 2016, 12, 359–368. [Google Scholar] [CrossRef]
- Drzewoski, J.; Hanefeld, M. The current and potential therapeutic use of metformin—The good old drug. Pharmaceuticals 2021, 14, 122. [Google Scholar] [CrossRef]
- Abdelgawad, M.A.; Elmowafy, M.; Musa, A.; Al-Sanea, M.M.; Nayl, A.A.; Ghoneim, M.M.; Ahmed, Y.M.; Hassan, H.M.; AboulMagd, A.M.; Salem, H.F. Development and Greenness Assessment of HPLC Method for Studying the Pharmacokinetics of Co-Administered Metformin and Papaya Extract. Molecules 2022, 27, 375. [Google Scholar] [CrossRef]
- Elango, H.; Ponnusankar, S.; Sundaram, S. Assessment of pharmacodynamic and pharmacokinetic interaction of aqueous extract of Cassia auriculata L. and metformin in rats. Pharmacogn. Mag. 2015, 11, S423. [Google Scholar] [PubMed]
- Jin, S.; Lee, S.; Jeon, J.-H.; Kim, H.; Choi, M.-K.; Song, I.-S. Enhanced intestinal permeability and plasma concentration of metformin in rats by the repeated administration of red ginseng extract. Pharmaceutics 2019, 11, 189. [Google Scholar] [CrossRef]
- Hassanzadeh-Taheri, M.; Hassanpour-Fard, M.; Doostabadi, M.; Moodi, H.; Vazifeshenas-Darmiyan, K.; Hosseini, M. Co-administration effects of aqueous extract of turnip leaf and metformin in diabetic rats. J. Tradit. Complement. Med. 2018, 8, 178–183. [Google Scholar] [CrossRef] [PubMed]
- Stage, T.B.; Pedersen, R.S.; Damkier, P.; Christensen, M.M.H.; Feddersen, S.; Larsen, J.T.; Højlund, K.; Brøsen, K. Intake of S t J ohn’s wort improves the glucose tolerance in healthy subjects who ingest metformin compared with metformin alone. Br. J. Clin. Pharmacol. 2015, 79, 298–306. [Google Scholar] [CrossRef] [PubMed]
- Shikha, C.; Tamanna, N.; Soni, L.K. Effect of Allium sativum on the pharmacokinetic of Metformin in rat plasma: A herb-drug interaction study. Der Pharma Chem. 2011, 3, 287–291. [Google Scholar]
- Lim, X.; Chan, J.; Japri, N.; Lee, J.; Tan, T. Carica papaya L. Leaf: A systematic scoping review on biological safety and herb-drug interactions. Evid.-Based Complement. Altern. Med. 2021, 2021, 1–21. [Google Scholar] [CrossRef] [PubMed]
- Lim, S.Y.M.; Loo, J.S.E.; Alshagga, M.; Alshawsh, M.A.; Ong, C.E.; Pan, Y. In vitro and In silico studies of interactions of cathinone with human recombinant cytochrome P450 CYP (1A2), CYP2A6, CYP2B6, CYP2C8, CYP2C19, CYP2E1, CYP2J2, and CYP3A5. Toxicol. Rep. 2022, 9, 759–768. [Google Scholar] [CrossRef]
- Liu, A.; Coleman, S.P. Determination of metformin in human plasma using hydrophilic interaction liquid chromatography–tandem mass spectrometry. J. Chromatogr. B 2009, 877, 3695–3700. [Google Scholar] [CrossRef]
- Ningrum, V.D.A.; Wibowo, A.; Fuaida, I.; Ikawati, Z.; Sadewa, A.H.; Ikhsan, M.R. Validation of an HPLC-UV method for the determination of metformin hydrochloride in spiked-human plasma for the application of therapeutic drug monitoring. Res. J. Pharm. Technol. 2018, 11, 2197–2202. [Google Scholar] [CrossRef]
- Chhetri, H.P.; Thapa, P.; Van Schepdael, A. Simple HPLC-UV method for the quantification of metformin in human plasma with one step protein precipitation. Saudi Pharm. J. 2014, 22, 483–487. [Google Scholar] [CrossRef]
- Rebecca, Y.M.; Sudha, V.; Kumar, A.H. Validated high performance liquid chromatography method for the determination of metformin in human plasma and its application to pharmacokinetic study. Chromatogr. Sep. Technol. J 2019, 2, 119–124. [Google Scholar]
- Koseki, N.; Kawashita, H.; Niina, M.; Nagae, Y.; Masuda, N. Development and validation for high selective quantitative determination of metformin in human plasma by cation exchanging with normal-phase LC/MS/MS. J. Pharm. Biomed. Anal. 2005, 36, 1063–1072. [Google Scholar] [CrossRef] [PubMed]
- El-Aneed, A.; Arnason, T.; Michel, D.; Gaunt, M. Development and validation of fast and simple flow injection analysis-tandem mass spectrometry (FIA-MS/MS) for the determination of metformin in dog serum. J. Pharm. Biomed. Anal. 2015, 107, 229–235. [Google Scholar]
- Swales, J.G.; Gallagher, R.; Peter, R.M. Determination of metformin in mouse, rat, dog and human plasma samples by laser diode thermal desorption/atmospheric pressure chemical ionization tandem mass spectrometry. J. Pharm. Biomed. Anal. 2010, 53, 740–744. [Google Scholar] [CrossRef] [PubMed]
- Chaudhari, K.; Wang, J.; Xu, Y.; Winters, A.; Wang, L.; Dong, X.; Cheng, E.Y.; Liu, R.; Yang, S.-H. Determination of metformin bio-distribution by LC-MS/MS in mice treated with a clinically relevant paradigm. PloS ONE 2020, 15, e0234571. [Google Scholar] [CrossRef]
- Uçaktürk, E. The development and validation of a gas chromatography-mass spectrometry method for the determination of metformin in human plasma. Anal. Methods 2013, 5, 4723–4730. [Google Scholar] [CrossRef]
- Zhang, W.; Han, F.; Zhao, H.; Lin, Z.; Huang, Q.; Weng, N. Determination of metformin in rat plasma by HILIC-MS/MS combined with Tecan automation and direct injection. Biomed. Chromatogr. 2012, 26, 1163–1169. [Google Scholar] [CrossRef]
- Balamurugan, K.; Kirtimaya, M.; Suresh, R. Simultaneous estimation of linagliptin and metformin HCl in human plasma by RP-HPLC method. Int. Res. J. Pharm. 2019, 10, 167–170. [Google Scholar]
- Sebaiy, M.M.; El-Adl, S.M.; Baraka, M.M.; Hassan, A.A. Rapid RP-HPLC method for simultaneous estimation of metformin, pioglitazone, and glimepiride in human plasma. Acta Chromatogr. 2020, 32, 16–21. [Google Scholar] [CrossRef]
- Ranetti, M.-C.; Ionescu, M.; Hinescu, L.; Ionica, E.; Anuta, V.; Ranetti, A.E.; Stecoza, C.E.; Mircioiu, C. Validation of a HPLC method for the simultaneous analysis of metformin and gliclazide in human plasma. Farmacia 2009, 57, 728–735. [Google Scholar]
- Shakoor, A.; Ahmed, M.; Ikram, R.; Hussain, S.; Tahir, A.; Jan, B.M.; Adnan, A. Stability-indicating RP-HPLC method for simultaneous determination of metformin hydrochloride and vildagliptin in tablet and biological samples. Acta Chromatogr. 2020, 32, 39–43. [Google Scholar] [CrossRef]
- Mohamed, A.-M.I.; Mohamed, F.A.-F.; Ahmed, S.; Mohamed, Y.A.S. An efficient hydrophilic interaction liquid chromatographic method for the simultaneous determination of metformin and pioglitazone using high-purity silica column. J. Chromatogr. B 2015, 997, 16–22. [Google Scholar] [CrossRef] [PubMed]
- Pontarolo, R.; Gimenez, A.C.; de Francisco, T.M.G.; Ribeiro, R.P.; Pontes, F.L.D.; Gasparetto, J.C. Simultaneous determination of metformin and vildagliptin in human plasma by a HILIC–MS/MS method. J. Chromatogr. B 2014, 965, 133–141. [Google Scholar] [CrossRef] [PubMed]
- Elgawish, M.S.; Nasser, S.; Salama, I.; Abbas, A.M.; Mostafa, S.M. Liquid chromatography tandem mass spectrometry for the simultaneous determination of metformin and pioglitazone in rat plasma: Application to pharmacokinetic and drug-drug interaction studies. J. Chromatogr. B 2019, 1124, 47–57. [Google Scholar] [CrossRef] [PubMed]
- Zhang, X.; Peng, Y.; Wan, P.; Yin, L.; Wang, G.; Sun, J. Simultaneous determination and pharmacokinetic study of metformin and pioglitazone in dog plasma by LC–MS-MS. J. Chromatogr. Sci. 2014, 52, 52–58. [Google Scholar] [CrossRef] [PubMed][Green Version]
- Jagadeesh, B.; Bharathi, D.V.; Pankaj, C.; Narayana, V.S.; Venkateswarulu, V. Development and validation of highly selective and robust method for simultaneous estimation of pioglitazone, hydroxypioglitazone and metformin in human plasma by LC–MS/MS: Application to a pharmacokinetic study. J. Chromatogr. B 2013, 930, 136–145. [Google Scholar] [CrossRef]
- Polagani, S.R.; Pilli, N.R.; Gajula, R.; Gandu, V. Simultaneous determination of atorvastatin, metformin and glimepiride in human plasma by LC–MS/MS and its application to a human pharmacokinetic study. J. Pharm. Anal. 2013, 3, 9–19. [Google Scholar] [CrossRef]
- Wattamwar, T.; Mungantiwar, A.; Gujar, S.; Pandita, N. Development of LC-MS/MS method for simultaneous determination of Canagliflozin and Metformin in human plasma and its pharmacokinetic application in Indian population under fast and fed conditions. J. Chromatogr. B Anal. Technol. Biomed. Life Sci. 2020, 1154, 122281. [Google Scholar] [CrossRef]
- Hsieh, Y.; Galviz, G.; Hwa, J.J. Ultra-performance hydrophilic interaction LC-MS/MS for the determination of metformin in mouse plasma. Bioanalysis 2009, 1, 1073–1079. [Google Scholar] [CrossRef]
- Abou-Omar, M.N.; Kenawy, M.; Youssef, A.O.; Alharthi, S.; Attia, M.S.; Mohamed, E.H. Validation of a novel UPLC-MS/MS method for estimation of metformin and empagliflozin simultaneously in human plasma using freezing lipid precipitation approach and its application to pharmacokinetic study. J. Pharm. Biomed. Anal. 2021, 200, 114078. [Google Scholar] [CrossRef]


Disclaimer/Publisher’s Note: The statements, opinions and data contained in all publications are solely those of the individual author(s) and contributor(s) and not of MDPI and/or the editor(s). MDPI and/or the editor(s) disclaim responsibility for any injury to people or property resulting from any ideas, methods, instructions or products referred to in the content. |
© 2023 by the authors. Licensee MDPI, Basel, Switzerland. This article is an open access article distributed under the terms and conditions of the Creative Commons Attribution (CC BY) license (https://creativecommons.org/licenses/by/4.0/).