Article

Preparation of Iron Oxalate from Iron Ore and Its Application in Photocatalytic Rhodamine B Degradation

by
Chitiphon Chuaicham
1,*,
Sulakshana Shenoy
1,
Jirawat Trakulmututa
1,
Vellaichamy Balakumar
2,
Phatchada Santawaja
3,
Shinji Kudo
3,
Karthikeyan Sekar
1,4 and
Keiko Sasaki
1,*
1
Department of Earth Resources Engineering, Kyushu University, Fukuoka 819-0395, Japan
2
Department of Chemistry, Sri Ramakrishna College of Arts & Science, Coimbatore 641006, Tamilnadu, India
3
Interdisciplinary Graduate School of Engineering Sciences, Institute for Materials Chemistry and Engineering, Kyushu University, Kasuga 816-8580, Japan
4
Department of Chemistry, Faculty of Engineering and Technology, SRM Institute of Science and Technology, Kattankulathur 603203, Tamil Nadu, India
*
Authors to whom correspondence should be addressed.
Separations 2023, 10(7), 378; https://doi.org/10.3390/separations10070378
Submission received: 11 May 2023 / Revised: 15 June 2023 / Accepted: 25 June 2023 / Published: 27 June 2023
(This article belongs to the Section Environmental Separations)

Abstract

:
In this study, iron oxalate dihydrate (FOD-ore) was produced from iron ore by the process using oxalic acid to extract iron, followed by photo-reduction. Several techniques, such as X-ray powder diffraction (XRD), Raman, scanning electron microscopy with energy dispersive X-Ray analysis (SEM-EDX), ultraviolet–visible diffuse reflectance spectroscopy (UV-DRS), photoluminescence spectroscopy (PL), and X-ray photoelectron spectroscopy (XPS), were used to determine the physicochemical properties of the FOD-ore sample. To compare the photocatalytic activity of FOD-ore, commercial hematite (Fe2O3) was used as a precursor to creating iron oxalate (FOD). The FOD-ore was applied to the photocatalytic degradation of rhodamine B (RhB), a model organic pollutant in wastewater. Using the produced FOD-ore, we were able to degrade more than 85% of RhB within 90 min at a rate approximately 1.4 times higher than that with FOD. FOD-ore demonstrated greater light absorption than FOD, resulting in improved RhB degradation performance. Moreover, the enhanced separation and transport of photogenerated electron-hole pairs can be attributed to the increased photocatalytic RhB degradation rate of FOD-ore, confirmed by photoluminescence results. Therefore, FOD-ore can be utilized as a potential photocatalyst in the degradation process for other organic pollutants under light irradiation.

1. Introduction

Increasing pollution levels are a direct result of rapid industrialization, which poses significant threats to the environment [1]. Industries that use synthetic dyes for a variety of applications are major contributors to dye pollutants, as they discharge untreated or partially treated effluent containing the dye into water bodies. The chemical structures of these dye molecules are highly stable, so it is not easy to degrade them. One common organic dye found in the textile and paper industries is rhodamine B (RhB) [2]. It is extremely harmful to all forms of life, causing irritation of the eyes, respiratory tract, and skin. Hence, it is important to effectively treat industrial wastewater that contains synthetic dyes. Therefore, semiconductor-based photocatalysis can be employed for the degradation of these organic contaminants [3,4].
Most semiconductors need the use of costly, high-purity chemicals in their synthesis. There may be a lot of processes and unusual preconditions for synthesizing them. As a result, their synthesis can be quite expensive. Nevertheless, hematite and other naturally occurring mineral ores are also capable of being turned into photocatalysts with only a small amount of refining. Recently, there has been a lot of research into developing photocatalysts from naturally occurring mineral ores [5]. For instance, iron ores typically contain iron in one or more of its oxidized forms, such as hematite (Fe2O3), magnetite (Fe3O4), goethite (FeO(OH)), limonite (FeO(OH)·nH2O), or siderite (FeCO3). Hematite is the most commonly occurring form of iron in ores, followed by magnetite. These two forms, together, account for about 90% of all iron ore production. Hematite is a red or reddish-brown mineral that often forms compact, fine-grained masses. Magnetite is a black or dark-brown mineral that typically occurs as octahedral crystals or in granular aggregates. The specific form of iron in an ore depends on the geological processes that formed the deposit, as well as the conditions under which the ore was deposited and subsequently altered. The different forms of iron in an ore can affect the processing and refining methods required to extract the metal. Thus, the extracted iron from ore could be an alternative earth-abundant iron-based photocatalyst for organic dye decomposition. For instance, due to their high catalytic activity, iron organic complexes have been the subject of extensive research [6]. One of the simplest coordination polymers, ferrous oxalate, has a one-dimensional chain structure consisting of Fe2+ and C2O42− ions [7]. There are several reports wherein these FeC2O4 complexes are used for various photocatalytic applications [8,9,10]. These FeC2O4 complexes were produced using chemical reagents rather than naturally occurring iron ore.
Herein, to obtain Fe(III) oxalate in an aqueous solution, we use a procedure that involves the direct dissolving of iron from the iron ore via oxalic acid. After obtaining Fe(III) oxalate, a simple photo-reduction process is used to obtain Fe(II) oxalate. Various methods were used to determine the optical and physicochemical characteristics of the produced complex. The photocatalytic performance of the as-synthesized FeC2O4 was evaluated towards the degradation of RhB. XRD, Raman, SEM-EDX, UV-DRS, PL, and XPS were utilized to investigate the physicochemical properties of the FOD-ore sample. Additionally, the hematite was used as a precursor to producing iron oxalate (FOD) to compare the photocatalytic activity of FOD-ore to that of conventional iron oxalate.

2. Materials and Methods

2.1. Chemicals

Fujifilm Wako Pure Chemical Co. (Osaka, Japan) supplied the following chemicals for the synthesis and all experiments: oxalic acid, hematite (Fe2O3), p-benzoquinone (BQ), acetonitrile, isopropyl alcohol (IPA), and ethylenediaminetetraacetic acid disodium (EDTA-2Na). 5,5′-dimethyl-1-pirroline-N-oxide (DMPO) was obtained from Tokyo Chemical Industry Co., Ltd., Tokyo, Japan. Rhodamine B (RhB) was purchased from Sigma-Aldrich. Before use, none of the chemicals were further purified. The aqueous solutions of these chemicals were prepared using DI water.

2.2. Iron Oxalate from Iron Ore (FOD-Ore) and Iron Oxalate from Hematite (FOD) Preparation

The samples of iron oxalate were produced by dissolving Fe from Fe sources (iron ore and hematite), followed by the photo-reduction technique adapted from a previous report [11]. The purpose of the utilization of different Fe sources is to compare the photocatalytic activity and optical properties of the obtained iron oxalate products. A total of 15 g of iron ore or hematite was added to a 1 M, 250 mL solution of oxalic acid. The suspended solution was heated at 100 °C while being agitated and refluxed for 6 h. Using a 0.45 µm filter, the dissolved Fe(III) oxalate solution was then separated from the remaining solid residue. The dissolved Fe(III) oxalate solution was then subjected to photo-reduction under a 100 W Hg lamp for 1 h to convert the oxidation state of the Fe ion from Fe(III) to Fe(II) and precipitate it. The composites obtained with two Fe sources (iron ore and hematite) were designated as FOD-ore and FOD, respectively.

2.3. Characterization

Using an Ultima IV X-ray diffraction (XRD) instrument from RIGAKU (Akishima, Japan), the crystal phase structures of all of the materials were analyzed. We utilized Raman spectroscopy (Thermo ScientificTM DXR3 SmartRaman spectrometer, Waltham, MA, USA) in order to evaluate more about the chemical composition and functional groups of FOD-ore and FOD. Using scanning electron microscopy (SEM, Hitachi High-Tech FlexSEM1000II, WITec K.K, Tokyo, Japan), the morphology and surface properties of each sample were determined. UV-Vis diffuse reflectance spectroscopy (UV-DRS, UV-2450 Shimadzu, Kyoto, Japan) was utilized to evaluate the ability of purified and composite materials to absorb light. X-ray photoelectron spectroscopy (XPS, ESCA 5800; ULVAC-PHI, Inc., Kanagawa, Japan) was utilized to determine the VB positions of FOD-ore and FOD. The XPS results were calibrated using a carbon contaminated peak at 284.6 eV in the CasaXPS program. The PL spectroscopy measurements were obtained with a JASCO Corporation (Tokyo, Japan) FP-6600 spectrofluorometer. All sample elemental compositions were determined using XRF spectroscopy with the Rigaku ZSX Primus II in the wavelength dispersive mode (Akishima, Japan). In the Fe K-edge, the XAS spectra of all samples were collected in an SAGA Light Source (SAGA-LS) at BL06, the research center for synchrotron light application, Kyushu University. The spectrum results of Fe K-edge were analyzed by using the Athena and Artemis program version 0.9.25. Electron paramagnetic resonance (EPR) analysis was performed on a JES-FA200 instrument (JEOL, Japan), with 5,5′-dimethyl-1-pirroline-N-oxide (DMPO) as the radical trapping reagent under the UV-visible light irradiation.

2.4. Photocatalytic Degradation of Rhodamine B (RhB)

The photocatalytic degradation ability of FOD-ore and FOD for rhodamine B (RhB) was evaluated in the presence of light. Each reaction began with 50 mg of FOD-ore or FOD suspended in 50 mL of a 10 ppm RhB solution for 15 min to achieve adsorption–desorption equilibrium. The suspended liquid was then illuminated from above with a 500 W Xe lamp (Xenon short arc lamps, Ushio Inc., Tokyo, Japan) at a controlled 25 °C reaction temperature. Using a UV/Vis spectrophotometer (UV-2450, Shimadzu, Japan) at 554 nm, which corresponds to the maximal absorption (λmax) of the RhB molecule, the remaining RhB concentration in the treated solution was determined. Using scavenger experiments, the existence and role of free radicals were investigated. In the scavenger experiments (50 mL of a 10 ppm RhB solution and 50 mg of the obtained catalyst), 1 mole of p-benzoquinone (BQ), isopropyl alcohol (IPA), and ethylenediaminetetraacetic acid disodium (EDTA-2Na) were used to remove the superoxide anion radical, hydroxyl radical, and hole, respectively. For reusability, the used catalyst from the preceding cycle was separated from the solution by centrifugation and used for the next cycle without further purification. For analyzing the degradation byproducts of RhB, gas chromatography–mass spectrometry (GC-MS, Agilent 6890 N) equipped with column HP-5MS UI (Length = 30 m, φ = 0.250 mm) and He gas as a carrier at a flow rate = 1 mL min−1 was used.

3. Results and Discussion

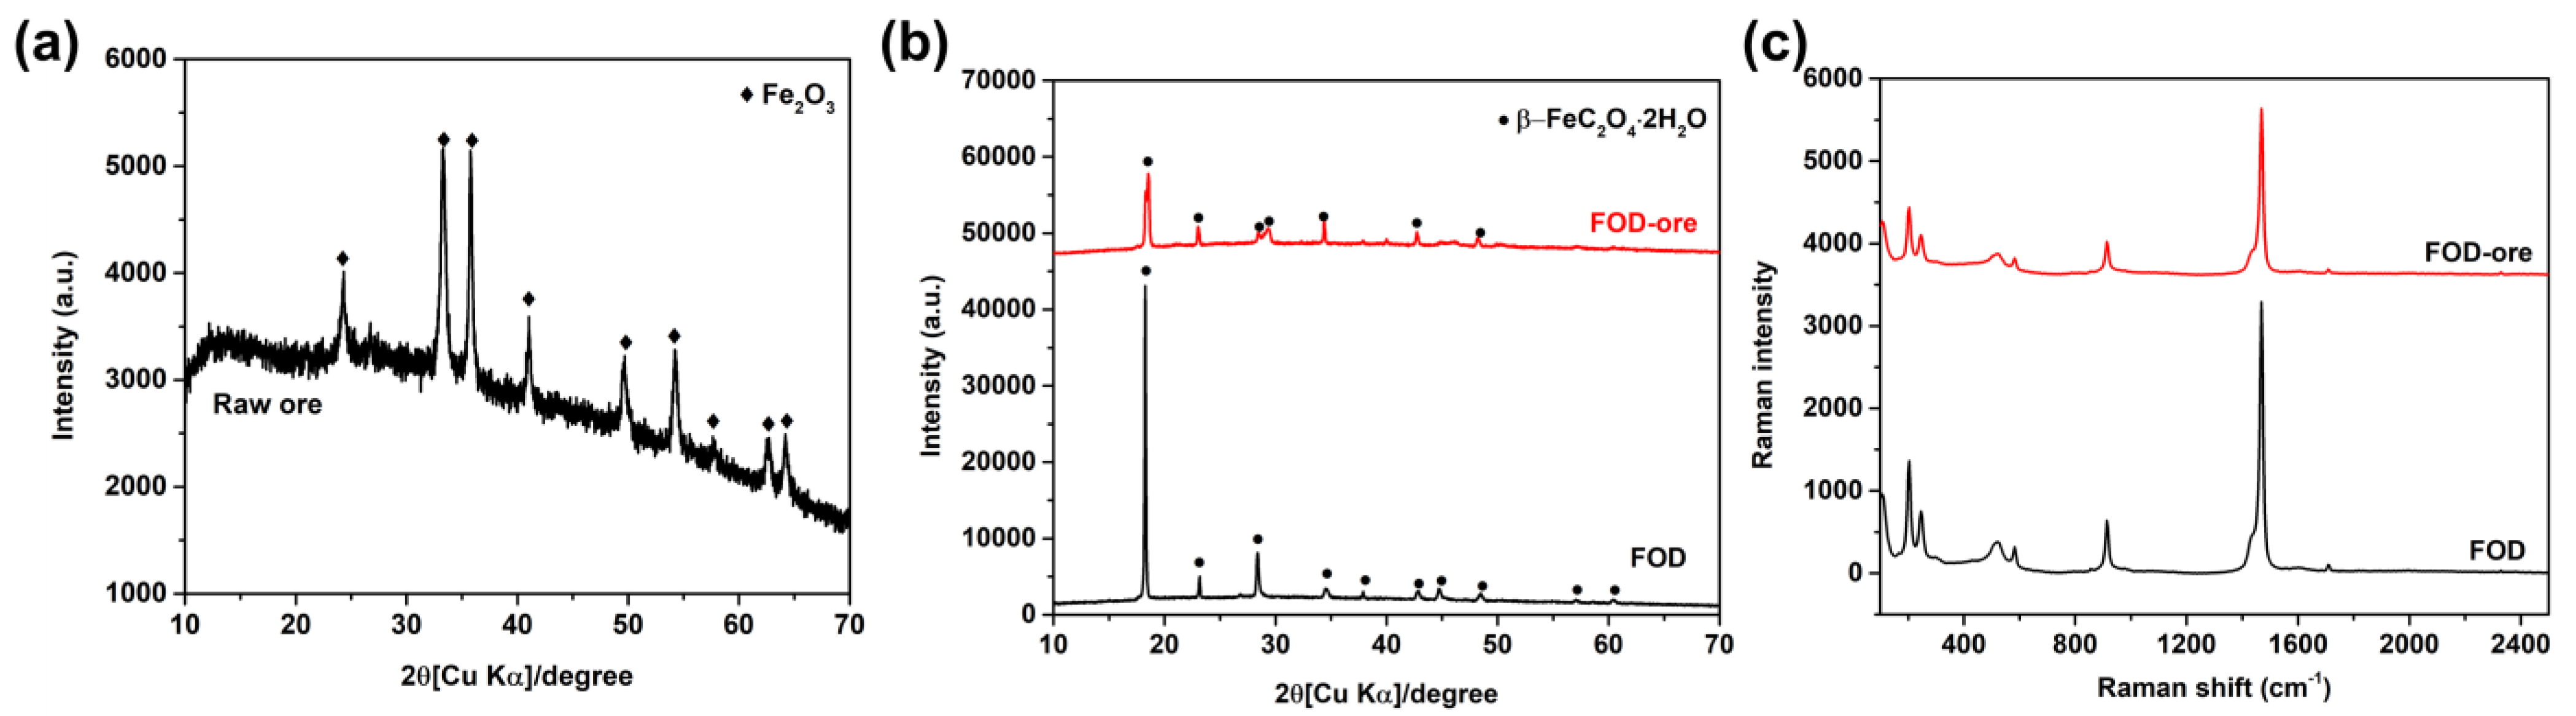
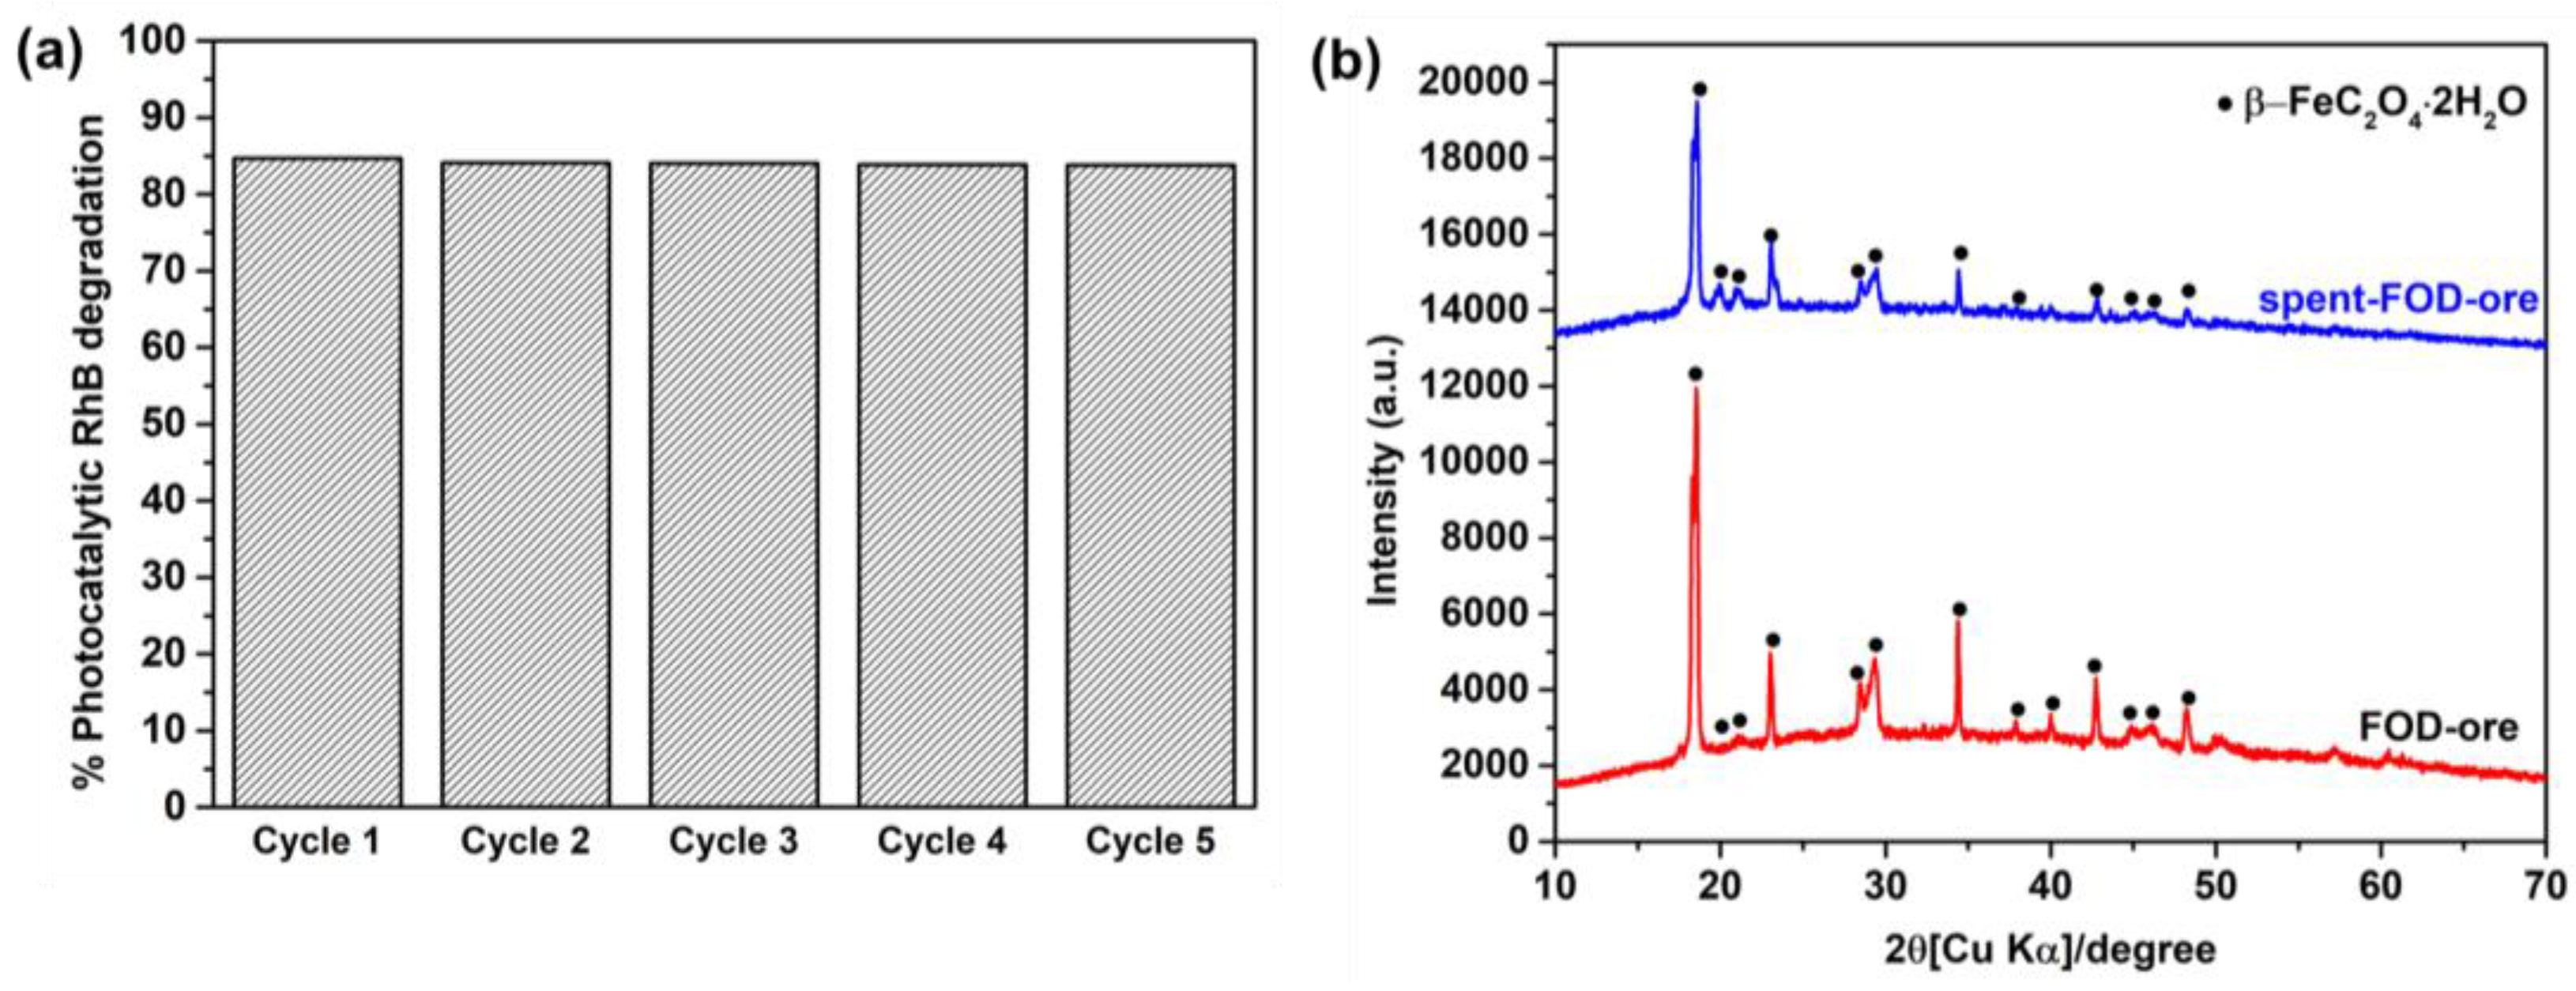
3.1. Investigation of the Phase Structure and Chemical Properties

The XRD analysis of the crystal phase structures of raw iron ore, FOD-ore, and FOD is depicted in Figure 1a,b. It can be seen that raw iron ore (Figure 1a) showed the major phase of hematite (Fe2O3) with the main diffraction peaks at 24.4°, 33.2°, 35.9°, 41.2°, 49.7°, 54.3°, 62.6°, and 64.3°, corresponding to the JCPDS 01-076-4579 [12]. After the extraction process of iron from raw iron ore and commercial hematite, distinguished peaks at 18.6°, 20.9°, 22.9°, 28.4°, 29.3°, 34.5°, 37.9°, 40.1°, 42.7°, 44.7°, 46.1°, and 48.4°, which correspond to the orthorhombic crystal of the iron oxalate dihydrate, were observed (JCPDS 14-0762 [13]). Based on the XRD results, the two main diffraction peaks at 33.2°and 35.9°of Fe2O3 and 220 plan at 30.1° (JCPDS card No. 89-3854) of Fe3O4 could not be observed, indicating that it has no other oxide phase impurities in the final product. The major peak of the 002 plane at 18.6° was observed in both FOD-ore and FOD, indicating the successful formation of iron oxalate dihydrate by Fe extraction from both precursors, as shown in Figure 1b. It can be seen that the main diffraction peak intensity at 18.6° of the FOD-ore showed a similar intensity to that of FOD, indicating that the extraction process of Fe from iron ore could not dissolve other elements in the ore as impurities, which can disturb the crystallization of iron oxalate dihydrate. Moreover, XRF analysis was used to determine the elemental compositions of FOD-ore and FOD. Table 1 revealed that FOD and FOD-ore contain only Fe, O, and C, which were derived from the structure of iron oxalate dihydrate; however, FOD-ore presented a lower percentage of Fe compared with the FOD, suggesting that the deficiency of Fe in FOD-ore might generate the defect structure of Fe in the FOD-ore samples, resulting in a change in the optical properties of the FOD-ore sample [14,15,16].
As shown in Figure 1c, Raman spectroscopy was also used to examine the chemical properties of FOD-ore and FOD. At 1468 and 1454 cm−1 in the Raman spectra of both samples, the υ(CO) modes of iron(II) oxalate can be observed. The υ(CO2) mode of iron(II) oxalate corresponds to the two bands located at 582 and 579 cm−1. The peaks at 241 and 203 cm−1 were consistent with υ(FeO) mode assignments, while the band at 114 cm−1 corresponded to the δ(FeO2) mode of a coordinated metal-oxalate system. Consequently, these results confirmed the formation of iron oxalate dihydrate via the extraction and photo-reduction techniques employing both precursors. Moreover, the ratio of the Fe-O/C-O area was calculated to elucidate the ratio of Fe/C in the structure of FOD-ore and FOD. The total peak area of the υ(CO) modes of iron(II) oxalate at 1468 and 1454 cm−1 and the υ(FeO) mode of iron(II) oxalate at 241 and 203 cm−1 were used for the calculation of the ratio of Fe-O/C-O. It was found that the ratio of Fe-O/C-O in FOD-ore was observed at about 0.31, while the FOD was observed at around 0.37, suggesting that the FOD-ore had less Fe content in the structure, proving the Fe defect in the iron oxalate dihydrate structure in FOD-ore.

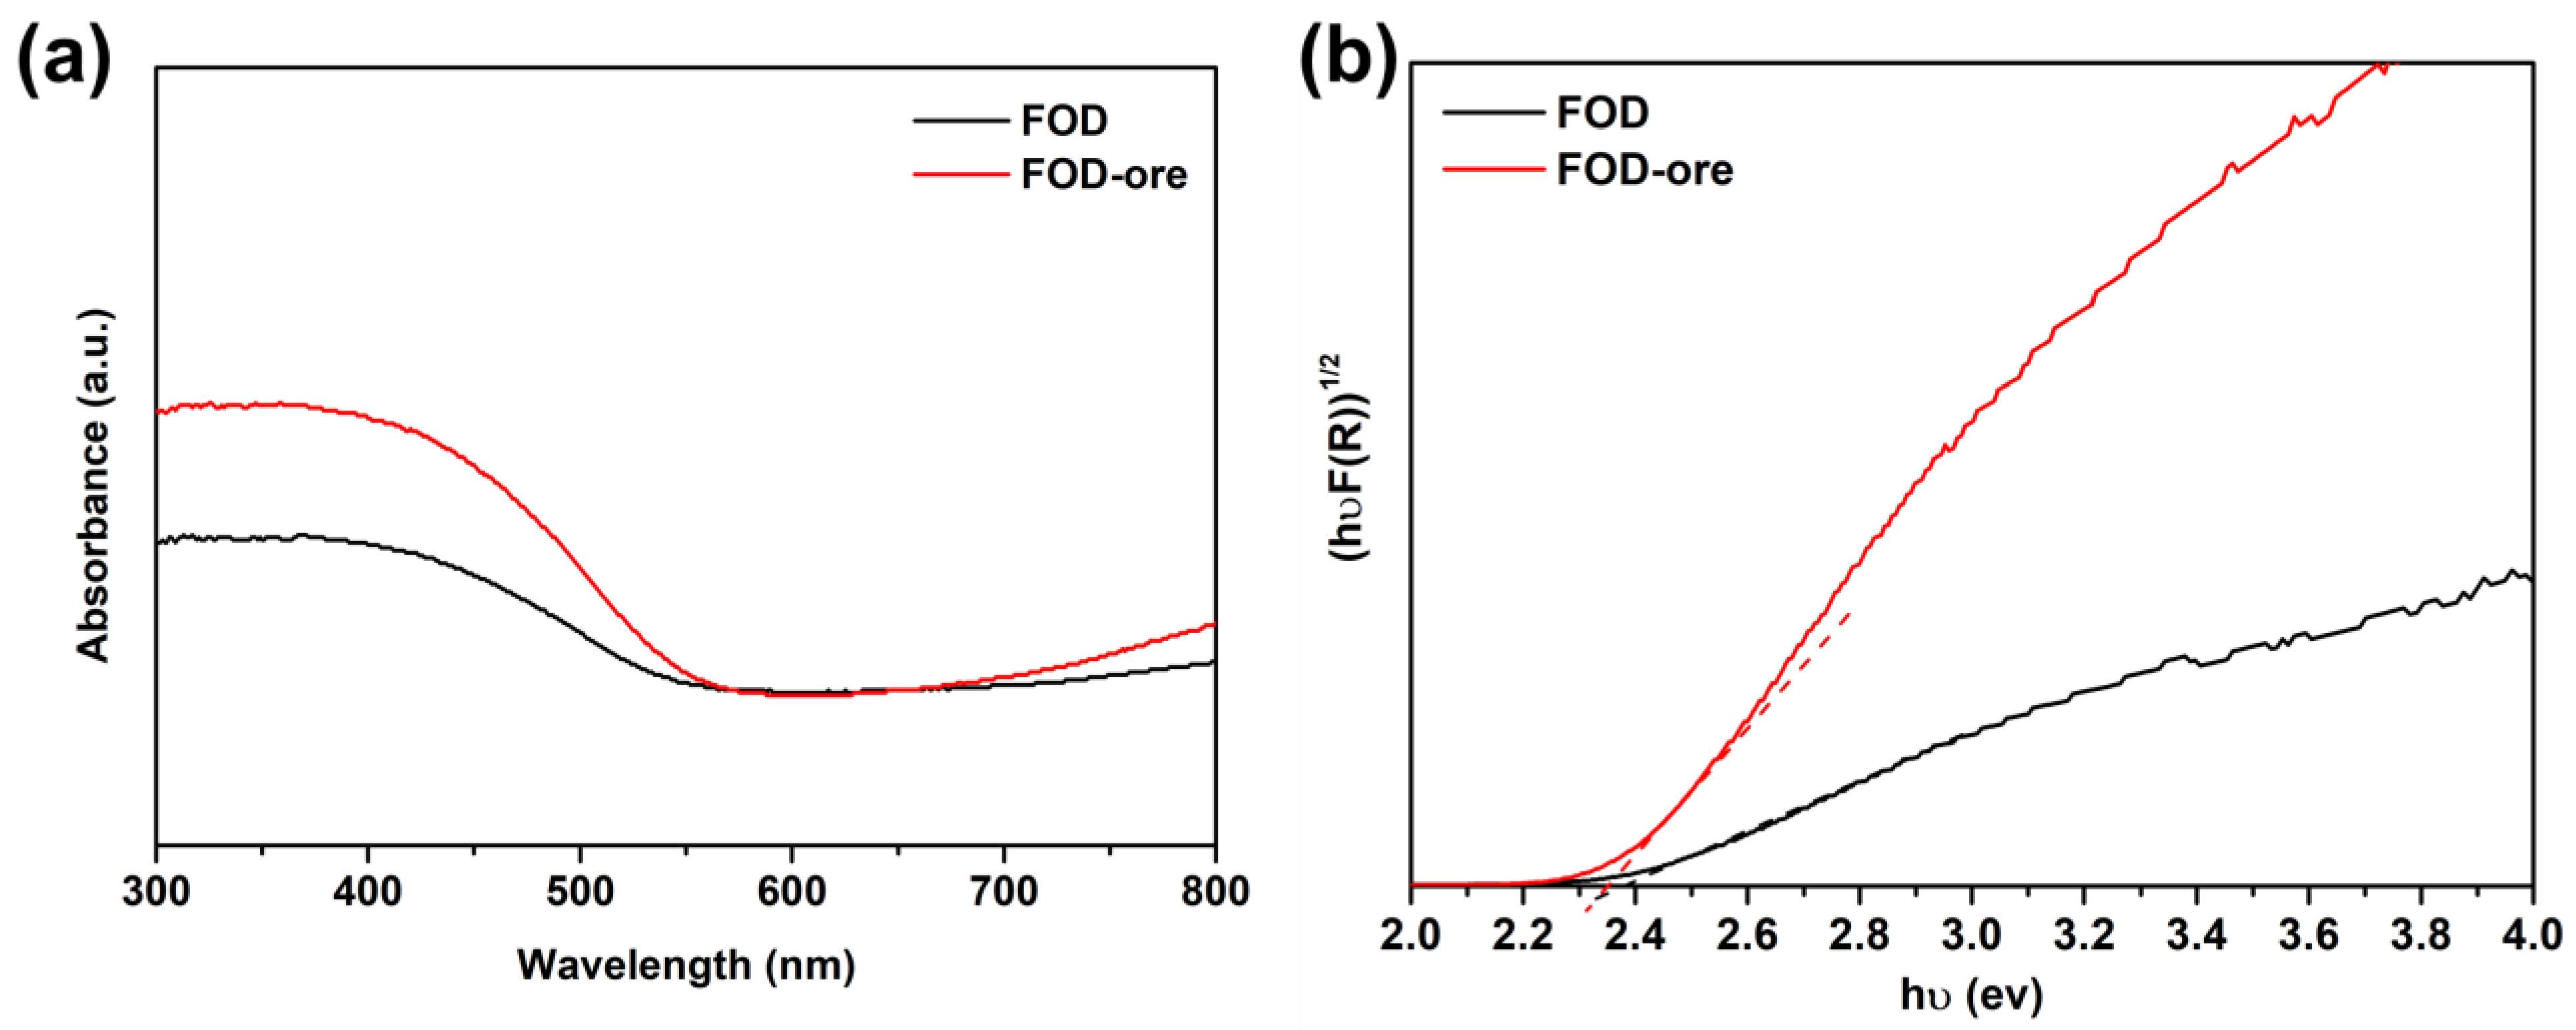
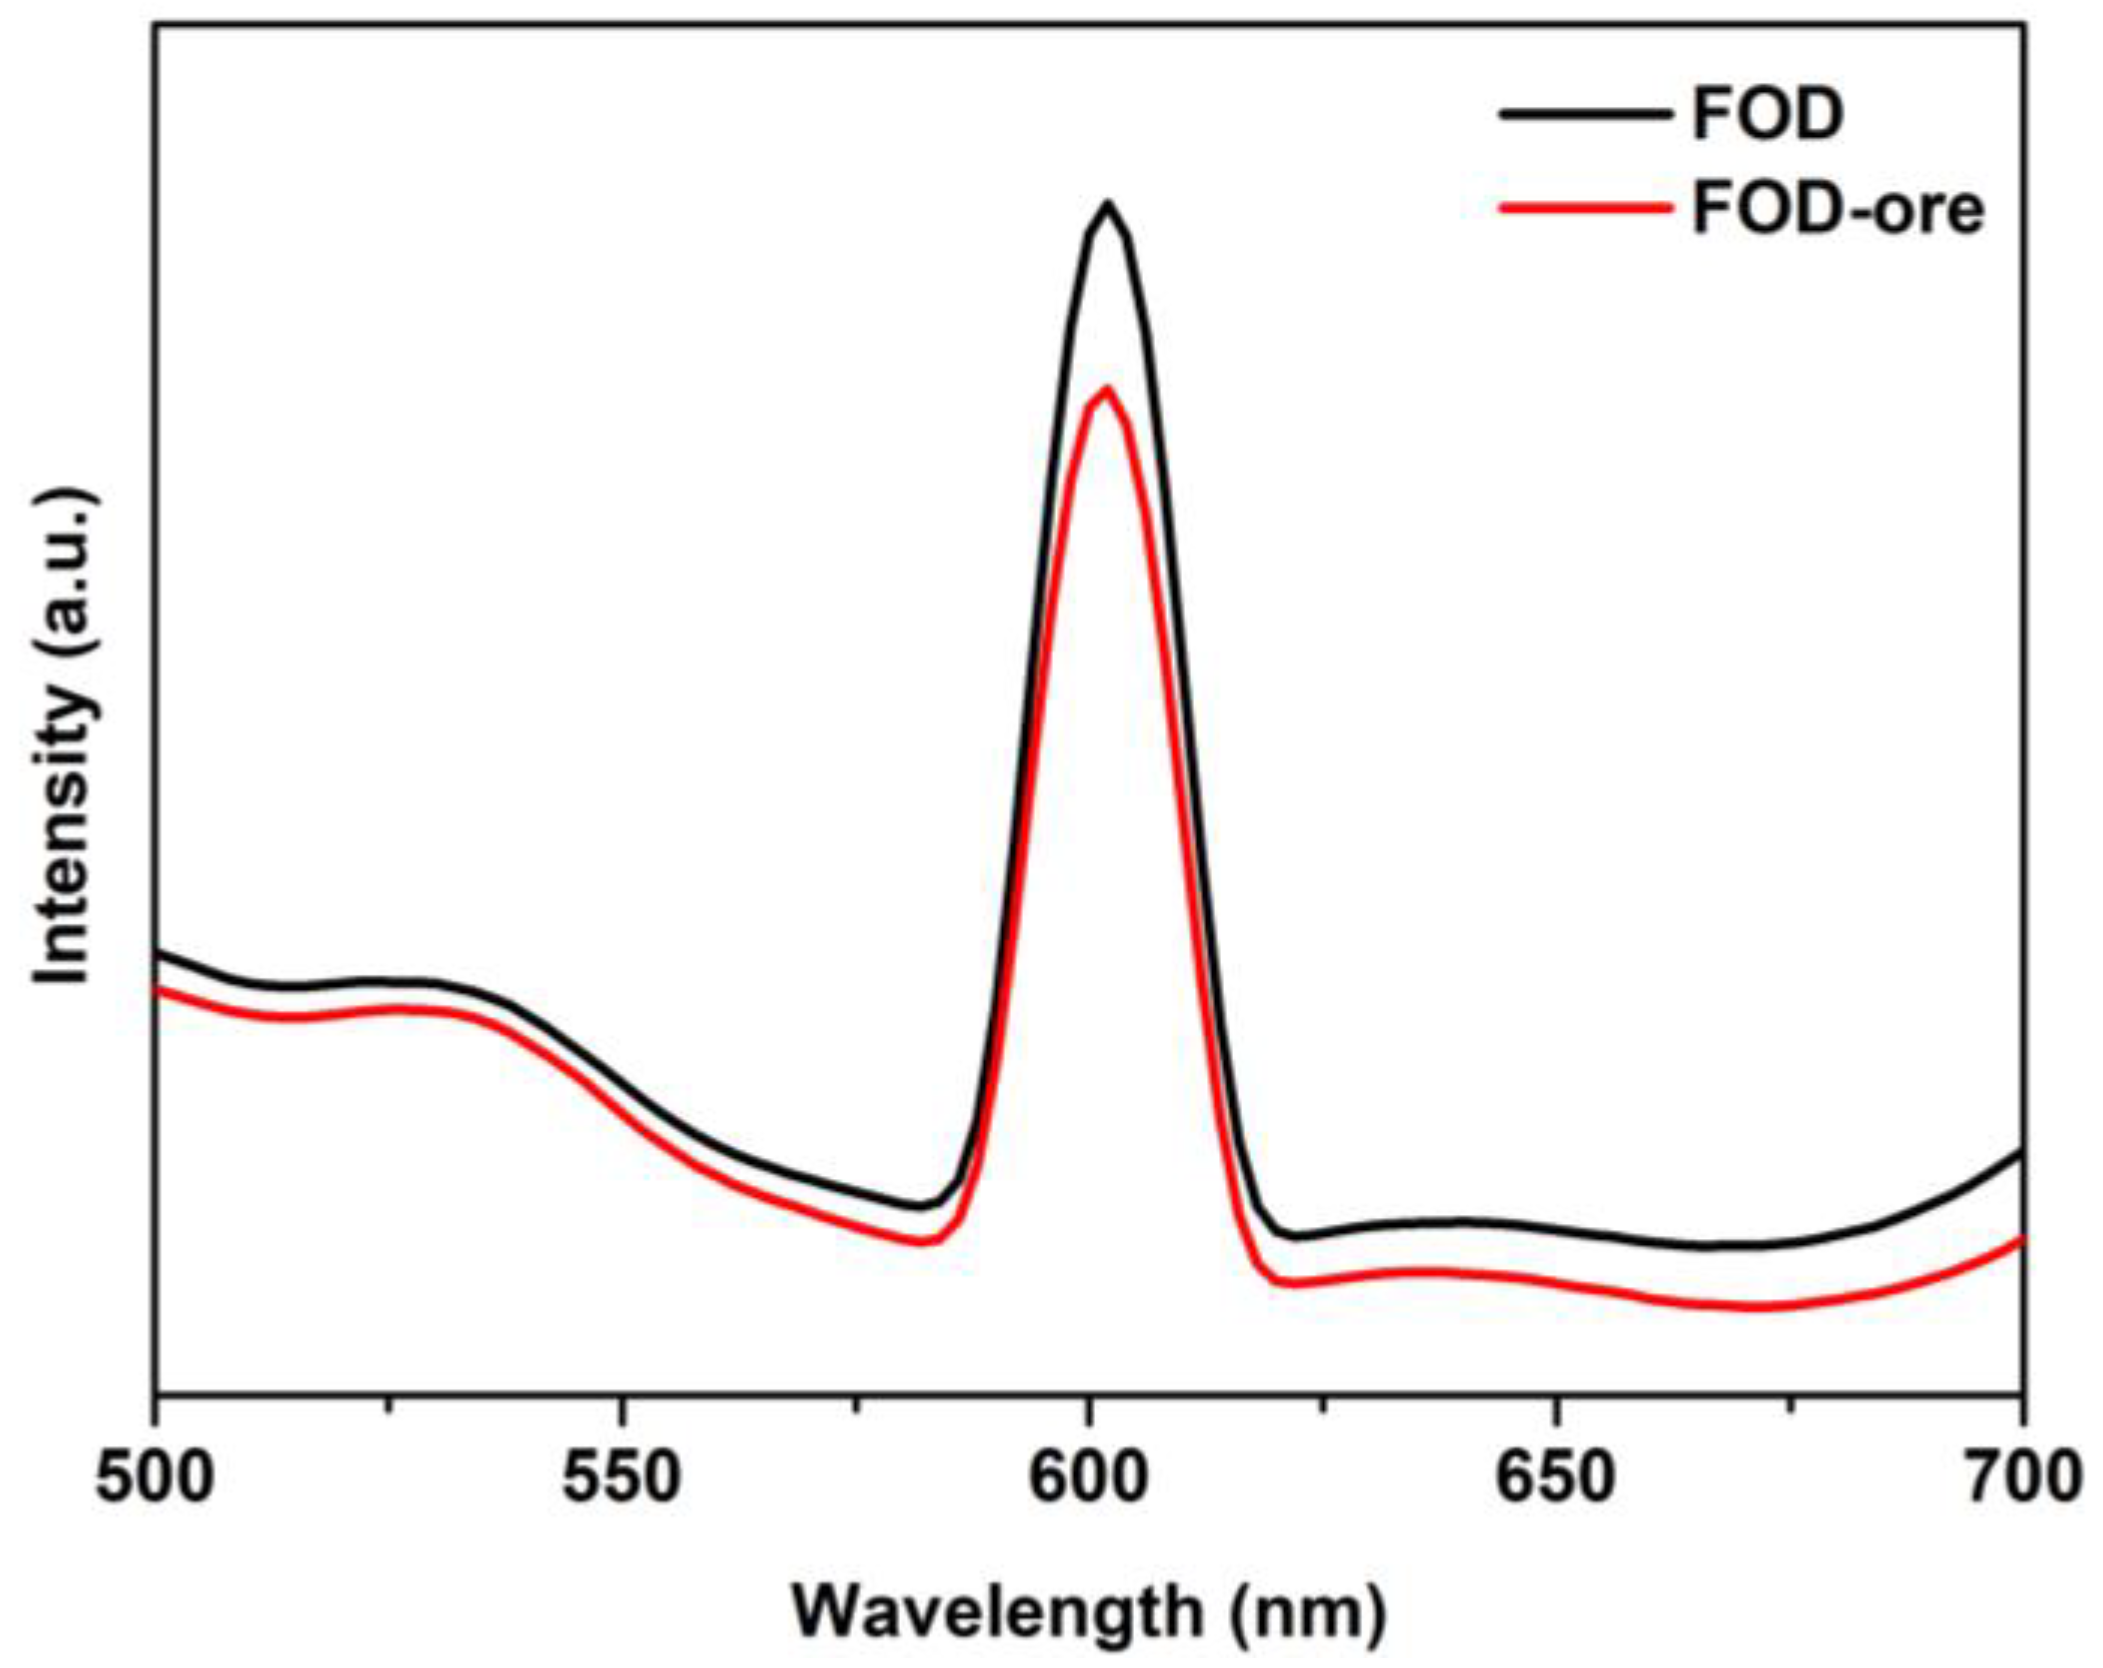
3.2. Optical Characteristics

UV-DRS analysis determined the light absorption ability and energy band gaps of FOD-ore and FOD, which were both essential optical properties for the photocatalytic processes. Figure 2a demonstrated that both FOD-ore and FOD were effective UV and visible light photocatalysts, with maximal absorption occurring between 400 and 450 nm. Visible and ultraviolet light absorption by FOD-ore was significantly higher than that of FOD (approximately 300–550 nm), indicating that the creation of Fe deficiency in the structure of FOD-ore enhanced its optical properties. Its photocatalytic activity toward RhB was enhanced, as was its ability to capture light, due to the large number of charge carriers it generated [17,18]. Using Tauc’s equation, the estimated Eg values of the FOD-ore and FOD samples were calculated [19,20,21]. As shown in Figure 2b, the calculated Eg values for FOD-ore and FOD are 2.35 eV and 2.4 eV, respectively. Additionally, the color of FOD-ore showed a slightly darker yellow than the FOD, which may cause the shift in Eg [22]. The Eg of all FOD-ore samples was less than that of pure FOD. The creation of Fe deficiency in the structure of the FOD-ore may have created a new electronic level between the valence band (VB) and conduction band (CB). The decreased Eg values of the FOD-ore sample indicate that the photocatalytic activity for RhB degradation may be enhanced by the increased generation of electron (e) and hole (h+) pairs during light irradiation.

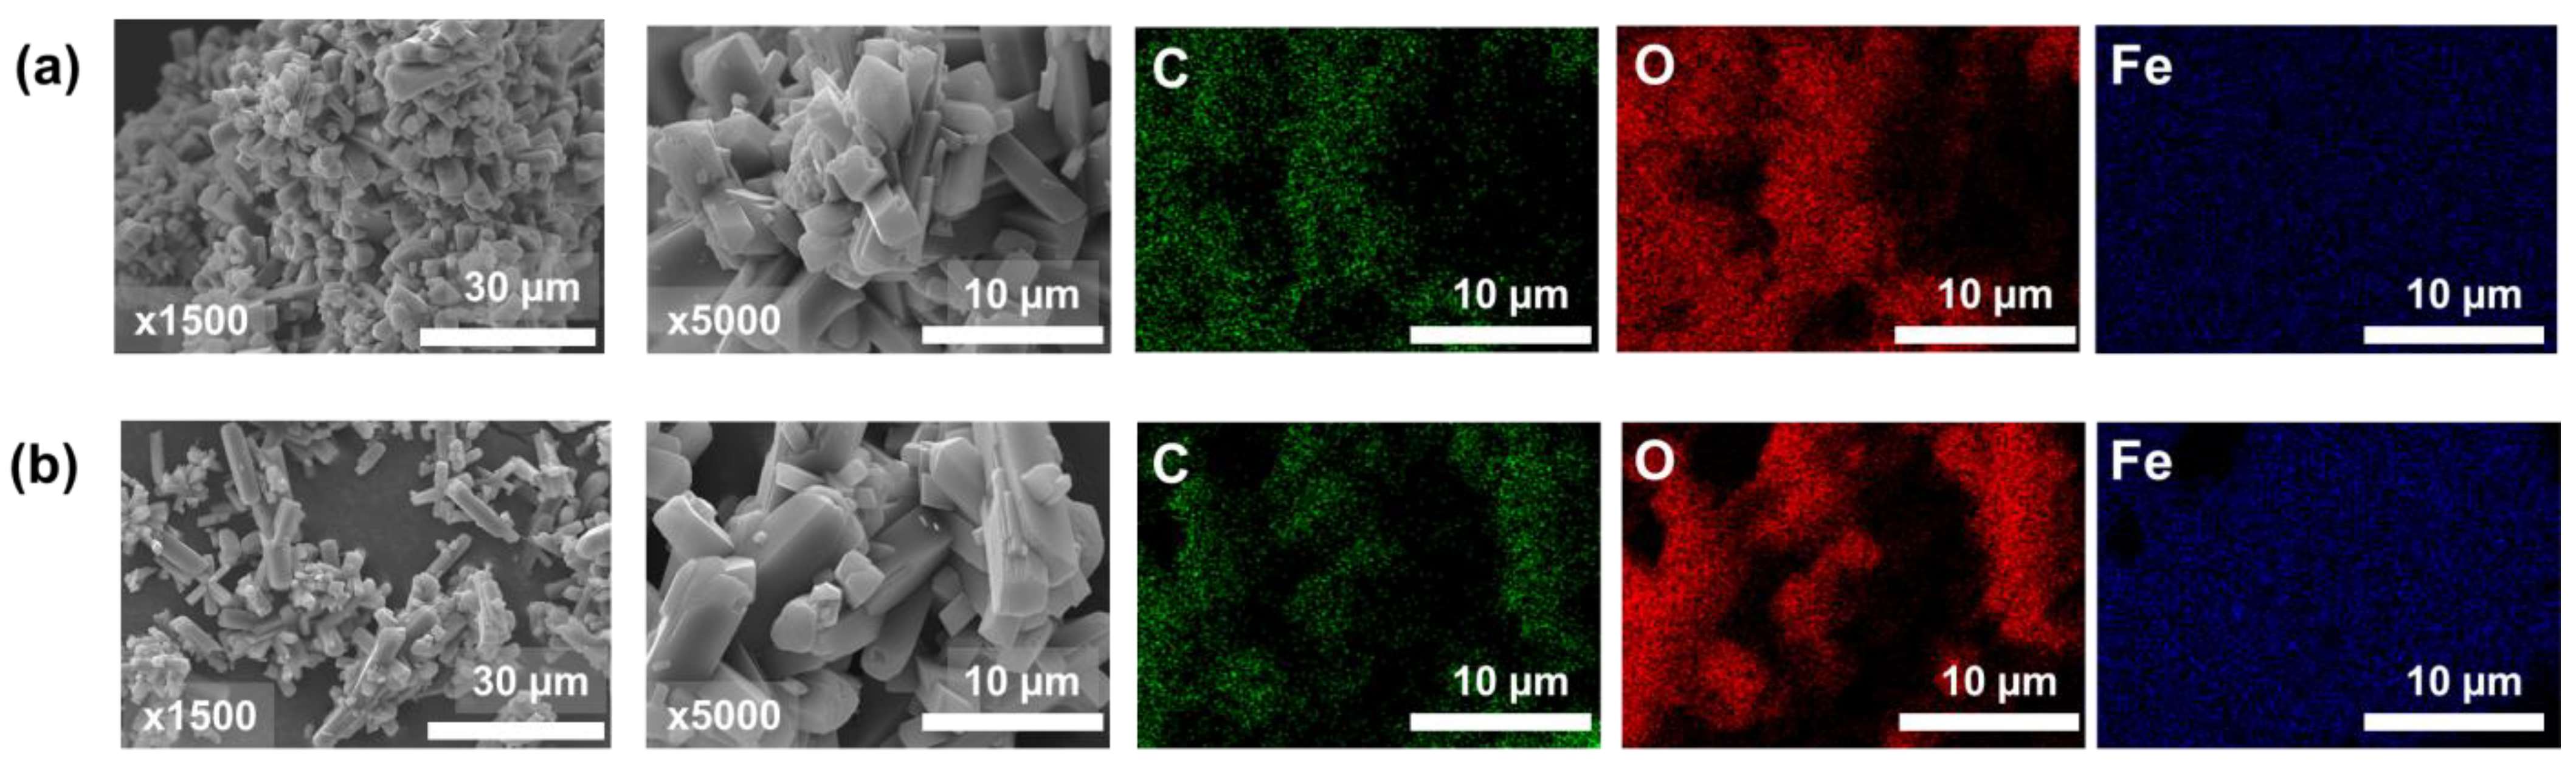
3.3. Morphology Investigation
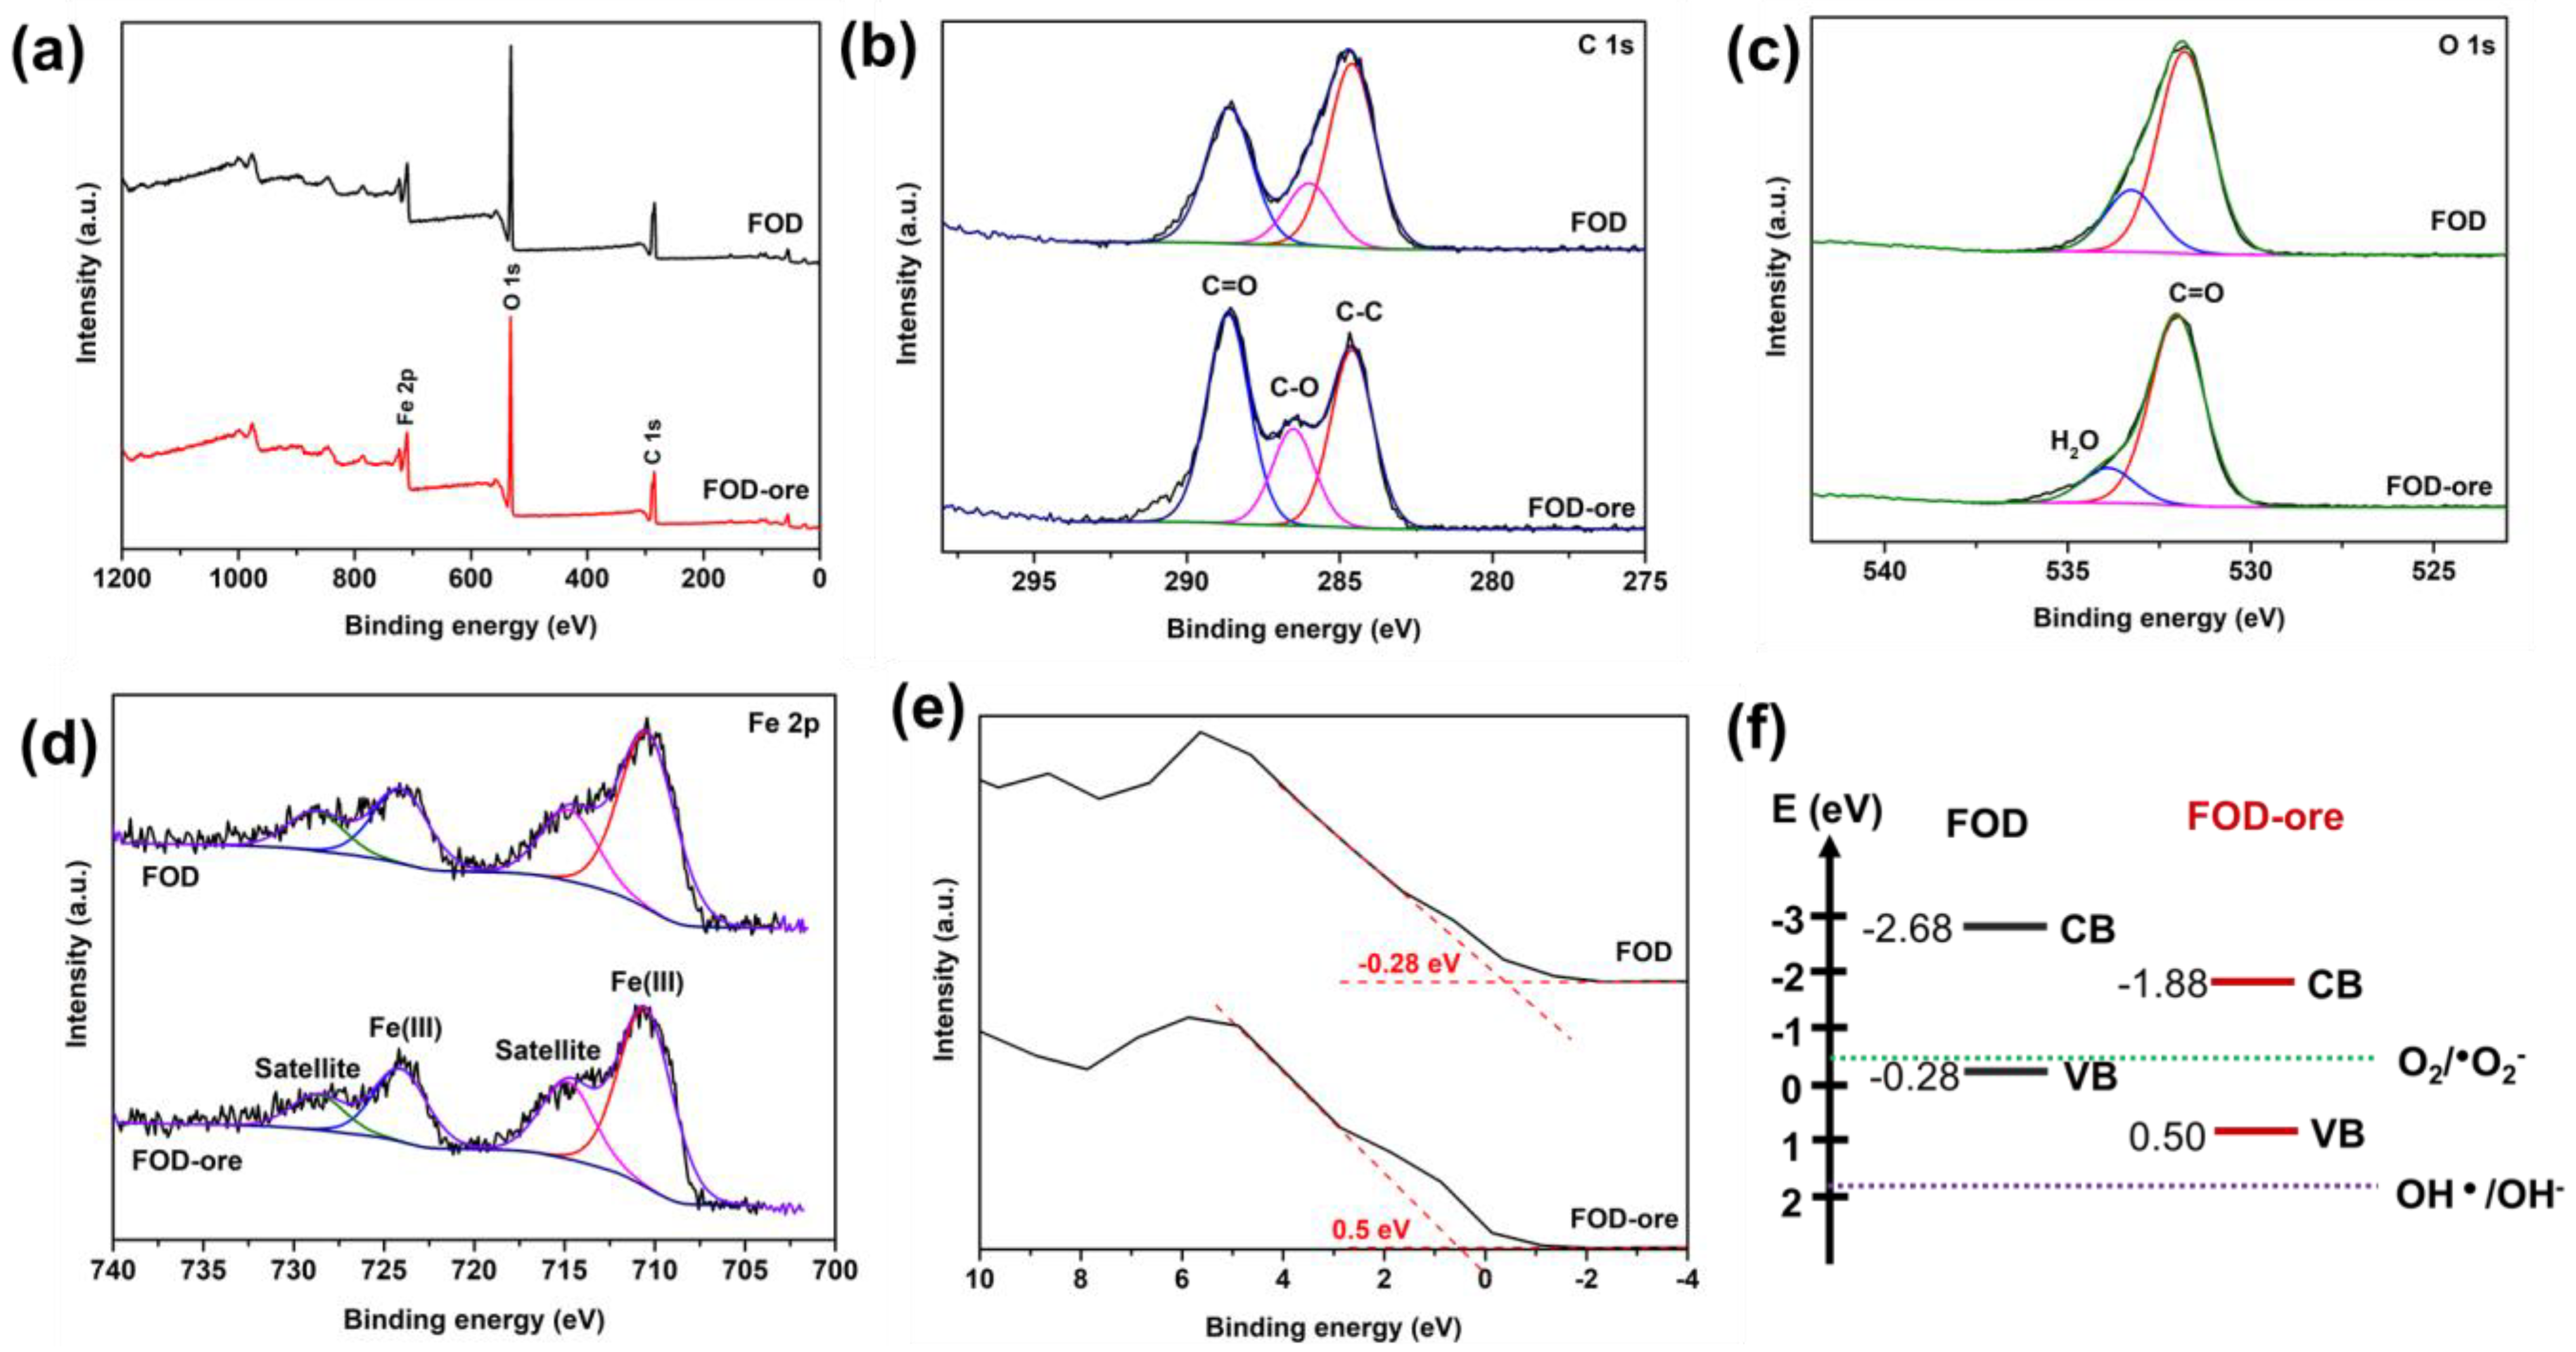
The SEM images of the surface morphologies of FOD and FOD-ore are displayed in Figure 3. The surface morphology of both FOD (Figure 3a) and FOD-ore (Figure 3b) samples revealed aggregated low-crystallinity particles with particle sizes around 10–15 µm. Intriguingly, the FOD-ore sample exhibited less aggregation of iron oxalate particles, indicating that it might have higher surface activity than the FOD, thereby providing a more reactive surface for the photocatalytic decomposition of RhB. Based on the lower aggregation of iron oxalate particles of FOD-ore, FOD-ore should have a higher surface area, resulting in enhanced photocatalytic activity for RhB degradation [22,23]. The SEM-EDX mapping of both FOD-ore and FOD samples revealed an excellent distribution of Fe and O within the structure of iron oxalate. The unambiguous signals of Fe and O elements, which were the main constituents in both FOD-ore and FOD samples, indicated that these elements were the primary constituents of iron oxalate.

3.4. XPS Results

The chemical states of C, Fe, and O, as well as the VB edge of FOD-ore and FOD, were analyzed using XPS. Figure 4a depicts the survey spectra of the FOD-ore and FOD, showing the main peaks of C 1s, O 1s, and Fe 2p, which are the main components in the iron oxalate dihydrate. In a narrow scan (Figure 4b), the C 1s spectra of FOD-ore and FOD depict the deconvolution of the C 1s orbitals of FOD-ore and FOD into three peaks. The deconvoluted signal at 284.6 eV corresponds to the contaminated carbon C–C bond. The remaining two peaks at 285.8 and 288.5 eV were revealed to be a result of the oxalate anion backbone in iron oxalate [24]. In Figure 4c, it is possible to distinguish two distinct O 1s signals, which correspond to the various forms of O in the iron oxalate dihydrate [25]. The C=O peak is located at 531.8 eV, and the H2O peak is located at 532.4 eV. In addition, the main peaks of Fe 2p3/2 and the Fe 2p1/2 peak in Figure 4d were observed around 710 eV and 724 eV in both FOD-ore and FOD, indicating that the chemical state of the Fe in the structure of iron oxalate is divalent and confirming the successful photo-reduction of Fe(III) to Fe(II) [26]. The satellite peaks of Fe were found at 714 eV and 728 eV. In addition, the VB position of FOD-ore and FOD were estimated via XPS [27]. Figure 4e illustrates that the predicted VB positions for FOD-ore and FOD are 0.5 and −0.28 eV, respectively. The CB locations of FOD-ore and FOD were determined to be −1.85 and −2.68 eV, respectively, using UV-DRS data. It can be seen that the FOD-ore showed a less negative CB value than FOD, suggesting that the CB of FOD-ore could promote more of a production of a superoxide anion radical than FOD, which may affect the RhB degradation activity [28,29].

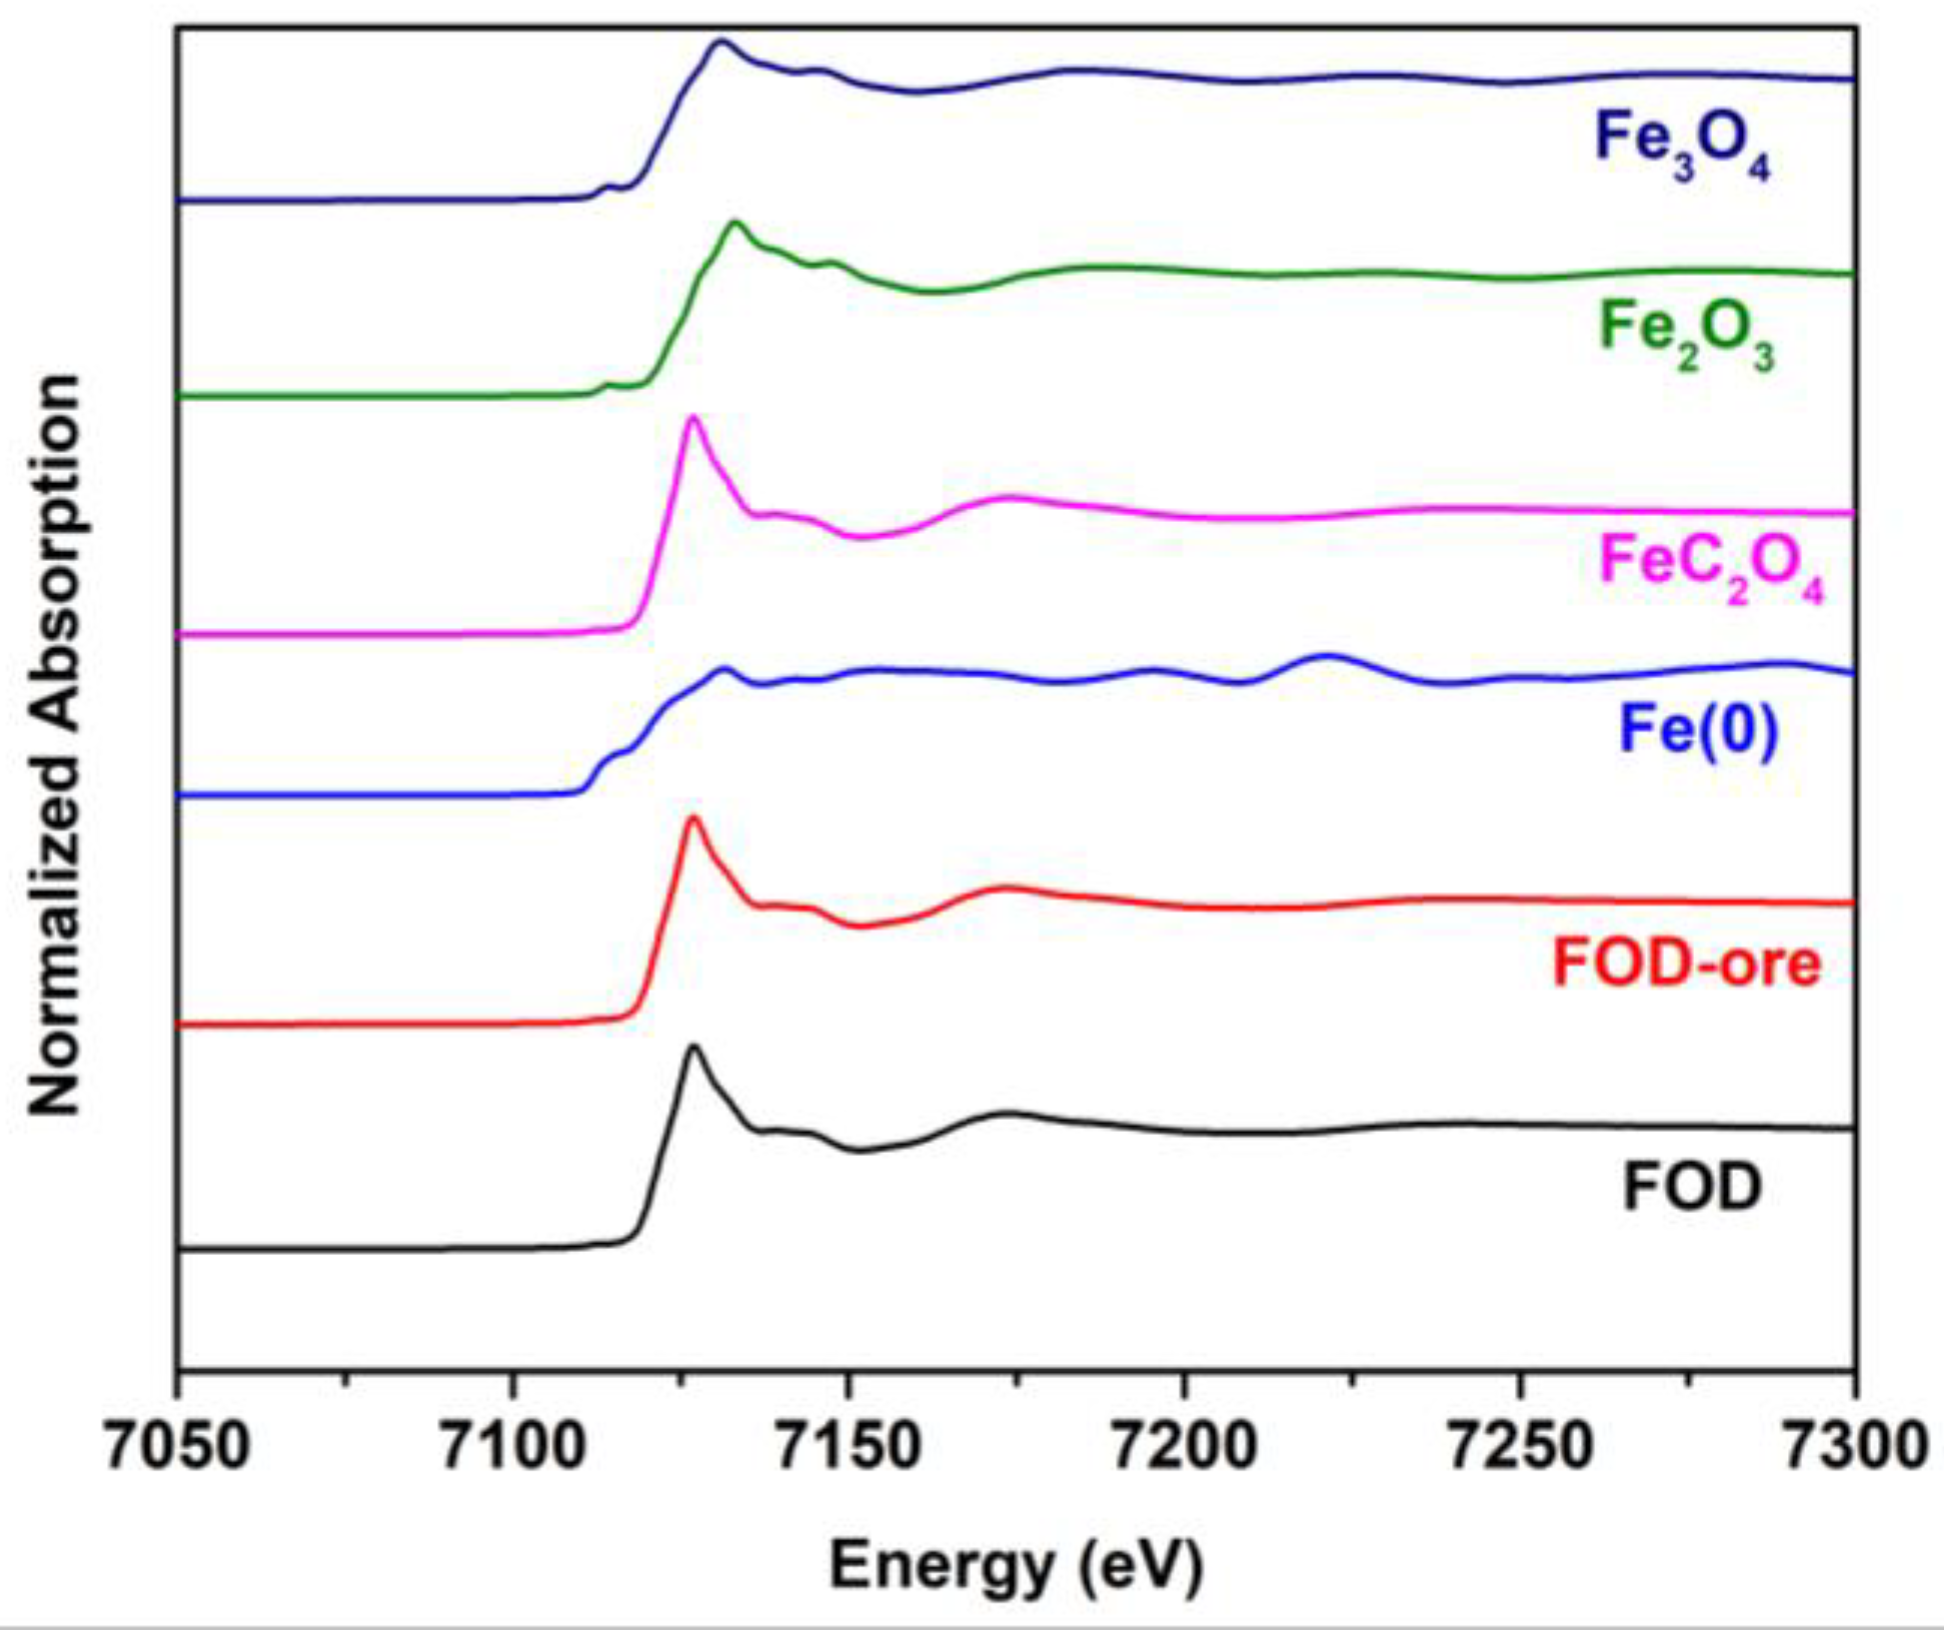
3.5. X-ray Absorption near Edge Structure (XANES) Result

The obtained samples were further investigated by X-ray absorption spectroscopy to elucidate the oxidation and phase structure, as shown in Figure 5. It can be seen that the FOD and FOD-ore showed similar edges around 7125 eV and oscillation spectra after the edge jump with the iron oxalate standard, indicating the successful formation of iron oxalate by the oxalic acid-treated method, with none of the other phase impurities such as iron oxide. Moreover, the oxidation state of Fe species in the FOD and FOD-ore is divalent, as confirmed by the similar binding energy of the FOD and FOD-ore with the iron oxalate standard.

3.6. Examination of the Charge Separation

PL measurements were used to evaluate the effect of the obtained iron oxalate from iron ore (FOD-ore) containing Fe deficiency on the separation and transfer of electrons and holes during illumination. Figure 6 demonstrates that the emission spectra of both the FOD-ore and FOD samples were in the 500–700 nm range. In general, a low PL intensity indicates a low electron-hole pair recombination rate [30,31]. The unique formulation of FOD-ore, which contained the Fe deficiency in the structure of FOD-ore, enhanced charge carrier separation, as evidenced by the lower PL emission intensity of FOD-ore relative to FOD at approximately 600 nm for an excitation wavelength of 350 nm. The creation of Fe deficiency in the structure of FOD-ore enhanced the electronic properties of the sample, including charge separation and electron transport.

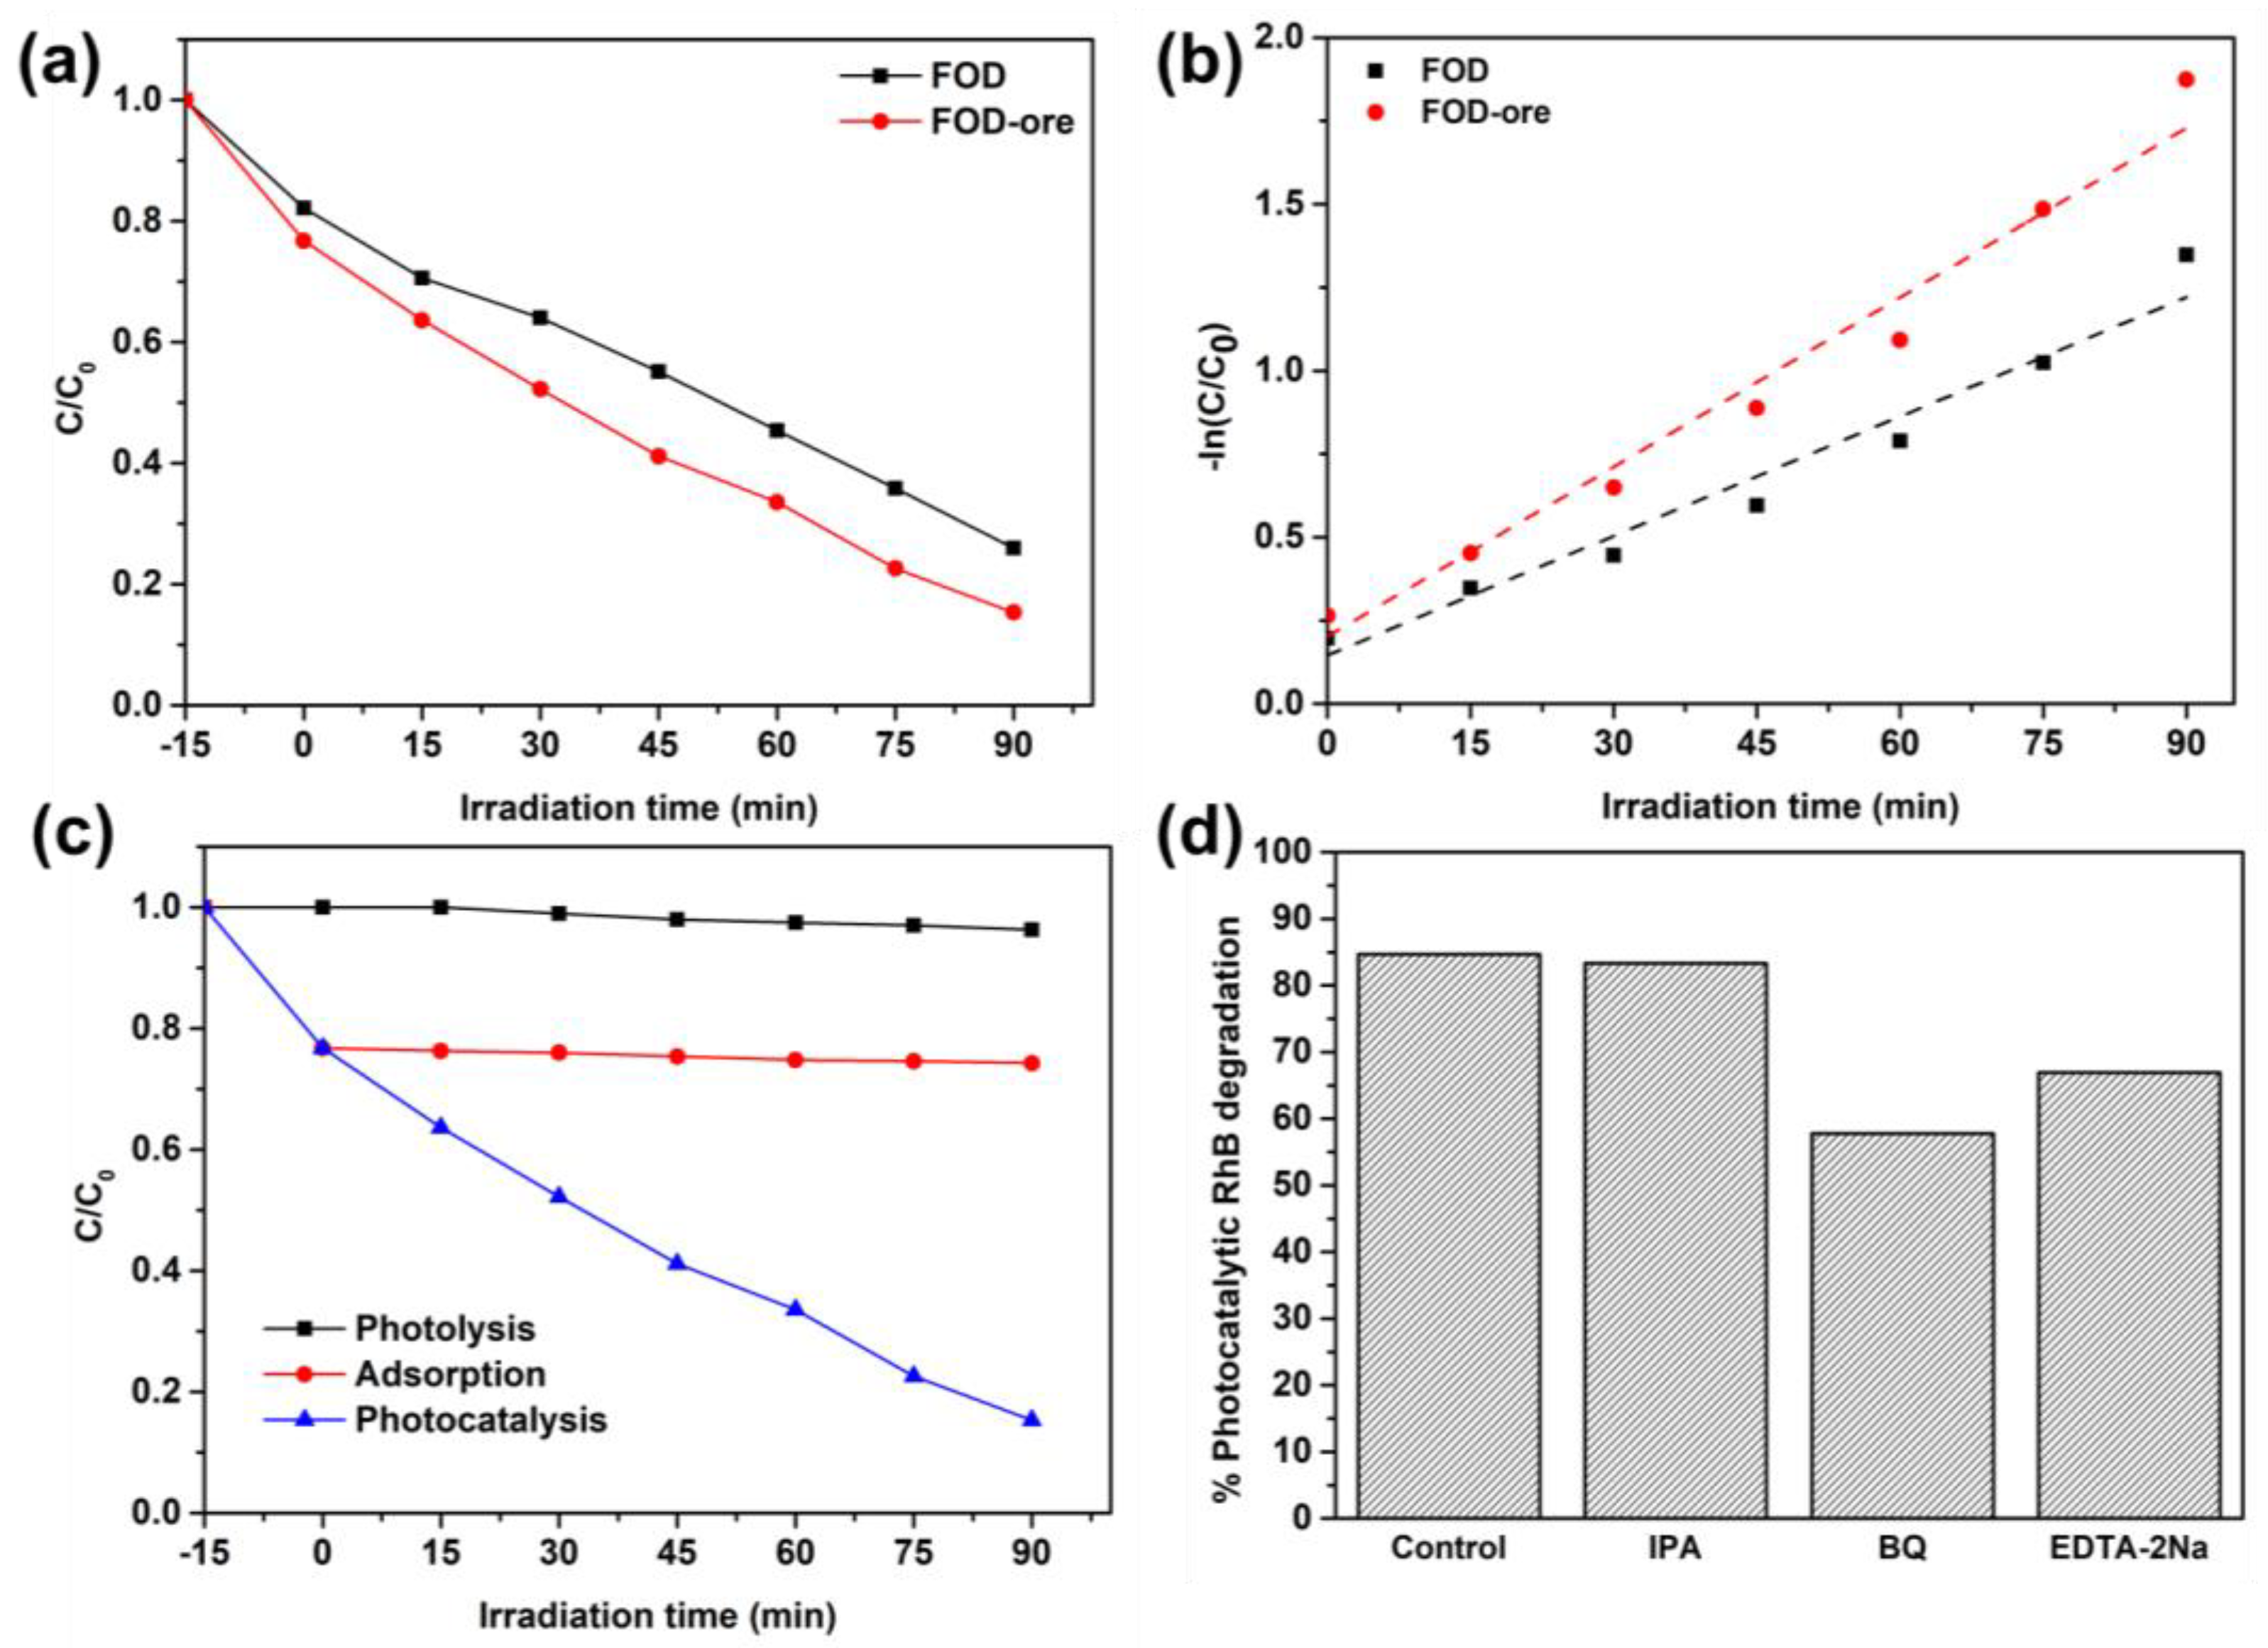
3.7. Degradation of Rhodamine B (RhB) via Photocatalysis

The photocatalytic activity of FOD-ore and FOD was determined by the decomposition of RhB under light illumination. As shown in Figure 7a, the adsorption capacity for RhB in FOD-ore and FOD samples was approximately 25% under dark conditions. Intriguingly, the RhB adsorption capacity of FOD-ore was greater than that of pure FOD. This may be due to the fact that the FOD-ore sample has a greater active surface due to less agglomeration of FOD-ore, as observed from SEM data, resulting in a greater number of interactions with RhB molecules. After that, the degradation efficiencies (C/C0) of each sample were measured in order to evaluate their photocatalytic activities when subjected to simulated solar light from a 500 Xe lamp. After 90 min, the C/C0 values of FOD-ore and FOD samples were 0.153 and 0.259, respectively. Thus, the synthesis of iron oxalate by the extraction of Fe from iron ore has a greater potential for photocatalytic RhB degradation than conventional FOD due to their enhanced light absorption and charge separation properties. Detailing the photocatalytic RhB degradation activity, FOD-ore demonstrated the maximum level, approximately 85%, within 90 min, whereas FOD demonstrated degradation activity of approximately 74% within the same reaction time. The abundance of the defect in the structure of iron oxalate inhibited the FOD-ore’s RhB degradation activity. In addition, photocatalytic RhB degradation rates for FOD-ore and FOD were fitted to experimental data using a pseudo-first-order kinetic model, as shown in Figure 7b. The constant rate of reaction (k) values for FOD-ore and FOD were 0.017 and 0.012 min−1, respectively. The rate constant of FOD-ore was 1.4 times higher than that of FOD. Therefore, our findings indicate that the photocatalytic RhB degradation activity of FOD-ore can be significantly enhanced by the introduction of a novel electronic state via the Fe defect in the structure of iron oxalate. Due to its rapid kinetic rate and high RhB degradation efficiency, FOD-ore may have considerable potential as a photocatalyst for RhB degradation in wastewater, as indicated by the results. In addition, the RhB removal process was demonstrated by performing photolysis under light irradiation without the FOD-ore and an adsorption test with the FOD-ore under dark conditions, as shown in Figure 7c. Clearly, photolysis could decrease the RhB concentration by approximately 4%. In addition, the equilibrium between the adsorption and desorption of RhB on the surface of FOD-ore was attained at 35% within 15 min and remained constant after equilibrium. In contrast, the photocatalytic process reduced the RhB concentration by approximately 85% within 90 min, indicating that photocatalysis is the primary removal mechanism for RhB molecules. In addition, a broad variety of radical scavengers were used to determine the role of radicals in the decomposition of RhB. BQ, IPA, and EDTA-2Na successfully captured O2, OH, and h+ in these scavenger experiments. With the addition of BQ and EDTA-2Na, the amount of photocatalytic RhB degradation decreased (Figure 7d), suggesting that O2 and h+ were primarily responsible for this process. Additionally, the degradation activity of FOD-ore for RhB mineralization in the presence of IPA did not affect the performance, indicating that OH was a minor active radical in the photocatalytic RhB degradation. In addition, TOC analysis was tested to confirm the degradation of RhB. It can be seen that the treated solution after 90 min of using FOD-ore showed a lower TOC value (5.6 mg/L) compared with the original RhB solution (0.7 mg/L), confirming that the RhB was decomposed to be CO2 and H2O. Compared with the previous works, iron oxalate and iron oxalate composite with carbon nitride can decompose RhB around 40% and 35% after 120 min, respectively [32], while Fe3O4 and Fe3O4/TiO2 could eliminate RhB around 50% and 90% after 120 min [33]. It can be seen that the optimum FOD-ore demonstrated higher RhB degradation activity, approximately 85%, within 90 min, which was higher than those of previous reports of iron oxalate, Fe3O4, and their composite, indicating that the FOD-ore has the potential to be used as a photocatalyst for RhB degradation in practical uses.
Moreover, EPR analysis can confirm the generation of hydroxyl and superoxide anion radicals in the presence of FOD-ore in the photocatalytic reaction system under visible light irradiation. The DMPO-OH and DMPO-O2 adduct signals were detected in water and methanol, respectively. FOD-ore was suspended in water or methanol at the same loading as the photocatalytic activity under light irradiation, and the reactive species determinations were investigated at room temperature. As observed in Figure 8a,b, there were no signals of OH and O2 radicals under dark conditions. Under light irradiation, four hyperfine splitting with the intensity ratio 1:2:2:1 was observed for DMPO-OH adducts (Figure 8a). Similarly, four characteristic peaks of DMPO-O2 adducts with an intensity ratio of 1:1:1:1 were observed. The ESR results proved that OH and O2 radicals can be generated by photocatalysis using FOD-ore, and both of them can participate in the photocatalytic RhB degradation.

3.8. Stability

The stability and reusability of catalysts are crucial to their practical application [34]. Five cycles of FOD-ore for RhB degradation were utilized to determine the recyclable nature of the sample. Figure 9a demonstrates that FOD-ore is extremely stable and recyclable for RhB decomposition when exposed to light, as the photocatalytic RhB decomposition over it was maintained over five cycles with a remarkable 83% elimination rate within 90 min. XRD was used to compare the phase structure of FOD-ore after the first cycle of photocatalytic RhB degradation to that of fresh FOD-ore. Comparing the two diffraction patterns reveals that the RhB degradation did not affect the FOD-ore phase structures, as shown in Figure 9b.

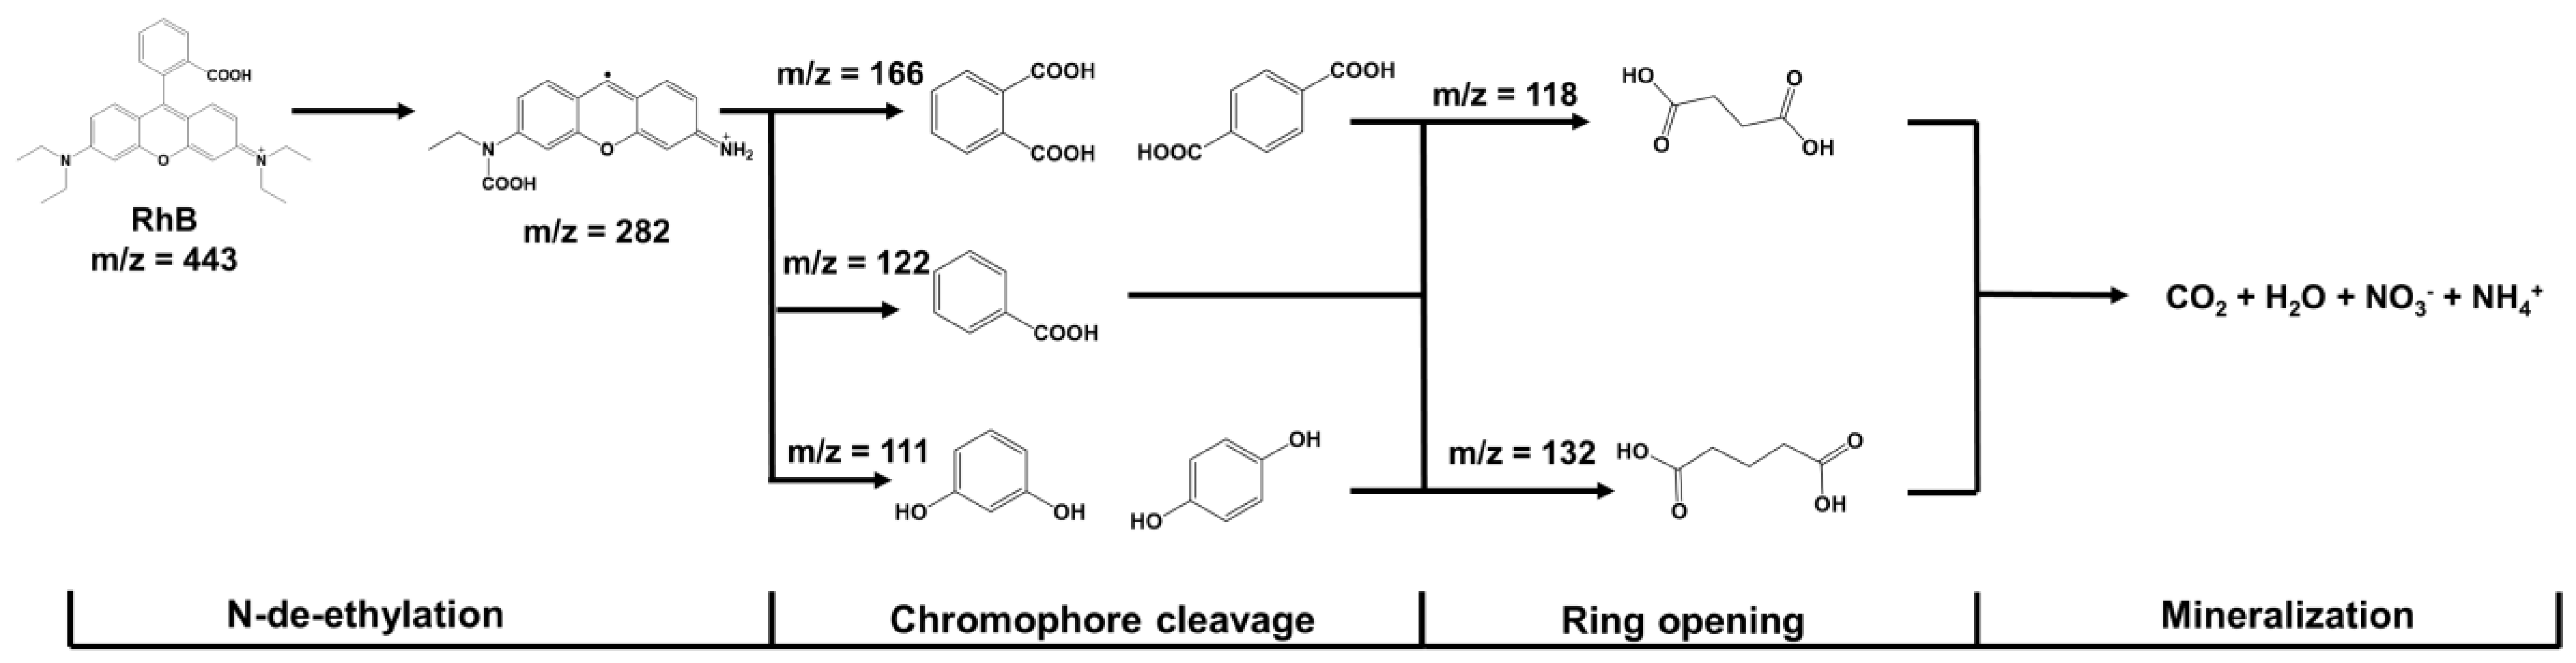
3.9. Possible Photocatalytic RhB Degradation Pathway

In addition, after the photocatalytic degradation of RhB over FOD-ore, the concentration of RhB in the solution decreased significantly, and degraded products were produced. Figure 10 illustrates a proposed mechanism for RhB mineralization based on the gas chromatography–mass spectrometry (GC-MS) results of RhB fragments. An analysis of the degraded solution 90 min after the photocatalytic reaction revealed the presence of numerous small RhB fragments (peaks at m/z values of 111, 118, 122, 132, 166, and 282). It has been discovered that RhB molecules can be broken down into less toxic, smaller molecules by distorting the RhB molecule through processes such as N-de-ethylation, chromophore cleavage, and ring-opening [35,36,37,38,39,40].

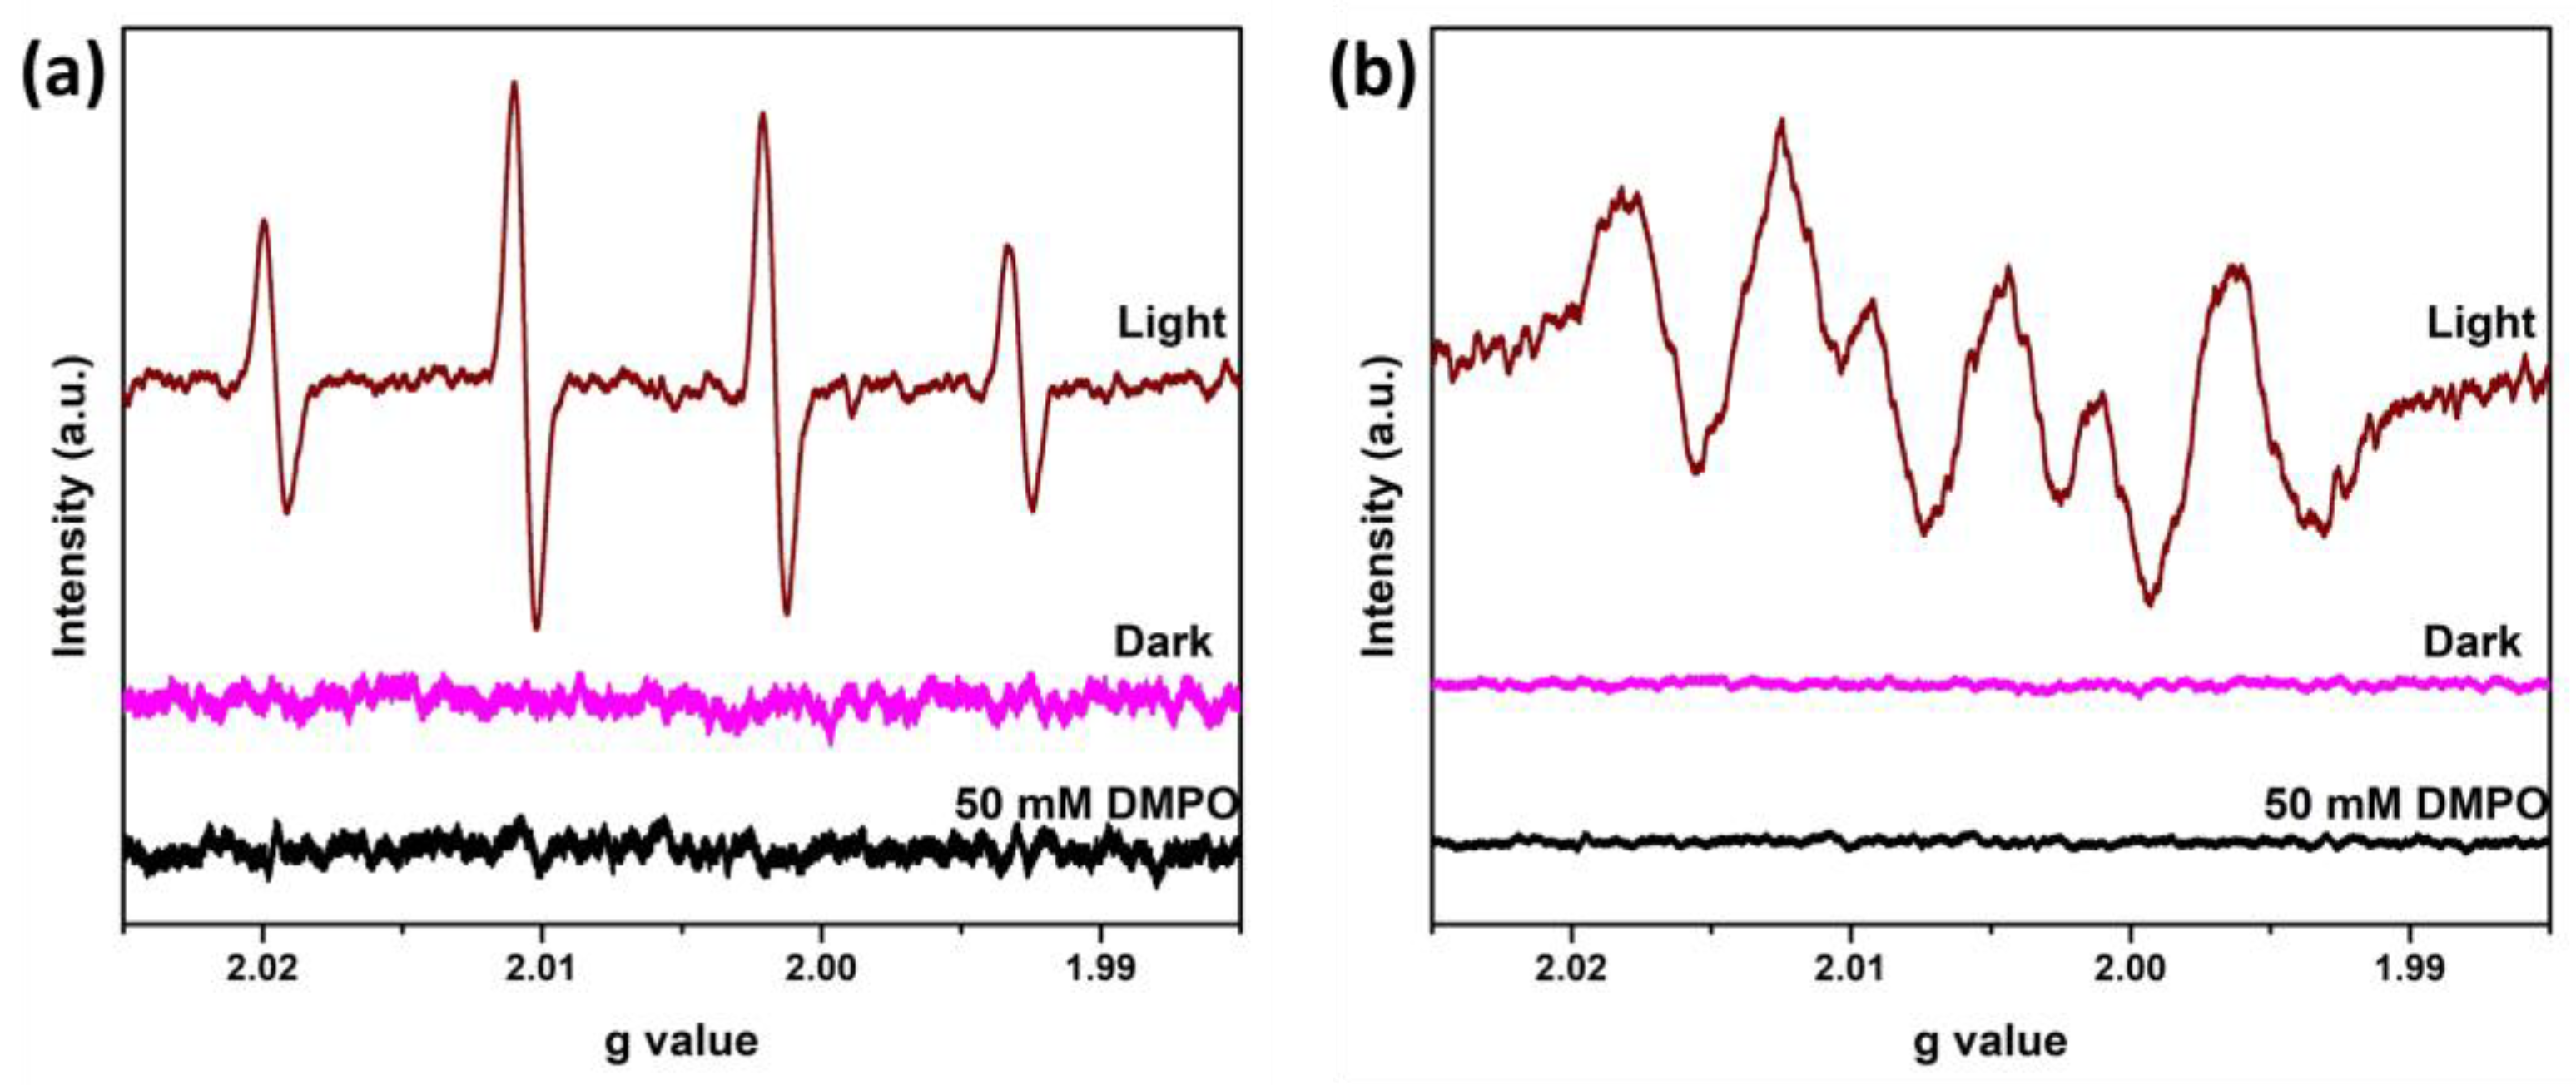
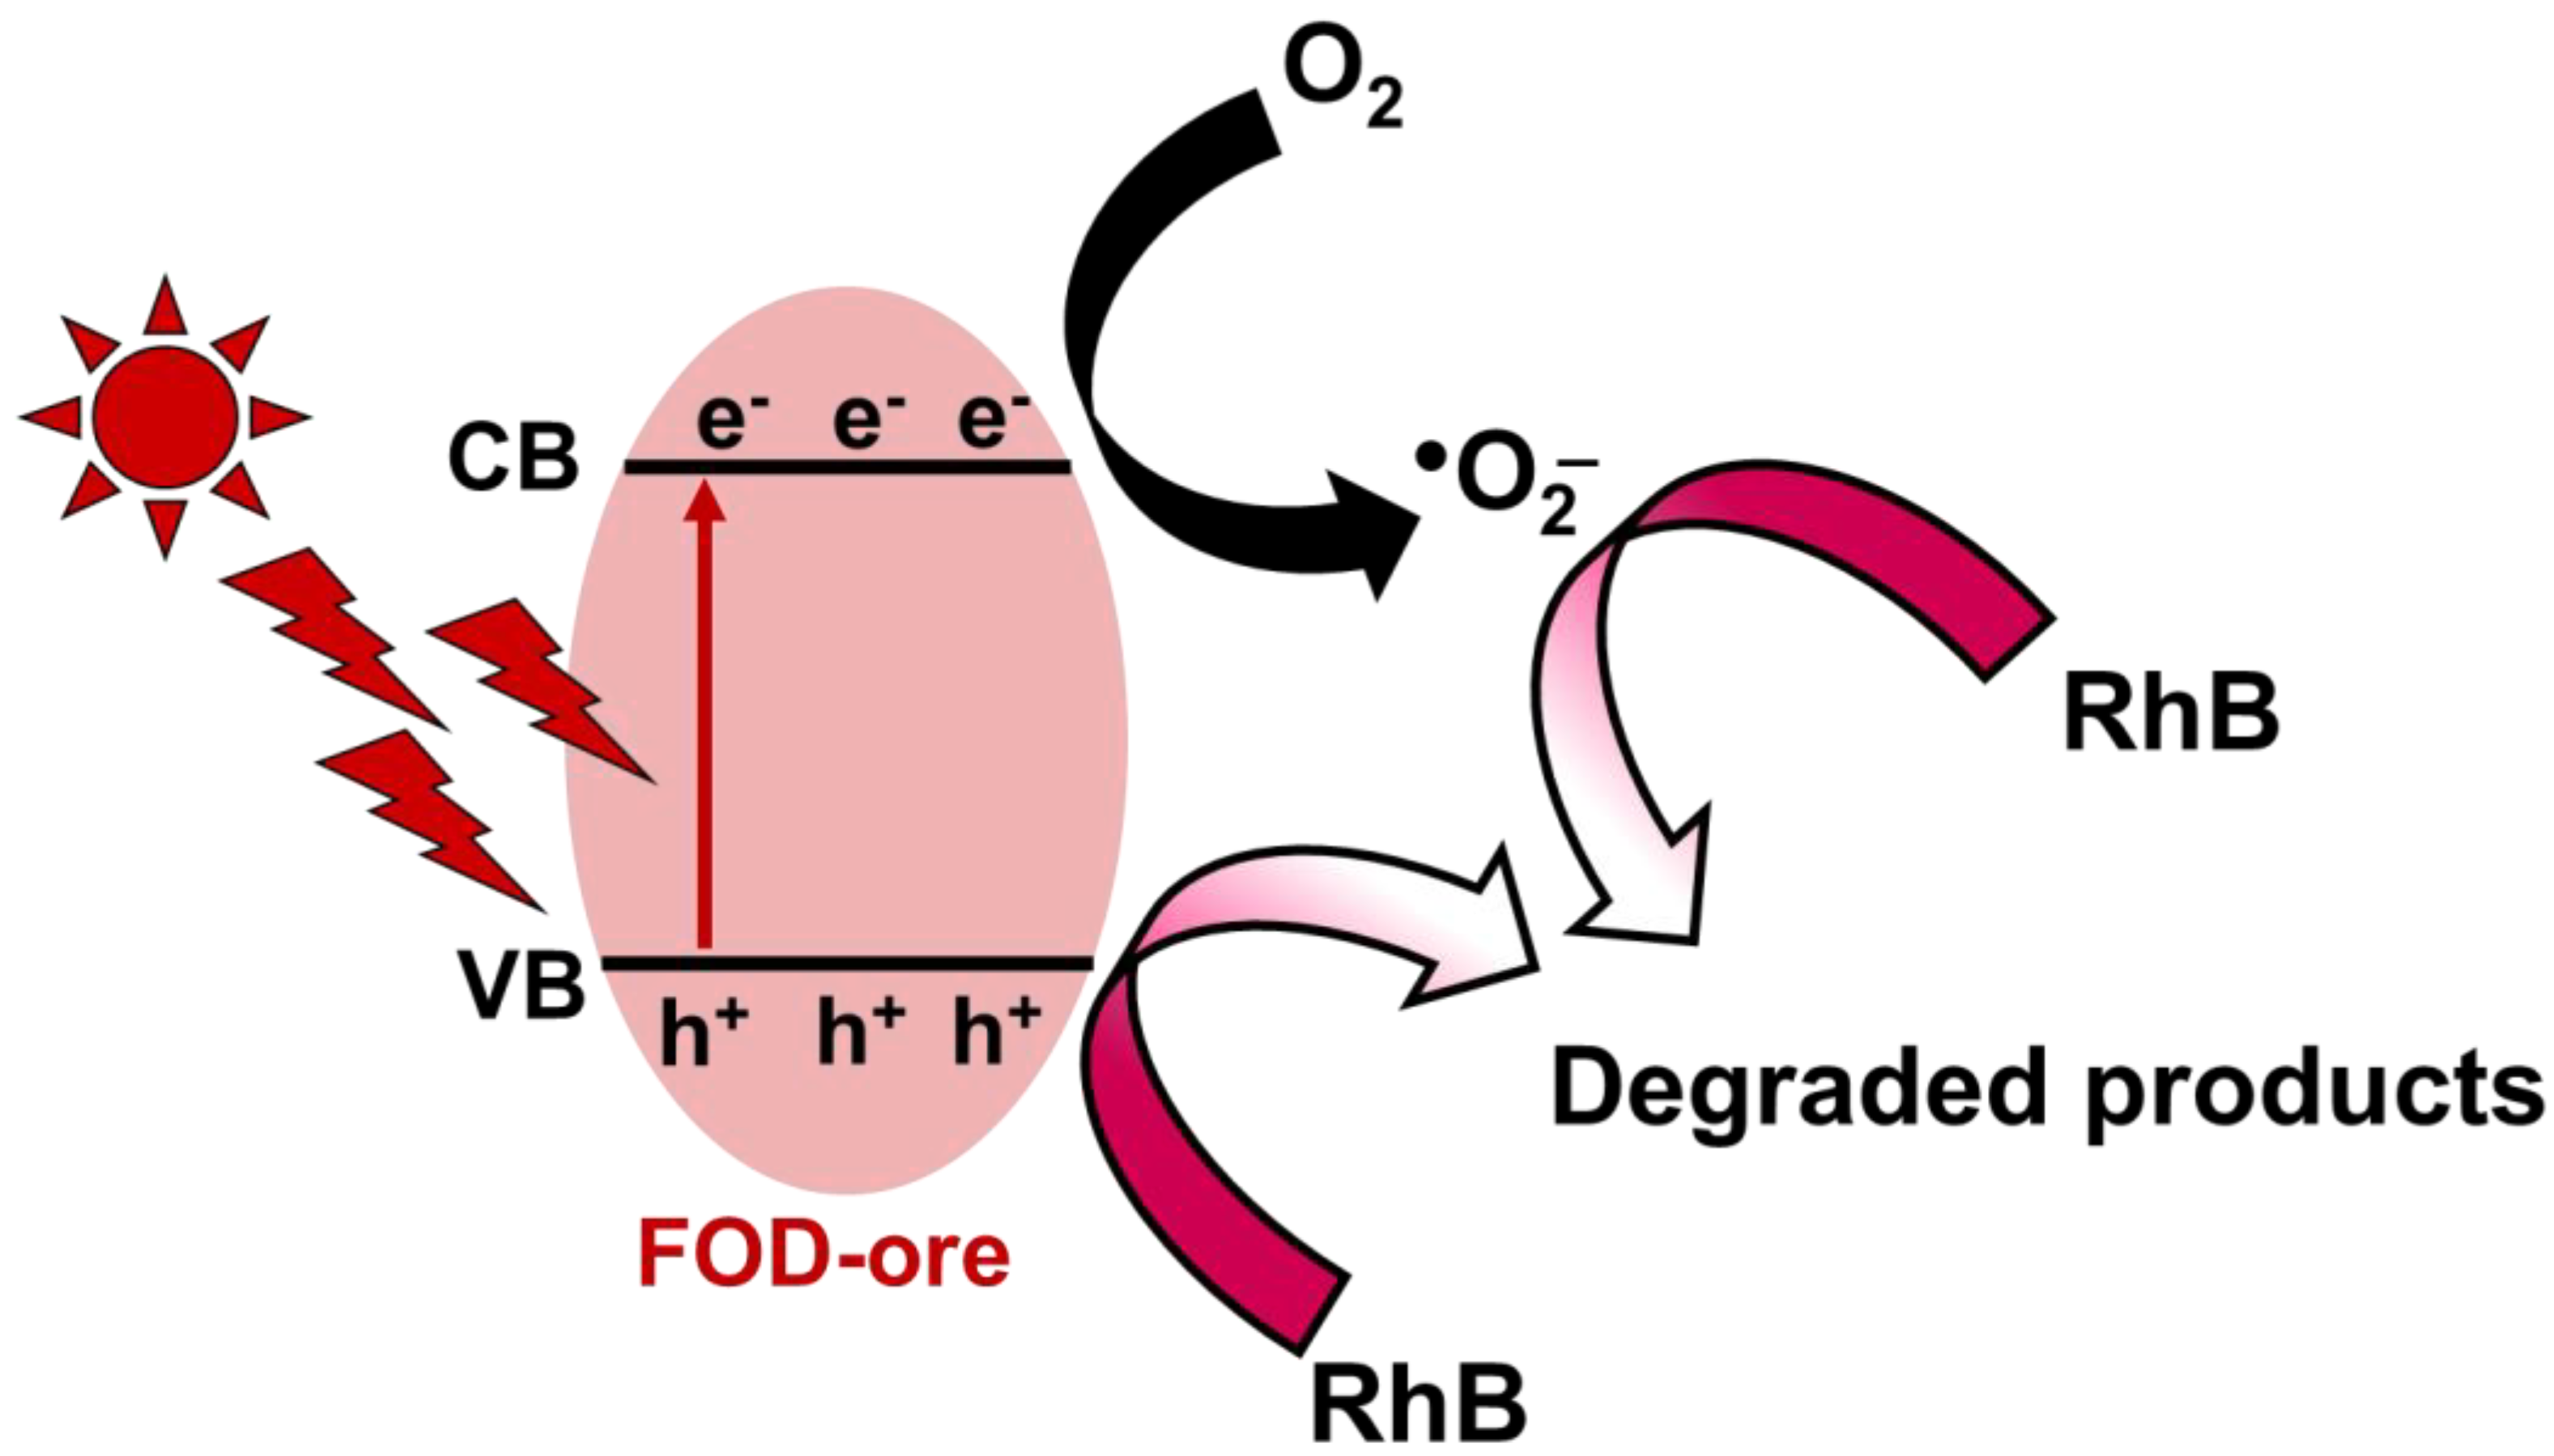
3.10. Photocatalytic Mechanism

The proposed photocatalytic RhB mineralization process using FOD-ore is depicted in Figure 11 based on the findings of this study. The VB and CB of FOD-ore were 0.5 eV and −1.88 eV, respectively. When exposed to light, FOD-ore generated electron-hole pairs. Hole production in the VB of the FOD-ore occurred simultaneously with the migration of excited electrons to the CB. The FOD-ore defects by Fe could generate a novel electronic state to capture the photogenerated electron. By moving electrons to the new electronic state generated by impurities, FOD-ore was able to prevent the recombination of the photogenerated charge carriers, thereby extending the charge carrier lifetime for the reaction. During photocatalysis, the interaction of photogenerated electrons with dissolved O2 in water led to the production of O2. h+ in the VB of the FOD-ore could simultaneously oxidize and degrade RhB molecules directly into CO2 and H2O. These two active radicals transformed RhB molecules into negligible, non-toxic byproducts. Moreover, the lower CB position of FOD-ore could enhance the production of the superoxide anion radical, resulting in higher performance towards RhB degradation. Thus, the utilization of iron ore to produce iron oxalate could provide an efficient photocatalyst for RhB mineralization by enhancing the optical properties and increasing charge carrier segregation.

4. Conclusions

The simple extraction of Fe from iron ore using an oxalic acid solution could produce iron oxalate that can be used as a photocatalyst for waste remediation, such as the degradation of RhB, an organic dye found in wastewater. In this study, two distinct types of iron oxalate were synthesized using two distinct precursors: hematite and iron ore. The obtained product by using iron ore as a precursor (FOD-ore) exhibited a reaction rate constant for effectively degrading RhB in the effluent that was approximately 1.4 times greater than that of the product derived from hematite. In terms of photocatalytic RhB degradation, according to UV-DRS and PL measurements, the enhanced photocatalytic activity of FOD-ore for RhB degradation can be attributed to its enhanced light absorption and decreased photogenerated charge recombination. The incorporation of the Fe defect in the structure of the FOD-ore, which decreased the recombination of photogenerated charges, enhanced the photocatalytic degradation of RhB in the presence of light. Through GC-MS analysis, the degradation byproducts of RhB were also investigated. Therefore, this study provides an alternative method for utilizing the extracted Fe from iron ore for the effective remediation of wastewater contaminated with organic pollutants when exposed to light.

Author Contributions

C.C: Conceptualization, Investigation, Writing—original draft, Writing—review & editing. C.C., S.S., J.T., V.B., P.S. and K.S. (Karthikeyan Sekar): Formal analysis. S.K., K.S. (Keiko Sasaki) and C.C: Conception, Interpretation, Editing the manuscript. All authors have read and agreed to the published version of the manuscript.

Funding

The work was supported by the Japan Society for the Promotion of Science (JSPS) KAKENHI (A) (No. JSPS JP22H00266) and the Grant-in-Aid for Early-Career Scientists (project number = 23K17064). This work was partly supported by Advanced Research Infrastructure for Materials and Nanotechnology Grant Number JPMXP1222KU1009 in Japan, sponsored by the Ministry of Education, Culture, Sports, Science, and Technology (MEXT), Japan. This work was partly supported by 2022 Research Start Program 202208 to Chitiphon Chuaicham.

Institutional Review Board Statement

Not applicable.

Informed Consent Statement

Not applicable.

Data Availability Statement

Not applicable.

Conflicts of Interest

The authors declare no conflict of interest.

References

  1. Tian, Q.; Guo, B.; Chuaicham, C.; Sasaki, K. Mechanism analysis of selenium (VI) immobilization using alkaline-earth metal oxides and ferrous salt. Chemosphere 2020, 248, 126143. [Google Scholar] [CrossRef]
  2. Yu, K.; Yang, S.; He, H.; Sun, C.; Gu, C.; Ju, Y. Visible Light-Driven Photocatalytic Degradation of Rhodamine B over NaBiO3: Pathways and Mechanism. J. Phys. Chem. A 2009, 113, 10024–10032. [Google Scholar] [CrossRef] [PubMed]
  3. Ahmad, M.; Rehman, W.; Khan, M.M.; Qureshi, M.T.; Gul, A.; Haq, S.; Ullah, R.; Rab, A.; Menaa, F. Phytogenic fabrication of ZnO and gold decorated ZnO nanoparticles for photocatalytic degradation of Rhodamine B. J. Environ. Chem. Eng. 2021, 9, 104725. [Google Scholar] [CrossRef]
  4. Balu, S.; Chuaicham, C.; Balakumar, V.; Rajendran, S.; Sasaki, K.; Sekar, K.; Maruthapillai, A. Recent development on core-shell photo(electro)catalysts for elimination of organic compounds from pharmaceutical wastewater. Chemosphere 2022, 298, 134311. [Google Scholar] [CrossRef] [PubMed]
  5. Tang, X.; Tang, R.; Xiong, S.; Zheng, J.; Li, L.; Zhou, Z.; Gong, D.; Deng, Y.; Su, L.; Liao, C. Application of natural minerals in photocatalytic degradation of organic pollutants: A review. Sci. Total Environ. 2022, 812, 152434. [Google Scholar] [CrossRef]
  6. Guo, T.; Jiang, L.; Wang, K.; Li, Y.; Huang, H.; Wu, X.; Zhang, G. Efficient persulfate activation by hematite nanocrystals for degradation of organic pollutants under visible light irradiation: Facet-dependent catalytic performance and degradation mechanism. Appl. Catal. B Environ. 2021, 286, 119883. [Google Scholar] [CrossRef]
  7. Li, K.; Liang, Y.; Yang, J.; Yang, G.; Xu, R.; Xie, X. α-Ferrous oxalate dihydrate: An Fe-based one-dimensional metal organic framework with extraordinary photocatalytic and Fenton activities. Catal. Sci. Technol. 2018, 8, 6057–6061. [Google Scholar] [CrossRef]
  8. Li, K.; Liang, Y.; Yang, J.; Yang, G.; Zhang, H.; Wang, K.; Xu, R.; Xie, X. Glucose-induced fabrication of Bi/α-FeC2O4·2H2O heterojunctions: A bifunctional catalyst with enhanced photocatalytic and Fenton oxidation efficiency. Catal. Sci. Technol. 2019, 9, 2543–2552. [Google Scholar] [CrossRef]
  9. Xiong, Z.; Hu, H.; Cao, Z.; Hu, Y.; Sun, D.; Qin, H.; Kang, S. Integration of Photo-Fenton Reaction and Membrane Filtration using Lignin@t-FeC2O4/g-C3N4 Nanofibers Toward Accelerated Fe(III)/Fe(II) Cycling and Sustainability. Adv. Sustain. Syst. 2023, 7, 2200378. [Google Scholar] [CrossRef]
  10. Xiao, C.; Li, X.; Li, Q.; Hu, Y.; Cheng, J.; Chen, Y. Ni-doped FeC2O4 for efficient photo-Fenton simultaneous degradation of organic pollutants and reduction of Cr(VI): Accelerated Fe(III)/Fe(II) cycle, enhanced stability and mechanism insight. J. Clean. Prod. 2022, 340, 130775. [Google Scholar] [CrossRef]
  11. Santawaja, P.; Kudo, S.; Mori, A.; Tahara, A.; Asano, S.; Hayashi, J.-i. Sustainable Iron-Making Using Oxalic Acid: The Concept, A Brief Review of Key Reactions, and An Experimental Demonstration of the Iron-Making Process. ACS Sustain. Chem. Eng. 2020, 8, 13292–13301. [Google Scholar] [CrossRef]
  12. Gardy, J.; Osatiashtiani, A.; Céspedes, O.; Hassanpour, A.; Lai, X.; Lee, A.F.; Wilson, K.; Rehan, M. A magnetically separable SO4/Fe-Al-TiO2 solid acid catalyst for biodiesel production from waste cooking oil. Appl. Catal. B Environ. 2018, 234, 268–278. [Google Scholar] [CrossRef] [Green Version]
  13. Cavelius, C.; Moh, K.; Mathur, S. Chemically Designed Growth of Monodisperse Iron Oxide Nanocrystals. Cryst. Growth Des. 2012, 12, 5948–5955. [Google Scholar] [CrossRef]
  14. Wang, Z.; Xiao, M.; You, J.; Liu, G.; Wang, L. Defect Engineering in Photocatalysts and Photoelectrodes: From Small to Big. Acc. Mater. Res. 2022, 3, 1127–1136. [Google Scholar] [CrossRef]
  15. Maarisetty, D.; Baral, S.S. Defect engineering in photocatalysis: Formation, chemistry, optoelectronics, and interface studies. J. Mater. Chem. A 2020, 8, 18560–18604. [Google Scholar] [CrossRef]
  16. Zafar, Z.; Yi, S.; Li, J.; Li, C.; Zhu, Y.; Zada, A.; Yao, W.; Liu, Z.; Yue, X. Recent Development in Defects Engineered Photocatalysts: An Overview of the Experimental and Theoretical Strategies. Energy Environ. Mater. 2022, 5, 68–114. [Google Scholar] [CrossRef]
  17. Balakumar, V.; Manivannan, R.; Chuaicham, C.; Karthikeyan, S.; Sasaki, K. A simple tactic synthesis of hollow porous graphitic carbon nitride with significantly enhanced photocatalytic performance. Chem. Commun. 2021, 57, 6772–6775. [Google Scholar] [CrossRef]
  18. Pawar, R.R.; Chuaicham, C.; Sekar, K.; Rajendran, S.; Sasaki, K. Synthesis, characterization, and application of MOF@clay composite as a visible light-driven photocatalyst for Rhodamine B degradation. Chemosphere 2022, 291, 132922. [Google Scholar] [CrossRef]
  19. Makuła, P.; Pacia, M.; Macyk, W. How To Correctly Determine the Band Gap Energy of Modified Semiconductor Photocatalysts Based on UV–Vis Spectra. J. Phys. Chem. Lett. 2018, 9, 6814–6817. [Google Scholar] [CrossRef] [Green Version]
  20. Chuaicham, C.; Inoue, T.; Balakumar, V.; Tian, Q.; Ohtani, B.; Sasaki, K. Visible light-driven ZnCr double layer oxide photocatalyst composites with fly ashes for the degradation of ciprofloxacin. J. Environ. Chem. Eng. 2022, 10, 106970. [Google Scholar] [CrossRef]
  21. Chuaicham, C.; Sekar, K.; Balakumar, V.; Mittraphab, Y.; Shimizu, K.; Ohtani, B.; Sasaki, K. Fabrication of graphitic carbon nitride/ZnTi-mixed metal oxide heterostructure: Robust photocatalytic decomposition of ciprofloxacin. J. Alloys Compd. 2022, 906, 164294. [Google Scholar] [CrossRef]
  22. Al-Madanat, O.; AlSalka, Y.; Dillert, R.; Bahnemann, D.W. Photocatalytic H2 Production from Naphthalene by Various TiO2 Photocatalysts: Impact of Pt Loading and Formation of Intermediates. Catalysts 2021, 11, 107. [Google Scholar] [CrossRef]
  23. Ombaka, L.M.; McGettrick, J.D.; Oseghe, E.O.; Al-Madanat, O.; Rieck genannt Best, F.; Msagati, T.A.M.; Davies, M.L.; Bredow, T.; Bahnemann, D.W. Photocatalytic H2 production and degradation of aqueous 2-chlorophenol over B/N-graphene-coated Cu0/TiO2: A DFT, experimental and mechanistic investigation. J. Environ. Manag. 2022, 311, 114822. [Google Scholar] [CrossRef]
  24. Chenakin, S.; Kruse, N. Thermal Decomposition of Nickel Oxalate Dihydrate: A Detailed XPS Insight. J. Phys. Chem. C 2019, 123, 30926–30936. [Google Scholar] [CrossRef]
  25. Li, Y.; Wu, H.; Wu, Y.; Li, Q. Facile synthesis of mesoporous Co3O4 nanowires for application in supercapacitors. J. Mater.Sci. Mater. Electron. 2017, 28, 16826–16835. [Google Scholar] [CrossRef]
  26. Li, L.; Ma, P.; Hussain, S.; Jia, L.; Lin, D.; Yin, X.; Lin, Y.; Cheng, Z.; Wang, L. FeS2/carbon hybrids on carbon cloth: A highly efficient and stable counter electrode for dye-sensitized solar cells. Sustain. Energy Fuels 2019, 3, 1749–1756. [Google Scholar] [CrossRef]
  27. Vásquez, G.C.; Maestre, D.; Cremades, A.; Ramírez-Castellanos, J.; Magnano, E.; Nappini, S.; Karazhanov, S.Z. Understanding the effects of Cr doping in rutile TiO2 by DFT calculations and X-ray spectroscopy. Sci. Rep. 2018, 8, 8740. [Google Scholar] [CrossRef] [Green Version]
  28. Zhu, B.; Song, D.; Jia, T.; Sun, W.; Wang, D.; Wang, L.; Guo, J.; Jin, L.; Zhang, L.; Tao, H. Effective Visible Light-Driven Photocatalytic Degradation of Ciprofloxacin over Flower-like Fe3O4/Bi2WO6 Composites. ACS Omega 2021, 6, 1647–1656. [Google Scholar] [CrossRef]
  29. Wen, X.-J.; Niu, C.-G.; Huang, D.-W.; Zhang, L.; Liang, C.; Zeng, G.-M. Study of the photocatalytic degradation pathway of norfloxacin and mineralization activity using a novel ternary Ag/AgCl-CeO2 photocatalyst. J. Catal. 2017, 355, 73–86. [Google Scholar] [CrossRef]
  30. Abhinay, S.; Tarai, P.; Mazumder, R. Preparation and characterization of (Ba0.85Ca0.15)(Zr0.1Ti0.9)TiO3(BCZT)/Bi2O3 composites as efficient visible-light-responsive photocatalysts. J. Mater. Sci. 2020, 55, 1904–1914. [Google Scholar] [CrossRef]
  31. Azizah, N.m.; Muhammady, S.; Purbayanto, M.A.K.; Nurfani, E.; Winata, T.; Sustini, E.; Widita, R.; Darma, Y. Influence of Al doping on the crystal structure, optical properties, and photodetecting performance of ZnO film. Prog. Nat.Sci. Mater. Int. 2020, 30, 28–34. [Google Scholar] [CrossRef]
  32. Liu, S.; Wang, X.; Zhang, J. Fenton-like reaction and photocatalysis using ferrous oxalate and g-C3N4 enhancing reactive oxygen species for dye wastewater degradation under visible-light irradiation. Desalination Water Treat. 2020, 193, 359–368. [Google Scholar] [CrossRef]
  33. Madima, N.; Kefeni, K.K.; Mishra, S.B.; Mishra, A.K.; Kuvarega, A.T. Fabrication of magnetic recoverable Fe3O4/TiO2 heterostructure for photocatalytic degradation of rhodamine B dye. Inorg. Chem. Commun. 2022, 145, 109966. [Google Scholar] [CrossRef]
  34. Srikhaow, A.; Smith, S.M.; Uraisin, K.; Suttiponparnit, K.; Kongmark, C.; Chuaicham, C. Catalytic remediation of phenol contaminated wastewater using Cu-Zn hydroxide nitrate. RSC Adv. 2016, 6, 36766–36774. [Google Scholar] [CrossRef]
  35. Gemeay, A.H.; El-Halwagy, M.E.; Elsherbiny, A.S.; Zaki, A.B. Amine-rich quartz nanoparticles for Cu(II) chelation and their application as an efficient catalyst for oxidative degradation of Rhodamine B dye. Environ. Sci. Pollut. Res. 2021, 28, 28289–28306. [Google Scholar] [CrossRef]
  36. Ramesh, A.; Tamizhdurai, P.; Gopinath, S.; Sureshkumar, K.; Murugan, E.; Shanthi, K. Facile synthesis of core-shell nanocomposites Au catalysts towards abatement of environmental pollutant Rhodamine B. Heliyon 2019, 5, e01005. [Google Scholar] [CrossRef] [Green Version]
  37. Xie, R.; Fang, K.; Liu, Y.; Chen, W.; Fan, J.; Wang, X.; Ren, Y.; Song, Y. Z-scheme In2O3/WO3 heterogeneous photocatalysts with enhanced visible-light-driven photocatalytic activity toward degradation of organic dyes. J. Mater. Sci. 2020, 55, 11919–11937. [Google Scholar] [CrossRef]
  38. Zeng, Z.; Li, K.; Yuan, T.; Liang, Y.; Yang, J.; Yang, G.; Wang, K.; Xiong, Z. Facile synthesis of BiOCl/g-C3N4 heterojunction via in situ hydrolysis of Bi nanospheres: A high-efficiency visible-light-driven photocatalyst. J. Mater.Sci. Mater. Electron. 2021, 32, 9972–9989. [Google Scholar] [CrossRef]
  39. Xiao, X.; Ma, X.-L.; Liu, Z.-Y.; Li, W.-W.; Yuan, H.; Ma, X.-B.; Li, L.-X.; Yu, H.-Q. Degradation of rhodamine B in a novel bio-photoelectric reductive system composed of Shewanella oneidensis MR-1 and Ag3PO4. Environ. Int. 2019, 126, 560–567. [Google Scholar] [CrossRef]
  40. Zhang, Y.; Ma, Y.; Wang, L.; Sun, Q.; Zhang, F.; Shi, J. Facile one-step hydrothermal synthesis of noble-metal-free hetero-structural ternary composites and their application in photocatalytic water purification. RSC Adv. 2017, 7, 50701–50712. [Google Scholar] [CrossRef] [Green Version]
Figure 1. XRD patterns of (a) raw ore, (b) extracted FOD from hematite and ore, and (c) Raman spectra of extracted FOD from ore and hematite.
Separations 10 00378 g001
Figure 2. (a) UV-visible spectra of extracted FOD from hematite and ore, and (b) their energy band gap plot using Tauc’s equation.
Separations 10 00378 g002
Figure 3. SEM images with two magnifications (×1500 and ×5000) and EDX mapping of extracted FOD from (a) hematite (FOD) and (b) ore (FOD-ore).
Separations 10 00378 g003
Figure 4. XPS spectra of extracted FOD from hematite (FOD) and ore (FOD-ore): (a) survey, (b) C 1s, (c) O 1s, (d) Fe 2p, (e) valance band energy region, and (f) their energy band level.
Separations 10 00378 g004
Figure 5. XANES spectra of FOD, FOD-ore, and iron standards.
Separations 10 00378 g005
Figure 6. PL spectra of FOD and FOD-ore.
Separations 10 00378 g006
Figure 7. (a) Photocatalytic RhB degradation over FOD-ore and FOD, (b) their kinetic plot, (c) the comparative efficiency of the photocatalytic RhB degradation of FOD-ore with photolysis and the adsorption of RhB over FOD-ore, and (d) the scavenger test.
Separations 10 00378 g007
Figure 8. EPR spectra of (a) DMPO-OH and (b) DMPO-O2 adducts under dark and light irradiation over FOD-ore.
Separations 10 00378 g008
Figure 9. (a) Photocatalytic reusability of FOD-ore for RhB degradation and (b) XRD of spent FOD-ore compared with that of as-prepared FOD-ore.
Separations 10 00378 g009
Figure 10. Possible degradation pathway of photocatalytic RhB degradation over FOD-ore.
Separations 10 00378 g010
Figure 11. Schematic photocatalytic RhB degradation over FOD-ore.
Separations 10 00378 g011
Table 1. Elemental composition (%wt) by XRF analysis.
COFe
FOD14.954.230.9
FOD-ore16.657.925.5
Disclaimer/Publisher’s Note: The statements, opinions and data contained in all publications are solely those of the individual author(s) and contributor(s) and not of MDPI and/or the editor(s). MDPI and/or the editor(s) disclaim responsibility for any injury to people or property resulting from any ideas, methods, instructions or products referred to in the content.

