Article

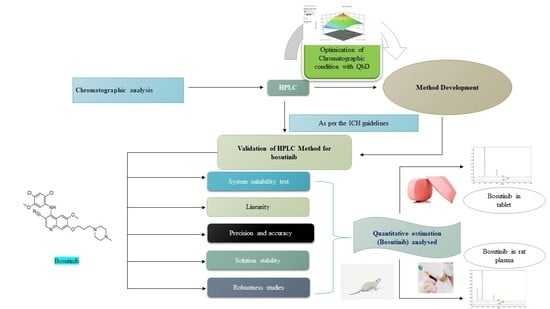
Optimization of Chromatographic Conditions with QbD for Method Development and Validation of Bosutinib by HPLC: Applications in Dosage Forms and Rat Plasma Analysis

by
Asim Najmi
1,
Zia ur Rehman
1,*,
Hassan Ahmed Alhazmi
1,2,
Mohammed Mofarreh Albratty
1,
Nasser Hassan Majrashi
3,
Khalid Mohammed Hakami
3,
Naif Ali Najmi
3 and
Ammar Abdullah Mobarki
3
1
Department of Pharmaceutical Chemistry, Faculty of Pharmacy, Jazan University, P.O. Box 114, Jazan 45142, Saudi Arabia
2
Substance of Abuse and Research Toxicology Center, Faculty of Pharmacy, Jazan University, P.O. Box 114, Jazan 45142, Saudi Arabia
3
Faculty of Pharmacy, Jazan University, P.O. Box 114, Jazan 45142, Saudi Arabia
*
Author to whom correspondence should be addressed.
Separations 2023, 10(6), 346; https://doi.org/10.3390/separations10060346
Submission received: 29 March 2023 / Revised: 24 April 2023 / Accepted: 26 May 2023 / Published: 7 June 2023

Abstract

:
Aim: Bosutinib (BST) is an anti-cancer medicine that is used to treat a variety of different types of cancer. Using the HPLC method of analysis and the Quality by Design (QbD) strategy, the study aimed to precisely quantify the drug in tablet form and in rat plasma. Methodology: For the developed method’s validation, the chromatographic settings were fine-tuned by making use of the Box–Behnken Design (BBD). In the BBD, two dependent variables and three independent variables were selected. Isocratically, samples were eluted, having eluent phase composition of ammonium acetate (CH3COONH4) buffer pH 3.0 and acetonitrile (CH3CN) (60:40% v/v), in Raptor C-18 column at temperature 25 °C with a flow rate of 1 mL/min for 5 min. The wavelength of detection was set at 260 nm. In this study, encorafenib (ENC) was employed as an internal standard. Result: A sharp and resolved peak of BST and ENC at a retention time of 1.92 min and 4.01 min, respectively, was observed by the developed method. The limits of quantification and detection of the newly established method were found to be 1.503 µg/mL−1 and 0.496 µg/mL−1. The calibration curve’s observed linearity range was between 2 and 20 µg/mL−1, with an r2 of 0.999. The developed and optimized method was verified in compliance with the ICH guidelines. The results of all validation parameters were within the acceptable range, for example, % RSD of system suitability (0.63–4.46), % RSD of linear regression (1.659), interday and intraday precision % RSD value (1.723–1.892), and (1.762–1.923), respectively, and accuracy (1.476–1.982). Conclusion: The quantity of BST in tablet dosage form and in rat plasma samples was determined using a simple, quick, and robust method that was devised and validated.

Graphical Abstract

1. Introduction

Bosutinib (BST) is chemically 4-[(2,4-Dichloro-5-methoxyphenyl)amino]-6-methoxy-7-[3-(4-methyl-1-piperazinyl) propoxy]-3-quinolinecarbonitrile monohydrate (Figure 1) and designated as a BCS Class IV drug because of its reduced solubility and decreased skin penetration [1]. This drug is referred to as a chemotherapeutic agent and is used to treat a range of various types of cancer. Protein kinase inhibitory activity is the main mechanism of action of BST, which is primarily used to treat resistant and intolerant chronic myelogenous leukemia (CML) patients [2]. It is a novel dual SRC/ABL kinase inhibitor in advanced clinical development that is primarily used for the treatment of SRC overexpressing solid tumours and gives a positive result. In oral administration, peak plasma concentration occurs after 4–6 h and is very extensively distributed into the tissue [3]. The absorption of the drug can be improved when taken with food. The metabolic site of this drug is the liver, and the liver enzyme cytochrome P450 3A4 metabolizes the drug. The drug was reported to have 94% plasma protein binding. It is considered as a drug with a narrow therapeutic index, as BST therapy cannot be continued without interruption due to various adverse effects, especially diarrhoea and liver dysfunction [4].
The most non-polar molecules, as well as ionized and non-ionic chemicals, are separated and quantified using the liquid chromatography technique. When it comes to organic compound analysis, high-performance liquid chromatography (HPLC) is by far the most widely utilized technology [5,6]. Dziadosz et al. presented an HPLC method using a diode array detector for the separation of seven out of seven kinase inhibitors, including vatalanib, bosutinib, canertinib, tandutinib, pazopanib and dasatinib, using erlotinib as the internal standard. The method was claimed to be highly sensitive comparable to those of the LC/MS/MS methods, but studies showed a recovery of 73–90% of all analytes except pazopanib, which showed 50% recovery only [7]. Sumimoto et al., reported a method using a UV detector with good sensitivity for the determination of bosutinib in human plasma but recovery was only 85.62%. Furthermore, the method uses Oasis HLB cartridge for solid-phase extraction for human plasma samples. In patients with chronic myeloid leukemia, this study confirmed the validity of this technique for therapeutic drug monitoring of bosutinib [8]. A study conducted by Mita et al. that correlated the adverse effects of bosutinib treatment with its plasma concentration in patients with chronic myeloid leukaemia, used either conventional doses or dose-escalation regimens. The dose-escalation regimen was better suited to avoid treatment interruption. This study emphasized that the therapeutic drug monitoring in everyday practice may allow the daily dose of bosutinib to be changed based on the target concentration to prevent side effects, highlighting the significance of a good and reliable method for the determination of bosutinib [9]. Wang et.al., devised a UPLC-MS/MS method to determine bosutinib in rat plasma and tissue using diazepam as the internal standard. They used acetonitrile as the protein precipitating agent for plasma sample analysis. The study further claimed that the method of analysis can be applied effectively after the oral administration of bosutinib in animals for pharmacokinetic and tissue-distribution studies [10]. Xu et.al., conducted the first pharmacokinetic studies of bosutinib in rat plasma using positive-ion electrospray tandem mass spectrometry with a multiple-reactions monitoring (MRM) technique which lay the groundwork for the drug’s future research and use. The reported UPLC-MS/MS method uses pirfenidone as the internal standard and showed good sensitivity and recovery (81.22%) [11]. Another simple, precise, economical, and accurate RP-HPLC method was developed by Jhadav el. al. The mobile phase composition was methanol and sodium phosphate buffer 10 mm pH 6.5 in a ratio of 85:15 v/v. Bosutinib’s retention time was observed at 7.43 min. The developed method was validated in accordance with regulatory criteria. The method was applied for analysis of bosutinib in tablet dosage form; however, it had a longer run time and no internal standard was used [12]. Another study used a C18 column and 1.0 percent triethylamine (v/v) in water (pH 7.0, balanced by ortho-phosphoric acid) as a mobile phase in an RP-HPLC analytical method utilizing a quality--by-design (QbD) strategy [13]. The MS detector approach has its own limits due to its cost, whereas methods based on cheap UV detectors require the solid-phase extraction process with cartridges, which increases the price of sample processing. As a result, the current investigation was performed to reduce the cost of BST analysis by employing simple UV detectors and extracting samples with acetonitrile as a protein aggregating agent.
The study of drugs and their metabolites has relied heavily on the liquid–liquid extraction (LLE) process. In HPLC analysis, clean samples are essential to minimize the ion suppression and matrix effects. In controlled bioanalysis, liquid–liquid extraction (LLE) is a popular technique for sample preparation. LLE is thought to be inexpensive and can produce clean extracts with high analyte recoveries. To concurrently achieve significant recoveries for metabolites and related molecules, as well as the core analyte, extraction solvents may need to be acidified, basified, or contain low concentrations of more polar solvents. The use of LLE solvents can frequently result in extracts that are unusually saturated with phospholipids (PLs). Residual PLs can accumulate on the analytical column and the LC system in addition to contributing to matrix effects. PL build-up could result in fluctuating analyte signals, the suppression of MS responses, and even instrument downtime. Phospholipid removal (PLR) plates offer high analyte recoveries and clear extracts, just like LLE plates do. In LLE, the idea of “like dissolves like” works effectively. According to how differently the components of the sample combination divide themselves between the two immiscible solvents, by carefully selecting the extraction solvent, the compound of interest can be selectively partitioned into one of two partially miscible phases [14]. In this study, acetonitrile was optimized for protein precipitation in rat plasma samples and extraction in tablet dosage form samples.
In our approach, the separation of bosutinib was optimized in different types of solvents or mixtures of solvents and we considered the one that showed the best results. The same as for the recoveries of analytes in a plasma sample, different extracting or protein precipitating techniques were employed with various types of solvents or in a mixture of solvents. A trial to select the best for the preparation of the sample is required. For extracting bosutinib from plasma samples, we utilized dichloromethane, n-hexane, chloroform, petroleum ether, acetonitrile, ethyl acetate, and other solvents alone or a mixture of various solvents in definite proportions. After the method development, the validation processes were carried out strictly following the ICH Q2 (R1) regulations [15,16,17].
We strictly followed ICH Q11 for the screening, selection, and optimization of various factors that influence the method development and authentication, and in this analysis, the QbD approach was followed. In the context of analytical method development, QbD is referred to as AQbD and is carried out using scientific methods. Risk assessment, Design of Experiment (DoE), Analytical Target Profile (ATP), and Critical Quality Attributes (CQA) were among the methodologies used [18]. We followed the previous reports in which the different trials of factors helped to optimize the chromatographic condition for the robust and precise method development and validation and its application in the quantitative analysis [19]. A one-factor-at-a-time (OFAT) technique, in which one chromatographic parameter is adjusted in subsequent tests until a suitable resolution between chromatographic peaks is attained, is frequently used to develop HPLC procedures. In the event that there are numerous factors influencing the separation, this considerably raises the number of experiments. Because only one factor’s level changes while the others stay the same, the conventional univariate approach is insufficient. The full factorial design, on the other hand, included numerous experiments. Block combinations of the three factorial analyses were first proposed by Box and Behnken (BBD) in 1960. The corresponding decrease in the number of experiments was this analysis’ principal benefit. The combinations in which all variables are either at their highest or lowest levels are not included in BBD. Such testing of the values can produce disappointing outcomes. However, when we want to know the reaction at the extreme values of independent variables, this strategy is likewise not recommended [20].
Herein, we report an HPLC method using a UV spectrophotometer detector with a QbD approach. As discussed above, most of the earlier reported methods use MS detectors which are comparatively more expensive, especially for plasma analysis. Although some methods use UV-detectors, these are for tablet dosage form only. Furthermore, for plasma analysis, solid–liquid extraction techniques were used by earlier reported methods which require costly cartridge/columns for the removal of the complex matrix of the sample prior to its injection into HPLC. The method reported here uses acetonitrile which precipitates the proteins (in plasma samples) almost completely (98–102% recovery), and subsequent sample preparation, such as centrifugation, drying (under nitrogen), and making the desired concentration, the analysis of plasma samples, can be performed more cost-effectively. Similarly, the acetonitrile completely dissolves both bosutinib and encorafenib in tablet samples and on filtration the samples can be directly injected into HPLC. The method also takes care of extraction losses during sample preparations by using encorafenib as the internal standard. The application of the QbD approach with HPLC has a further advantage, as fewer numbers of experiments are required to obtain more reliable results, thus saving the time and resouces during the method development stage. In addition, to the best of our knowledge, no HPLC-UV method with the QbD approach has been reported until now. Therefore, a simple, accurate, and fast HPLC method was developed based on the principle of QbD. In the past, QbD approaches were used to refine chromatographic settings using central composite design (CCD); however, here, we used the Box–Behnken Design (BBD).

2. Experimental Work

2.1. Materials

Sigma-Aldrich (St. Louis, MO, USA) supplied the reference standard for bosutinib and other drugs. The tablet dosage form of bosutinib was prepared in-house using commonly available tablet excipients. Solvents and buffers, distilled water (in-house), organic/inorganic solvents, and buffers (phosphate, acetate, and formate) were acquired from Sigma-Aldrich. The rat plasma was procured form Sigma-Aldrich.

2.2. Instruments/Apparatus

A Waters HPLC system (Waters Breeze 1525, The Netherlands, and Germany) fitted with an auto-sampler, a binary pump, and UV-Visible detector was used for HPLC analysis. Separation was achieved in an analytical Raptor C-18 reverse phase column having dimensions of 100 m × 4.6 mm × 5 µm internal diameter and fitted with a raptor guard column. Mettler Toledo analytical balances (Kern & Sohn GmbH, Balingen, Germany) and micropipettes (Eppendorf, Framingham, MA, USA) were used.

2.3. Methods

2.3.1. Risk Assessment Studies
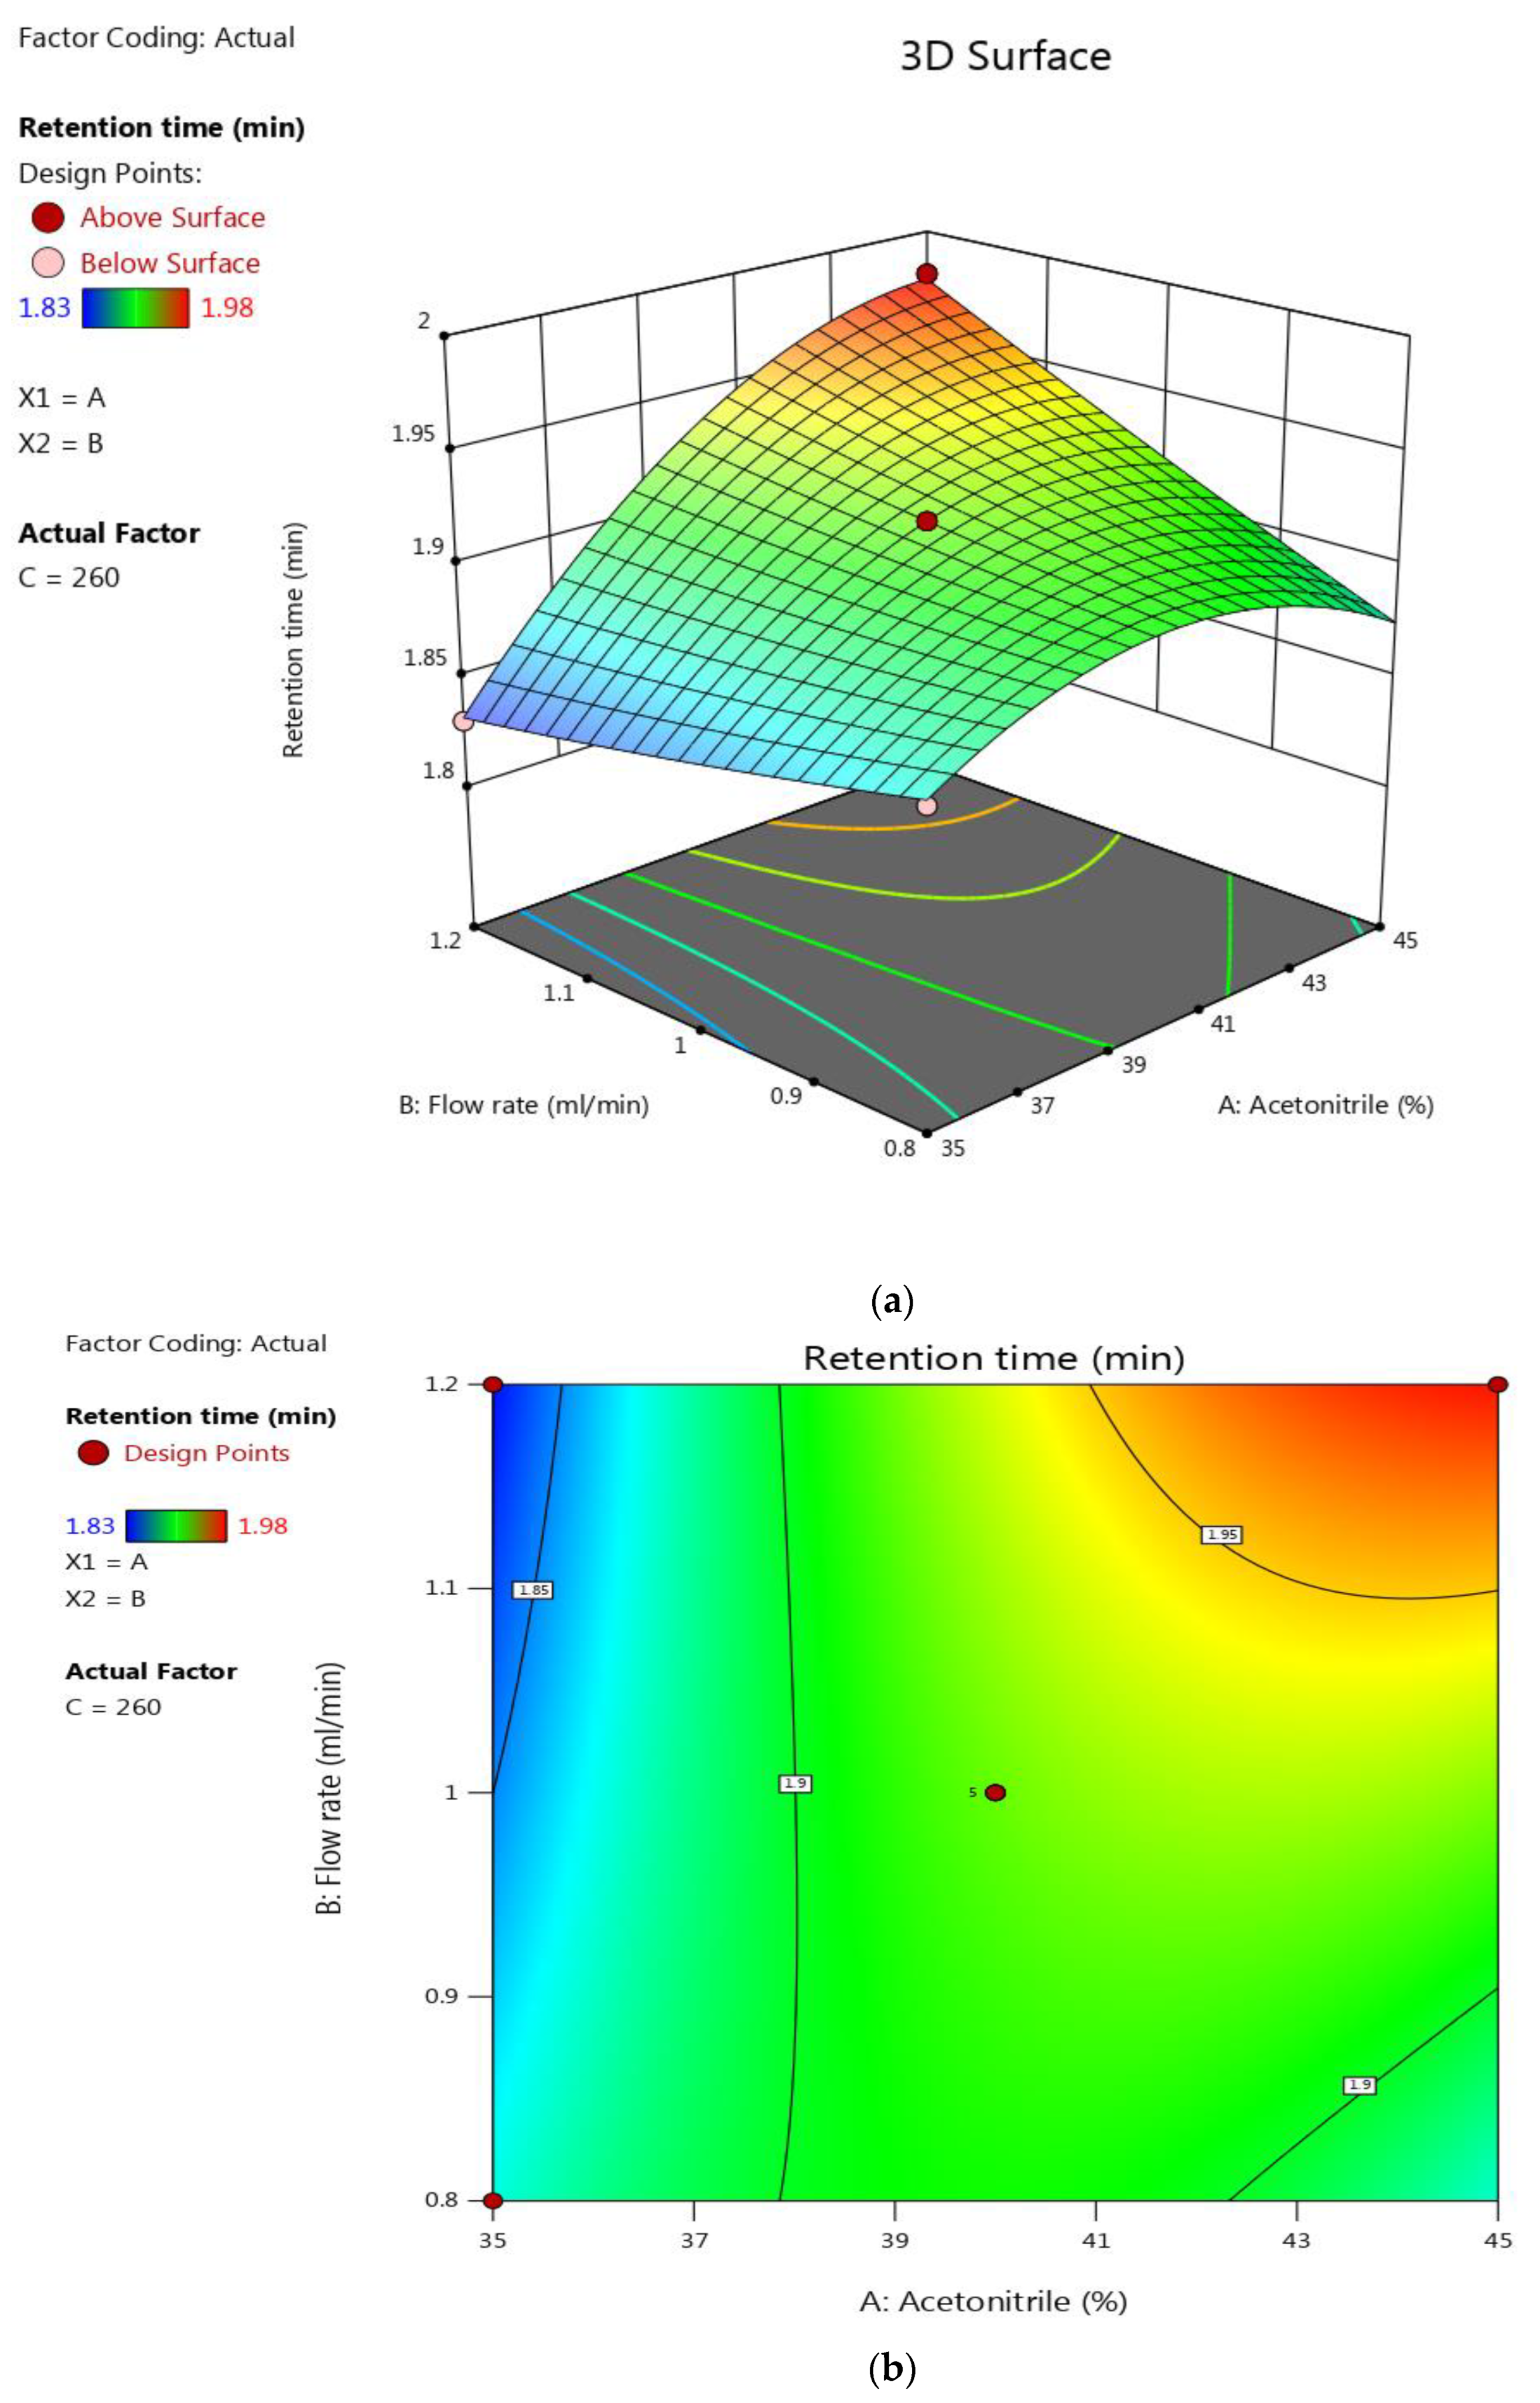
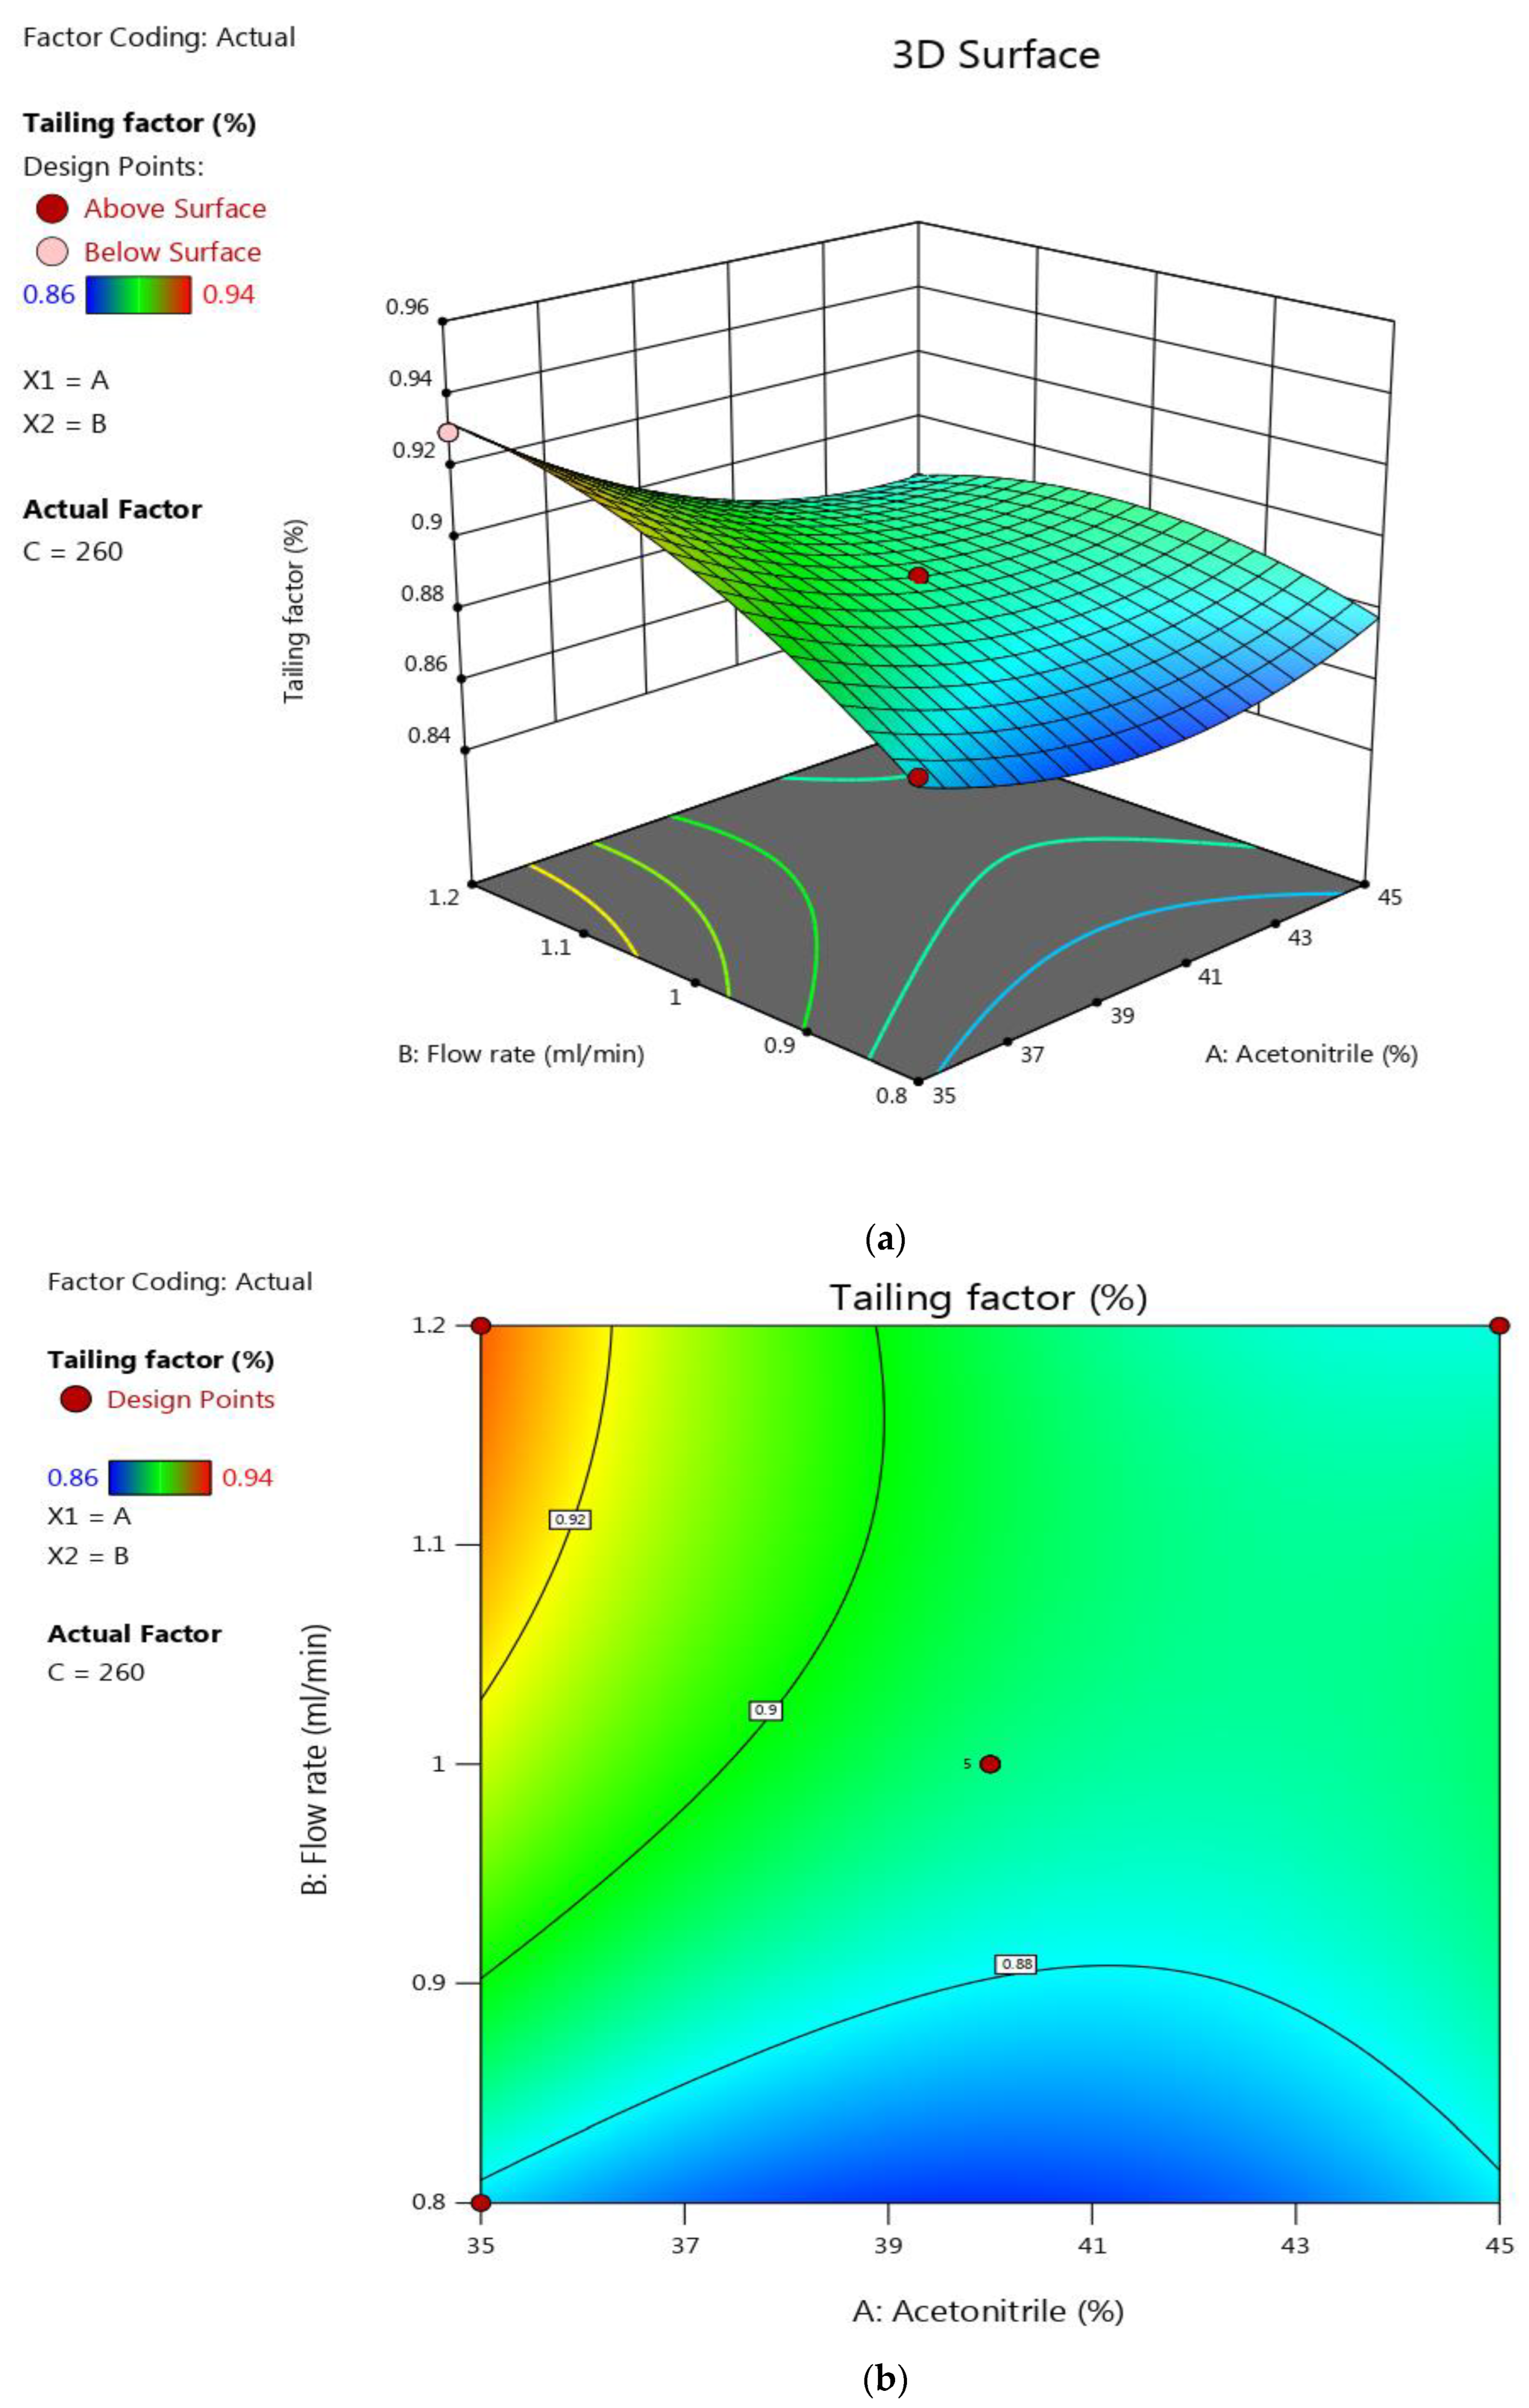
The goal of risk evaluations is to investigate the impact of different conditions on the target method’s quality profile (TMQP) [20]. With the help of critical analytical attributes (CAAs), it is easier to interpret the relationships among the critical method parameters of the TMQP before risk-assessment studies. The data from risk-assessment studies help to examine the cause of the problems and fix the the reasons for imperfections, variations, defects, or failures. An additional role of risk assessment studies is to collect information about the individual’s risk factor, which can be further segregated into high, medium, and low risk. In this study, a total of seven factors were considered for screening. Among these, three factors were selected based on the high-, medium-, and low-risk scores for systemic optimization [21,22,23].

2.3.2. Optimization

With the help of QbD, the appropriate trials were constructed. The trials differed from one another due to the interaction impact of factors on each other over the dependent variables. The response surface morphology of the BBD study was planned with three independent components and two dependent response factors, and the Design Expert 13.0.3.0 programme was used for the research setup. Tailing factor (percent) and retention time (minute) were evaluated as dependent variables after the optimization of independent variables, such as mobile phase component flow rate (mL/min), acetonitrile (percent v/v), and wavelength (nm), and their individual and combined effects. To obtain a chromatographically optimized condition, a total of seventeen runs were performed [24,25].

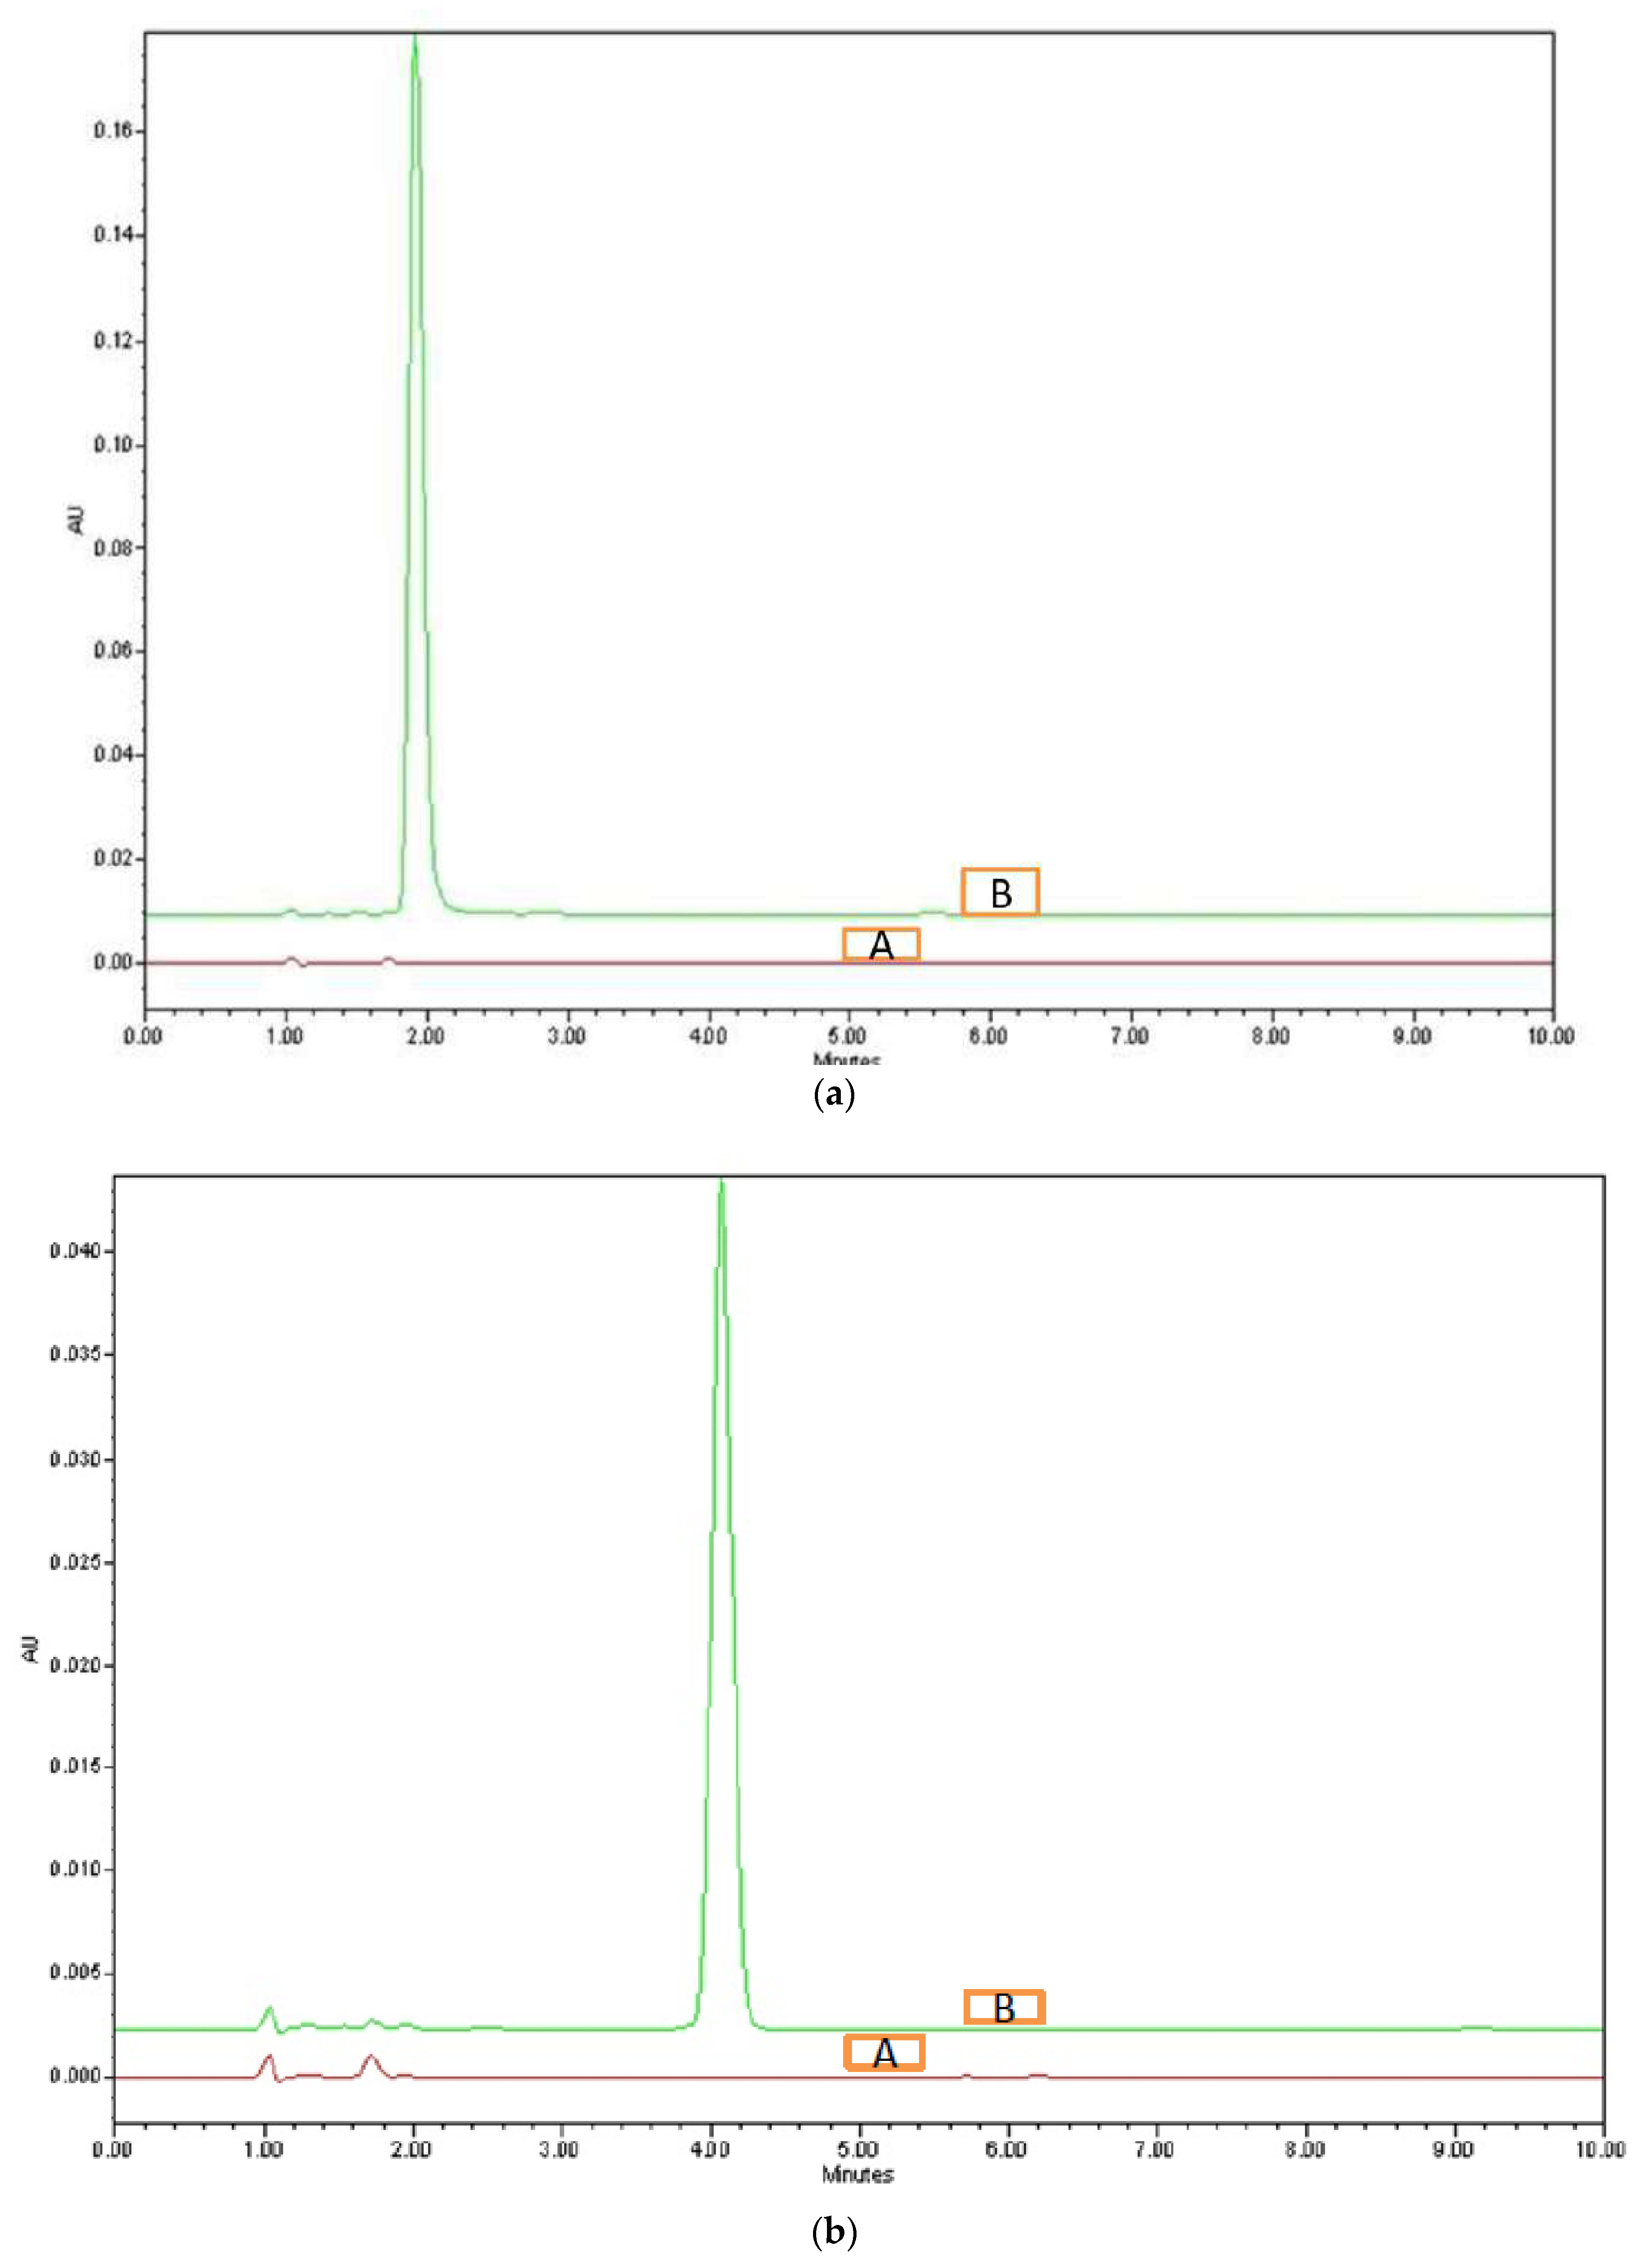
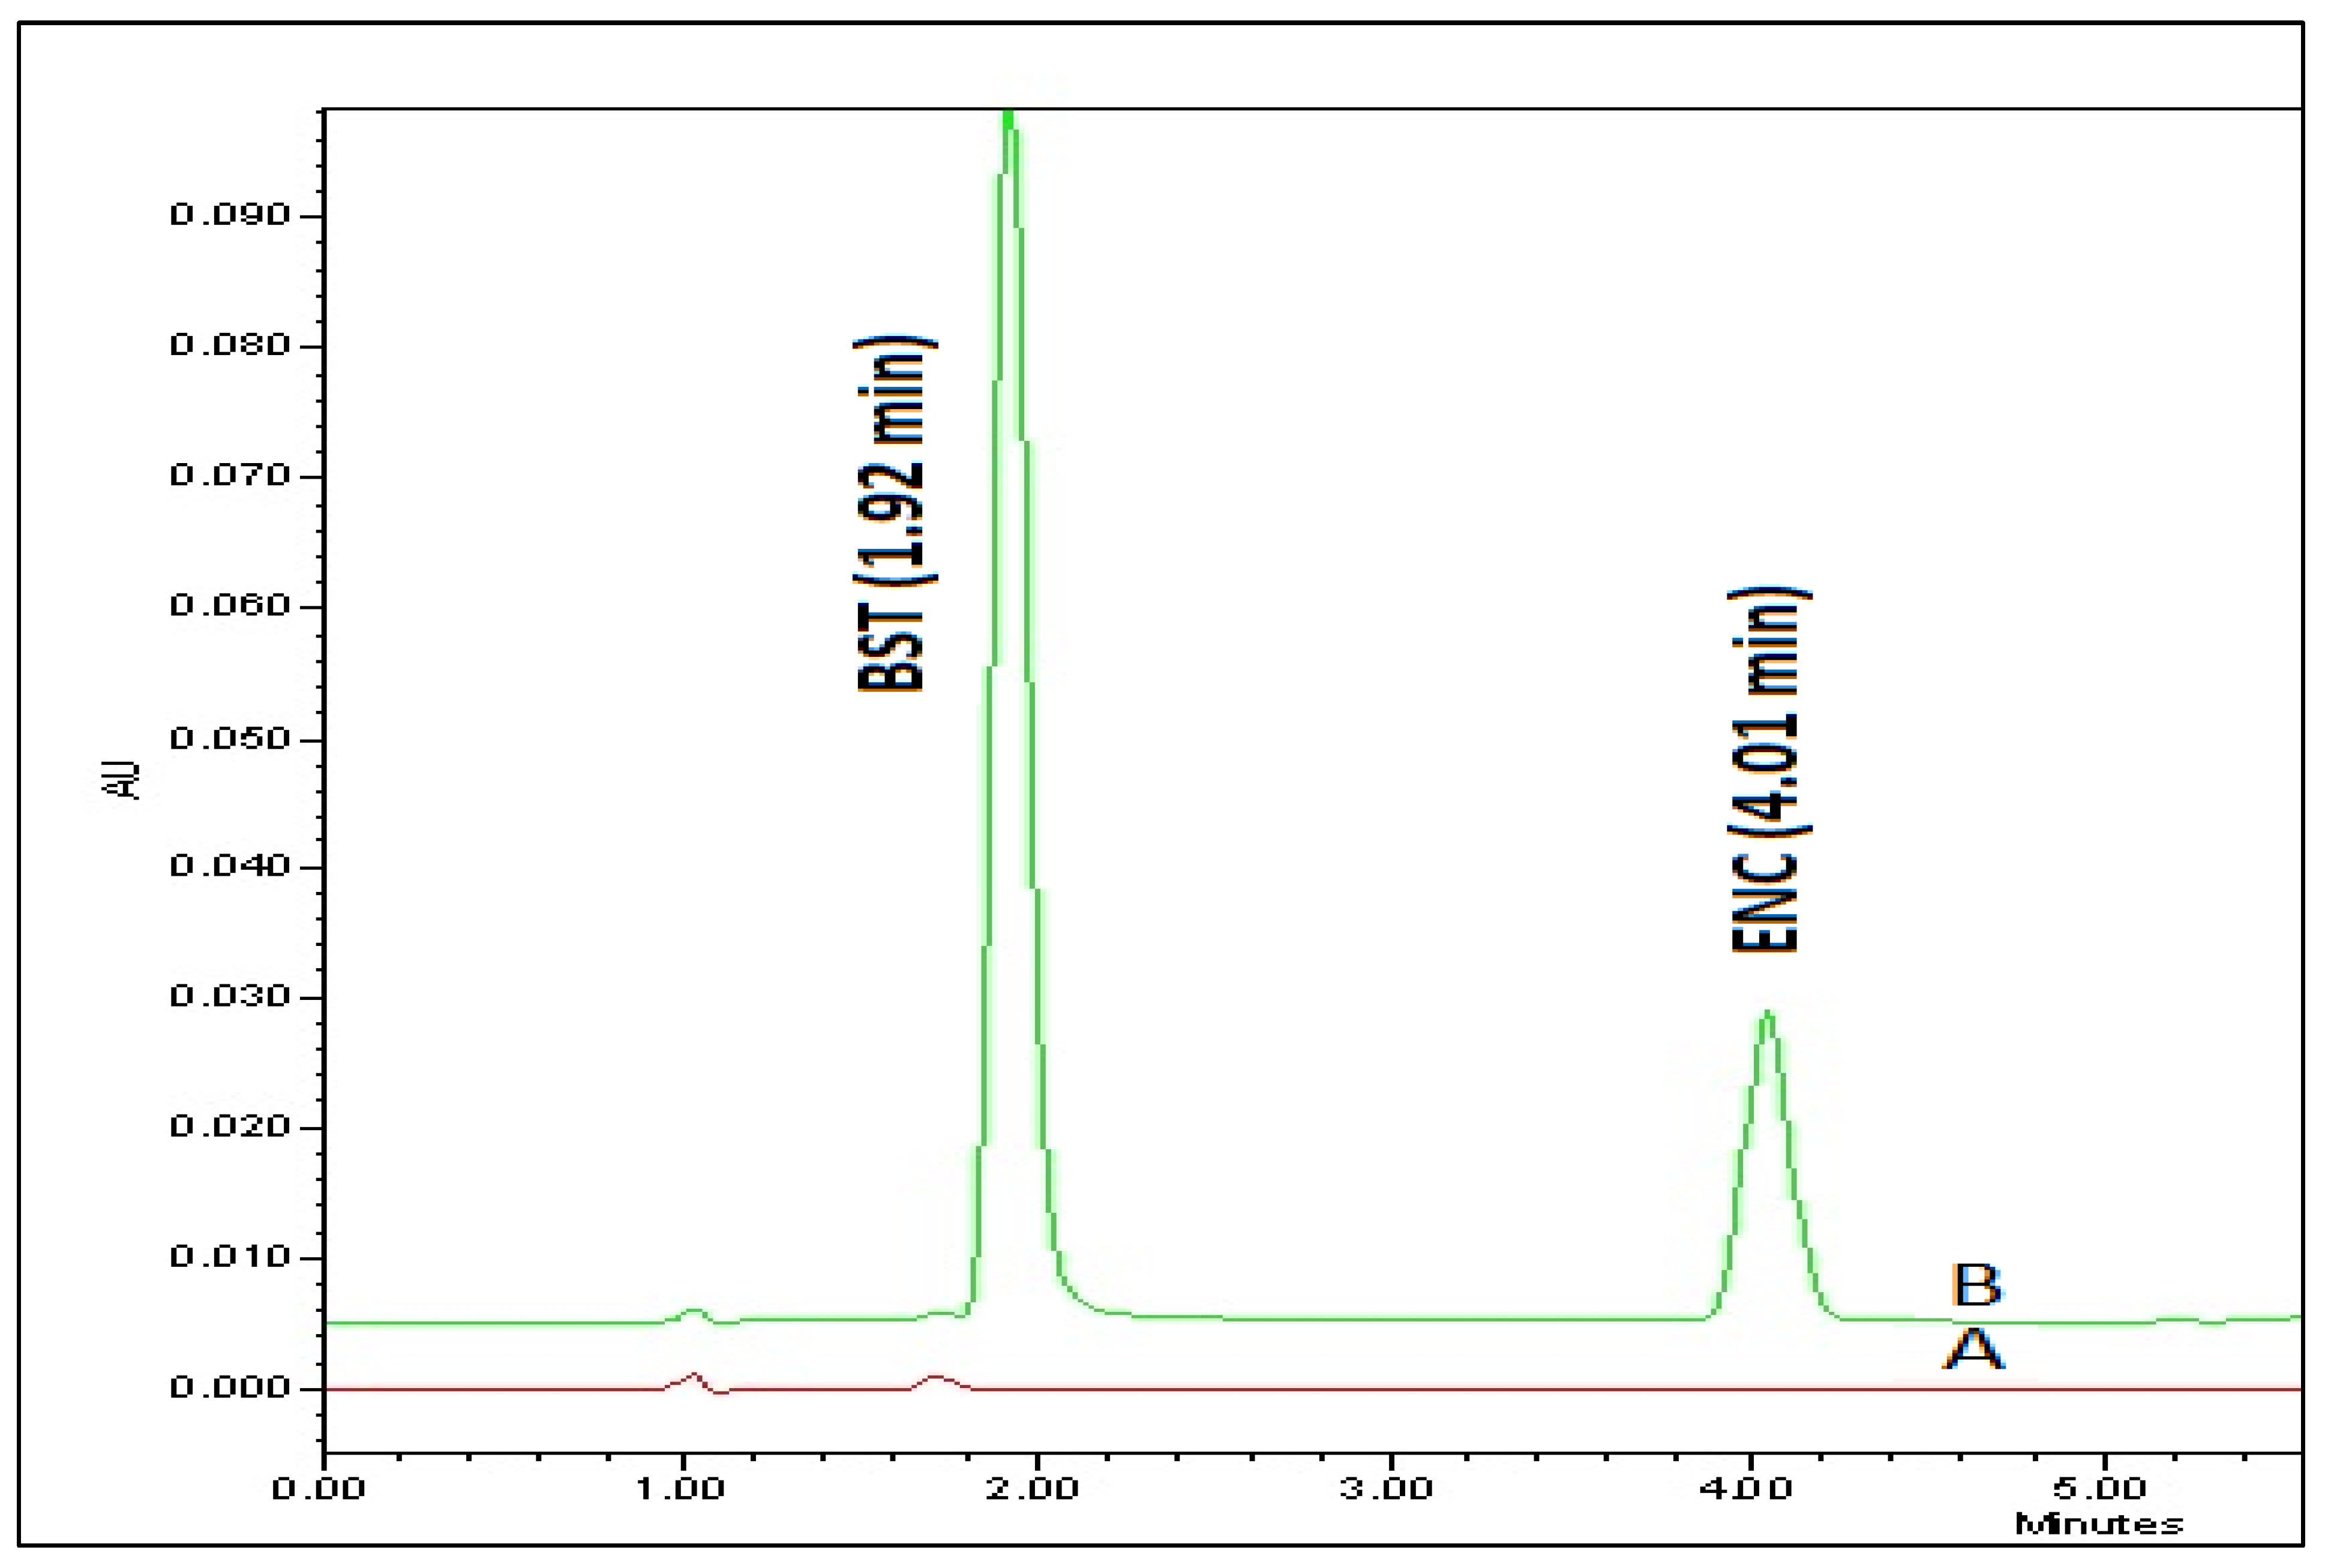
2.3.3. Method Development

Separation and identification of the drug BST were carried out in a Raptor C-18 column at a temperature of 25 °C with a mobile phase flow rate of 1 mL/ min in a 5 min run time after the chromatographic conditions were customized. An injection volume of 20 μL was employed with a mixture of the mobile composition phase of ammonium acetate buffer pH 3.0 (A) and acetonitrile (B) (60:40 percent v/v) in isocratic conditions. The detection of elutes was performed at 260 nm with an internal standard Encorafenib (ENC).

2.3.4. Stock, Standard, and Quality-Control Sample

1 mg/mL strength stock solution of the drug (BST) was prepared in methanol and stored at 4 °C. A final dilution of 100 μg/mL was prepared by mixing 1 mL of (1000 μg/mL) solution with 9 mL of mobile phase solvent (A: B 60:40 v/v) for the preparation of the calibration curve in a concentration range of 2–20 μg/mL (2, 4, 8, 12, 16 and 20 μg/mL). Similarly, the internal standard solution of ENC (100 μg/mL) was prepared and added to calibration standard solutions to obtain the final concentration of 10 μg/mL of ENC in each. Three levels of quality assurance samples were prepared: (a) HQC (High quality control) (20 μg/mL), (b) MQC (Medium quality control) (12 μg/mL), and (c) LQC (Low quality control) (2 μg/mL). For subsequent analysis, all of the solutions were kept at 20 °C.

2.3.5. Preparation of Calibration Curve

A series of six dilutions over the range (2–20 μg/mL) of the standard drug (BST), each containing 10 μg/mL of internal standard ENC, were prepared to have an r2 value of 0.9996 and an average standard deviation value of 0.09766. The limit of detection and the quantification were determined by the formulae 3.3 × SD/Slope and 10 × SD/Slope, respectively.

2.3.6. Preparation of Tablet Formulation Solution

We weighed 5 mg of pure BST (21.0 mg of tablet powder) and dissolved it in 5 mL of methanol (1 mg/mL; 1000 μg/mL). After agitating for 10 min by the use of a sonicator, the solution was passed through a 0.2 μm filter. Three concentration ranges [80–120%] of test concentration (10 μg/mL) were prepared, as shown in Table 1 and the chromatogram in Figure 2 For quantitative analysis, the developed method and the standard calibration curve were employed.

2.3.7. Preparation of Rat Plasma Samples

Three ranging concentrations [50–150%] of the sample (10 μg/mL) were prepared. To 150 μL plasma (Sigma-Aldrich), 10, 20 and 30 μL of BST solution (500 μg/mL) was added to make a concentration of 5, 10, and 15 μg/mL, respectively, then vortexed the solution for 10 min. Thereafter, 40 μL of internal standard (ENC) solution in a 500 μg/mL concentration was added to it. After vortexing the entire solution for ten minutes, 750 μL of acetonitrile was added. The resulting mixture was centrifuged at 5000 rpm (2800 RCF or g) at 40 °C for 10 min and acetonitrile layer carefully separated. The solution was then dried under nitrogen at 40 °C and reduced to a final volume of 1 mL with the mobile phase. The solution was filtered through a 0.2 μm filter, degassed for 1 min, and injected into HPLC for analysis. The chromatogram is shown in Figure 3.

2.4. Method Validation

All validation parameters, including system appropriateness, linearity, LOD, LOQ, accuracy, precision, robustness, and solution stability, were determined in accordance with ICH Q2 (R1) criteria [16,26].

2.4.1. System Suitability Test
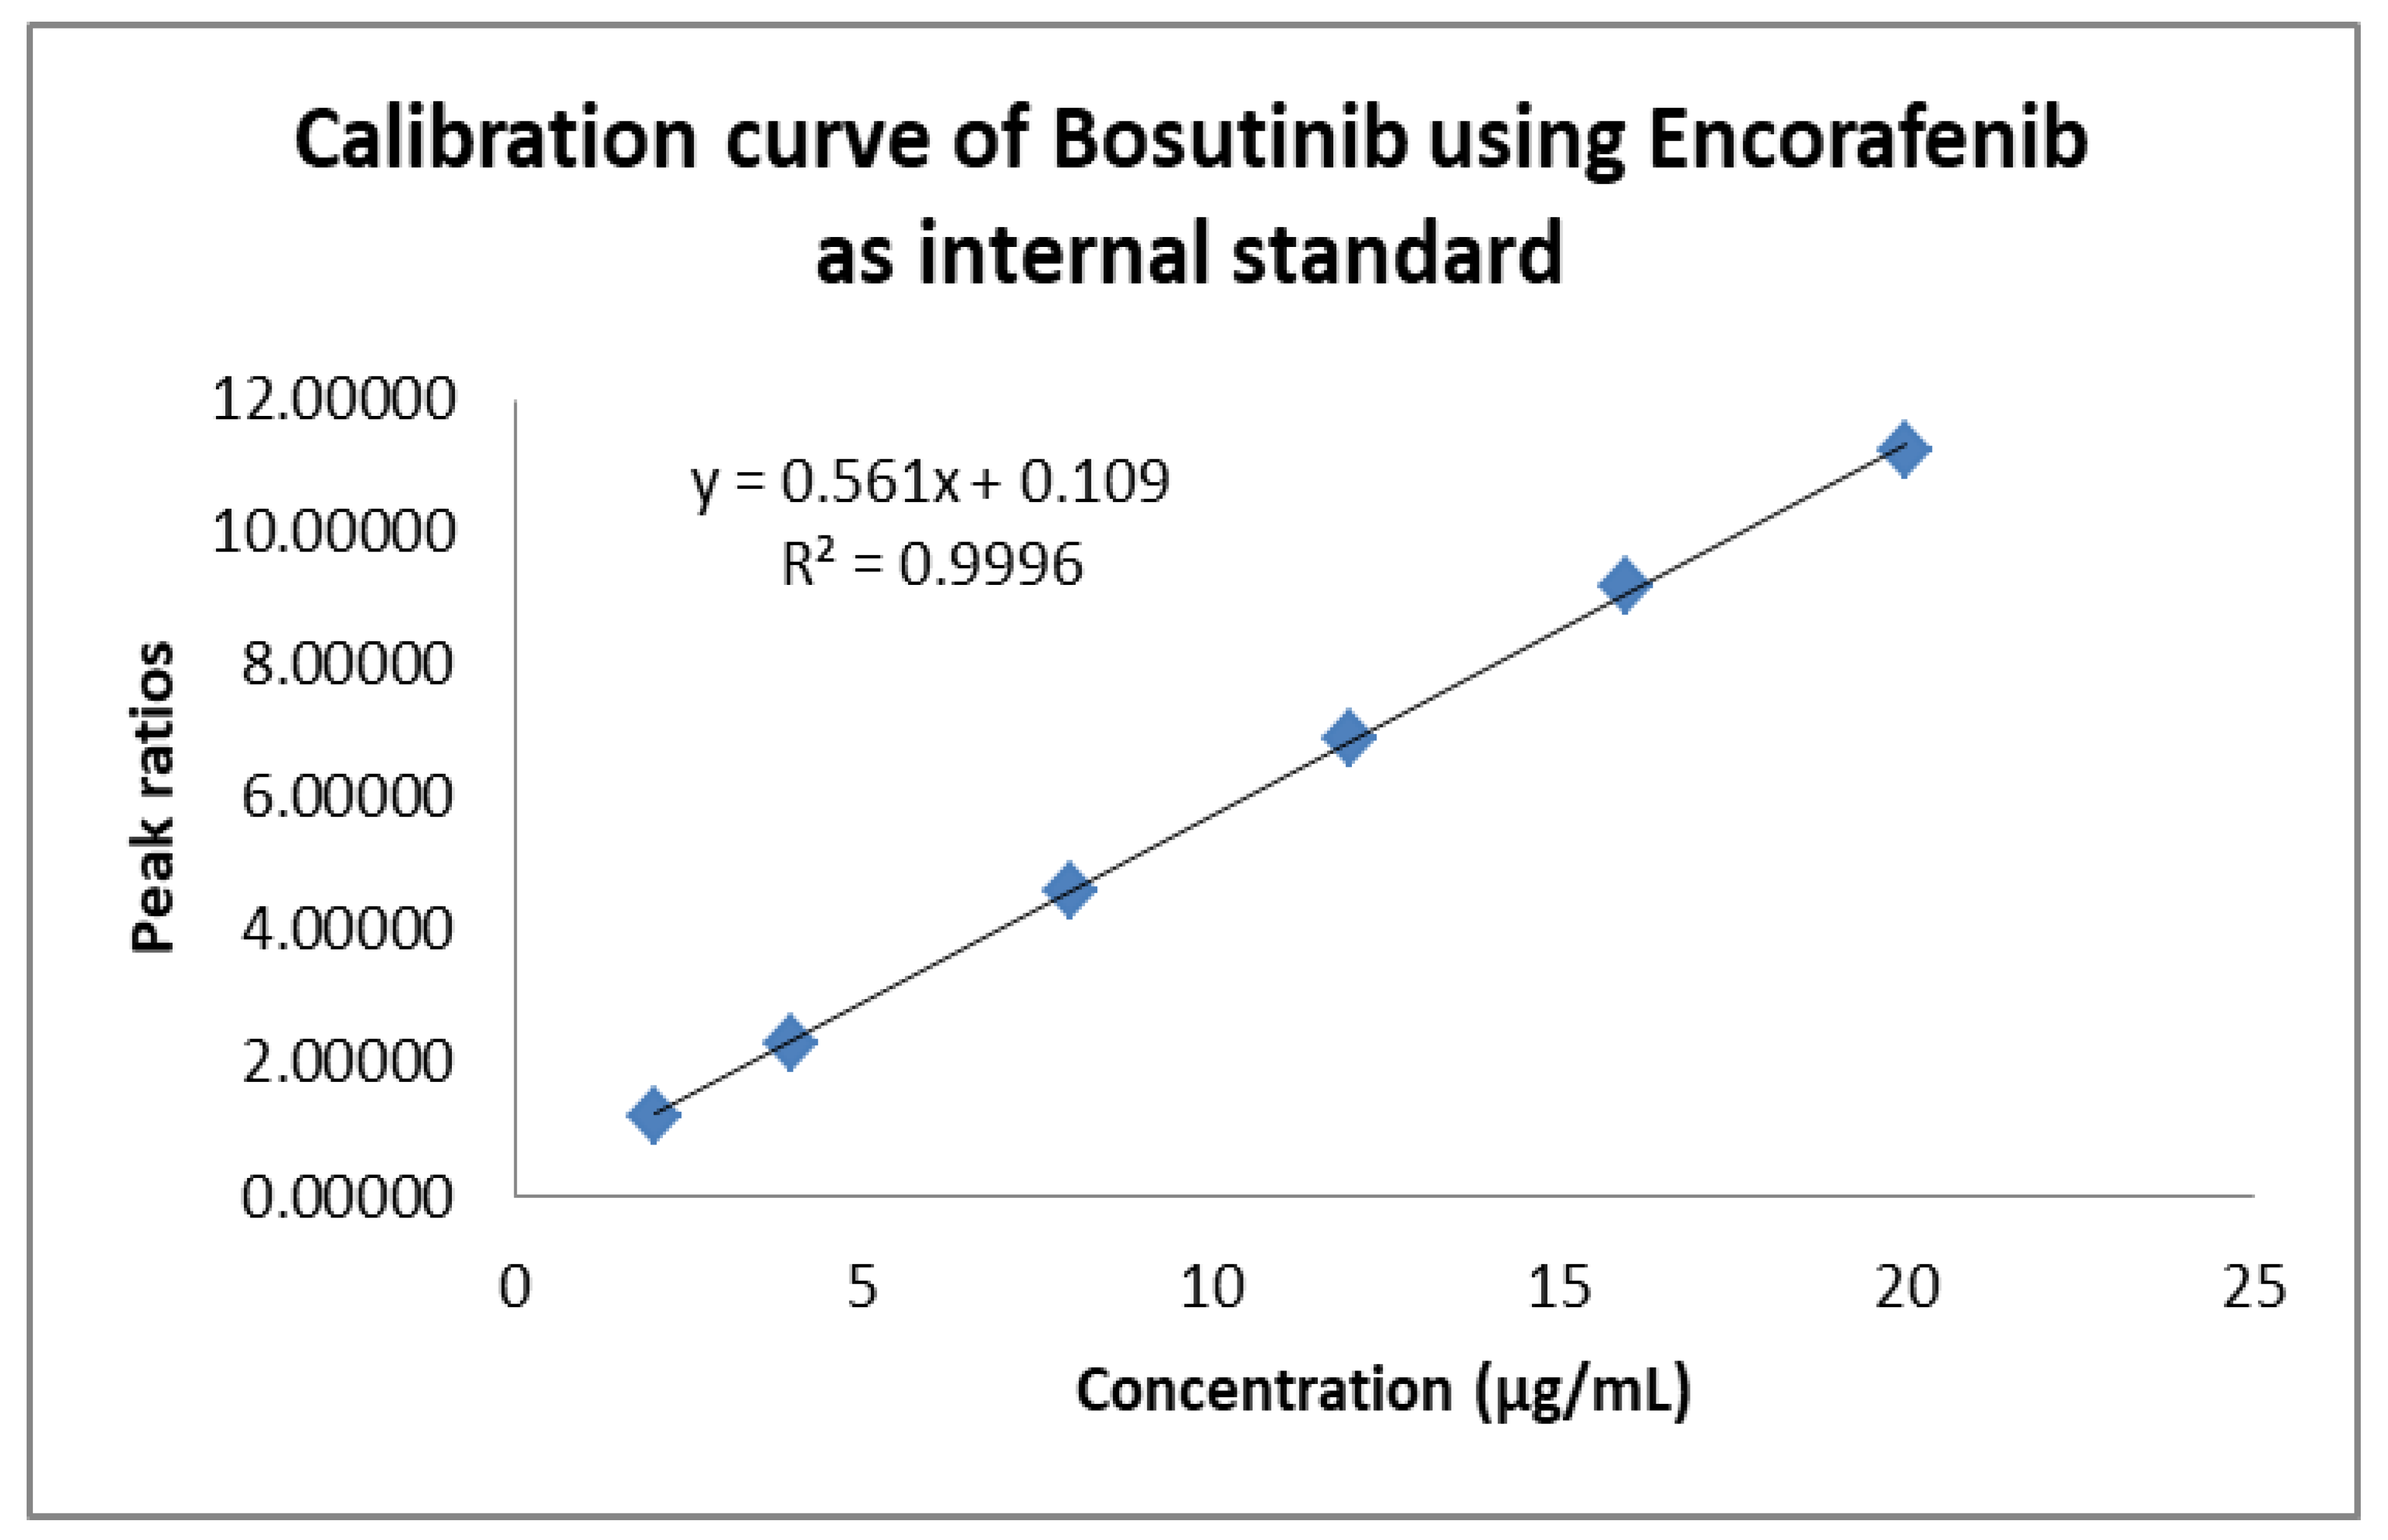
System suitability tests were checked for equipment’s performance analysis following USP 24/NF 19 to obtain reproducible results. The system chromatographic reproducibility was checked before analysing the sample batch. The consistency of individual results for six batches (n = 6) of samples was checked and the percentage-relative standard deviation (%RSD) was reported using three factors: tailing factor, retention times, and theoretical plate [27].

2.4.2. Linearity

Linearity of the calibration curve was performed (n = 6) on the sample of the standard drug BST of six dilutions in the range of 2–20 μg/mL. It was ensured by the detector’s response of individual concentrations, and determined the r2 value using the regression equation. A calibration curve was plotted between the average peak ratio and concentration of a sample of the working standard solution with internal standard ENC (10 μg/mL) [28].

2.4.3. Precision and Accuracy

The precision was determined in terms of interday and intraday on three quality-control samples; LQC (2 μg/mL), MQC (12 μg/mL), and HQC (20 μg/mL) of BST with %RSD of less than 2% of each concentration level.
For the accuracy test, the traditional addition approach (percent recovery) was employed. The percent recovery and percent RSD for each concentration were determined using the pre-estimated sample solution (8 g/mL) loaded with an additional 0, 50, 100, and 150 percent of the standard BST solution [29,30].

2.4.4. Solution Stability

The solution stability was determined at MQC level (12 μg/mL) at 25 °C for 14 days and 2–8 °C for 30 days. The % recovery and % RSD of the experiment were calculated [31].

2.4.5. Robustness Study

A robustness study was carried out to assess the impact of a slight but deliberate alteration in the chromatographic conditions. The value of retention time, tailing factor, and plate count by changing the ammonium acetate buffer pH, flow rate, and detector wavelength were measured [32].

3. Results and Discussion

3.1. Risk Assessment Studies

The findings revealed that risk assessment was used to determine the effects of each element on the chromatographic condition. After screening, three factors, i.e., retention time, peak area, and tailing factor (TF) were selected for the efficient method shown in Table 2.

3.2. Optimization

With experimental design optimisation, it is possible to develop a mathematical model that illustrates how each element affects the outcome of the experiment as well as to identify the factors’ ideal values. The process of figuring out the ideal values for the significant elements discovered during screening is known as optimisation. The selection of conditions that yield the appropriate combination of chromatographic parameters presents a challenge during the chromatographic optimisation processes. Multiple-answer variables must be simultaneously optimised in order to solve this problem.
Retention time: Using the three independent variables, the retention time was optimized. The BBD surface response was robust as five trials results showed analysis of variance for the Quadratic model (trial 13–17). The results revealed that the p-values < 0.0500, suggesting that the analytical model was significant. The S/N was calculated with sufficient precision. A ratio (S/N) larger than 4 was advantageous. A signal-to-noise ratio of 56.376 indicated a sufficient signal. This paradigm might be useful for navigating the design space Table 3, Figure 4a,b.
Tailing factor: Symmetry and shape of the peak determined the developed method’s accuracy. Here, the tailing factor value was optimized by the BBD surface response with ANOVA for the quadratic model, the results of which are shown in the last five trials (13–17). The p-values < 0.0500, as described in the preceding section, demonstrate the sufficient precision measurement of the signal-to-noise ratio (S/N) with a value larger than 4 was desirable. A signal with a S/N ratio of 56.376 was considered sufficient. The design space could be navigated using this paradigm (Table 3, Figure 5a,b).
The surface sensitivity of BBD shows that the experimental circumstances were matched to the linear and quadratic equations using the multiple regression approach.

3.3. Stock, Standard and Quality Control Sample

The sample was run in the instrument at the optimized condition to check the specificity and retention time of the drug BST and internal standard ENC. The result showed no peak in the blank solution, which confirms the specificity result and retention time of BST (1.92 min) and ENC (4.01 min) (Figure 6a,b).

3.4. Method Validation

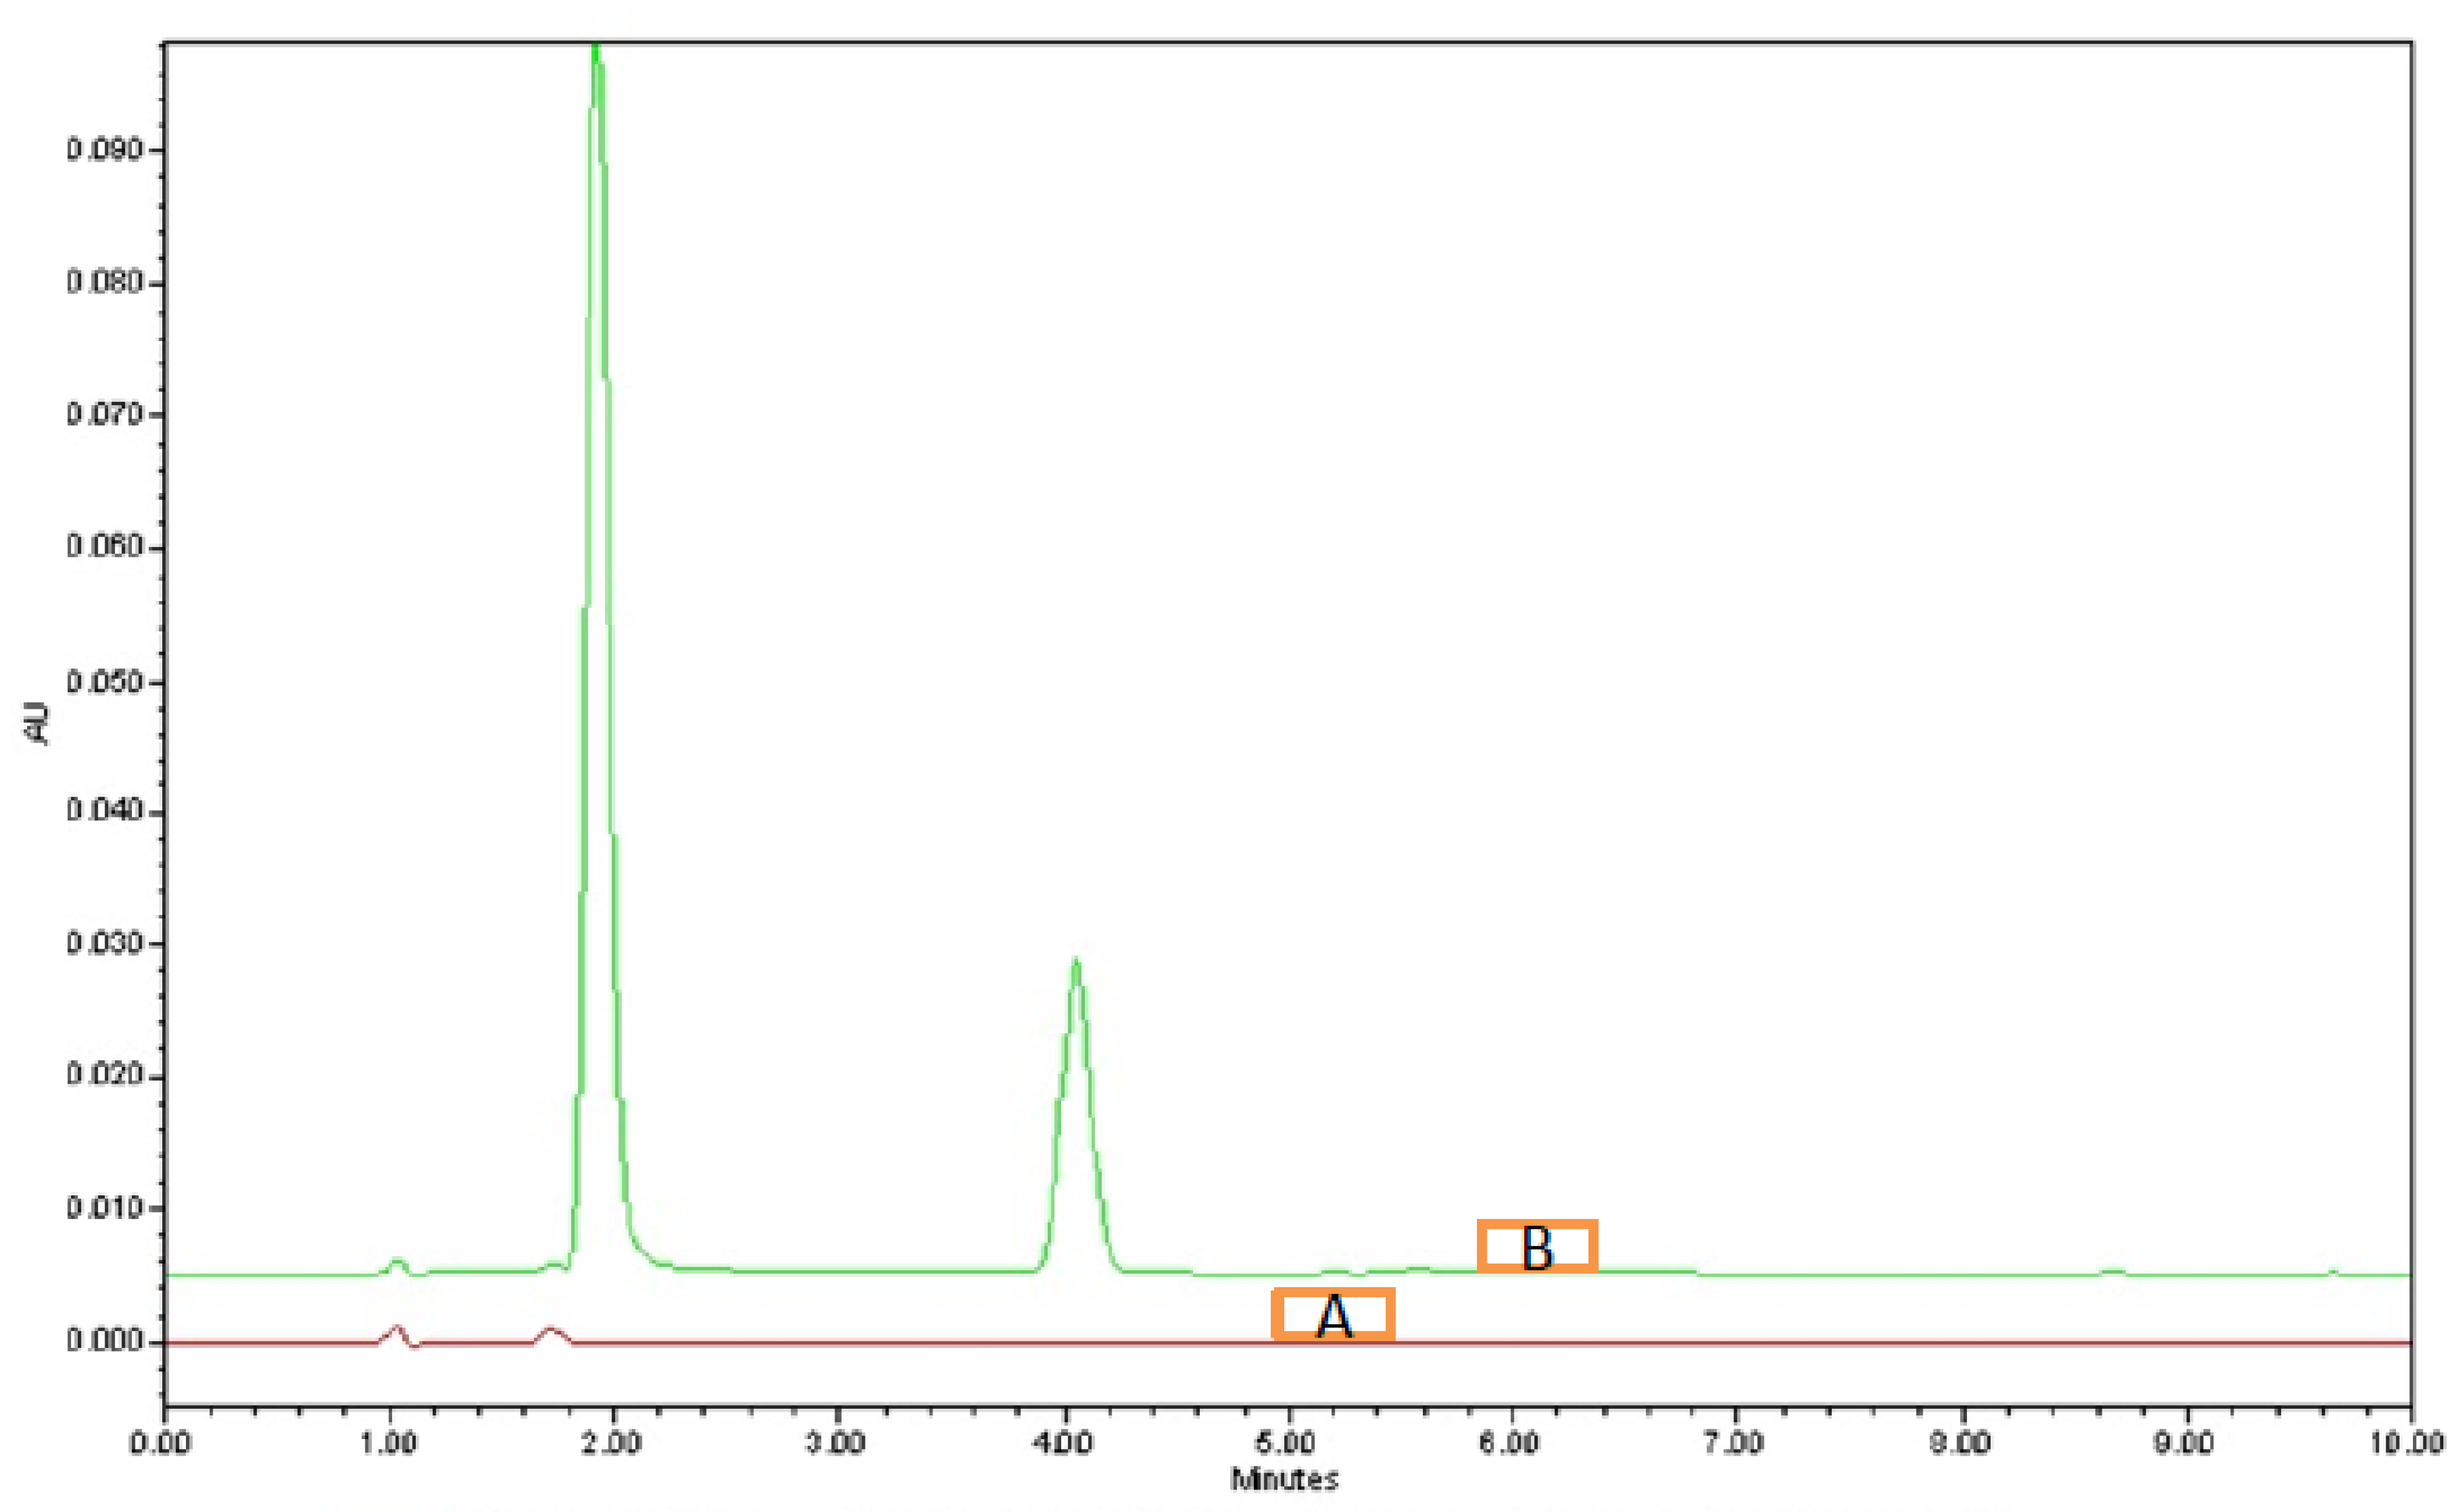
3.4.1. System Suitability

The analysis of the samples batch showed a reproducible result in factor retention time, tailing factor, and theoretical plate. The value of standard deviation (SD) and percentage of relative standard deviation (% RSD) indicate that the reproducibility of the chromatographic system is good (Table 4, Figure 7). All the values of %RSD below 2% followed the acceptance criteria. Well-resolved peaks of the drug and internal standard were observed.

3.4.2. Linearity

The calibration curve of the standard solution (2–20 μg/mL) was plotted in between average peak ratio and concentration. Results of the linear regression analysis of the calibration curves (n = 6) of BST are depicted in Table 5 and Figure 8. The r2 value 0.999 and % RSD 1.659 indicated good linearity, with a limit of detection of 0.496 μg/mL.

3.4.3. Precision and Accuracy

Inter- and intra-day precision for three quality control levels (LQC, MQC, and HQC) are presented in Table 6, and a chromatogram is shown in Figure 9. The % RSD value of the precision and accuracy was below 2%, which indicated that the developed method is precise and accurate.

3.4.4. Solution Stability

The stability of the drug solution (BST) was checked at a temperature of 25 °C for 14 days and 2–8 °C for 30 days for a concentration level of 12 µg/mL (MQC). The % RSD of was found to be <2%. Results are shown in Table 7.

3.4.5. Robustness Study

The tailing factor, the retention time, and the plate count of the BST and internal standard were not significantly affected by changes in the developed method, such as changes in buffer pH, flow rate, and detector wavelength (ENC). Table 8 summarizes the findings.

4. Conclusions

Quality by design is applied to the optimization of chromatographic conditions. The new simple, rapid, accurate, and precise method was developed for HPLC analysis and has been validated according to ICH guidelines. The new method is economical, the mobile phase is easily available, and it employs a simple UV detector and a simple extraction procedure for rat plasma and tablet dosage form samples. The validation of the study results revealed that the developed method could be adapted for the routine analysis of tablet dosage form and rat plasma samples. This HPLC method can be used for drug therapeutic monitoring (TDM) and bioavailability studies.
Pharmaceutical liquid chromatographic separation was improved with the use of QbD. When compared to the traditional optimisation procedure, which involves modifying one variable at a time, the provided approach allows for the performance of fewer trials for each optimisation stage. The introduction of a multi-objective approach to the optimisation process is made possible by the computation of the desirability function since numerous parameters are merged into a single score. In this instance, the global desirability was expressed as the resolution between analyte peaks, chromatographic responses, and chromatographic separation time. By minimising the use of harmful solvents, one of the optimisation aims, the presented approach enables the integration of the green analytical chemistry element. The described methodology is straightforward since it makes use of technologies that are widely available but slightly modified and necessitates a remarkably little number of chromatographic runs.

Author Contributions

Conceptualization, A.N.; software, H.A.A. and M.M.A.; validation, Z.u.R.; formal analysis, N.H.M., K.M.H., N.A.N. and A.A.M.; resources, H.A.A. and M.M.A.; writing-original draft preparation, Z.u.R.; writing-review and editing, H.A.A. and M.M.A.; supervision, Z.u.R.; project administration, A.N.; funding acquisition, A.N. All authors have read and agreed to the published version of the manuscript.”

Funding

This research was funded by Deanship for Research and Innovation, Ministry of Education, Saudi Arabia grant number [ISP22-16]. The APC was funded by the same grant number.

Data Availability Statement

The data presented in this study are available on request from the corresponding author.

Acknowledgments

The authors extend their appreciation to the Deanship for Research and Innovation, Ministry of Education in Saudi Arabia for funding this research work through the project number ISP22-16.

Conflicts of Interest

Authors declare no conflict of interest.

References

  1. Abbas, R.; Hsyu, P.H. Clinical Pharmacokinetics and Pharmacodynamics of Bosutinib. Clin. Pharmacokinet. 2016, 55, 1191–1204. [Google Scholar] [CrossRef] [PubMed]
  2. Roskoski, R., Jr. Src protein-tyrosine kinase structure, mechanism, and small molecule inhibitors. Pharmacol. Res. 2015, 94, 9–25. [Google Scholar] [CrossRef] [PubMed]
  3. Hartmann, J.T.; Haap, M.; Kopp, H.G.; Lipp, H.P. Tyrosine kinase inhibitors—A review on pharmacology, metabolism and side effects. Curr. Drug Metab. 2009, 10, 470–481. [Google Scholar] [CrossRef] [PubMed]
  4. Keller, G.; Schafhausen, P.; Brummendorf, T.H. Bosutinib: A dual SRC/ABL kinase inhibitor for the treatment of chronic myeloid leukemia. Expert. Rev. Hematol. 2009, 2, 489–497. [Google Scholar] [CrossRef]
  5. Smith, J.H.; McNair, H.M. Fast HPLC with a silica-based monolithic ODS column. J. Chromatogr. Sci. 2003, 41, 209–214. [Google Scholar] [CrossRef] [Green Version]
  6. Buszewski, B.; Noga, S. Hydrophilic interaction liquid chromatography (HILIC)—A powerful separation technique. Anal. Bioanal. Chem. 2012, 402, 231–247. [Google Scholar] [CrossRef] [Green Version]
  7. Dziadosz, M.; Lessig, R.; Bartels, H. HPLC-DAD protein kinase inhibitor analysis in human serum. J. Chromatogr. B 2012, 893, 77–81. [Google Scholar] [CrossRef]
  8. Sumimoto, T.; Nakahara, R.; Sato, Y.; Itoh, H. A quantitative method for the determination of bosutinib in human plasma using high-performance liquid chromatography and ultraviolet detection. J. Clin. Lab. Anal. 2018, 32, e22201. [Google Scholar] [CrossRef] [Green Version]
  9. Mita, A.; Abumiya, M.; Miura, M.; Niioka, T.; Takahashi, S.; Yoshioka, T.; Kameoka, T.; Takahashi, N. Correlation of plasma concentration and adverse effects of bosutinib: Standard dose or dose-escalation regimens of bosutinib treatment for patients with chronic myeloid leukemia. Exp. Hematol. Oncol. 2018, 7, 9. [Google Scholar] [CrossRef]
  10. Wang, L.; Tang, L.; Zheng, Y.; Pan, G.; Zhu, W.; Pan, C.; Zhu, L. Determination of bosutinib in mice plasma and tissue by UPLC-MS/MS and its application to the pharmacokinetic and tissue distribution study. Anal. Method 2015, 7, 9184–9189. [Google Scholar] [CrossRef]
  11. Xu, Y.; Huang, X.C.; Dai, S.; Xiao, Y.; Zhou, M.T. A simple method for the determination of Bosutinib in rat plasma by UPLC-MS/MS. J. Chromatogr. B 2015, 1004, 93–97. [Google Scholar] [CrossRef]
  12. Jadhav, P.B.; Gajare, G.K. Development and Validation of an RP-HPLC method for bosutinib in bulk dosage form. Int. J. Res. Pharm. Chem. 2016, 6, 599–603. [Google Scholar]
  13. Prajapati, P.B.; Bagul, N.; Kalyankar, G. Implementation of DoE and Risk-Based Enhanced Analytical Quality by Design Approach to Stability-Indicating RP-HPLC Method for Stability Study of Bosutinib. J. AOAC Int. 2021, 104, 1742–1753. [Google Scholar] [CrossRef]
  14. Raman, N.V.; Mallu, U.R.; Bapatu, H.R. Analytical Quality by Design Approach to Test Method Development and Validation in Drug Substance Manufacturing. J. Chem. 2015, 2015, 435129. (Pages-8). [Google Scholar] [CrossRef]
  15. Konda, R.K.; Challa, B.R.; Chandu, B.R.; Chandrasekhar, K.B. Bioanalytical method development and validation of memantine in human plasma by high performance liquid chromatography with tandem mass spectrometry: Application to bioequivalence study. J. Anal. Methods Chem. 2012, 2012, 101249. (Pages-8). [Google Scholar] [CrossRef] [Green Version]
  16. ICH, Geneva (Switzerland). Q2 (R1) Validation of Analytical Procedures: Text and Methodology 1994/1996. Available online: https://database.ich.org/sites/default/files/Q2%28R1%29%20Guideline.pdf (accessed on 5 March 2022).
  17. USFDA USA, Centre for Drug Evaluation and Research (CDER). Reviewer Guidance: Validation of Chromatographic Methods, Rockville 1994. Available online: https://www.fda.gov/regulatory-information/search-fda-guidance-documents/reviewer-guidance-validation-chromatographic-methods (accessed on 5 April 2022).
  18. USFDA USA. Guidance for Industry: Analytical Procedures and Methods Validation; Chemistry Manufacturing and Control Documentation, Rockville 2000. Available online: https://www.astrixinc.com/data/integrity (accessed on 5 April 2022).
  19. Jain, P.; Taleuzzaman, M.; Kala, C.; Kumar Gupta, D.; Ali, A.; Aslam, M. Quality by design (Qbd) assisted development of phytosomal gel of aloe vera extract for topical delivery. J. Liposome Res. 2021, 31, 381–388. [Google Scholar] [CrossRef]
  20. Panda, S.S.; Ravi Kumar Bera, V.V.; Beg, S.; Mandal, O. Analytical Quality by Design (AQbD)-Oriented RP-UFLC Method for Quantification of Lansoprazole with Superior Method Robustness. J. Liq. Chromatogr. Relat. Technol. 2017, 40, 479–485. [Google Scholar] [CrossRef]
  21. Peraman, R.; Bhadraya, K.; Reddy, Y.P.; Reddy, C.S.; Lokesh, T. Analytical Quality by Design Approach in RP-HPLC Method Development for the Assay of Etofenamate in Dosage Forms. Ind. J. Pharm. Sci. 2015, 77, 751–757. [Google Scholar] [CrossRef]
  22. Ameeduzzafar El-Bagory, I.; Alruwaili, N.K.; Imam, S.S.; Alomar, F.A.; Elkomy, M.H.; Ahmad, N.; Elmowafy, M. Quality by design (QbD) based development and validation of bioanalytical RP-HPLC method for dapagliflozin: Forced degradation and preclinical pharmacokinetic study. J. Liq. Chromatogr. Relat. Technol. 2020, 43, 53–65. [Google Scholar] [CrossRef]
  23. Prajapati, P.B.; Patel, A.S.; Shah, S.A. DoE-Based Analytical-FMCEA for Enhanced AQbD Approach to MEER-RP-HPLC Method for Synchronous Estimation of Fifteen Antihypertensive Pharmaceutical Dosage Forms. J. AOAC Int. 2022, 105, 34–45. [Google Scholar] [CrossRef]
  24. Mohanty, D.; Rani, M.J.; Haque, M.A.; Bakshi, V.; Jahangir, M.A.; Imam, S.S.; Gilani, S.J. Preparation and evaluation of transdermal naproxen niosomes: Formulation optimization to preclinical anti-inflammatory assessment on murine model. J. Liposome Res. 2020, 30, 377–387. [Google Scholar] [CrossRef] [PubMed]
  25. Rahat, I.; Imam, S.S.; Rizwanullah, M.; Alshehri, S.; Asif, M.; Kala, C.; Taleuzzamane, M. Thymoquinone-entrapped chitosan-modified nanoparticles: Formulation optimization to preclinical bioavailability assessments. Drug Deliv. 2021, 28, 973–984. [Google Scholar] [CrossRef]
  26. International Conference on Harmonization (ICH: Q2). Guideline on Validation of Analytical Procedures: Text and Methodology 2005. Available online: http://www.ich.org/products/guidelines/quality/quality-single/article/validation-of-analytical-procedurestext-and-methodology.html (accessed on 21 July 2014).
  27. The United States Pharmacopoeia 35 National Formulary 30, Eas-Ton; Rand Mc Nally Taunton: Chicago, IL, USA, 2012.
  28. Gillings, N.; Todde, S.; Behe, M.; Decristoforo, C.; Elsinga, P.; Ferrari, V.; Patt, M. EANM guideline on the validation of analytical methods for radiopharmaceuticals. EJNMMI Radiopharm. Chem. 2020, 5, 7. [Google Scholar] [CrossRef] [PubMed]
  29. Amer, S.M.; Kadi, A.A.; Darwish, H.W.; Attwa, M.W. LC-MS/MS method for the quantification of masitinib in RLMs matrix and rat urine: Application to metabolic stability and excretion rate. Chem. Cent. J. 2017, 11, 136. [Google Scholar] [CrossRef] [PubMed] [Green Version]
  30. Kadi, A.A.; Darwish, H.W.; Attwa, M.W.; Amer, S.M. Validated LC-MS/MS Method for the Quantification of Ponatinib in Plasma: Application to Metabolic Stability. PLoS ONE 2016, 11, e0164967. [Google Scholar] [CrossRef] [PubMed] [Green Version]
  31. Dabhi, B.; Jadeja, Y.; Patel, M.; Jebaliya, H.; Karia, D.; Shah, A. Method Development and Validation of a Stability-Indicating RP-HPLC Method for the Quantitative Analysis of Dronedarone Hydrochloride in Pharmaceutical Tablets. Sci. Pharm. 2013, 81, 115–122. [Google Scholar] [CrossRef] [Green Version]
  32. Tome, T.; Žigart, N.; Časar, Z.; Obreza, A. Development and optimization of liquid chromatography analytical methods by using AQbD principles: Overview and recent advances. Org. Process Res. Dev. 2019, 23, 1784–1802. [Google Scholar] [CrossRef] [Green Version]
Figure 1. Structure of Bosutinib (BST).
Separations 10 00346 g001
Figure 2. Chromatogram showing blank (A), placebo (B) at test concentration, and tablet sample (C) at test concentration.
Separations 10 00346 g002
Figure 3. Chromatogram showing blank (A), plasma blank (B) at test concentration, and (C) plasma sample at test concentration.
Separations 10 00346 g003
Figure 4. (a). Effect of independent factor on retention time 3D sensitive surface. (b). Effect of the independent factor on retention time -contour plot.
Separations 10 00346 g004
Figure 5. (a). Effect of an independent factor on tailing factor—3-D response surface. (b). Effect of an independent factor on tailing factor-contour plot.
Separations 10 00346 g005
Figure 6. (a) Chromatogram of blank (A) and BST (B). (b) Chromatogram blank and ENC.
Separations 10 00346 g006
Figure 7. Chromatogram showing blank (A) and retention time of BST and ENC (B).
Separations 10 00346 g007
Figure 8. Calibration Curve of Bosutinib (n = 6).
Separations 10 00346 g008
Figure 9. Chromatogram showing Blank (A), BST and ENC at MQC level (B).
Separations 10 00346 g009
Table 1. Test concentration of tablet formulation.
Concn.(μg/mL)Standard Stock Solution (mL) (BST) (μg/mL)Internal Standard (mL) (ENC) (100 μg/mL)Mobile Phase (mL) (A:B 60:40 v/v)Total Volume (mL)
8 μg/mL (80%) 0.16 0.4 1.44 2.0
10 μg/mL (100%) 0.20 0.4 1.40 2.0
12 μg/mL (120%) 0.24 0.4 1.36 2.0
Table 2. Bosutinib method development risk evaluation.
Bosutinib Chromatographic Technique Features
CAAsEluent System ComponentsWavelength of the SensorColumn TemperatureSample VolumeFlow SpeedFlow PatternColumn Sizes
Retention time+1000+100
Peak Area+10−10+1−10
Tailing Factor+1−1−10000
Table 3. Independent variables based on the BBD and their impact on dependent variables.
S. No.Independent VariableDependent Variable
Standard RunAcetonitrile (%)Flow Speed (mL/min)Wavelength (nm)Retention Time (min)Tailing Factor
1.350.82601.870.88
2.450.82551.890.87
3.351.22601.830.93
4.451.22601.980.88
5.3512501.920.94
6.4512501.930.88
7.3512701.840.9
8.4512701.970.91
9.400.82501.980.86
10.401.22501.950.92
11.400.82701.890.87
12.401.22701.980.88
13 *.4012601.920.89
14 *.4012601.920.89
15 *.4012601.920.89
16 *.4012601.920.89
17 *.4012601.920.89
* Optimized trial.
Table 4. System suitability (n = 6).
Retention Time (min)Tailing FactorPlate Count
BSTENCBSTENCBSTENC
11.944.060.91.2120324288
21.953.990.881.220184232
31.913.970.91.2120134276
41.894.050.911.1820124232
51.933.990.871.1820224284
61.934.060.911.1720034224
Average1.9254.020.8951.191672016.6674256
SD0.01979060.037420.0150.015729.01233727.03085
%RSD0.980.921.681.264.460.63
Table 5. Linear regression analysis of calibration curves (n = 6) BST.
S. No.ParametersNumerical Value
1Linearity range (µg mL−1)2–20
2Intercept0.109
3Slope0.561
4Correlation coefficient (r2)0.999
5SD0.098
6%RSD1.659
7LOD (µg mL−1)0.496
8LOQ (µg mL−1)1.503
Table 6. Precision and accuracy (n = 6).
Precision
Inter-DayIntraday
Theoretical concentration (µg mL−1)Concentration found%RSDTheoretical concentration (µg mL−1)Concentration found%RSD
LQC21.97 ± 0.0371.89222.08 ± 0.041.923
MQC1211.91 ± 0.2221.8741211.96 ± 0.211.762
HQC2019.89 ± 0.3421.7232019.91 ± 0.3621.823
Accuracy (% Recovery) (Rat Plasma Samples)
Excess drug
added to analyte
%
Theoretical
Content
(µg mL−1)
Concentration
found
(Mean ± SD)
% Recovery
(Mean ± SD)
%RSD
087.86 ± 0.21398.25 ± 1.8471.881
501211.84 ± 0.51798.66 ± 1.9541.982
1001616.2 ± 0.673101.25 ± 1.7831.763
1502020.08 ± 0.382100.4 ± 1.4821.476
Table 7. Solution stability (n = 6).
At 25 °C for 14 DaysAt 2–8 °C for 30 Days
ABC%RSDABC%RSD
1211.85 ± 0.22398.75 ± 1.8521.8751211.81 ± 0.18698.41 ± 1.6241.651
A = Theoretical concentration (µg mL−1); B = Concentration found (µg mL−1) (Mean ± SD); C = % Recovery (Mean ± SD).
Table 8. Robustness (n = 6).
Retention Time (min)Tailing FactorPlate Count
BSTENCBSTENCBSTENC
Ammonium acetate buffer pH 3.1 (Mobile phase A) 1.934.080.851.2120894421
Ammonium acetate buffer pH 2.9 (Mobile phase A) 1.914.120.911.1620984212
Flow rate at 0.9 mL min−11.903.950.921.2219884098
Flow rate at 1.1 mL min−11.954.130.931.1819974235
Detector wavelength at 258 nm1.933.980.861.2320954312
Detector wavelength at 262 nm1.944.050.881.1720844308
Disclaimer/Publisher’s Note: The statements, opinions and data contained in all publications are solely those of the individual author(s) and contributor(s) and not of MDPI and/or the editor(s). MDPI and/or the editor(s) disclaim responsibility for any injury to people or property resulting from any ideas, methods, instructions or products referred to in the content.

