
Chemometric Approach for Profiling of Metabolites of Potential Antioxidant Activity in Apiaceae Species Based on LC-PDA-ESI-MS/MS and FT-NIR


Abstract
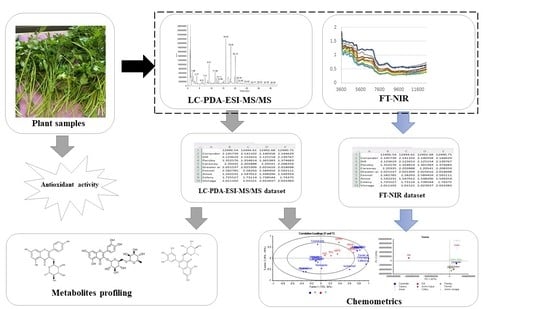
1. Introduction
2. Materials and Methods
2.1. Reagents and Standards
2.2. Plant Material from the Apiaceae Family
2.3. Extraction f Procedure
2.4. Characterization of Phenolics Using LC-PDA-ESI-MS/MS
2.5. Identification of Phenolics Using near Infrared Spectroscopy
2.6. In-Vitro Assays
2.7. Determination of Total Phenolic Content (TPC) and Total Flavonoid Content (TFC)
2.8. DPPH Free Radical Scavenging Assay
2.9. ABTS (2,2′-Azinobis-(3-ethylbenothiazoline-6-sulphonate) Assay
2.10. FRAP (Ferric Reducing/Oxidant Power) Assay
2.11. CUPRAC (Cupric Ion Reducing Antioxidant Capacity) Assay
2.12. Statistical Analysis
2.12.1. Chemometrics Analysis
2.12.2. Univariate Analysis
3. Results
3.1. Characterization of Phytochemicals
3.2. Measurement Results of Total Phenolic Content and Total Flavonoid Content and In Vitro Antioxidant Assasys
3.3. Chemometric Analysis
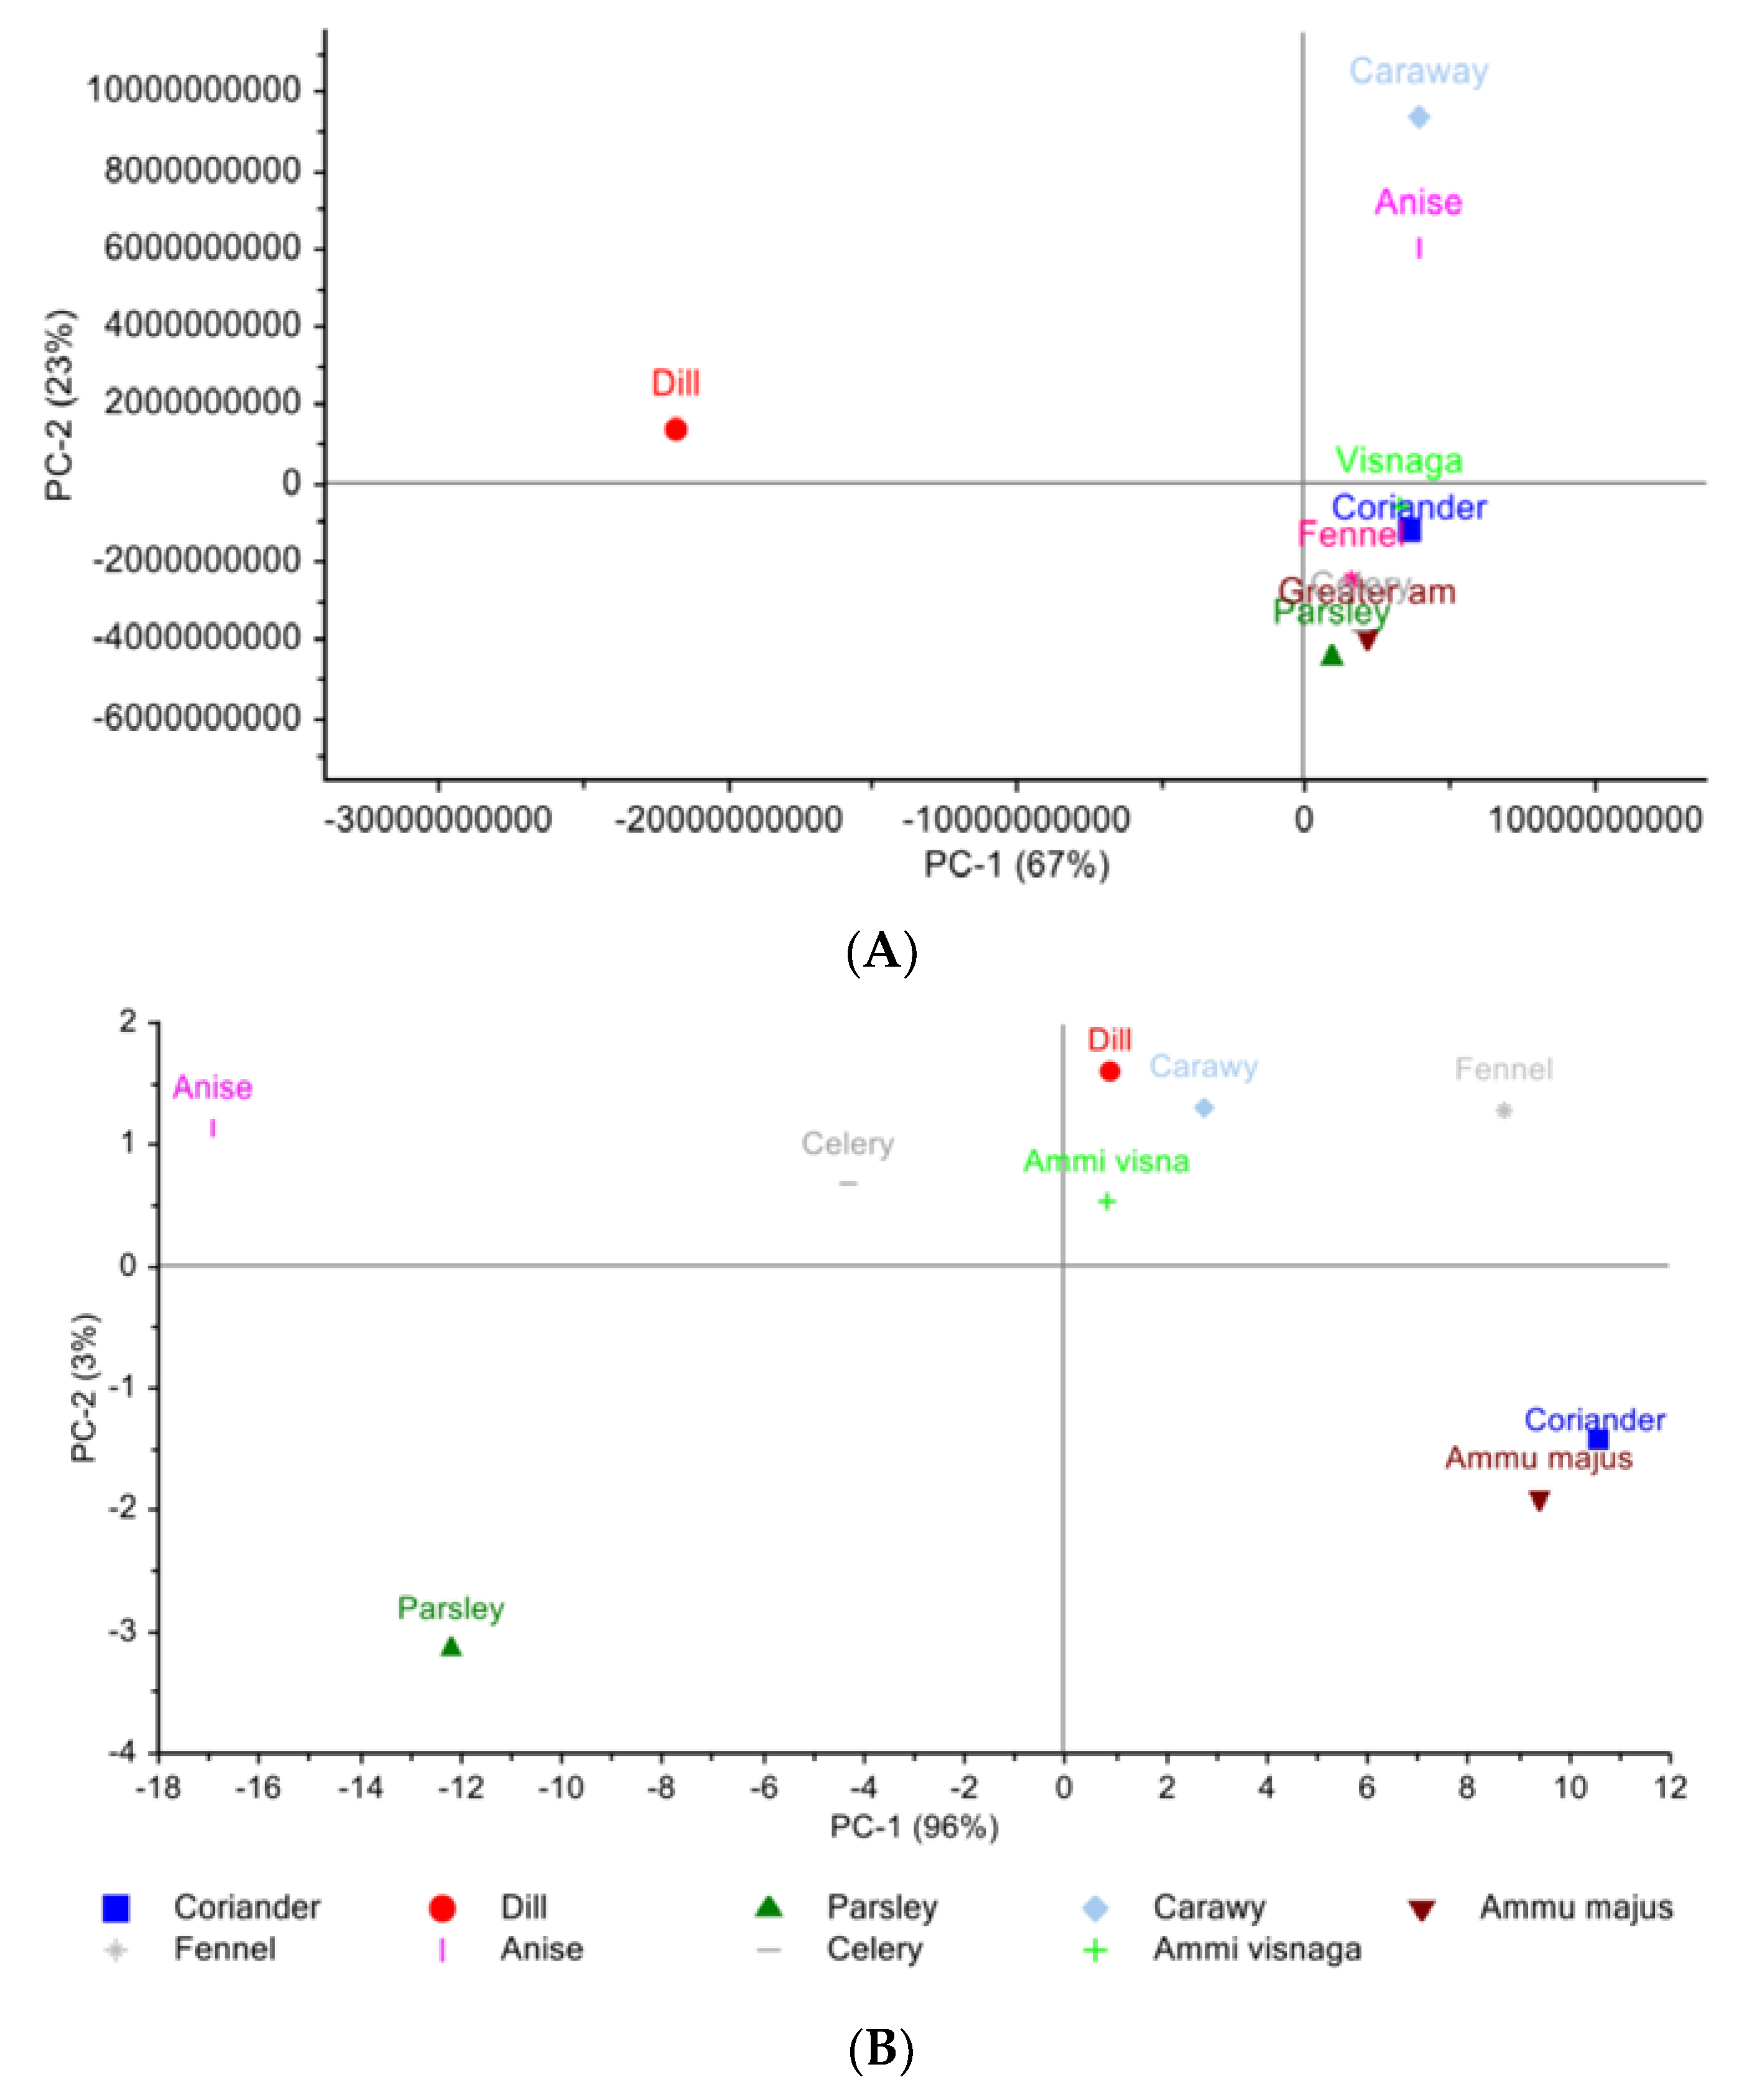
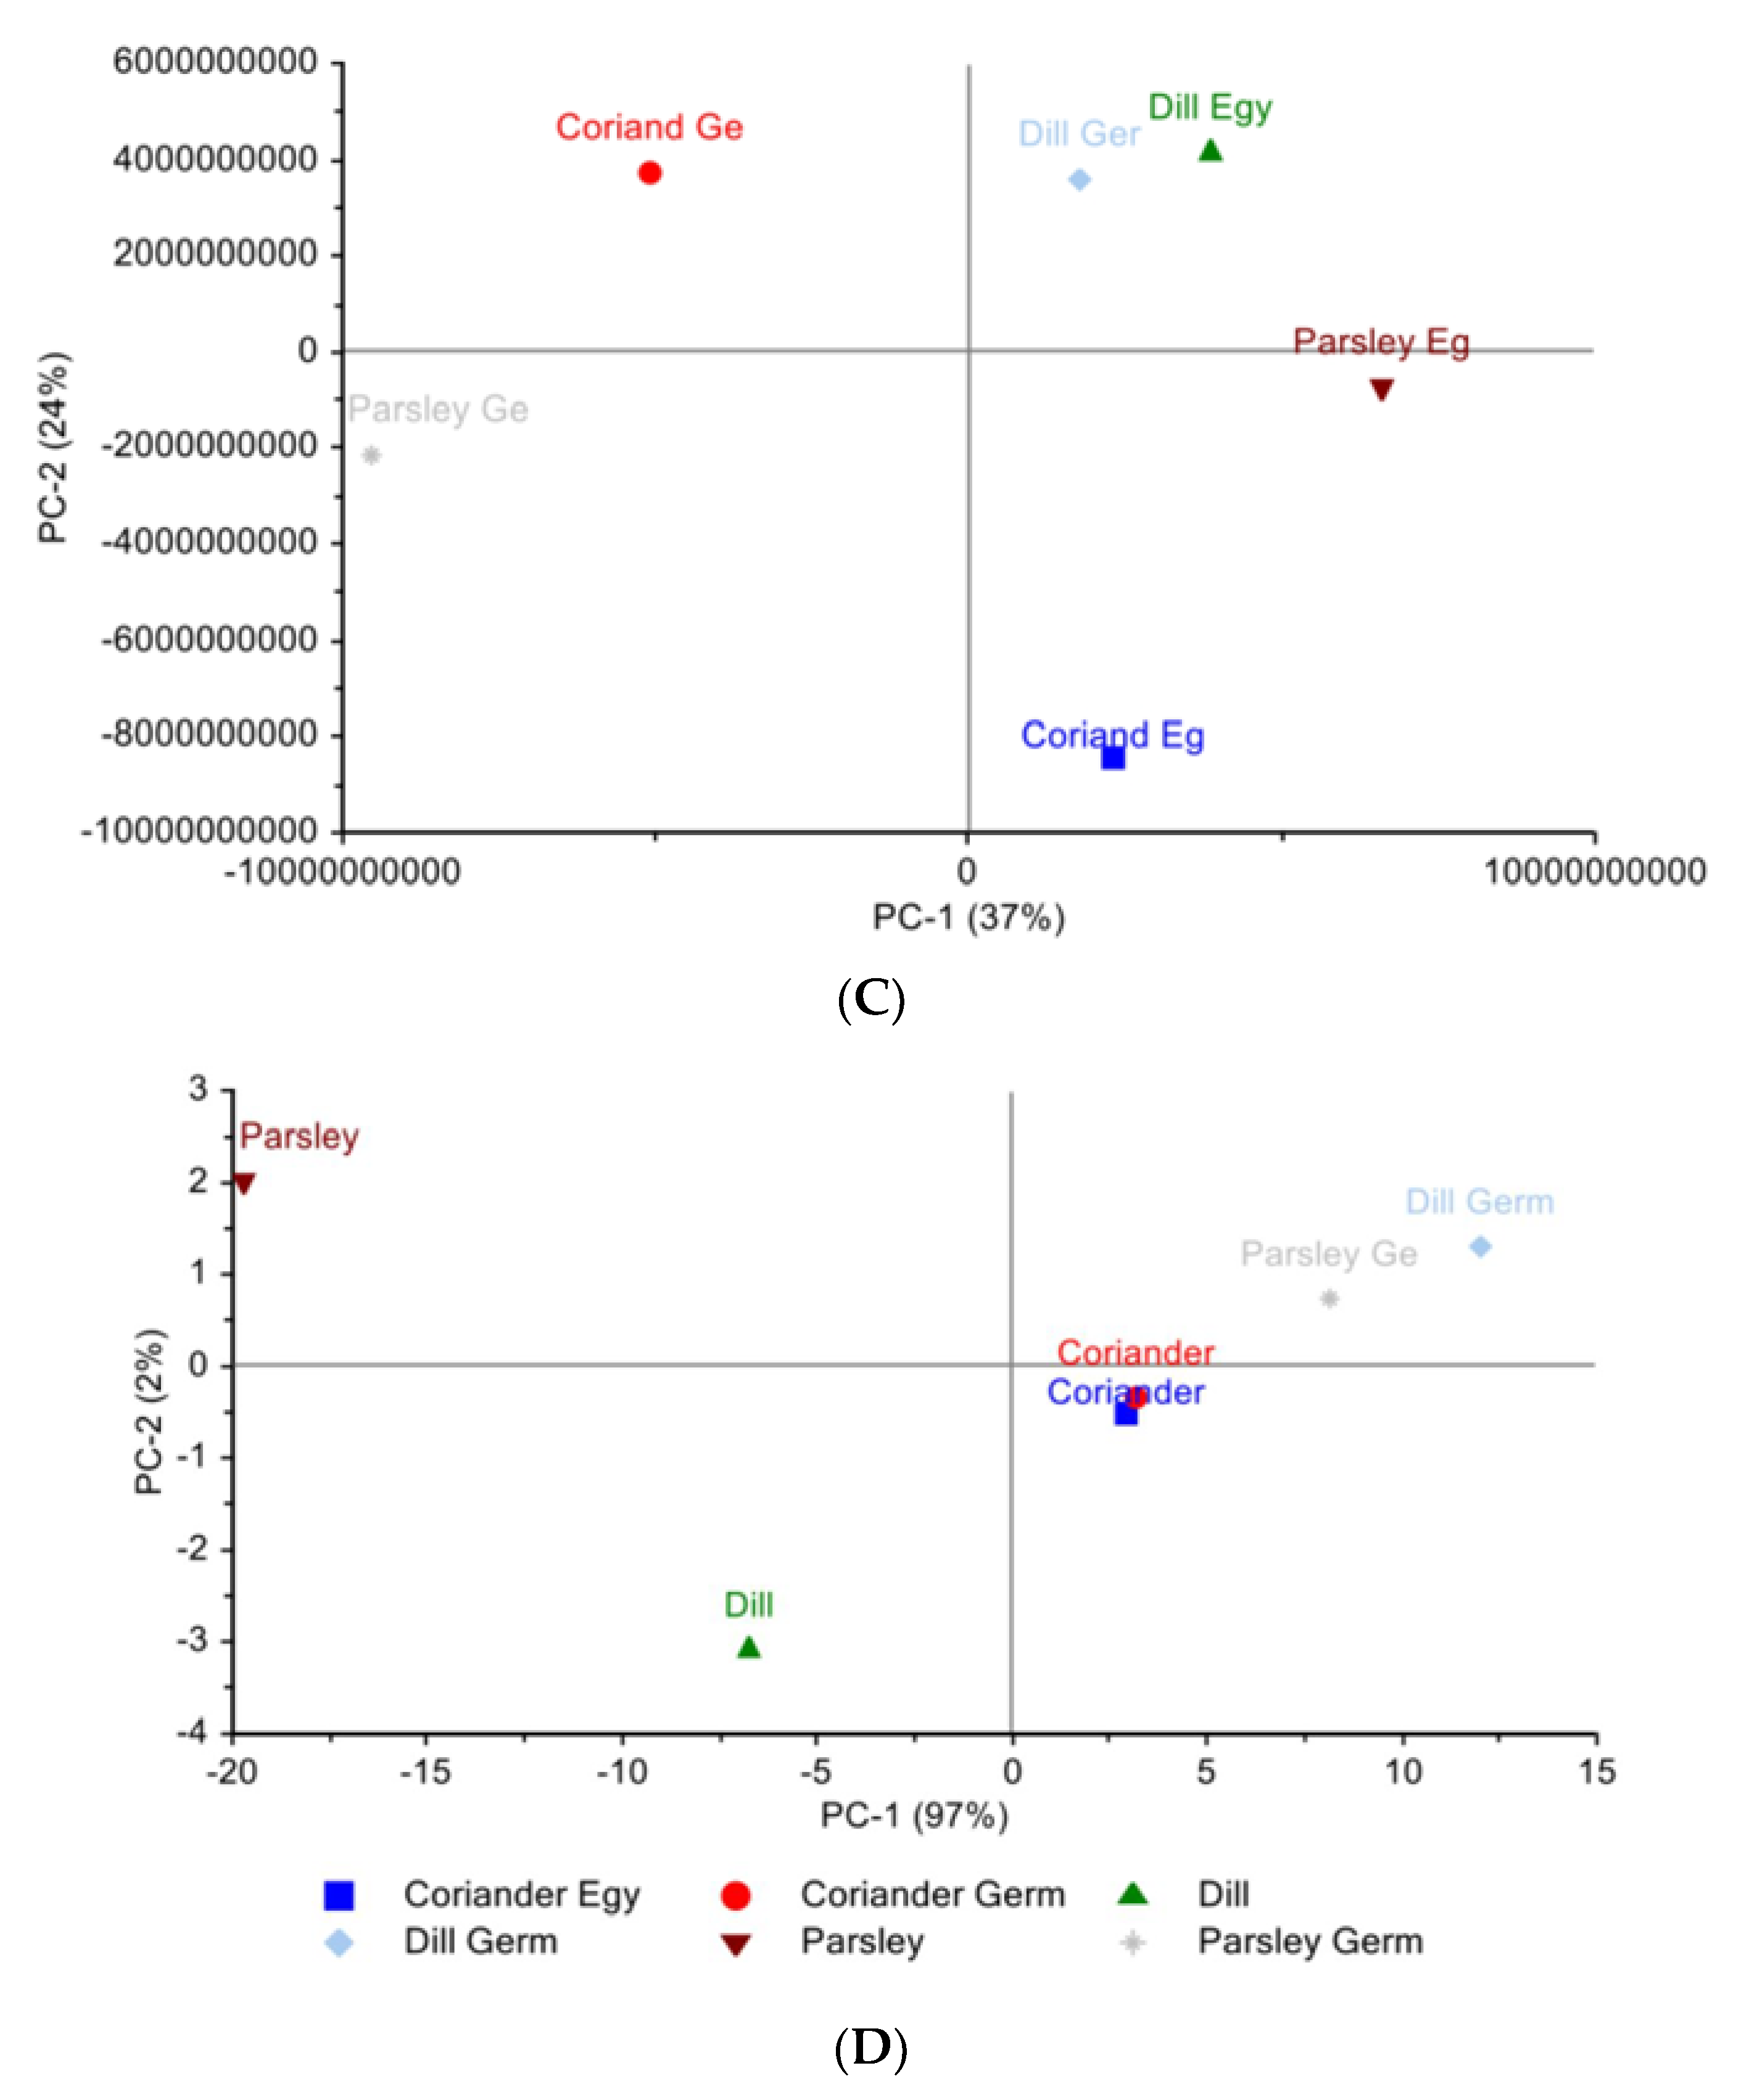
3.3.1. Principal Component Analysis
Egyptian Cultivar
Egyptian and German Cultivar
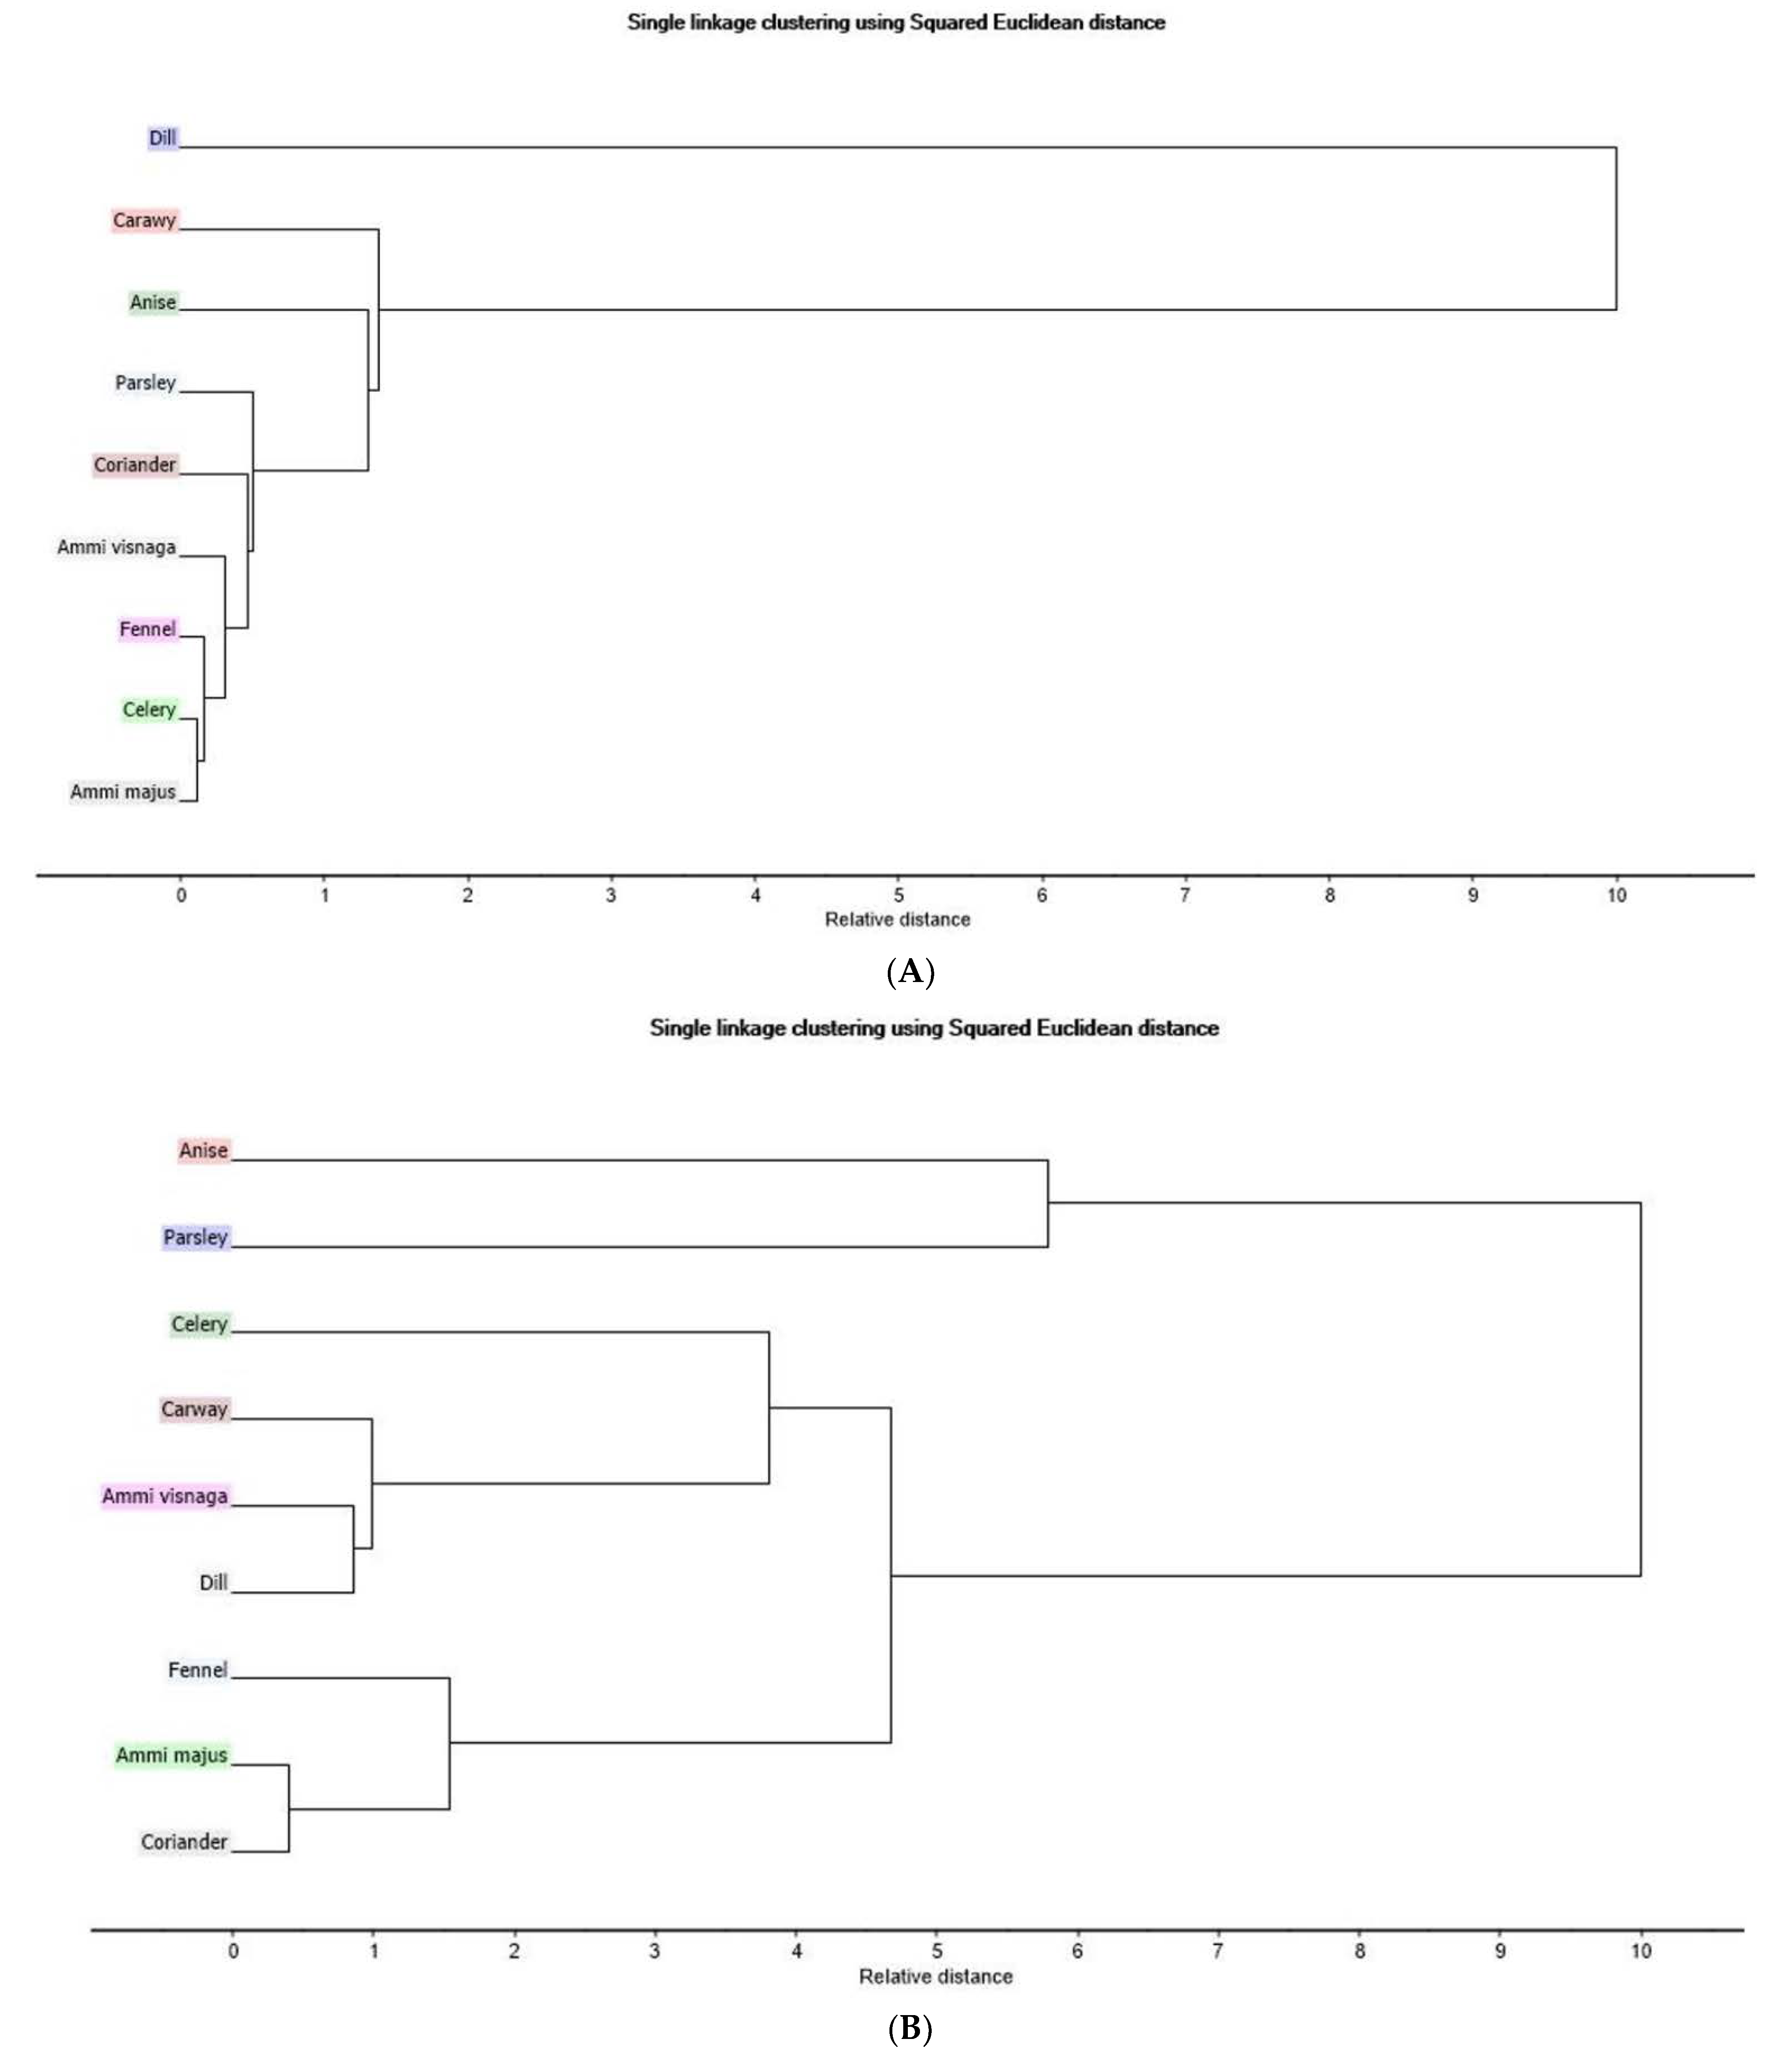
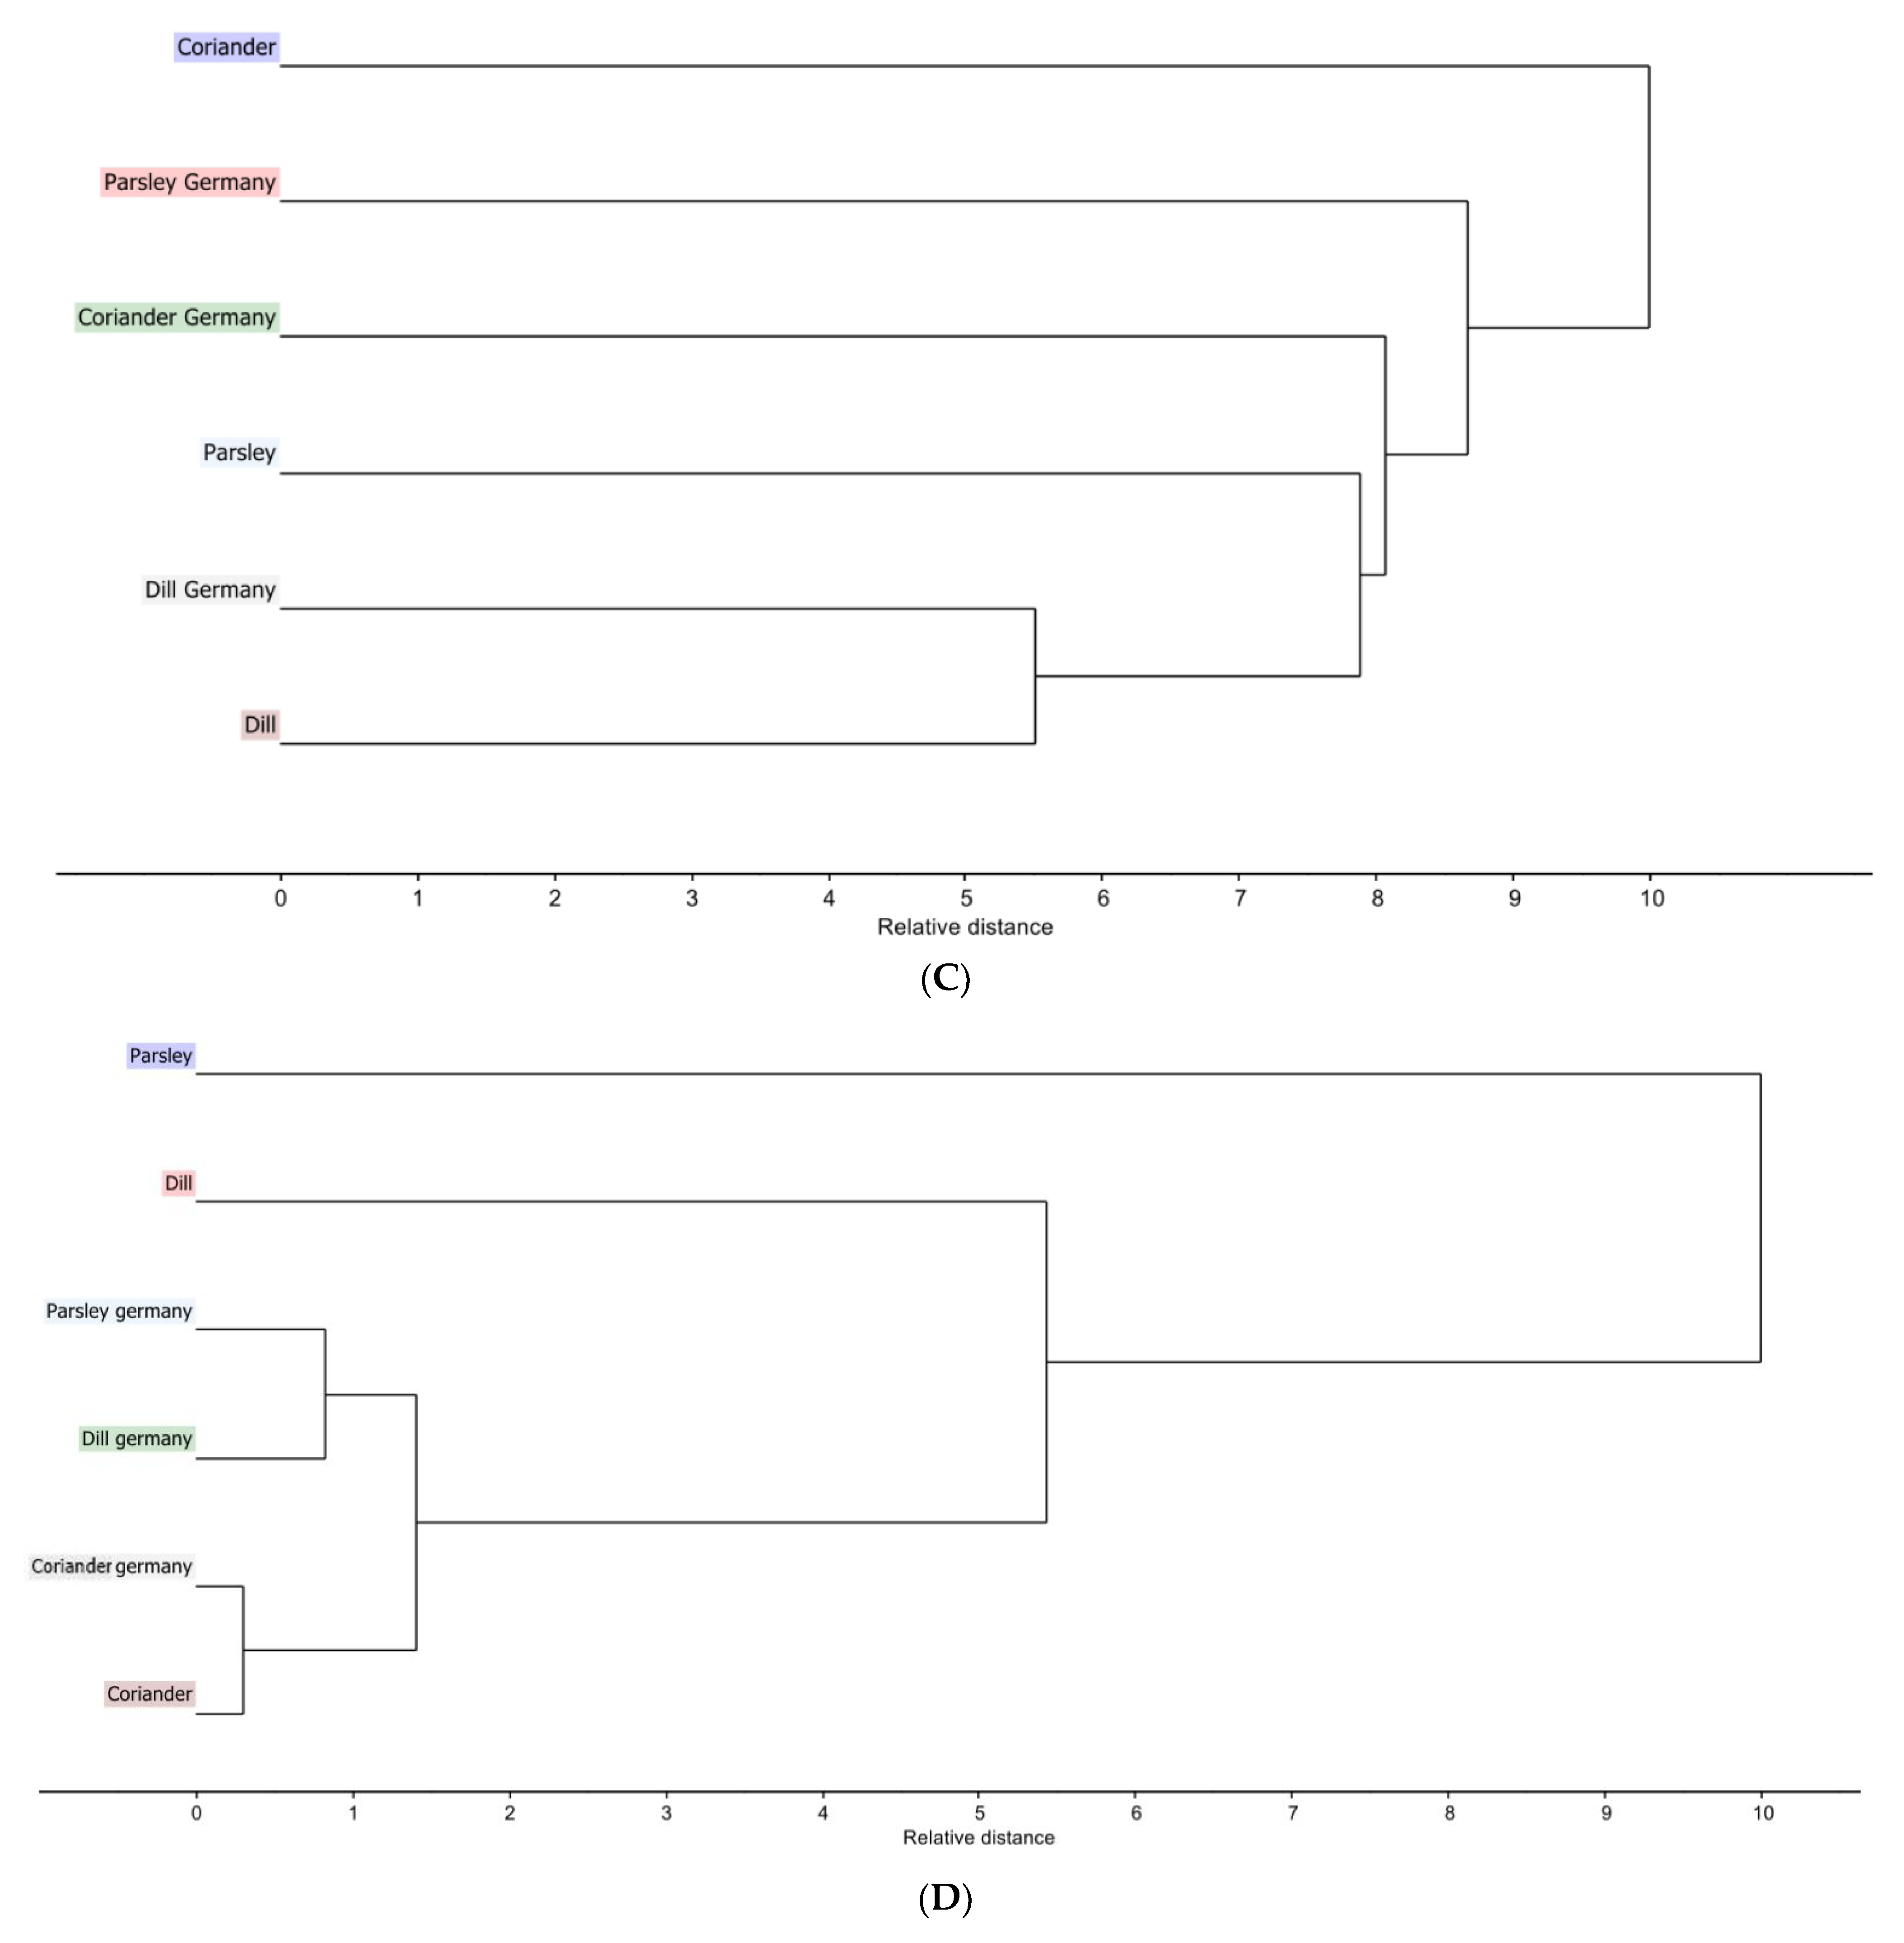
3.3.2. Hierarchical Cluster Analysis
Egyptian Cultivar
Egyptian and German Cultivars
3.3.3. Partial Least Square Regression
Egyptian Cultivar
Egyptian Cultivar versus German Cultivar
3.4. Evaluation of In-Vitro Assays of Extracts Using One-Way ANOVA
4. Discussion
5. Conclusions
Supplementary Materials
Author Contributions
Funding
Data Availability Statement
Conflicts of Interest
References
- Vandeginste, B. i-Chemometrics. J. Chemom. 2015, 29, 435–441. [Google Scholar] [CrossRef]
- Martens, H. Quantitative Big Data: Where chemometrics can contribute. J. Chemom. 2015, 29, 563–581. [Google Scholar] [CrossRef]
- Cuadros-Rodríguez, L.; Ruiz-Samblás, C.; Valverde-Som, L.; Pérez-Castaño, E.; González-Casado, A. Chromatographic fingerprinting: An innovative approach for food “identitation” and food authenticatione—A tutorial. Anal. Chim. Acta 2016, 909, 9–23. [Google Scholar] [CrossRef] [PubMed]
- Yongyu, Z.; Shujun, S.; Jianye, D.; Wenyu, W.; Huijuan, C.; Jianbing, W.; Xiaojun, G. Quality Control Method for Herbal Medicine—Chemical Fingerprint Analysis. In Quality Control of Herbal Medicines and Related Areas; Shoyama, Y., Ed.; IntechOpen Limited: London, UK, 2011; pp. 171–194. [Google Scholar] [CrossRef]
- Kharbach, M.; Marmouzi, I.; El Jemli, M.; Bouklouze, A.; Vander Heyden, Y. Recent advances in untargeted and targeted approaches applied in herbal-extracts and essential-oils fingerprinting—A review. J. Pharm. Biomed. Anal. 2020, 177, 112849. [Google Scholar] [CrossRef]
- Schulz, H. Analytical Techniques for medicinal and aromatic plant. Stewart Postharvest Rev. 2007, 4, 1–12. [Google Scholar] [CrossRef]
- Bhusnure, O.G.; Suryawanshi, S.; Vijayendra Swamy, S.M.; Gholve, S.B.; Girm, P.S.; Birajdar, M.J. Standardization and Quality Evaluation of Herbal Drugs. Drug Deliv. Ther. 2019, 9, 1058–1063. Available online: https://jddtonline.info/index.php/jddt/article/view/2941 (accessed on 19 April 2023).
- De Lima, M.D.; Barbosa, R. Methods of Authentication of Food Grown in Organic and Conventional Systems Using Chemometrics and Data Mining Algorithms: A Review. Food Anal. Methods 2019, 12, 887–901. [Google Scholar] [CrossRef]
- Rohman, A.; Putri, A.R. The chemometrics techniques in combination with instrumental analytical methods applied in Halal authentication analysis. Indones. J. Chem. 2019, 19, 262–272. [Google Scholar] [CrossRef]
- Rohman, A.; Nugroho, A.; Lukitaningsih, E.; Sudjadi. Application of Vibrational Spectroscopy in Combination with Chemometrics Techniques for Authentication of Herbal Medicine. Appl. Spectrosc. Rev. 2014, 49, 603–613. [Google Scholar] [CrossRef]
- Donno, D.; Boggia, R.; Zunin, P.; Cerutti, A.K.; Guido, M.; Mellano, M.G.; Prgomet, Z.; Beccaro, G.L. Phytochemical fingerprint and chemometrics for natural food preparation pattern recognition: An innovative technique in food supplement quality control. J. Food Sci. Technol. 2016, 53, 1071–1083. [Google Scholar] [CrossRef]
- Dhiman, A.; Sharma, K.; Sharma, A.; Sindhu, P. A review on the status of quality control and standardization of herbal drugs in India. Drug Dev. Ther. 2016, 7, 107–112. [Google Scholar] [CrossRef]
- Christensen, L.P.; Brandt, K. Bioactive polyacetylenes in food plants of the Apiaceae family: Occurrence, bioactivity and analysis. J. Pharm. Biomed. Anal. 2006, 41, 683–693. [Google Scholar] [CrossRef]
- Mushtaq, A.; Anwar, R.; Ahmad, M. Methanolic extract of Pimpinella anisum L. prevents dementia by reducing oxidative stress in neuronal pathways of hypermnesic mice. Pak. J. Zool. 2020, 52, 1779–1786. [Google Scholar] [CrossRef]
- Thiviya, P.; Gunawardena, N.; Gamage, A.; Madhujith, T.; Merah, O. Apiaceae Family as a Valuable Source of Biocidal Components and their Potential Uses in Agriculture. Horticulturae 2022, 8, 614. [Google Scholar] [CrossRef]
- Santos-Zea, L.; Villera-Castrejón, J.; Gutiérrez-Uribe, J. Bioactive Molecules in Food, 1st ed.; Merillon, J.-M., Ramawat, K.G., Eds.; Springer International Publishing: Berlin/Heidelberg, Germany, 2019. [Google Scholar]
- Li, M.Y.; Feng, K.; Hou, X.L.; Jiang, Q.; Xu, Z.S.; Wang, G.L.; Liu, J.X.; Wang, F.; Xiong, A.S. The genome sequence of celery (Apium graveolens L.), an important leaf vegetable crop rich in apigenin in the Apiaceae family. Hortic. Res. 2020, 7, 9. [Google Scholar] [CrossRef]
- Sayed-Ahmad, B.; Talou, T.; Saad, Z.; Hijazi, A.; Merah, O. Industrial Crops & Products The Apiaceae: Ethnomedicinal family as source for industrial uses. Ind. Crops Prod. 2017, 109, 661–671. [Google Scholar] [CrossRef]
- Vidal-Casanella, O.; Arias-Alpizar, K.; Nuñez, O.; Saurina, J. Hydrophilic interaction liquid chromatography to characterize nutraceuticals and food supplements based on flavanols and related compounds. Separations 2021, 8, 17. [Google Scholar] [CrossRef]
- Derouich, M.; Bouhlali, E.D.T.; Hmidani, A.; Bammou, M.; Bourkhis, B.; Sellam, K.; Alem, C. Assessment of total polyphenols, flavonoids and anti-inflammatory potential of three Apiaceae species grown in the Southeast of Morocco. Sci. Afr. 2020, 9, e00507. [Google Scholar] [CrossRef]
- Onder, A.; Izgi, M.N.; Cinar, A.S.; Zengin, G.; Yilmaz, M.A. The characterization of phenolic compounds via LC-ESI-MS/MS, antioxidant, enzyme inhibitory activities of Salvia absconditiflora, Salvia sclarea, and Salvia palaestina: A comparative analysis. S. Afr. J. Bot. 2022, 150, 313–322. [Google Scholar] [CrossRef]
- Semeniuc, C.A.; Socaciu, M.I.; Socaci, S.A.; Muresan, V.; Fogarasi, M.; Rotar, A.M. Chemometric comparison and classification of some essential oils extracted from plants belonging to Apiaceae and Lamiaceae families based on their chemical composition and biological activities. Molecules 2018, 23, 2261. [Google Scholar] [CrossRef]
- Abu Bakar, M.F.; Mohamed, M.; Rahmat, A.; Fry, J. Phytochemicals and antioxidant activity of different parts of bambangan (Mangifera pajang) and tarap (Artocarpus odoratissimus). Food Chem. 2009, 113, 479–483. [Google Scholar] [CrossRef]
- Aryal, S.; Baniya, M.K.; Danekhu, K.; Kunwar, P.; Gurung, R.; Koirala, N. Total Phenolic content, Flavonoid content and antioxidant potential of wild vegetables from western Nepal. Plants 2019, 8, 96. [Google Scholar] [CrossRef] [PubMed]
- Fredotović, Ž.; Puizina, J.; Nazlić, M.; Maravić, A.; Ljubenkov, I.; Soldo, B.; Vuko, E.; Bajić, D. Phytochemical characterization and screening of antioxidant, antimicrobial and antiproliferative properties of allium × cornutum clementi and two varieties of allium cepa l. Peel extracts. Plants 2021, 10, 832. [Google Scholar] [CrossRef] [PubMed]
- Köksal, E.; Gülçin, I.; Beyza, S.; Sarikaya, Ö.; Bursal, E. In vitro antioxidant activity of silymarin. J. Enzyme Inhib. Med. Chem. 2009, 24, 395–405. [Google Scholar] [CrossRef]
- Shahinuzzaman, M.; Yaakob, Z.; Anuar, F.H.; Akhtar, P.; Kadir, N.H.A.; Hasan, A.K.M.; Sobayel, K.; Nour, M.; Sindi, H.; Amin, N.; et al. In vitro antioxidant activity of Ficus carica L. latex from 18 different cultivars. Sci. Rep. 2020, 10, 10852. [Google Scholar] [CrossRef]
- Chaves, N.; Santiago, A.; Alías, J.C. Quantification of the antioxidant activity of plant extracts: Analysis of sensitivity and hierarchization based on the method used. Antioxidants 2020, 9, 76. [Google Scholar] [CrossRef]
- Armstrong, D. (Ed.) Advanced Protocols in Oxidative Stress I, 1st ed.; Humana: Totowa, NJ, USA, 2008. [Google Scholar] [CrossRef]
- Thiviya, P.; Gamage, A.; Piumali, D.; Merah, O.; Madhujith, T. Apiaceae as an important source of antioxidants and their applications. Cosmetics 2021, 8, 111. [Google Scholar] [CrossRef]
- Al-Snafi, A.E. Clinically tested medicinal plants View project Medical Education View project Phenolics and flavonoids contents of medicinal plants, as natural ingredients for many therapeutic purposes—A review. IOSR J. Pharm. 2020, 10, 42–81. [Google Scholar]
- Slimestad, R.; Fossen, T.; Brede, C. Flavonoids and other phenolics in herbs commonly used in Norwegian commercial kitchens. Food Chem. 2020, 309, 125678. [Google Scholar] [CrossRef]
- El-Zaeddi, H.; Calín-Sánchez, Á.; Nowicka, P.; Martínez-Tomé, J.; Noguera-Artiaga, L.; Burló, F.; Wojdyło, A.; Carbonell-Barrachina, Á.A. Preharvest treatments with malic, oxalic, and acetylsalicylic acids affect the phenolic composition and antioxidant capacity of coriander, dill and parsley. Food Chem. 2017, 226, 179–186. [Google Scholar] [CrossRef]
- Christova-Bagdassarian, V.L.; Bagdassarian, K.S.; Atanassova, M.S. Phenolic Profile, Antioxidant and Antibacterial Activities from the Apiaceae family (Dry Seeds). Mintage J. Pharm. Med. Sci. 2013, 2, 26–31. [Google Scholar]
- Enogieru, A.B.; Haylett, W.; Hiss, D.C.; Bardien, S.; Ekpo, O.E. Rutin as a potent antioxidant: Implications for neurodegenerative disorders. Oxid. Med. Cell. Longev. 2018, 2018, 6241017. [Google Scholar] [CrossRef]
- Riaz, A.; Rasul, A.; Hussain, G.; Zahoor, M.K.; Jabeen, F.; Subhani, Z.; Younis, T.; Ali, M.; Sarfraz, I.; Selamoglu, Z. Astragalin: A Bioactive Phytochemical with Potential Therapeutic Activities. Adv. Pharmacol. Sci. 2018, 2018, 9794625. [Google Scholar] [CrossRef]
- Wang, L.; Pan, X.; Jiang, L.; Chu, Y.; Gao, S.; Jiang, X.; Chen, Y. The Biological Activity Mechanism of Chlorogenic Acid and Its Applications in Food Industry: A Review. Front. Nutr. 2022, 9, 1943911. [Google Scholar] [CrossRef]
- Cisneros-zevallos, L.; Jacobo-vel, D.A. Chlorogenic Acid: Recent Advances on Its Dual Role as a Food Additive and a Nutraceutical. Molecules 2017, 22, 358. [Google Scholar] [CrossRef]
- Martins, F.; Mancini, J. In vivo antioxidant effect of aqueous and etheric coriander (Coriandrum sativum L.) extracts. Eur. J. Lipid Sci. Technol. 2003, 105, 483–487. [Google Scholar] [CrossRef]
- Fernandes, R.P.P.; Trindade, M.A.; Tonin, F.G.; Lima, C.G.; Pugine, S.M.P.; Munekata, P.E.S.; Lorenzo, J.M.; de Melo, M.P. Evaluation of antioxidant capacity of 13 plant extracts by three different methods: Cluster analyses applied for selection of the natural extracts with higher antioxidant capacity to replace synthetic antioxidant in lamb burgers. J. Food Sci. Technol. 2016, 53, 451–460. [Google Scholar] [CrossRef]
- Payne, A.C.; Mazzer, A.; Clarkson, G.J.J.; Taylor, G. Antioxidant assays—Consistent findings from FRAP and ORAC reveal a negative impact of organic cultivation on antioxidant potential in spinach but not watercress or rocket leaves. Food Sci. Nutr. 2013, 1, 439–444. [Google Scholar] [CrossRef]
- El-Sayed, M.M.; Metwally, N.H.; Ibrahim, I.A.; Abdel-Hady, H.; Abdel-Wahab, B.S.A. Antioxidant Activity, Total Phenolic and Flavonoid Contents of Petroselinum crispum Mill. J. Appl. Life Sci. Int. 2018, 19, 1–7. [Google Scholar] [CrossRef]
- Msaada, K.; Ben Jemia, M.; Salem, N.; Bachrouch, O.; Sriti, J.; Tammar, S.; Bettaieb, I.; Jabri, I.; Kefi, S.; Limam, F.; et al. Antioxidant activity of methanolic extracts from three coriander (Coriandrum sativum L.) fruit varieties. Arab. J. Chem. 2017, 10, S3176–S3183. [Google Scholar] [CrossRef]
- Din, Z.U.; Shad, A.A.; Bakht, J.; Ullah, I.; Jan, S. In vitro antimicrobial, antioxidant activity and phytochemical screening of Apium graveolens. Pak. J. Pharm. Sci. 2015, 28, 1699–1704. [Google Scholar]
- Asensio, E.; Vitales, D.; Peralba, L.; Viruel, J. Phenolic Compounds Content and Genetic Diversity at Population Level across the Natural Distribution. Plants 2020, 9, 1250. [Google Scholar] [CrossRef] [PubMed]


| Samples | TPC | TFC | DPPH | ABTS | FRAP | CUPRAC |
|---|---|---|---|---|---|---|
| Gallic Acid Equivalent Conc. (μg/mg) | Quercetin Equivalent Conc. (μg/mg) | % Scavenging | Quercetin Equivalent Conc. (μg/mg) | Ferrous Sulfate Equivalent Conc. (μg/mg) | BHA Equivalent Conc. (μg/mg) | |
| Coriander | 50.333 ± 16.03 | 13.623 ± 0.06 | 85.92 | 102.97 ± 0.63 | 197.035 ± 76.6 | 60.424 ± 5.7 |
| Coriander Germany | 67.806 ± 3.31 | 15.366 ± 0.02 | 55.01 | 52.67 ± 0.27 | 65.228 ± 21.5 | 6.259 ± 0.5 |
| Dill | 67.366 ± 6.36 | 11.706 ± 0.02 | 90.22 | 74.67 ± 0.88 | 141.895 ± 23.1 | 36.722 ± 0.8 |
| Dill Germany | 46.043 ± 1.45 | 13.405 ± 0.01 | 90.47 | 70.56 ± 0.38 | 76.105 ± 53.6 | 24.847 ± 2.9 |
| Parsley | 52.677 ± 3.46 | 12.599 ± 0.01 | 69.25 | 51.31 ± 1.53 | 61.737 ± 58.6 | 22.596 ± 2.3 |
| Parsley Germany | 62.151 ± 1.08 | 20.203 ± 0.01 | 65.77 | 68.04 ± 1.04 | 82.649 ± 34.4 | 28.094 ± 8.5 |
| Carawy | 110.226 ± 28.05 | 28.307 ± 0.04 | 89.21 | 65.06 ± 0.58 | 318.965 ± 33.4 | 89.333 ± 14.4 |
| Ammi majus | 160.731 ± 4.42 | 32.904 ± 0.12 | 89.44 | 46.78 ± 0.91 | 235.789 ± 86.2 | 37.741 ± 4.2 |
| Fennel | 97.742 ± 14.75 | 22.599 ± 0.03 | 90.31 | 80.83 ± 1.08 | 283.421 ± 14.1 | 100.769 ± 6.9 |
| Anise | 74.634 ± 6.21 | 18.852 ± 0.02 | 91.60 | 86.31 ± 1.37 | 359.912 ± 36.2 | 98.290 ± 4.9 |
| Celery | 75.763 ± 8.10 | 22.730 ± 0.02 | 90.22 | 33.86 ± 0.36 | 30.737 ± 59.8 | 42.165 ± 2.7 |
| Visnaga | 91.043 ± 3.15 | 22.359 ± 0.002 | 91.42 | 69.97 ± 1.11 | 405.965 ± 15.7 | 60.753 ± 5.2 |
Disclaimer/Publisher’s Note: The statements, opinions and data contained in all publications are solely those of the individual author(s) and contributor(s) and not of MDPI and/or the editor(s). MDPI and/or the editor(s) disclaim responsibility for any injury to people or property resulting from any ideas, methods, instructions or products referred to in the content. |
© 2023 by the authors. Licensee MDPI, Basel, Switzerland. This article is an open access article distributed under the terms and conditions of the Creative Commons Attribution (CC BY) license (https://creativecommons.org/licenses/by/4.0/).
Share and Cite
Atta, N.H.; Handoussa, H.; Klaiber, I.; Hitzmann, B.; Hanafi, R.S. Chemometric Approach for Profiling of Metabolites of Potential Antioxidant Activity in Apiaceae Species Based on LC-PDA-ESI-MS/MS and FT-NIR. Separations 2023, 10, 347. https://doi.org/10.3390/separations10060347
Atta NH, Handoussa H, Klaiber I, Hitzmann B, Hanafi RS. Chemometric Approach for Profiling of Metabolites of Potential Antioxidant Activity in Apiaceae Species Based on LC-PDA-ESI-MS/MS and FT-NIR. Separations. 2023; 10(6):347. https://doi.org/10.3390/separations10060347
Chicago/Turabian StyleAtta, Noha H., Heba Handoussa, Iris Klaiber, Bernd Hitzmann, and Rasha S. Hanafi. 2023. "Chemometric Approach for Profiling of Metabolites of Potential Antioxidant Activity in Apiaceae Species Based on LC-PDA-ESI-MS/MS and FT-NIR" Separations 10, no. 6: 347. https://doi.org/10.3390/separations10060347
APA StyleAtta, N. H., Handoussa, H., Klaiber, I., Hitzmann, B., & Hanafi, R. S. (2023). Chemometric Approach for Profiling of Metabolites of Potential Antioxidant Activity in Apiaceae Species Based on LC-PDA-ESI-MS/MS and FT-NIR. Separations, 10(6), 347. https://doi.org/10.3390/separations10060347