Article

Multivariate Simultaneous Determination of Some PAHs in Persian Gulf Oil-Contaminated Algae and Water Samples Using Miniaturized Triton X-100-Mediated Fe3O4 Nanoadsorbent and UV-Vis Detection

by
Maryam Abbasi Tarighat
1,*,
Ameneh Behroozi
1,
Gholamreza Abdi
2 and
Charalampos Proestos
3,*
1
Faculty of Nano and Bio Science and Technology, Persian Gulf University, Bushehr 75169, Iran
2
Department of Biotechnology, Persian Gulf Research Institute, Persian Gulf University, Bushehr 75169, Iran
3
Laboratory of Food Chemistry, Department of Chemistry, National and Kapodistrian University of Athens, 157 84 Athens, Greece
*
Authors to whom correspondence should be addressed.
Separations 2023, 10(6), 334; https://doi.org/10.3390/separations10060334
Submission received: 24 April 2023 / Revised: 12 May 2023 / Accepted: 19 May 2023 / Published: 29 May 2023

Abstract

:
This research shows the development of a miniaturized solid-phase extraction method with UV-Vis detection for simultaneous determination of dibenzofuran, fluoranthene and phenanthrene using chemometrics approaches. After synthesis of Fe3O4 nanoparticles (Fe3O4 NPs), the surface of the nanoparticles was modified by Triton X100 coating. The influence of extraction solvent and volume, concentration of Triton X100, extraction time, and sample pH were studied and optimized. Due to high spectral overlapping, resolving ternary mixtures for simultaneous determination of targets with classical analytical methods is impossible. Therefore, the recorded UV-Vis spectra were transformed using continuous wavelet transform and then subjected to artificial neural networks (ANNs). The Db4 mother wavelet was used as the better mother wavelet. For simultaneous detection of analytes, a comparison of feed-forward back-propagation and radial basis function networks was accomplished. The calibration graphs showed linearity in the ranges of 2.4–250 ng mL−1, 50–3750 ng mL−1, and 48–5000 ng mL−1 with a limit of detection of 0.58, 9.5 ng mL−1, and 12.5 ng mL−1 under optimal conditions for phenanthrene, fluoranthene, and dibenzofuran, respectively. The limit of quantitation was achieved at 3.52 ng mL−1, 16.35 ng mL−1, and 31.3 ng mL−1 for phenanthrene, fluoranthene and dibenzofuran, respectively. The method involving TX-100-coated Fe3O4 NPs in a liquid sample phase for analyte extraction, followed by ethanol desorption and UV-Vis detection, was successfully applied for the determination of polycyclic aromatic hydrocarbons in oil-field water and algae samples.

1. Introduction

Polycyclic aromatic hydrocarbons (PAHs) are organic pollutants that consist of two or more fused aromatic rings. These compounds are highly toxic and carcinogenic to humans, aquatic life, and wildlife. Due to their chemical–physical properties, PAHs can easily be transported through the atmosphere and subsequently leached into groundwater. Once leached, they can penetrate and adsorb into soil and plant products. As a result, PAHs can enter the food chain and bioaccumulate in human tissues through the consumption of plant products. This phenomenon poses a significant risk to human health [1,2,3].
PAHs originate from both natural and man-made sources. However, petroleum industries have a significant impact on the production of these compounds, as they are major producers of hydrocarbons, including PAHs. The proximity of the polluted location to the production source, the amount of industrial growth and the mode(s) of PAH transport all influence PAH concentrations in the environment [4].
The solubility of these compounds in water is low, and trace levels of PAH compounds are typically found in real samples. Therefore, sample preparation is necessary to enhance the sensitivity and selectivity of their measurements via pre-concentration and removing matrix-interfering species [4,5]. For this purpose, several pre-concentration methodologies have been applied, such as liquid–liquid extraction [1], solid-phase extraction [6,7], solid-phase microextraction [8,9], dispersive solid-phase extraction [5], ultrasound-assisted emulsification microextraction [10], stir-bar sorptive extraction [11], dispersive liquid–liquid microextraction–dispersive solid-phase extraction, and rotating [12,13] disk sorptive extraction [14].
Chromatographic methods have been commonly used for the determination of PAHs after the pre-concentration procedure. High-performance liquid chromatography with fluorescence detection [14,15], with diode array detector [10], or mass spectrometry detection [16], and tandem MS or gas chromatography (GC) with MS detection [17], have been proposed for the determination of PAHs in various samples.
HPLC methods are more suitable for analyzing thermally labile or low volatile compounds. However, determining satisfactory separation conditions for the analysis of PAHs in water using HPLC remains a major challenge. The significant drawback of HPLC is the substantial consumption of toxic solvents during the separation process. It is important to note that reducing reagent consumption may lead to increased overlap of peaks. In order to find suitable separation conditions, the careful selection of mobile phase composition, column temperature, and type of stationary phase is necessary. It is important to note that due to the limited peak capacity of its columns, HPLC can only identify a few dozen components. As a result, gas chromatography is preferred over liquid chromatography for the identification of PAHs in water samples due to its simplicity, selectivity, resolution, and sensitivity. Gas chromatography–mass spectrometry (GC-MS) is commonly used for the easy detection of PAHs. Factors such as solvent type, solvent effects, injection conditions, and potential analyte loss during sample separation can impact the separation of PAHs using the GC technique.
While GC/MS is known for its high accuracy and sensitivity, it is also costly in terms of equipment, making it inaccessible to all laboratories and consumers [6,18].
Nanomaterials possess a large surface area and a short diffusion path, resulting in enhanced extraction efficiency and faster extraction dynamics compared to conventional SPE adsorbents. Recently, considerable attention has been given to the applications of various magnetic nanoparticles as SPE sorbents for the determination of different components [6]. Magnetic nanoparticles have received particular interest among the adsorbents due to their ease of synthesis, small size, large surface area, and ease of isolation and regeneration from solutions under a magnetic field [19]. Additionally, diverse functional layers, such as polymers, hydroxyapatite, chitosan, starch, and silica, have been incorporated onto magnetic adsorbents to improve adsorption performance and binding [20,21].
The fabrication of coating involves multistage tedious and time-consuming synthesis techniques. Therefore, the use of readily available and inexpensive sorption agents for effective pretreatment of sorbents has been considered. Magnetic nanoparticles (MNPs) can be coated with surfactants to prevent their aggregation in the solution and improve chemical stability of them. Coating the surfaces with a surfactant layer can induce repulsive interactions between particles. Furthermore, surfactant coating of Fe3O4 MNPs is a quick and easy process that can be performed directly in solution. TX-100, a nonionic surfactant with a hydrophilic polyethylene oxide chain and a hydrophobic phenyl group, has long been recognized for its ability to improve colloid stability in bioanalytical chemistry [22].
In the presence of various chemical interfering species, the determination of trace levels of PAHs is challenging, even though simultaneous determination of PAHs is important due to their physicochemical and hazardous effects [22]. Multivariate chemometric approaches have significantly enhanced the quantitative determinations using spectrophotometric data. Various chemometric approaches have been employed to quantify PAHs, including principal component analysis [23], partial least-squares (PLS) [24], extended derivative ratio method [24], parallel factor analysis (PARAFAC) [25], unfolded partial least-squares [25], projection pursuit regression [19], and multivariate curve resolution–alternating least squares (MCR-ALS) using excitation–emission matrix (EEM) fluorescence spectroscopy or diode array data [26]. EEM has a lack of selectivity and a poor detection limit, larger than ng mL−1 in complex matrices. Additionally, the applied instrument is expensive and is not available in most laboratories. Spectrophotometric methods have several advantages, including popularity, availability of instrumentation, wide applicability, good precision, and acceptable accuracy [20,27,28,29,30,31,32,33,34,35]. These methods, however, are only appropriate when nonlinearity is not present in the multivariate data. Nonlinear modeling techniques such as artificial neural networks have been applied to solve these problems [30,36]. Crude oil can be categorized as either light or heavy based on the presence of specific hydrocarbon compounds. Heavy crude oil has been found to have greater environmental impacts compared to light crude oil. The Persian Gulf is recognized as a unique marine ecosystem with abundant oil and gas resources, making it vulnerable to oil pollution. Oil pollution can cause significant harm to marine ecosystems and coastal areas. Organic chemical compounds, such as PAHs, pose health risks to humans and aquatic life in the marine environment. Therefore, studying oil hydrocarbon pollution and evaluating the ecological risk, particularly of PAHs, in the Persian Gulf is of great importance. Given the toxicity and adverse effects of PAHs, accurate determination of these compounds at trace levels has gained significant attention in various research areas. Hence, in this study, a novel preconcentration–spectrophotometric approach for simultaneous determination of PAHs was developed using chemometrics techniques. Since an analytical method with appropriate sensitivity and low detection limits is essential, the possibility of TX-100-coated Fe3O4 MNPs as a miniaturized SPE adsorbent for preconcentration and the sensitive determination was established. Continuous wavelet transformation (CWT) was applied to uncover hidden information in the UV-Vis spectra of targets prior to ANN modeling. This approach enhanced the predictive ability of models. The comparison of the results showed that the outcome of the radial basis function networks (CWT-RBFNs) method was better than that of the CWT–feed-forward neural networks (CWT-FFNNs) model. The proposed powerful, low-cost, quick, and easy-to-use method was also utilized for the simultaneous spectrophotometric determination of PAHs of interest in the Persian Gulf oil-field water and macro algae samples. The satisfactory obtained results demonstrate the ability of the developed method.

2. Materials and Methods

2.1. Reagents and Samples

All chemicals were of at least analytical reagent grade. Dibenzofuran (DBF), fluoranthene (FLU), phenanthrene (PHE), and ethanol were supplied by Sigma-Aldrich (Steinheim, Germany). Triton X 100(TX-100), NaOH, FeCl3.6H2O, FeCl2.4H2O, ammonia solution, nitric acid, acetonitrile, acetone, n-hexane, and hydrochloric acid were purchased from Merck (Darmstadt, Germany). Deionized water (DI water) was used whenever required. The electrolyte was composed of 0.1 mol L−1 acetic acid–sodium acetate (pH 3 to 5), Na2HPO4 and NaH2PO4 (pH 6–10), and ammonium–ammonium chloride (pH 11–12). The PAH standard stock solutions were prepared in methanol at a concentration of 150 mg mL−1. The prepared stock samples were kept at 4 °C in darkness. Sea water and algae samples were collected from the Iranian coasts of the Persian Gulf, Bushehr.
Water samples were collected from Forouzan oil field, Persian Gulf, and the water desalination area of Genaveh. Padina and Hypnea algae were gathered from the oil field of Kharg and Genaveh, respectively. The marine algae were collected inside a polyethylene bag and quickly brought to the laboratory. The algae samples were washed using tap water and distilled water to remove inessential materials. They were shade-dried for one week to completely remove moisture content. Additionally, the powdered samples were oven-dried at 60 °C to prevent any fungal contamination. An electric mixer was used to grind the dried samples, and the resulting powder was stored at 5 °C for future use.

2.2. Instrumentation and Software

UV-Vis spectra were measured using a double-beam Analytica Jena spectrophotometer. The spectra were taken with a 1.0 cm quartz cell, a 100 nm min−1 scan rate, and a 2.0 mm slit width. One data point per nanometer was used to digitize the recorded spectra. For pH measurements, a Swiss Metrohm model 713 pH/mV meter was employed. Scanning electron microscopy (SEM–EDX, XL30, Philips, Eindhoven, The Netherlands) was used to examine the nanocomposite micrographs. Images were taken using a Zeiss-EM10C electron microscope at an accelerating voltage of 80 kV. The nanocomposite micrographs were examined using scanning electron microscopy (SEM–EDX, XL30, Philips, Eindhoven, The Netherlands). At an accelerating voltage of 80 kV, the image was acquired with a Zeiss-EM10C electron microscope. MATLAB software was used to perform the calculations (version 7.8, MathWorks, Natick, MA, USA).

2.3. Preparations of Fe3O4/TX-100 Nanocomposite

In 50 mL of deionized water, 5.2 g of FeCl3.6H2O and 2.0 g of FeCl2.4H2O were dissolved. After that, nitrogen gas was injected into the solution. Then, the solution was maintained in an oven for 15 min at 80 °C. Subsequently, 10 mL of concentrated NaOH was gradually added to the solution using a dropping funnel. After 15 min, the pure black solid product was developed and separated using an external magnet. The Fe3O4 NPs were washed with distillated water and finally dried at 70 °C.
For nanoparticle functionalization, 100 mL of TX-100 (20% v/v) was added to the solutions and held at room temperature to generate surfactant-rich phases. The TX-100 surfactant-rich phase was dripped into a thin layer of 50 mg Fe3O4 NPs. To ensure proper adsorption of the surfactant molecules on the surface of the solid sorbent, the suspension was allowed to stand at room temperature for 12 h. Subsequently, the Fe3O4/TX-100 NCs were filtered and washed several times with deionized water to remove the non-adsorbed surfactant on the surface of the nanomaterials. Finally, the nanocomposites were dried at 40 °C for 10 h.

2.4. General Procedure

To preconcentrate PAHs, known aliquots were placed in conical bottom vials, and the pH of the solution was corrected to the optimal value (pH 8.0). Next, 50 mg Fe3O4/TX-100 NPs were added to the vials and the solutions were centrifuged at 4000 rpm for 10 min to disperse the mixtures. The aqueous solution was removed and 2 mL ethanol was added to the surfactant-rich phase. The Fe3O4 NPs were removed with an external magnet, solutions were transferred to the quartz cell, and spectra were recorded during 200–500 nm.

2.5. Theory of CWT

The wavelet transform implies the breakdown of a signal function or vector into basic and fixed structures at various scales and locations. To achieve this objective, many algorithms have been developed [27,37]. Grossman et al. developed the CWT in 1985, enabling the decomposition of a signal into components from the space and scale domains based on translation and dilation [32]. One of the key characteristics of the CWT is the ability to directly divide frequency domain distribution of the signal in the time domain. Furthermore, it has no effect on the signal information. It is a suitable tool for the investigation of non-stationery and fractal signals due to its capacity to zoom in on singularities. Consequently, CWTs are very useful in resolving problems concerning signal identification and finding hidden transient and hard-to-detect signals [38]. The CWT of a continuous signal X(t) is defined using translation (m) and scaling factors(s) as follows:
W T s , m = + X t ψ s , m * t d t
When the mother wavelet was operated by ψ (λ), ψa,b represented a set of functions and was obtained as:
ψ s , m t = 1 m ψ t s m

3. Results

The SPE was proposed for pre-concentration of selected PAHs. The main experimental parameters were optimized. To evaluate experimental condition influences, a fixed concentration of 200 ng mL−1 of analytes was used.

3.1. Optimization of Extraction Conditions

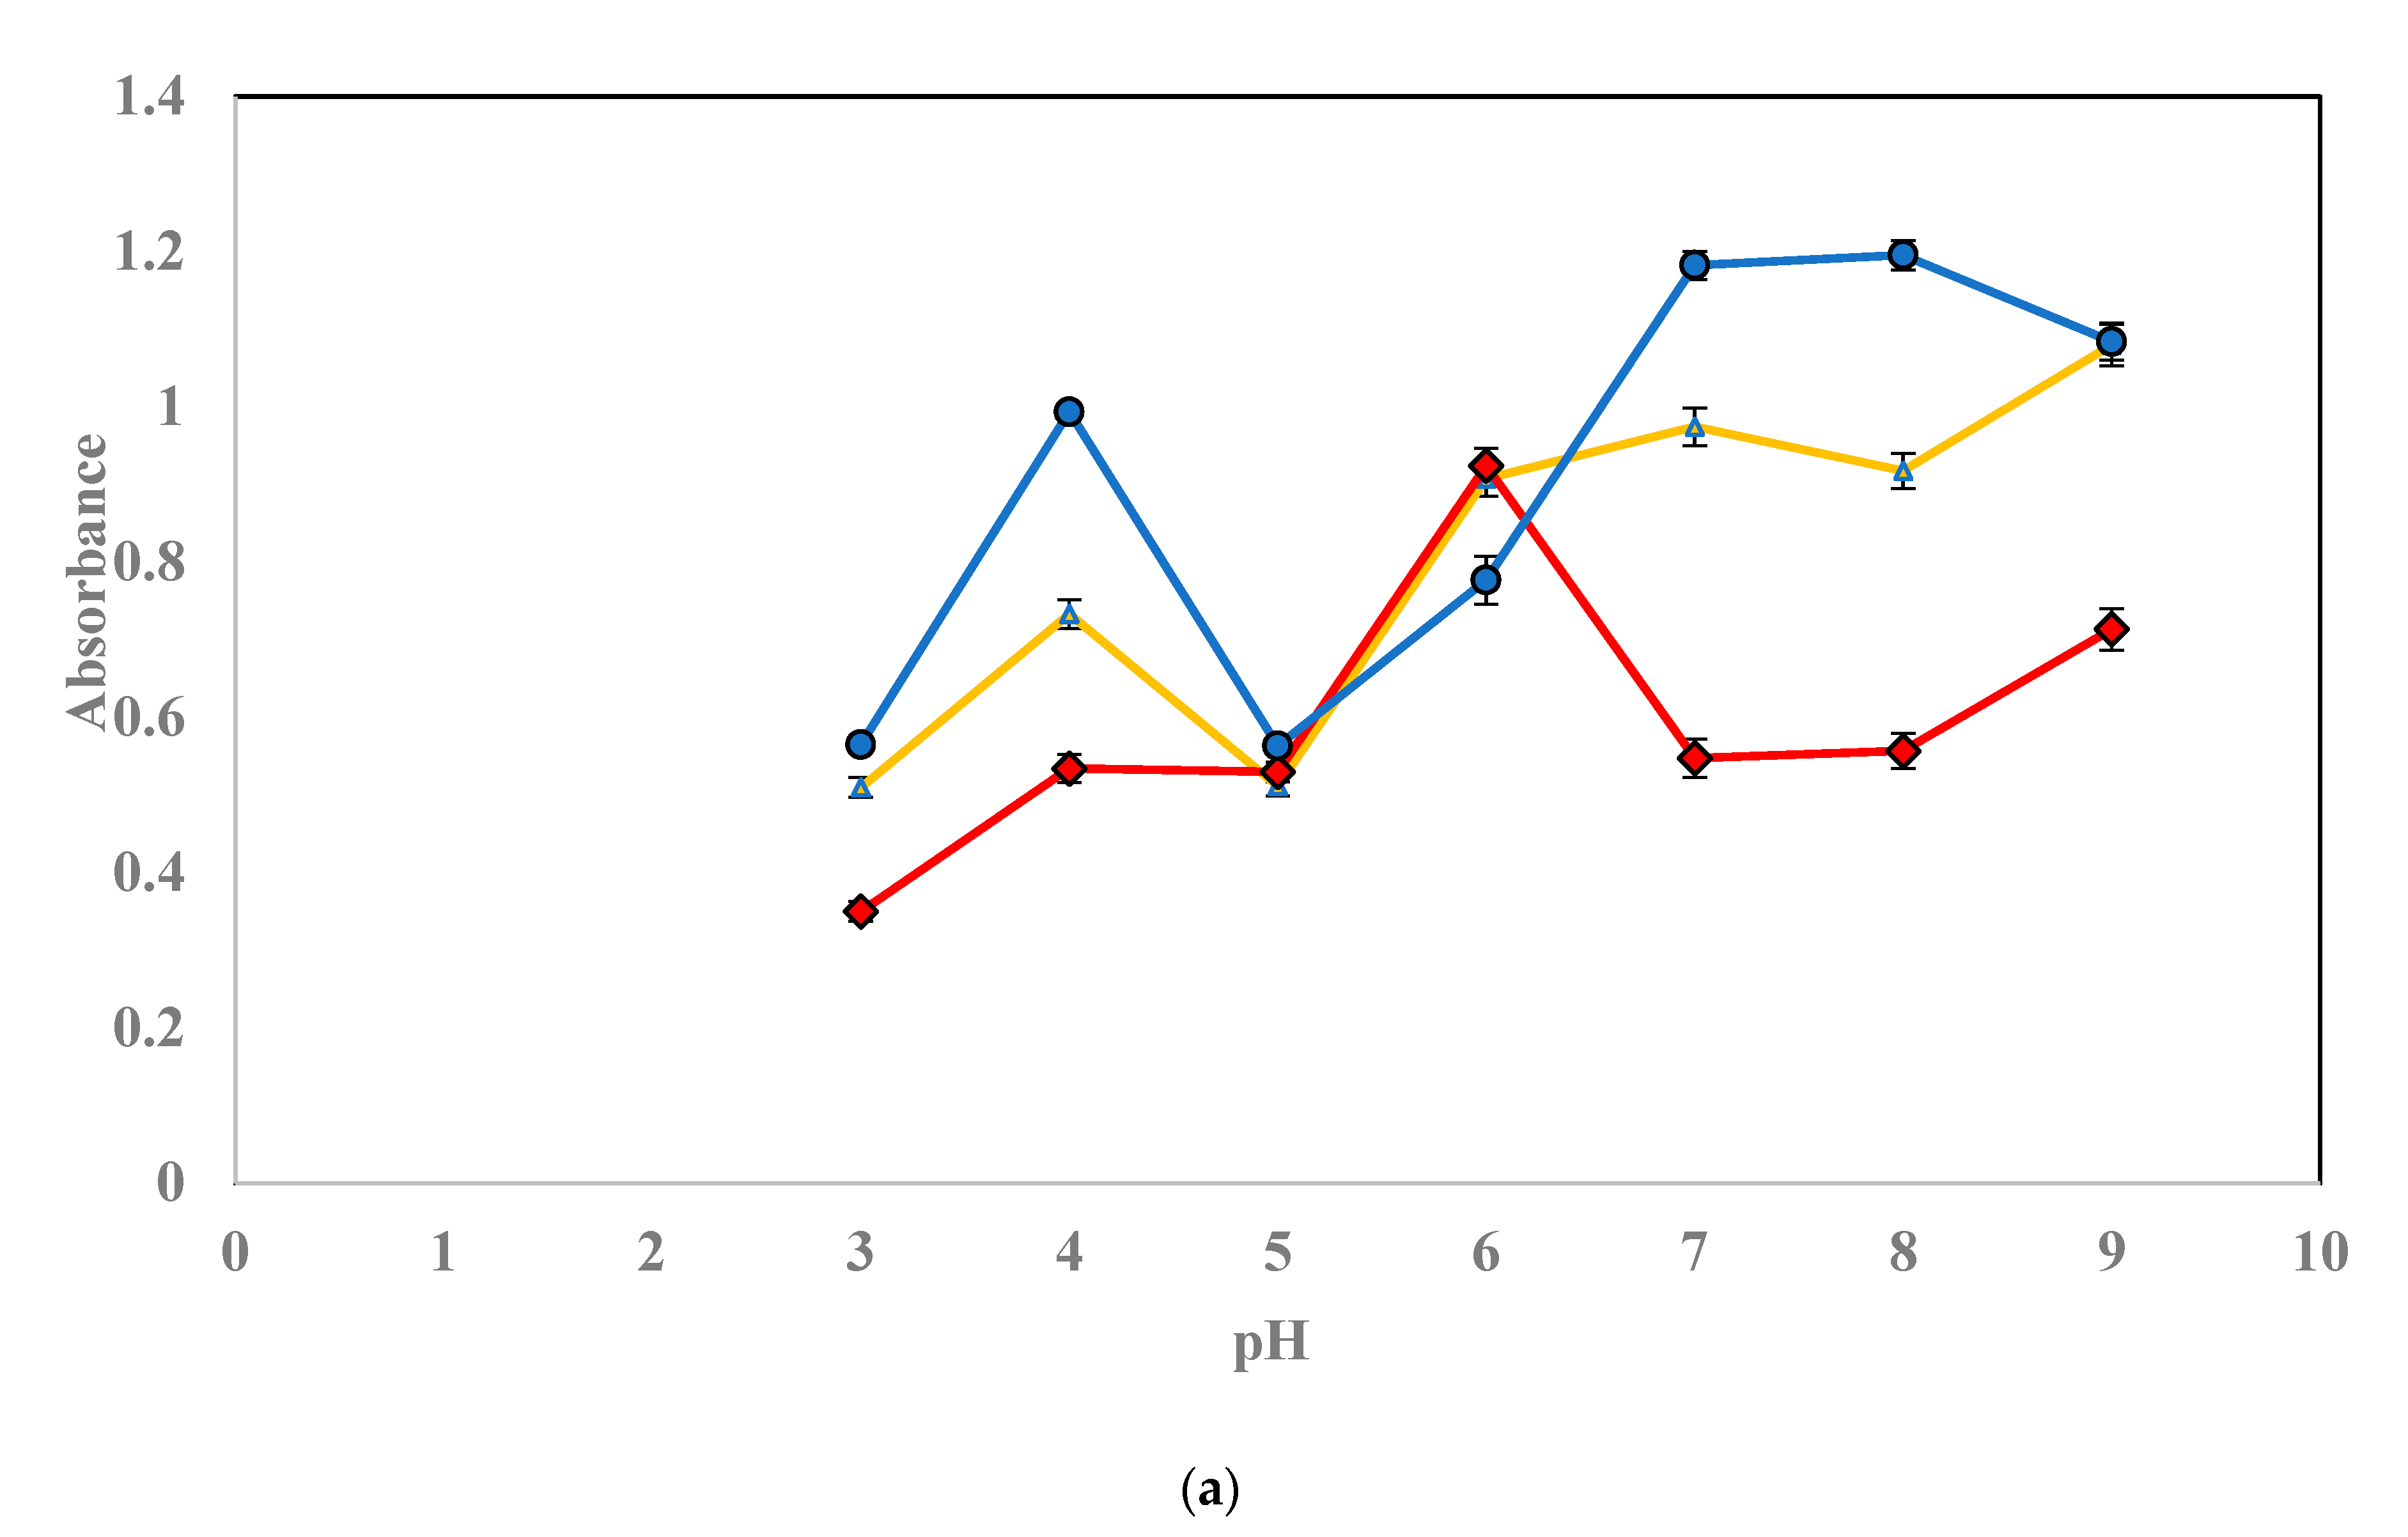
3.1.1. Influence of pH

The effect of sample pH on adsorption of PAHs on TX-100- Fe3O4 NPs was evaluated. The change in absorbance at maximum wavelengths of PAHs was considered using buffer solutions at pH values of 3–9. Figure 1a shows this effect. The phosphate buffer pH of 8 was selected as an optimal value for subsequent works.

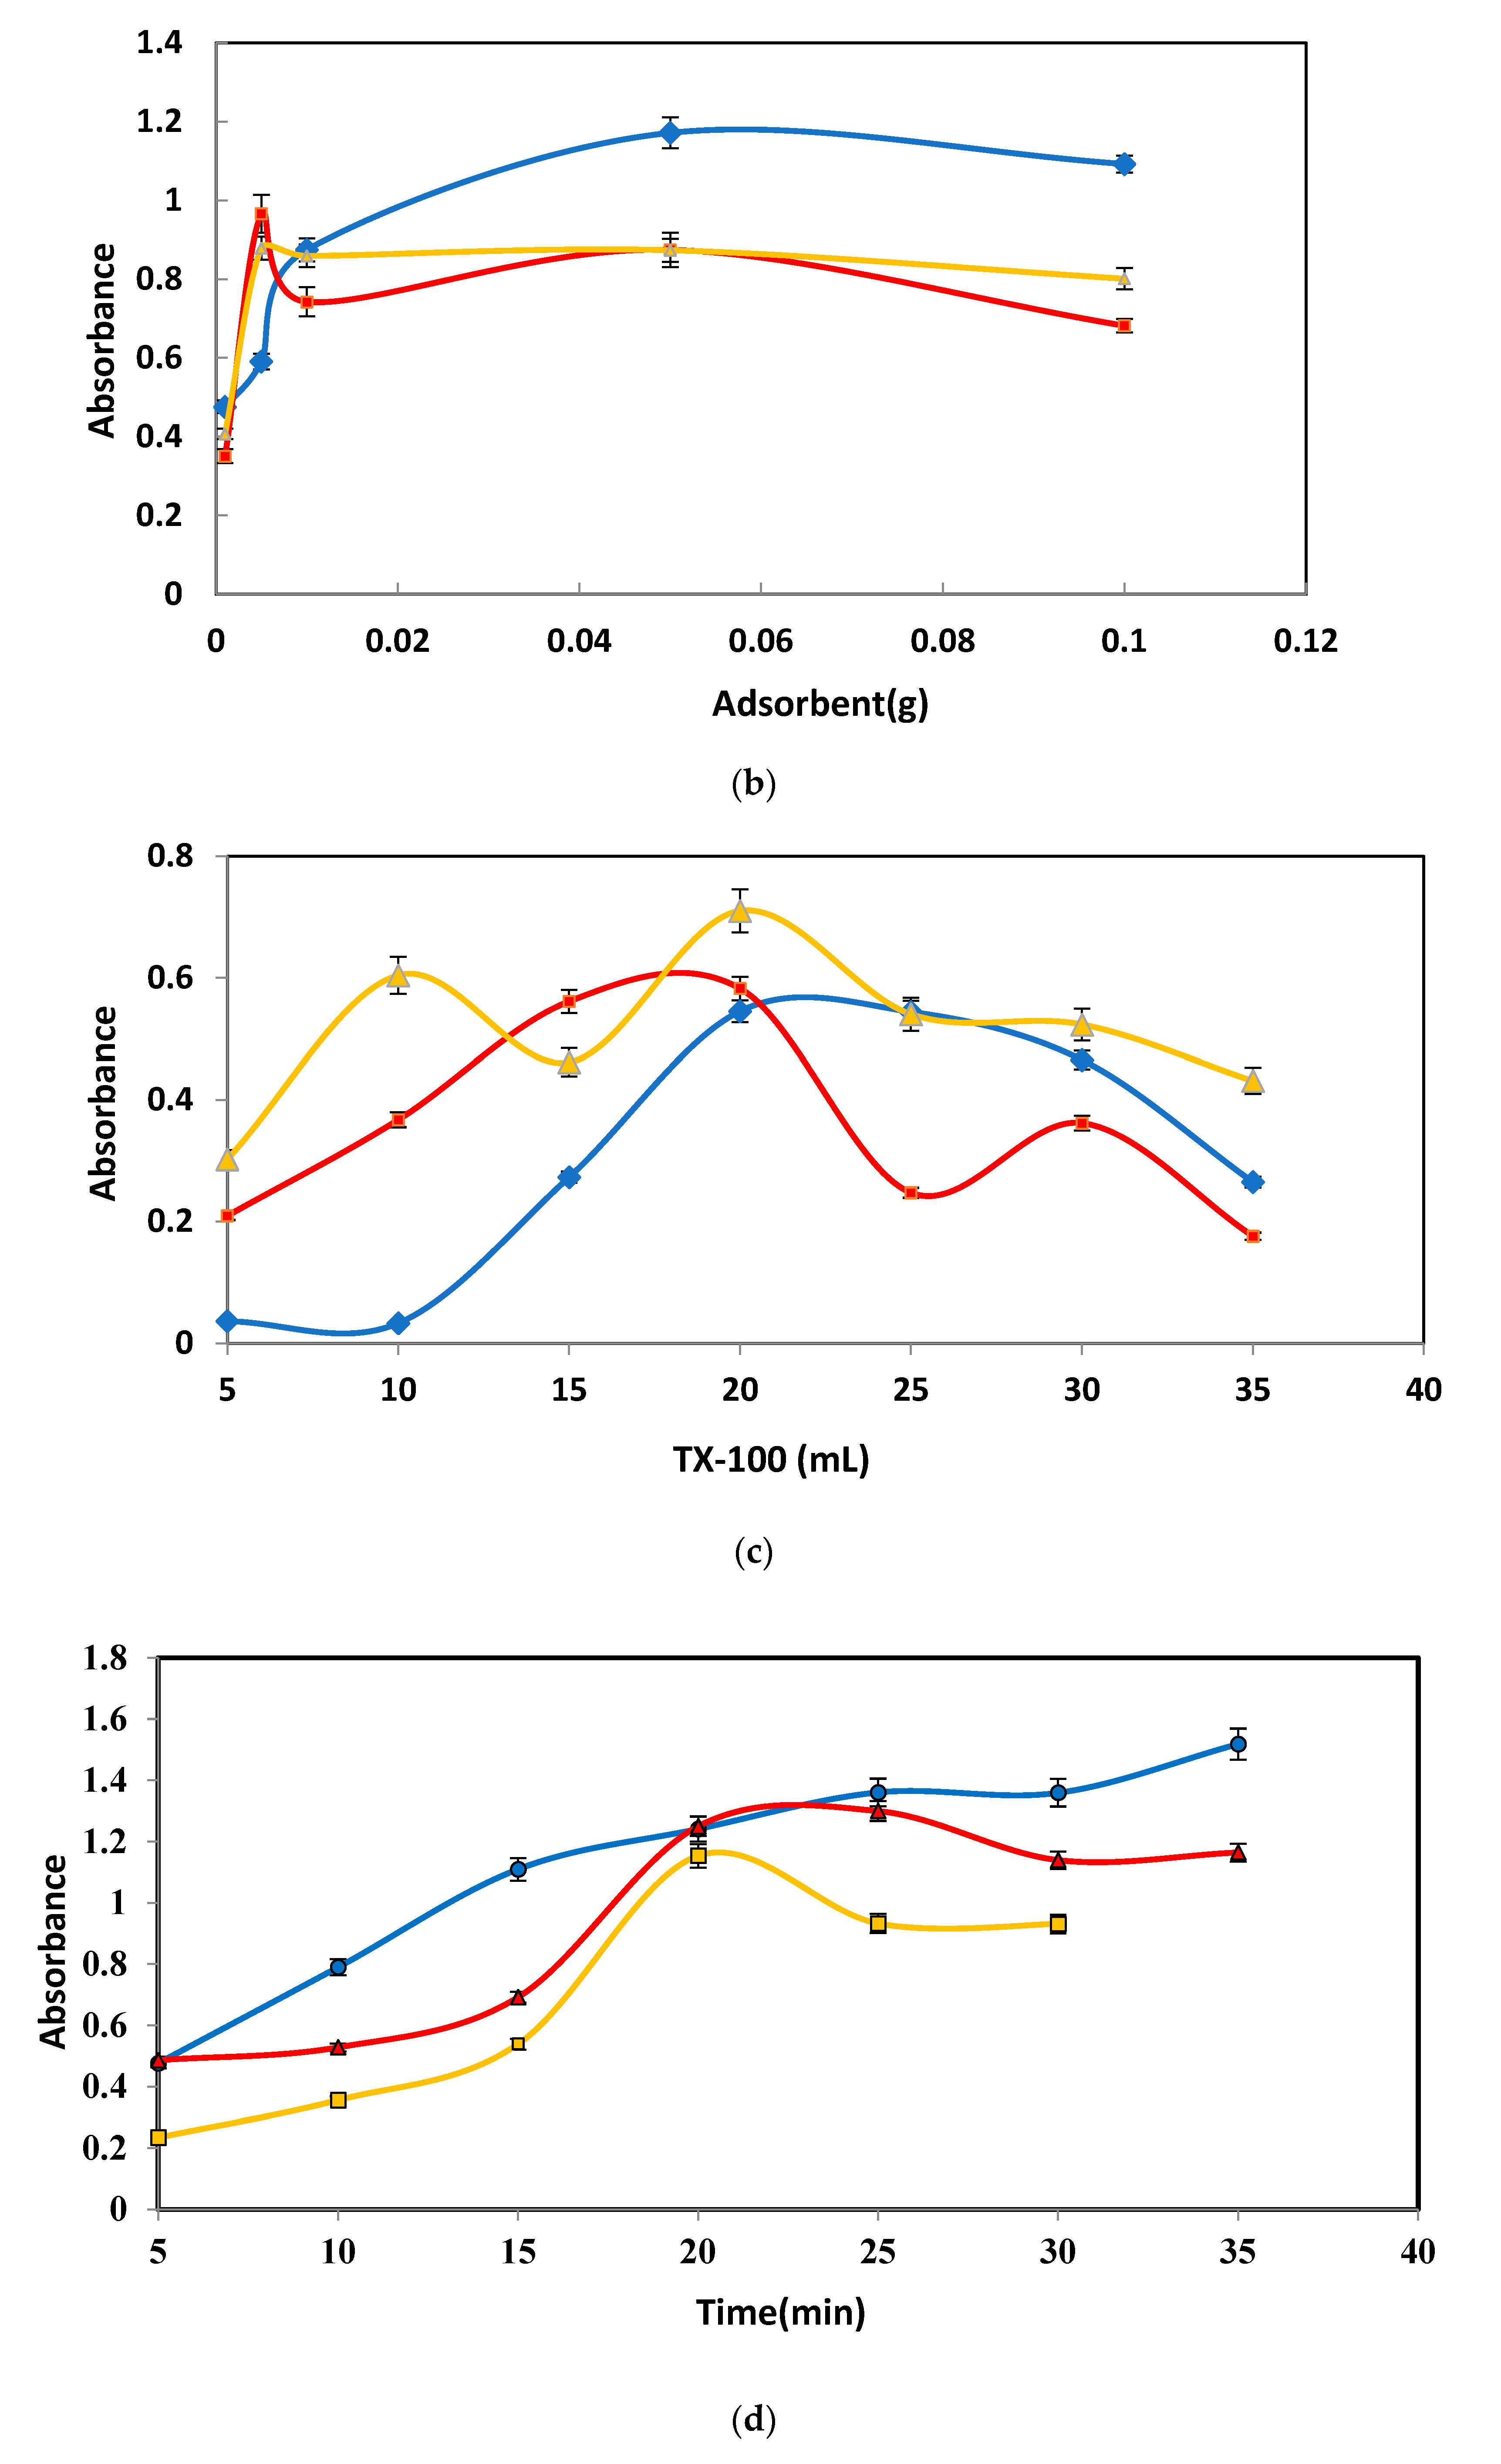
3.1.2. Fe3O4 NPs Sorbent Dose

For selection of the appropriate amount of the sorbent for extraction of PAHs, different doses of Fe3O4 were used in the range of 1–100 mg using a constant amount of TX-100. The conditions for extraction include: buffer pH 8, TX-100 (15 mL), 20 min adsorption and desorption times, and 2 mL ethanol (extraction solvent). The given results in Figure 1b show that the absorbance was increased with the increasing amounts of Fe3O4 NPs sorbent to 50 mg, while at higher dosages, the absorbance approximately remained constant (Figure 1b). Therefore, a sorbent dosage of 0.5 mg of Fe3O4 NPs was selected.

3.1.3. Influence of TX-100 Concentration

The concentration of TX-100 is one of the important parameters that could affect the recovery obtained from the optimized method. Through this investigation, the different volumes of 20% v/v of TX-100 at construction of nanocomposite were used.
From Figure 1c, it can be seen that in the absence of TX-100, the lower amounts of PAHs were adsorbed onto the surface of the Fe3O4 NPs. The absorbance value of the solutions, after desorption of the analyte from the nanocomposite surface, greatly increased with an increasing amount of TX-100. Therefore, maximum extraction efficiency was obtained when TX-100 amounts were between 10 and 30 mL of 20% v/v of TX-100. When the TX-100 amount was above 30 mL, the absorbance values of the analyte decreased, which may be related to the formation of micelles in the bulk solution from the TX-100 monomers. In other words, the micelles redistributed the PAHs into the solution. Based on these findings, 30 mL was used as the final addition amount of TX-100 in the next experiments.

3.1.4. Extraction Time Influence

The time for extraction of PAHs in the range of 5–35 min was examined using 50 mg of modified Fe3O4 adsorbent, pH 8, 30 °C, 20 min desorption time, and 2 mL extraction solvent (ethanol). The results revealed that the extraction time had a detectable effect on the PAH adsorption. As shown in Figure 1d, the extraction reached its maximum value at 20 min after adsorption for DBF and FLU, and remained constant at longer times, but slightly decreased for PHE.

3.1.5. Desorption Solvent

It is well known that surfactant aggregates can be disrupted by organic solvents. Therefore, it is essential to choose a suitable desorption solvent with adequate desorption capability to achieve the best desorption efficiency of PAHs. In this work, acetonitrile, ethanol, and methanol were used as traditional elution solvents for the desorption of analytes from the sorbents. The results, however, demonstrated that even when the desorption duration was increased to 1 h, the selected compounds could not be completely eliminated from the sorbents. This can be explained by the fact that these solvents do not entirely disrupt the various interactions among the sorbent and the analytes. The desorption efficiency was calculated. The highest values for all analytes were obtained with ethanol (75 to 88%). Therefore, 2 mm of ethanol were selected as the preferred extraction solvent for the desorption of PAHs, considering that methanol is hazardous.

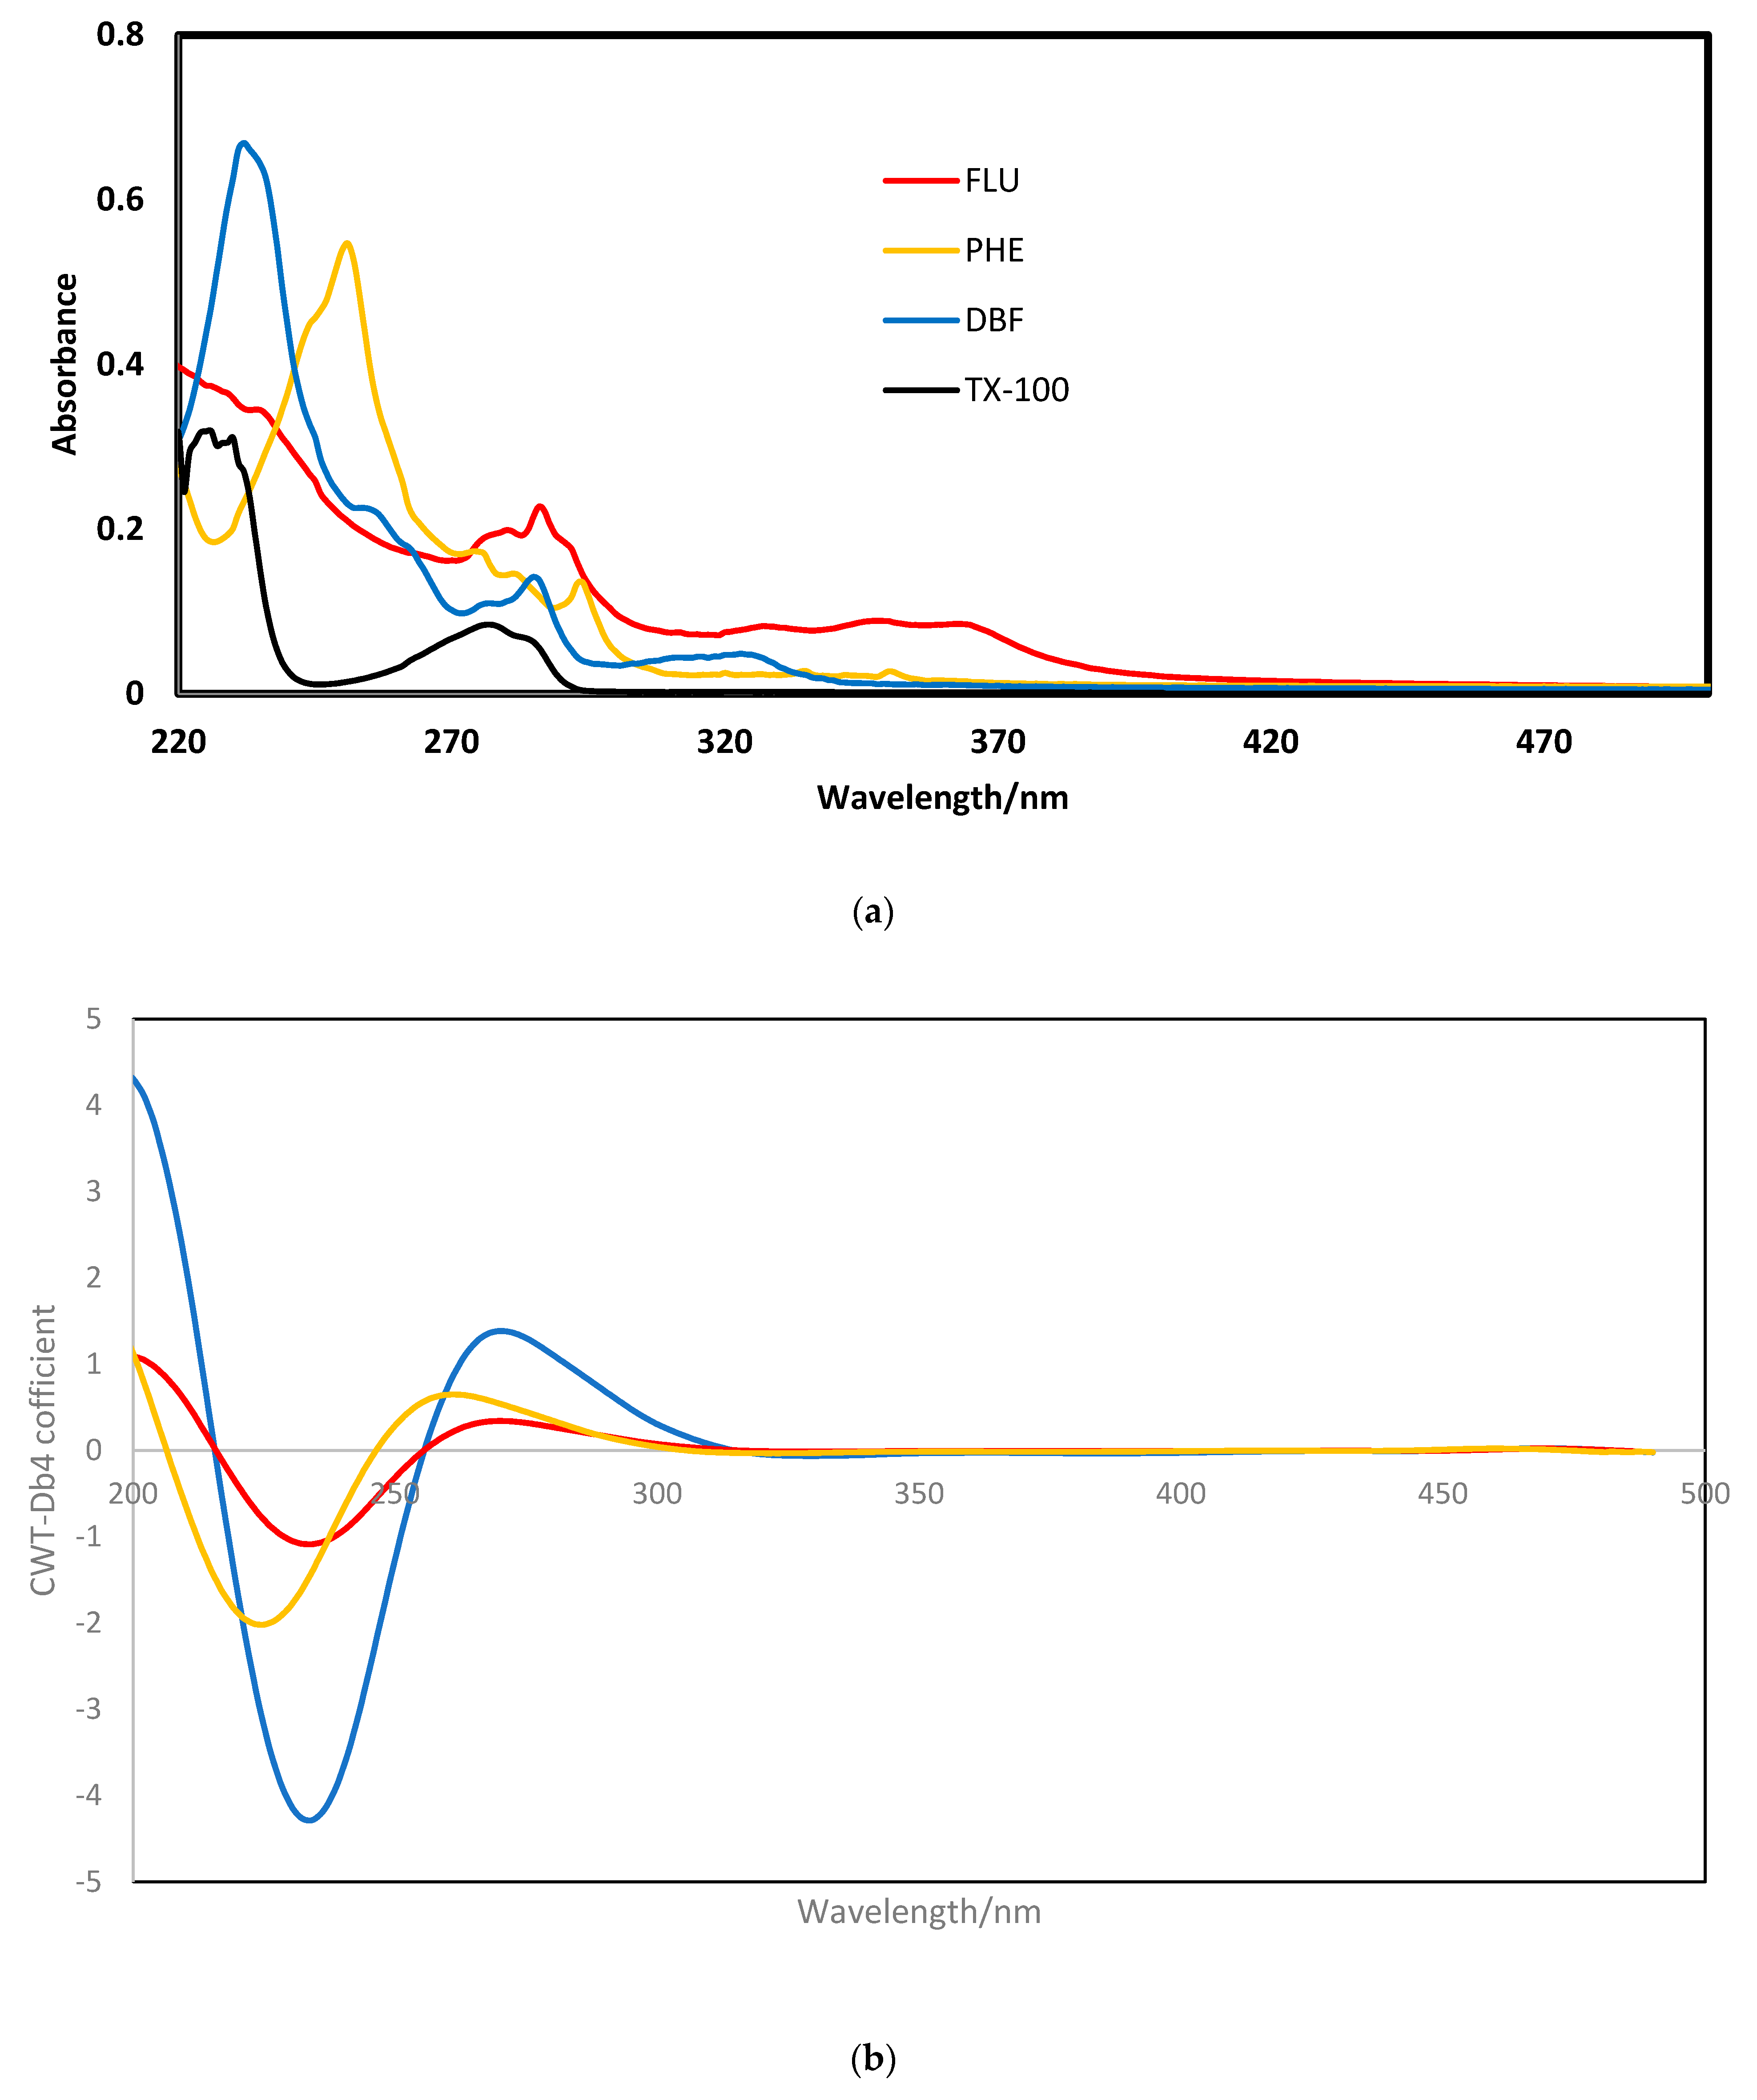
3.2. Primary Study of Nanocomposite Interaction with PAHs

As mentioned, for the simultaneous determination of dibenzofuran (DBF), fluoranthene (FLU), and phenanthrene, a fabricated nanocomposite was developed and TX-100 was used for the modification of the Fe3O4 NPs’ surface. Figure 2a shows the UV-Vis absorption spectra of species. According to this figure, DBF, FLU, and PHE have strong interaction with TX-100 of TX-100- Fe3O4 NPs. Due to the high spectral overlapping of the species, classical spectrophotometric methods could not be used. Therefore, chemometrics approaches were considered.

3.2.1. Univariate Calibration

After optimizing the experimental conditions for the adsorption and desorption of PAHs, UV-Vis spectra were recorded to evaluate the analytical performance of the proposed procedure. Spectra of various concentrations of PAHs at 200 to 500 nm wavelengths at 1 nm intervals were recorded and stored for further analysis. The absorbance changes were considered at wavelengths of 235 nm, 250 nm, and 345 nm for DBF, PHE, and FLU, respectively (see Figure S1). The calibration graphs were obtained at these wavelengths. According to these graphs, the linear ranges were 2.4–250 ng mL−1 (R2 = 0.989), 50–3750 ng mL−1 (R2 = 0.998), and 48–5000 ng mL−1 (R2 = 0.995) for PHE, FLU, and DBF, respectively. The assessed detection limits (LOD) for PHE, FLU, and DBT were 0.58, 9.5, and 12.5 ng mL−1 (DBF), respectively. The limit of quantification (LOQ) values for PHE, FLU, and DBT were 3.52, 16.35, and 31.33 ng mL−1, respectively.

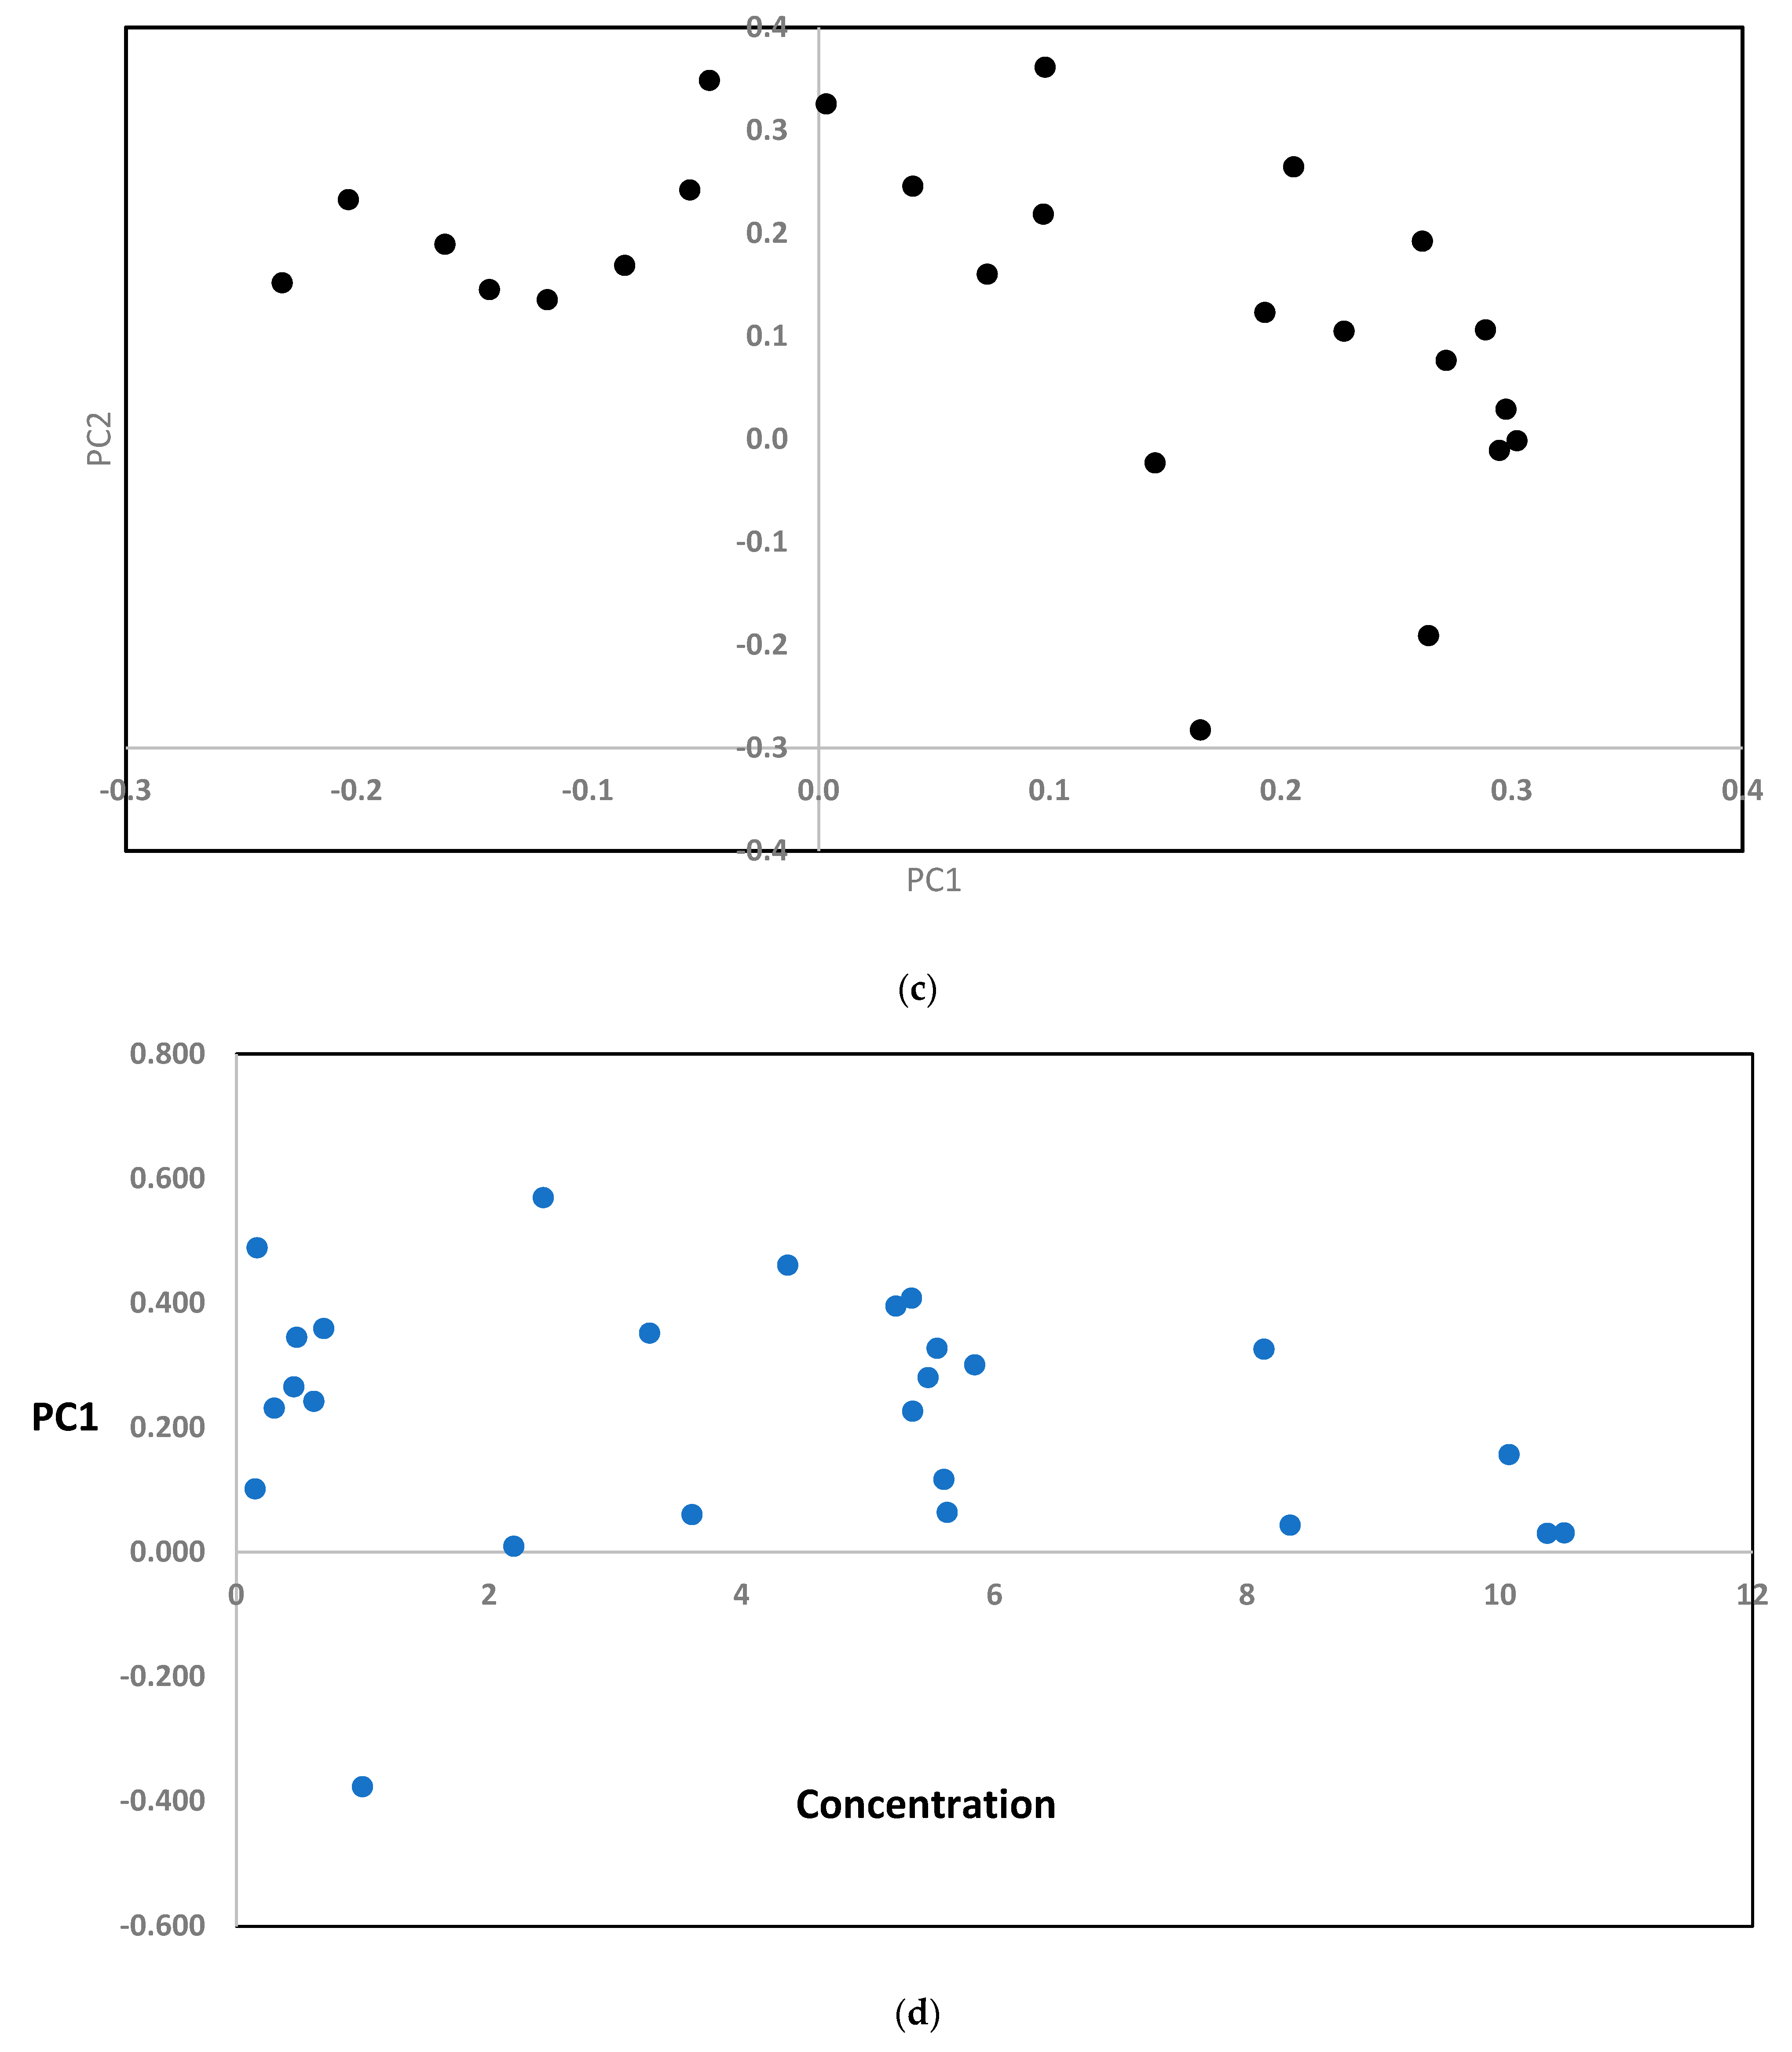
3.2.2. Multivariate Calibration

Building the calibration and prediction sets are the initial stages in multivariate calibration techniques. To optimize the statistical information included in the spectra, orthogonal arrays with five levels were employed to construct the concentration level of species in the calibration and prediction sets. The levels of concentration were 10.6, 0, 50, 150, and 250 ng mL−1 for PHE; 1000, 200, 50, 2250, and 3750 ng mL−1 for FLU; and 0.2, 1, 2000, 3500, and 5000 ng mL−1 for DBT. The calibration and prediction sets with 25 and 15 samples were selected, respectively. The degree of overlap across species spectra was large. Therefore, for the simultaneous determination of ternary PAH mixtures, CWT and ANNs were examined. Here, the full CWT advantages of extracting the distinctive information from heavily overlapped signals without lowering the S/N by increasing the resolution and sensitivity of analysis was considered. Different wavelet families with various scales were assessed in order to determine the best signal processing settings. The mother wavelet function was selected, along with the scale value, which revealed the largest difference between the pure spectra of species. The proper mother wavelet adopted was Daubechies level 4 (db4) (Figure 2b) with a scale value of 40.
The scatter plots of PC1 and PC2 can be used to display nonlinearity and departure from normality. Therefore, PC1 and PC2 plots of UV-Vis data were plotted (Figure 2c). Additionally, a partial response plot (PRP), as a classical method, was used to diagnose nonlinearity in multivariate data. Thus, the predicted response (concentration) as a function of PC1 was considered [35]. Figure 2d shows the PRPs of DBT. This figure shows the presence of a nonlinear pattern in the dataset and the suitability of ANNs for the simultaneous determination of PAHs.

3.3. Study of Interferences

The effects of foreign species on the simultaneous determination of selected PAHs were examined using solutions, including 50 ng mL−1 of PHE, FLU, and DBF in the presence of different amounts of interfering species. Absorbance variations were recorded by adding different amounts of these compounds. The relative error in the signal was calculated via absorbance variations. The tolerance limit was taken as the concentration of added PAHs creating more than a ±10% relative error in the signal. Table 1 presents the findings.
The results demonstrated that naphthalene did not cause interference, even when present in 300-fold excess over PHE and DBF. Pyrene and methylanthracene did not interfere up to 150-fold excess for PHE and FLU. Pyrene did not interfere up to 300-fold excess over the DBF. As a result, the constructed magnetic nanosensor can be employed for the selective determination of selected PAHs in different real mixtures.

4. Discussion

Solid-phase extraction is a traditional technique for the determination of environmental pollution. The rapid development and utilization of metal/metalloid oxide nanoparticles (MNPs) have significantly increased the fabrication of novel analytical techniques for trace detection of pollutions in water to assess their environmental and health concerns. MNPs have a large surface area and provide a low diffusion pathway with respect to classic adsorbents. Therefore, they guarantee high extraction capacity, dynamic extraction, and extraction efficiency. The sensitive miniaturized SPE adsorbent of Fe3O4 NPs was used for pre-concentration and spectrophotometric detection was developed for measurements of PAHs. Triton X100 was used to fully disperse and stabilize the Fe3O4 NPs. Initial investigations of the interaction between different PAHs and the fabricated adsorbent revealed that only three target compounds exhibited a very strong interaction with the fabricated nano-adsorbent, as evidenced by their UV-Vis spectra, which differed significantly from the Triton X100 spectrum.

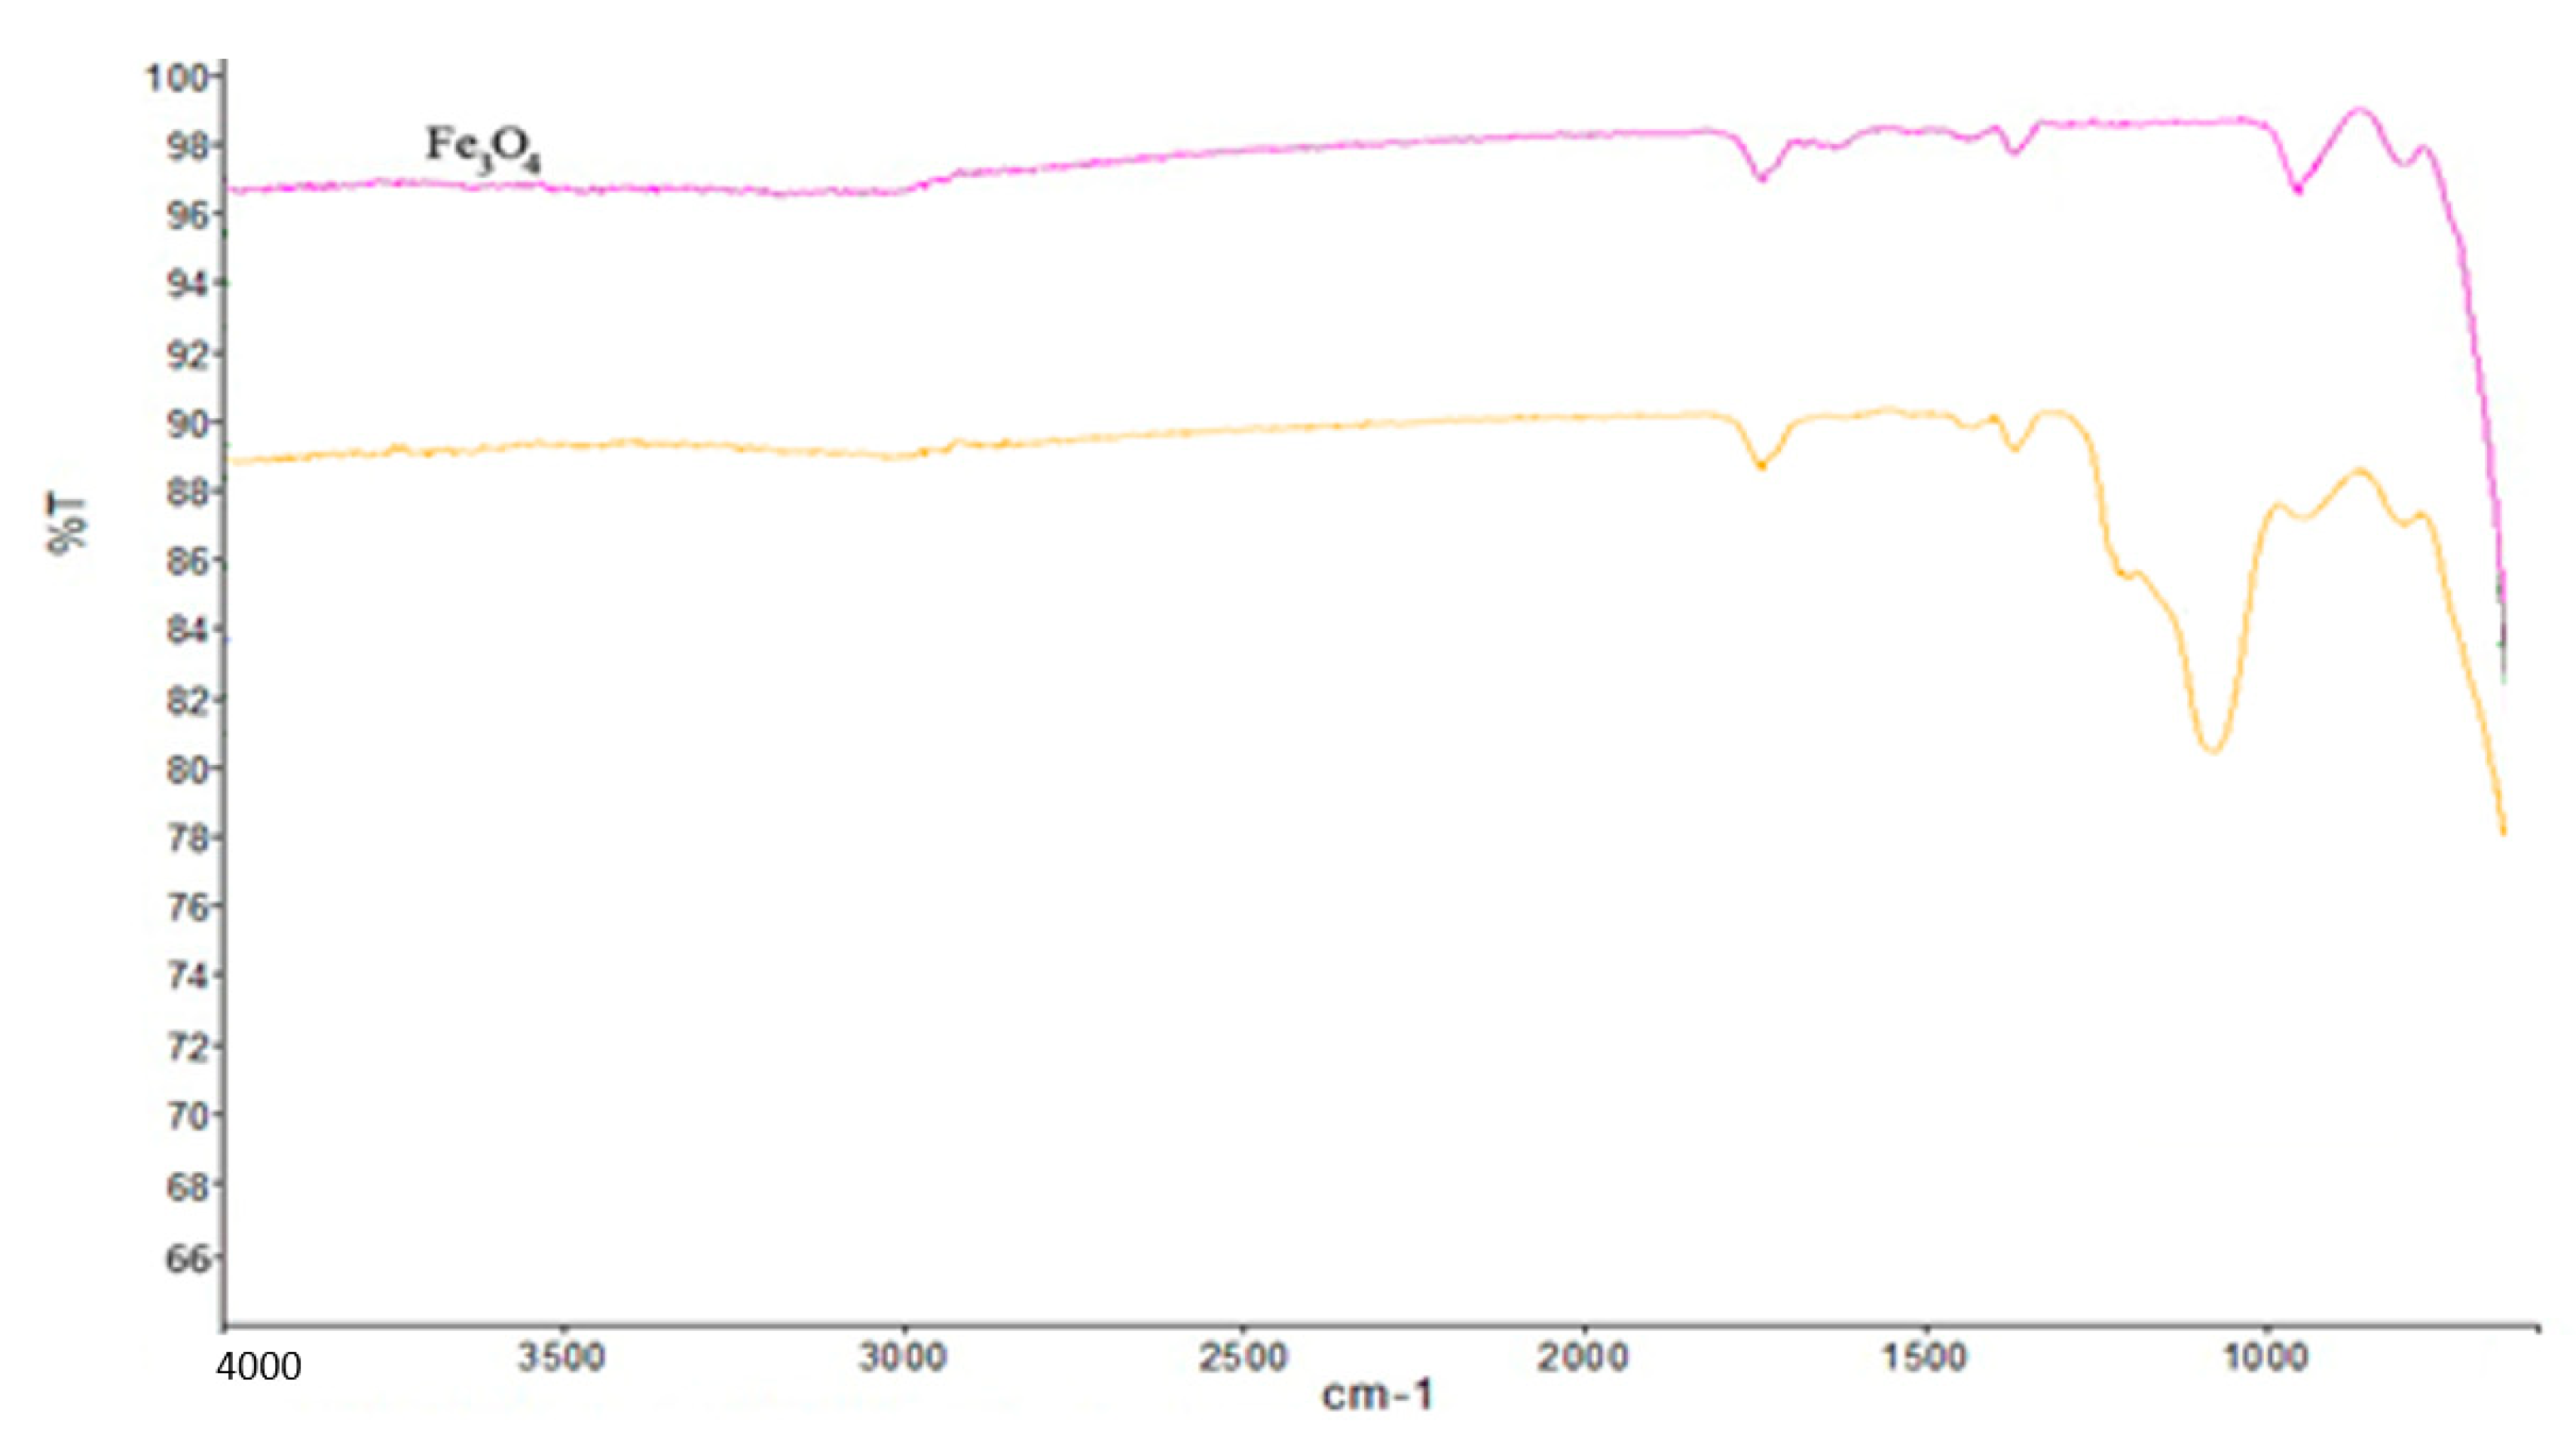
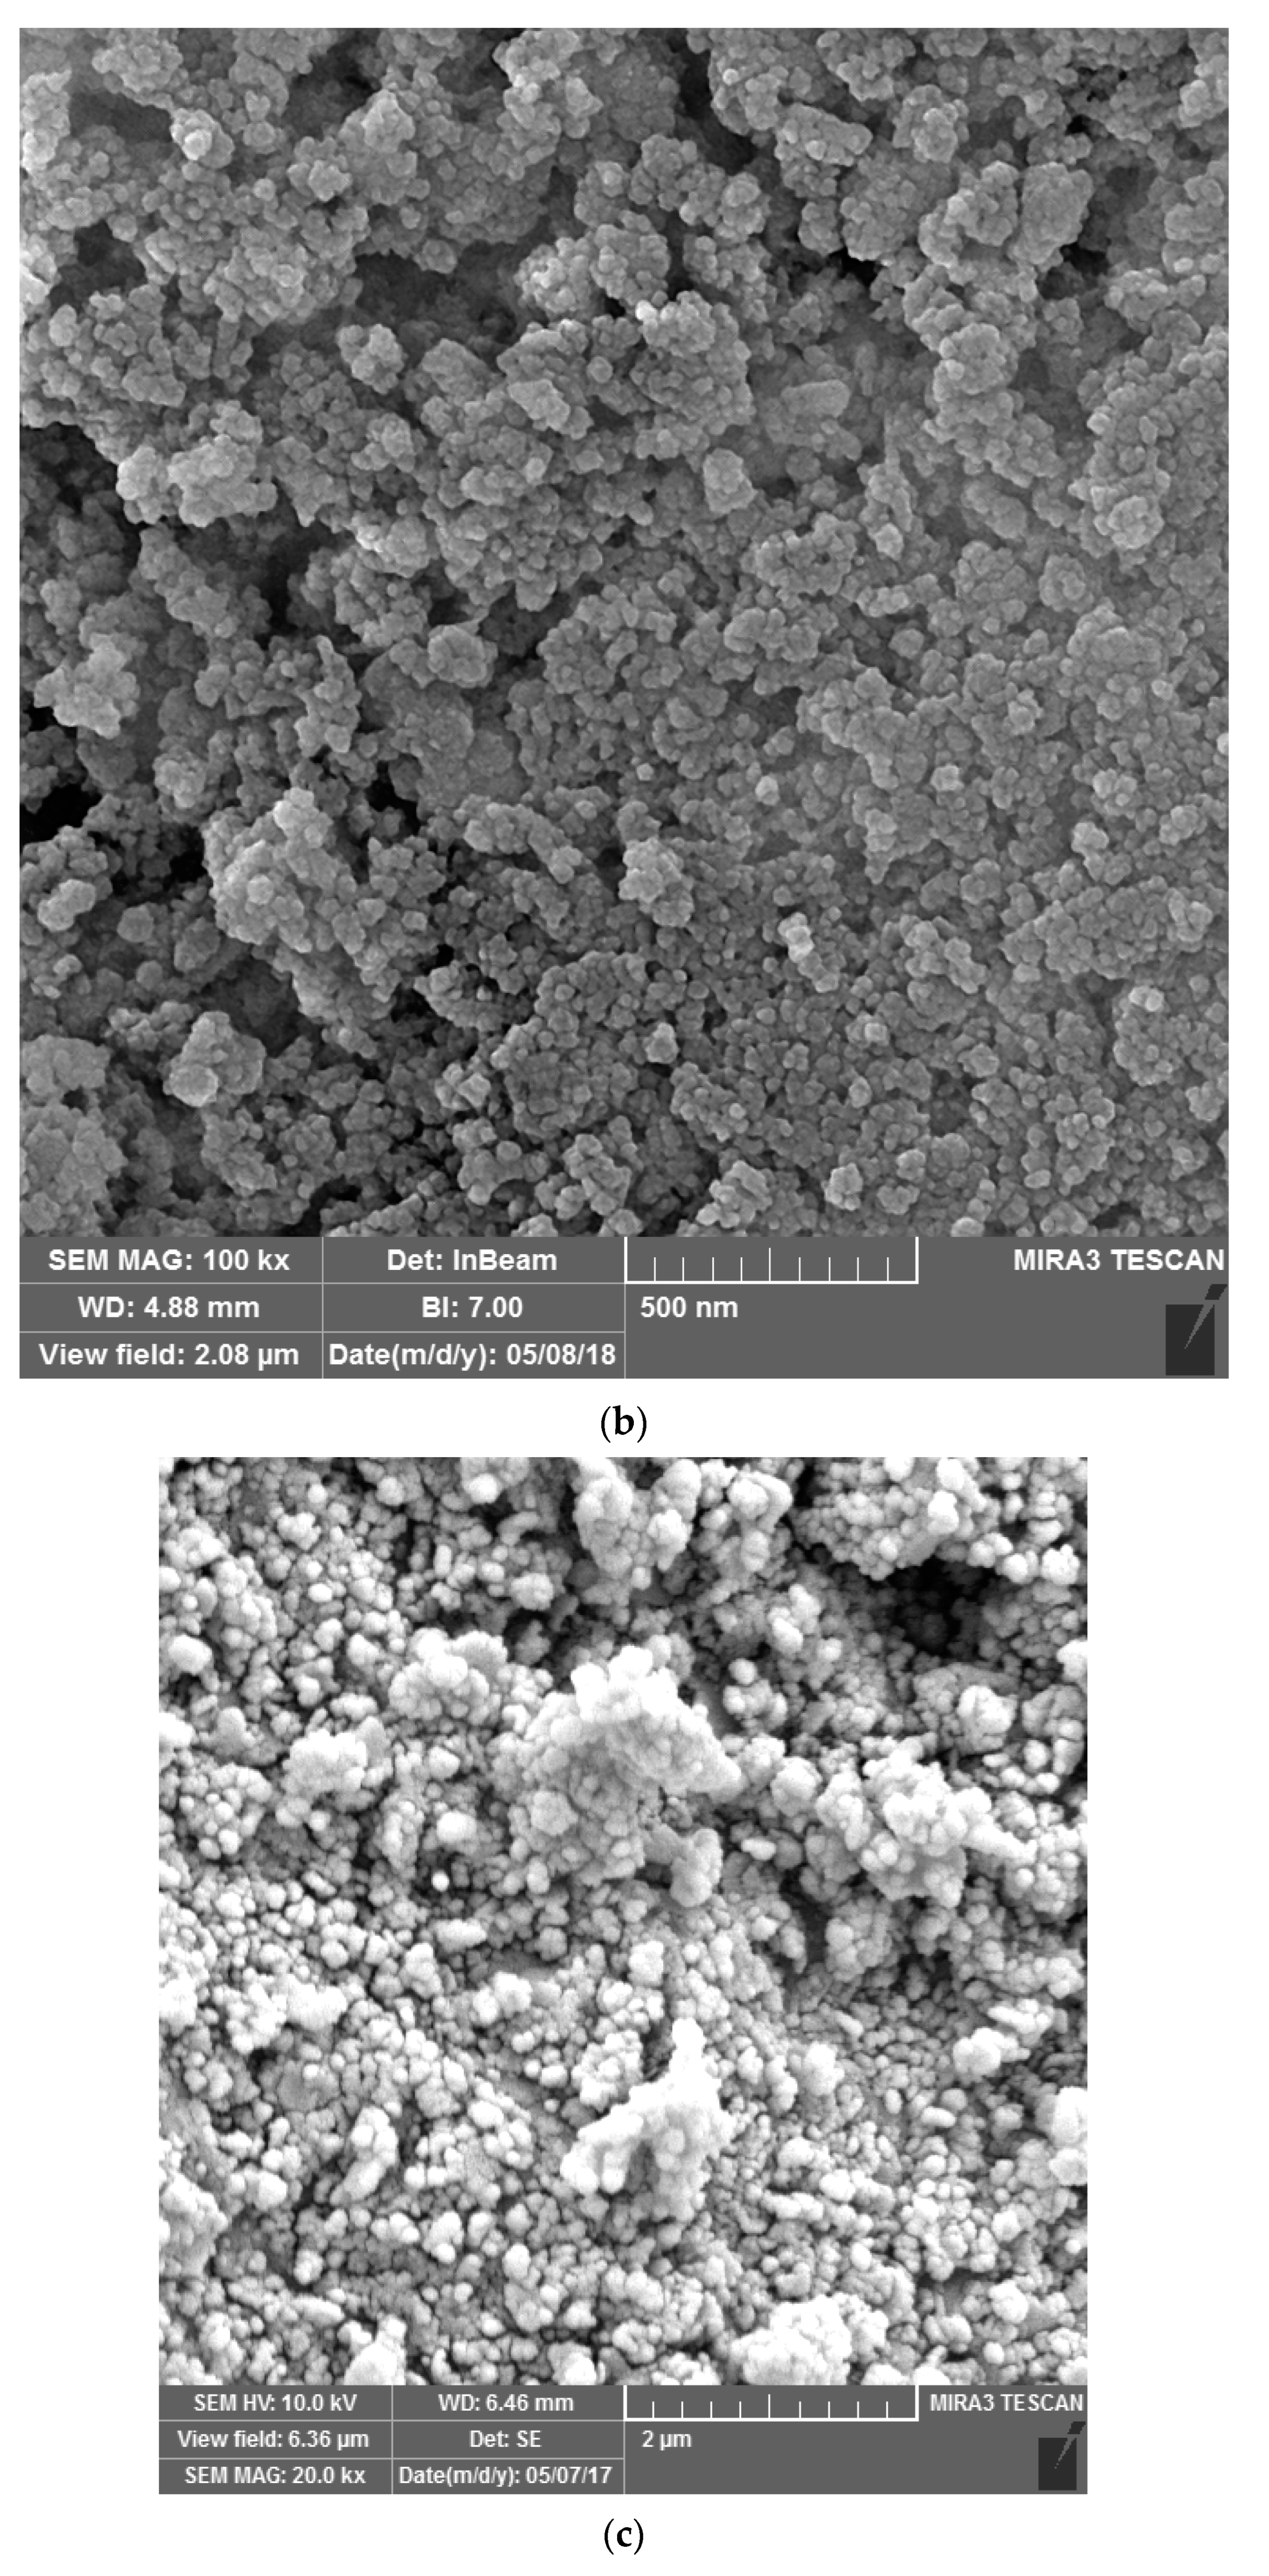
4.1. Characterization of Nanocomposite

The stretching vibrations of the Fe–O bond are detected at 643 cm−1 of FT-IR spectra, revealing the presence of Fe3O4. These two peaks are characteristic absorptions of the Fe-O bonds (Figure 3). The presence of TX-100 can be confirmed by the peaks observed around 1478 cm−1 and 1175 cm−1, which can be attributed to the vibration of the benzene ring and C–O stretching vibrations, respectively.
The presence of adsorption peaks demonstrates that Fe3O4 was effectively produced, and TX-100 was effectively immobilized on the surface of the magnetic particles.
XRD measurements were conducted to confirm the preparation and modification of nanoparticles and estimate their crystallinity (Figure 4a). In both XRD patterns, the same strong diffraction peaks can be detected, but the line broadening can be seen in Fe3O4/TX-100 nanocomposite (Figure 4a). Therefore, the crystalline spinel ferrite core structure was retained during the TX-100 functionalization process. The 2θ = 30.20°, 35.54°, 43.18°, 53.9°, 57.61°, 57.11°, and 62.72°, which correlated to the (220), (311), (400), (422), (511), and (440) characteristic diffraction planes of the spinel structure of Fe3O4, respectively. This means that the Fe3O4 nanoparticles were pure Fe3O4. Using the XRD peak, the average crystallite size of the magnetic nanoparticles was estimated to be 25.0 nm. It can be concluded that the Fe3O4 surface functionalization with Triton X100 does not induce any phase change of Fe3O4, but the peak intensity and broadening were occurred. Additionally, the pore structure and surface morphology of the nanocomposite were observed with SEM. The acquired SEM images demonstrate the homogeneous distribution of the iron oxide nanoparticles (Fe3O4) and functionalized iron oxide nanoparticles. This figure shows that the Fe3O4 structure was not changed after coating with TX-100. Only the size of the nanoparticles was increased after functionalizing with TX-100 (Figure 4b,c). This finding is in accordance with XRD results.

4.2. Multivariate Analysis

During the analysis of multi-dimensional data using ANNs, over-fitting can occur. This is defined as fitting the ANN weights not only to the signal but also to a constant noise in the training sample. The occurrence of overfitting depends on factors such as ANN size, training patterns, and data quality. To avoid over-fitting, the number of inputs were reduced by removing wavelet coefficients that did not contain useful information. This compression process is quite challenging and requires careful selection of which wavelet coefficients to include and how many to use based on the specific problem at hand. In order to make these selections, a variance function was defined, and wavelengths with the highest amount of variance were chosen and incorporated into the ANNs. The large values of variance (ranging from 90 to 100) at these wavelengths indicate significant differences between the spectra of the components [37].

4.2.1. CWT-FFNNs Analysis

The selected CWT coefficient was determined according to the variance vector method and used as input into FFNNs. Training of FFNNs was carried out using the back propagation algorithm. During the optimization of the parameters, four runs were used and finally the average of four measurements was reported. The number of hidden layers changed from one to five and the root mean square error was followed. It was observed that at one layer, the root mean square error was minimum.
The root mean square errors (RSE) of the prediction set can be used for comparing the results of the ANNs and real values as follows:
RSE = i = 1 np C C p i = 1 np C
where Ci and Cp are the desired concentration and predicted concentrations, respectively.
Therefore, a three-layer network was used for the analysis. The strength of the connections between neurons in different layers is represented by the weight (w) value, and the optimization of weight values was achieved using the delta rule during the training process. Depending on the weights of the connections at each connection, signals can be enhanced or inhibited until they reach the output layer and provide prediction values. For this purpose, a random value of weights was selected and during the training these values were optimized. Hence, the correction of weights at each node depended on the difference (error) between the desired objective and the real result.
The appropriate number of nodes in the hidden layer was established via ANN training with 1 to 10 nodes and computing the RSE values. According to Figure S1, the minimum RSE% was obtained when the number of nodes in the hidden layer was four. The other network variables, such as number of epochs (Figure S2), learning function, and learning rate, were optimized and are given in Table 2.
The concentrations of PAHs estimated using optimal CWT-FFNNs architecture are given in Table 1. The calculated RSE% values were 4.92, 3.5, and 3.29 for PHE, FLU, and DBF, respectively.

4.2.2. CWT-RBF Analysis

RBFNs are incorporated in two-layer feed-forward neural networks. In an exact fit radial basis function network, the number of hidden nodes equals the number of nodes in the input layer. Therefore, the Gaussian spread is a major factor that influences the performance of an RBF network. The RSE% values calculated for all PAHs at spread constants ranged from 0.00001 to 50.
The optimal spread constant was identified as the value that yielded the minimal RSE% (Relative Squared Error percentage). A spread constant of 0.001 was used for PHE, 0.001 for FLU, and 0.1 for DBF. The final value for each target was the average of three measurements. The RSE% values for PAHs in the prediction set were estimated as 0.01 for PHE, 0.05 for FLU, and 0.04 for DBF. Comparing the RSE% of the two networks showed an improvement in these values when using RFF networks. During the training or prediction steps of the RBF network, the same results were obtained in different runs. These networks make better use of local distributions of training samples and also require fewer parameters to construct the networks. Therefore, the network is stable and can quickly carry out the training step, and the same prediction values will be obtained in each iteration. The accuracy and precision of RBFN results will be better than the FFNN results.

4.3. Analysis of Real Samples

The acceptable results of the synthetic samples showed that the fabricated nanocomposite is suitable for simultaneous determination of dibenzofuran, fluoranthene, and phenanthrene in various samples. Therefore, the suggested methodology was used for the determination of PAH species in different algae and water samples. The results are given in Table 3. Additionally, the concentrations of PAHs in these samples were determined using high-performance liquid chromatography (HPLC) as the standard method. The comparison of the results shows that the achieved values of the present work were in good agreement with those predicted by HPLC analysis. Student’s t-test analysis (α = 0.05) was performed and the results are given in Table 3. These values indicate that there were no significant differences for the simultaneous determination of PHE, FLU, and DBF using the developed strategy compared to the reference method. Therefore, this method serves as a suitable alternative for measuring PAHs using the available spectrophotometric method, eliminating the need for expensive and time-consuming chromatography techniques.

4.4. Comparison of Method with Previous Works

The proposed technique was compared to those published in the literature. The methodology demonstrated excellent adsorptive capability for pre-concentration and simultaneous determination of species. In comparison to the other methods, this approach provided a lower detection limit and a larger dynamic range, as shown in Table 4. The findings of this study are interesting, and offer significant benefits over currently available PAH analysis methods. This technique allows for PAH analysis without high consumption of hazardous solvents and costly adsorbents, thereby lowering the cost of PAH analysis.

5. Conclusions

Herein, a magnetic nanocomposite of Fe3O4/TX-100 was successfully fabricated and applied as an effective adsorbent for micro-solid-phase extraction (μ-SPE) analysis. The coating of TX-100 produced an excellent extraction adsorbent. The developed method reveals the fabrication of an easy, rapid, and effective adsorbent for the trace analysis of PAHs with a low detection limit and wide dynamic ranges in the real samples with spectrophotometric analysis. The miniaturized Fe3O4/TX-SPE adsorbent overcome the disadvantages of traditional methods such as employing hazardous solvents in liquid–liquid extraction, clogging SPE columns, and time-consuming chromatographic separations for PAH analysis. Additionally, the fabricated sorbent in combination with the UV-Vis detection and chemometrics approaches introduced a sensitive, accurate, simple, and very fast method with satisfactory results. Nonlinear multivariate calibration methods provide a simple and a cost-effective alternative technique for expensive liquid chromatography for dibenzofuran, fluoranthene, and phenanthrene quantification in synthetic and real oil-field environmental samples. Furthermore, the results demonstrate that CWT-FFNNs and CWT-RBF networks, as multivariate calibration methods, can be applied for the analysis of multicomponent spectral data. Therefore, the presented approach is likely to have broader applications in the real-world study of polycyclic aromatic hydrocarbons.

Supplementary Materials

The following are available online at https://www.mdpi.com/article/10.3390/separations10060334/s1, Figure S1: Hidden nodes optimization; Figure S2: Optimization of number of epochs.

Author Contributions

Conceptualization, M.A.T. and A.B.; methodology, A.B. and M.A.T.; software, M.A.T.; validation, M.A.T., A.B. and G.A.; formal analysis, M.A.T. and A.B.; investigation, M.A.T. and A.B.; resources, M.A.T. and A.B.; data curation, M.A.T., C.P. and A.B.; writing—original draft preparation, M.A.T.; writing—review and editing, M.A.T., C.P. and G.A.; visualization, C.P. and G.A.; supervision, M.A.T.; project administration, M.A.T.; funding acquisition, M.A.T. All authors have read and agreed to the published version of the manuscript.

Funding

This research received no external funding.

Data Availability Statement

The authors confirm that the data supporting the findings of this study are available within the article.

Conflicts of Interest

The authors declare no conflict of interest.

References

  1. Wise, S.A.; Sander, L.C.; May, W.E. Determination of polycyclic aromatic hydrocarbons by liquid chromatography. J. Chromatogr. A 1993, 642, 329–349. [Google Scholar] [CrossRef]
  2. Gazioglu, I.; Zengin, O.S.; Tartaglia, A.; Locatelli, M.; Furton, K.G.; Kabir, A. Determination of polycyclic aromatic hydrocarbons in nutritional supplements by fabric phase sorptive extraction (FPSE) with high-performance liquid chromatography (HPLC) with fluorescence detection. Anal. Lett. 2020, 54, 1683–1696. [Google Scholar] [CrossRef]
  3. Gazioglu, I.; Kabir, A.; Zengin, O.S.; Tekkeli, E.K.; Furton, K.G.; Tartaglia, A.; Locatelli, M. Development of sol-gel phenyl/methyl/poly(dimethylsiloxane) sorbent coating for fabric phase sorptive extraction and its application in monitoring human exposure to selected polycyclic aromatic hydrocarbons using high performance liquid chromatography-fluorescence detection. J. Chromatogr. B 2021, 1163, 122520. [Google Scholar]
  4. Farrokhzadeh, S.; Razmi, H. Use of chicken feet yellow membrane as a biosorbent in miniaturized solid phase extraction for determination of polycyclic aromatic hydrocarbons in several real samples. Microchem. J. 2018, 142, 403–410. [Google Scholar] [CrossRef]
  5. Azizi, A.; Shahhoseini, F.; Bottaro, C.S. Magnetic molecularly imprinted polymers prepared by reversible addition fragmentation chain transfer polymerization for dispersive solid phase extraction of polycyclic aromatic hydrocarbons in water. J. Chromatogr. A 2020, 1610, 460534. [Google Scholar] [CrossRef]
  6. Speltini, A.; Scalabrini, A.; Maraschi, F.; Sturini, M.; Profumo, A. Newest applications of molecularly imprinted polymers for extraction of contaminants from environmental and food matrices: A review. Anal. Chim. Acta 2017, 974, 1–26. [Google Scholar] [CrossRef]
  7. Carasek, E.; Morés, L.; Merib, J. Basic principles, recent trends and future directions of microextraction techniques for the analysis of aqueous environmental samples. Trends Environ. Anal. Chem. 2018, 19, e00060. [Google Scholar] [CrossRef]
  8. Kiss, G.; Varga-Puchony, Z.; Hlavay, J. Determination of polycyclic aromatic hydrocarbons in precipitation using solid-phase extraction and column liquid chromatography. J. Chromatogr. A 1996, 725, 261–272. [Google Scholar] [CrossRef]
  9. Doong, R.-A.; Chang, S.-M.; Sun, Y.-C. Solid-phase microextraction for determining the distribution of sixteen US Environmental Protection Agency polycyclic aromatic hydrocarbons in water samples. J. Chromatogr. A 2000, 879, 177–188. [Google Scholar] [CrossRef]
  10. Akvan, N.; Azimi, G.; Parastar, H. Chemometric assisted determination of 16 PAHs in water samples by ultrasonic assisted emulsification microextraction followed by fast high-performance liquid chromatography with diode array detector. Microchem. J. 2019, 150, 104056. [Google Scholar] [CrossRef]
  11. Popp, P.; Bauer, C.; Wennrich, L. Application of stir bar sorptive extraction in combination with column liquid chromatography for the determination of polycyclic aromatic hydrocarbons in water samples. Anal. Chim. Acta 2001, 436, 1–9. [Google Scholar] [CrossRef]
  12. Hassan, A.A.; Tanimu, A.; Ganiyu, S.A.; Yaagoob, I.Y.; Alhooshani, K. Selective removal of Cd(II), As(III), Pb(II) and Cr(III) ions from water resources using novel 2-anthracene ammonium-based magnetic ionic liquids. Arab. J. Chem. 2022, 15, 104136. [Google Scholar] [CrossRef]
  13. Hassan, A.A.; Sajid, M.; Al Ghafly, H.; Alhooshani, K. Ionic liquid-based membrane-protected micro-solid-phase extraction of organochlorine pesticides in environmental water samples. Microchem. J. 2020, 158, 105295. [Google Scholar] [CrossRef]
  14. Cañas, A.; Richter, P.; Escandar, G.M. Chemometrics-assisted excitation–emission fluorescence spectroscopy on nylon-attached rotating disks. Simultaneous determination of polycyclic aromatic hydrocarbons in the presence of interferences. Anal. Chim. Acta 2014, 852, 105–111. [Google Scholar] [CrossRef] [PubMed]
  15. Ferrer, R.; Beltrán, J.; Guiteras, J. Use of cloud point extraction methodology for the determination of PAHs priority pollutants in water samples by high-performance liquid chromatography with fluorescence detection and wavelength programming. Anal. Chim. Acta 1996, 330, 199–206. [Google Scholar] [CrossRef]
  16. Santos, P.M.; del Nogal Sánchez, M.; Pavón, J.L.P.; Cordero, B.M. Quantitative and qualitative analysis of polycyclic aromatic hydrocarbons in urine samples using a non-separative method based on mass spectrometry. Talanta 2018, 181, 373–379. [Google Scholar] [CrossRef] [PubMed]
  17. Yan, Y.; Fan, J.; Shen, K.; Cao, Y.; Kang, X.; Zhu, H. Sampling and concentration of particulate matter bound polycyclic aromatic hydrocarbons (PAHs) basing on polystyrene nanofibers followed a determination by gas chromatography-mass spectrometry. Microchem. J. 2022, 178, 107295. [Google Scholar] [CrossRef]
  18. Rezaee, M.; Assadi, Y.; Hosseini, M.-R.M.; Aghaee, E.; Ahmadi, F.; Berijani, S. Determination of organic compounds in water using dispersive liquid–liquid microextraction. J. Chromatogr. A 2006, 1116, 1–9. [Google Scholar] [CrossRef]
  19. Ghasemi, J.B.; Zolfonoun, E. Simultaneous spectrophotometric determination of trace amount of polycyclic aromatic hydrocarbons in water samples after magnetic solid-phase extraction by using projection pursuit regression. Environ. Monit. Assess. 2013, 185, 2297–2305. [Google Scholar] [CrossRef]
  20. Rezaei, A.; Abbasi Tarighat, M.; Mohammadi, K. Characterization and theoretical studies of synthesized (E)-2((3-methylbenzilidene)amino) phenol complexes for the fabrication of novel electrochemical sensor for determination of Pb2+ and Hg2+ ions. J. Mater. Sci. Mater. Electron. 2019, 30, 13347–13359. [Google Scholar] [CrossRef]
  21. Wierucka, M.; Biziuk, M. Application of magnetic nanoparticles for magnetic solid-phase extraction in preparing biological, environmental and food samples. TrAC Trends Anal. Chem. 2014, 59, 50–58. [Google Scholar] [CrossRef]
  22. Cherkashina, K.; Voznesenskiy, M.; Osmolovskaya, O.; Vakh, C.; Bulatov, A. Effect of surfactant coating of Fe3O4 nanoparticles on magnetic dispersive micro-solid phase extraction of tetracyclines from human serum. Talanta 2020, 214, 120861. [Google Scholar] [CrossRef] [PubMed]
  23. Passarella, S.; Guerriero, E.; Quici, L.; Ianiri, G.; Cerasa, M.; Notardonato, I.; Protano, C.; Vitali, M.; Russo, M.V.; De Cristofaro, A. PAHs presence and source apportionment in honey samples: Fingerprint identification of rural and urban contamination by means of chemometric approach. Food Chem. 2022, 382, 132361. [Google Scholar] [CrossRef] [PubMed]
  24. Abdel-Aziz, O.; El Kosasy, A.; Okeil, S.E.-S. Comparative study for determination of some polycyclic aromatic hydrocarbons ‘PAHs’ by a new spectrophotometric method and multivariate calibration coupled with dispersive liquid–liquid extraction. Spectrochim. Acta Part A Mol. Biomol. Spectrosc. 2014, 133, 119–129. [Google Scholar] [CrossRef]
  25. Bortolato, S.A.; Arancibia, J.A.; Escandar, G.M. Chemometrics-assisted excitation—Emission fluorescence spectroscopy on nylon membranes. Simultaneous determination of benzo [a] pyrene and dibenz [a, h] anthracene at parts-per-trillion levels in the presence of the remaining EPA PAH priority pollutants as interferences. Anal. Chem. 2008, 80, 8276–8286. [Google Scholar]
  26. Bravo, M.A.; Valverde, B.; Toledo-Neira, C. Evaluation of three-way fluorescence data-based for simultaneous determination of polycyclic aromatic hydrocarbons in tea infusion samples at sub-ppb levels by second-order multivariate calibration. Microchem. J. 2019, 151, 104208. [Google Scholar] [CrossRef]
  27. Tarighat, M.A.; Nabavi, M.; Mohammadizadeh, M.R. Chemometrics-assisted spectrophotometric method for simultaneous determination of Pb2+ and Cu2+ ions in different foodstuffs, soil and water samples using 2-benzylspiro [isoindoline-1,5′-oxazolidine]-2′,3,4′-trione using continuous wavelet transformation and partial least squares–Calculation of pKf of complexes with rank annihilation factor analysis. Spectrochim. Acta Part A Mol. Biomol. Spectrosc. 2015, 145, 54–62. [Google Scholar]
  28. Tarighat, M.A.; Hasaninejad, A.; Abdi, G. Chemometrics-Enhanced Micelle-Mediated Extraction Spectrophotometric Method for Simultaneous Determination of Cu2+ and Zn2+ in Medicinal Plant, Rice and Water Samples Using Continuous Wavelet Transform. Food Anal. Methods 2016, 9, 1928–1938. [Google Scholar] [CrossRef]
  29. Tarighat, M.A. Orthogonal projection approach and continuous wavelet transform-feed forward neural networks for simultaneous spectrophotometric determination of some heavy metals in diet samples. Food Chem. 2016, 192, 548–556. [Google Scholar] [CrossRef]
  30. Tarighat, M.A.; Afkhami, A. Simultaneous spectrophotometric determination of Cu(II), Co(II) and Ni(II) using ratio spectra-continuous wavelet transformation in some food and environmental samples. J. Braz. Chem. Soc. 2012, 23, 1312–1319. [Google Scholar] [CrossRef]
  31. Afkhami, A.; Madrakian, T.; Abbasi-Tarighat, M. Simultaneous determination of calcium, magnesium and zinc in different foodstuffs and pharmaceutical samples with continuous wavelet transforms. Food Chem. 2008, 109, 660–669. [Google Scholar] [CrossRef]
  32. Afkhami, A.; Abbasi-Tarighat, M.; Bahram, M. Artificial neural networks for determination of enantiomeric composition of α-phenylglycine using UV spectra of cyclodextrin host–guest complexes: Comparison of feed-forward and radial basis function networks. Talanta 2008, 75, 91–98. [Google Scholar] [CrossRef] [PubMed]
  33. Tarighat, M.A.; Ghorghosheh, F.H.; Abdi, G. Fe3O4@SiO2-Ag nanocomposite colorimetric sensor for determination of arginine and ascorbic acid based on synthesized small size AgNPs by cystoseria algae extract. Mater. Sci. Eng. B 2022, 283, 115855. [Google Scholar] [CrossRef]
  34. Jafari, A.; Tahani, K.; Dastan, D.; Asgary, S.; Shi, Z.; Yin, X.-T.; Zhou, W.-D.; Garmestani, H.; Ţălu, Ş. Ion implantation of copper oxide thin films; statistical and experimental results. Surf. Interfaces 2020, 18, 100463. [Google Scholar] [CrossRef]
  35. Fathinezhad, M.; AbbasiTarighat, M.; Dastan, D. Chemometrics heavy metal content clusters using electrochemical data of modified carbon paste electrode. Environ. Nanotechnol. Monit. Manag. 2020, 14, 100307. [Google Scholar] [CrossRef]
  36. Mas, S.; de Juan, A.; Tauler, R.; Olivieri, A.C.; Escandar, G.M. Application of chemometric methods to environmental analysis of organic pollutants: A review. Talanta 2010, 80, 1052–1067. [Google Scholar] [CrossRef]
  37. Grossmann, A.; Morlet, J. Decomposition of Hardy functions into square integrable wavelets of constant shape. SIAM J. Math. Anal. 1984, 15, 723–736. [Google Scholar] [CrossRef]
  38. Zhang, S.; Niu, H.; Hu, Z.; Cai, Y.; Shi, Y. Preparation of carbon coated Fe3O4 nanoparticles and their application for solid-phase extraction of polycyclic aromatic hydrocarbons from environmental water samples. J. Chromatogr. A 2010, 1217, 4757–4764. [Google Scholar] [CrossRef]
  39. Galán-Cano, F.; del Carmen Alcudia-León, M.; Lucena, R.; Cárdenas, S.; Valcárcel, M. Ionic liquid coated magnetic nanoparticles for the gas chromatography/mass spectrometric determination of polycyclic aromatic hydrocarbons in waters. J. Chromatogr. A 2013, 1300, 134–140. [Google Scholar] [CrossRef]
Figure 1. (a) Influence of pH; (b) influence of Fe3O4 dosage, (c); TX-100 volume effect; and (d) effect of extraction time on absorption of analyte after m-SPE for DBF (●), FLU (▲), and PHE (▪).
Separations 10 00334 g001aSeparations 10 00334 g001b
Figure 2. (a) UV-Vis spectra of DBF, FLU, and PHE using TX-100-Fe3O4 nanocomposite at optimum conditions; (b) CWT-db4 spectra of species (red color: FLU; blue color: DBF; orange: PHE); (c) score plots for absorption data of the PAHs calibration set; and (d) PRP plots for DBF for detection of non-linearity.
Separations 10 00334 g002aSeparations 10 00334 g002b
Figure 3. FTIR spectra of Fe3O4 nanoparticles (purple line) and TX-100/Fe3O4 (yellow line) nanocomposite.
Separations 10 00334 g003
Figure 4. (a) XRD spectral pattern of Fe3O4 nanoparticles (black line) and Fe3O4/TX-100 nanocomposite (red line); (b) SEM image of Fe3O4 nanoparticles; and (c) SEM image of Fe3O4/TX-100 nanocomposite.
Separations 10 00334 g004aSeparations 10 00334 g004b
Table 1. Effect of foreign species on the simultaneous determination of PAHs.
Diverse SpeciesAnalyte
PHEFLUDBF
Naphthalene300150300
Pyrene150>150300>
Methylanthracene150150150
Table 2. Optimized FFNNs for determination of PAHs.
ParameterPAHs
PHEFLUDBF
Hidden layer111
Output nodes444
Learning rate0.10.10.05
Momentum50.10.1
Hidden layer transfer functionTansigTansigTansig
Output layer transfer functionTansigTansigTansig
Epoch100100100
Table 3. Simultaneous determination of dibenzofuran, fluoranthene, and phenanthrene in different algae and water samples by proposed methodology and HPLC as a standard method.
SampleProposed MethodHPLCStudent’s t-TestCritical Value
FLUPHEDBFFLUPHEDBFFLUPHEDBF
Water 13.5 ± 0.5820.2 ± 1.023.1 ± 1.112 ± 0.9418 ± 0.8620.5 ± 2.81.922.41.23.75
Water52.5 ± 1.2105.8 ± 2.8BDL55.0 ± 1.8103.1 ± 0.52-−1.631.34-
Algae 52 ± 0.5279.5 ± 2.5BDL54.0 ± 0.6481.2 ± 1.2BDL−3.43−0.86-
Algae97.0 ± 1.893.0 ± 1.05BDL97.5 ± 2.591.3 ± 0.05BDL−0.232.29-
Algae99.5 ± 1.1102.5 ± 2.0510.2 ± 0.5102.5 ± 0.94105.5 ± 2.910.8 ± 0.5−2.9−1.310.6
Table 4. Comparison of proposed analytical characteristics by some published works.
MethodDetectionConcentration (ng mL−1)Detection Limit (ng mL−1)
DBFPHEFLUDBFPHEFLUReference
Carbon-coated Fe3O4 nanoparticleHPLC-0.01–10.01–0.1-0.20.6[38]
Ultrasonic-assisted emulsification microextraction–diode array detectorHPLC-DAD-0.5–150.25–15 9.4111.13[9]
Magnetic solid-phase extraction–projection pursuit regressionSpectrophotometric --3–40--0.65[19]
Ionic-liquid-coated magnetic nanoparticlesGC/MS--- 0.060.04[39]
Miniaturized Fe3O4/TX-100 solid-phase extractionSpectrophotometric 48–50002.4–25050–375012.50.589.5Proposed method
Disclaimer/Publisher’s Note: The statements, opinions and data contained in all publications are solely those of the individual author(s) and contributor(s) and not of MDPI and/or the editor(s). MDPI and/or the editor(s) disclaim responsibility for any injury to people or property resulting from any ideas, methods, instructions or products referred to in the content.

