Abstract
In recent years, the rapid development of the new energy vehicle industry has led to an increase in the production of used lithium-ion batteries. The recycling of waste lithium-ion batteries is expected to alleviate the shortage of valuable metals in battery materials. The electrode material is adhered to the collector by a viscous organic binder such as PVDF. A key step in recycling is to separate the anode material and aluminum foil from the waste lithium batteries to obtain materials rich in valuable metals. Compared with chemical dissolution and decomposition, pyrolysis pretreatment is a simple and feasible method. By reducing the binding force between the binder and the positive active substance at a high temperature, organic matter can be eliminated by thermal decomposition at a high temperature. At the same time, the organic component of PVDF has a high calorific value, and the energy can be recycled and reused, which can save energy. The pyrolysis process and pyrolysis behavior of spent LIBs materials were studied in this paper. FWO, Friedman and KAS conversion methods were spent to compare the pyrolysis kinetics of positive electrode materials. Thermogravimetric analysis shows that the cathode material is decomposed into three stages with mass losses of 1.7%, 1.2% and 3.3%, respectively. The activation energy (Eα) calculated by the three model-free methods is best fitted by the FWO method. During the pyrolysis process, the concentration of F decreases gradually with the increase in temperature, and the concentrations of Ni, Mn, Co and Li remain stable. Most of the harmful element (F) in spent LIBs is converted into HF gas, which can be adsorbed by alkaline solution. The analysis of pyrolysis kinetics and pyrolysis products is of great significance for large-scale pretreatment of spent lithium-ion batteries.
1. Introduction
Lithium-ion batteries are an important means of energy storage that are closely related to all kinds of electronic products in our daily life today, especially the new-energy automobile industry [1]. Due to the large demand for lithium-ion batteries at present, the output of waste lithium-ion batteries has greatly increased, and the disposal of a large number of decommissioned LIBs has become a difficult and hot topic [2]. As is known to all, waste lithium-ion batteries contain a large number of metal elements, including precious metal elements such as cobalt, lithium and manganese, as well as toxic and harmful elements such as phosphorus, sulfur and fluorine [3]. Improper disposal of spent lithium-ion batteries will not only lead to the spending of cobalt, lithium, manganese, nickel and other metal resources, but also to heavy metal pollution of land and water resources and environmental pollution [4]. Therefore, whether from the perspectives of environmental protection or resource saving, the recycling of spent LIBs is very necessary.
Electrode materials are adhered to the collector by viscous organic adhesives (such as PVDF). PVDF has strong binding force and high stability, and is difficult to separate, which seriously affects the subsequent recovery of positive electrode materials. It is therefore necessary to devise ways to separate the cathode material from the aluminum foil and remove the organic binder. The separation of the anode material and aluminum foil from spent LIBs is a key step in recycling [5]. Common treatment methods include organic solvent dissolution, lye immersion and pyrolysis separation [6].
Organic binders such as PVDF or PTFE in lithium batteries effectively connect the positive material to aluminum foil [7]. These two organic binders have excellent chemical stability and cannot be removed by strong acids or bases at room temperature. Since most organic binders are organic substances, from the homogeneity compatibility principle, an organic solution can effectively dissolve the organic binders and effectively separate the cathode from the aluminum sheet. Common solvents are N-methylpyrrolidone (NMP) N, n-dimethylformamide (DMF), dimethylacetamide (DMAC) and dimethyl sulfoxide (DMSO) [6]. Among these organic solvents, NMP has the strongest solubility to the organic binder in waste lithium-ion battery materials, so it is widely mentioned [8]. At the same time, strengthening methods such as ultrasonic treatment and temperature increase can effectively improve the dissolution rate [9]. However, the fly in the ointment is that stirring and high temperature will increase the volatilization of organic solvents, and the treatment method is relatively complicated, which is not easy to control in practice. In addition, the toxicity of NMP is much greater than that of other organic solvents, which may be harmful to the environment and workers to some extent [10]. Therefore, its application in industry is less than other solvents; more attention is paid to the use of other organic solvents. At the same time, the price of organic solvent polycarbonate (PC) is lower—less than one-third of NMP solvent—and it is relatively less harmful to human health and the environment [11]. At the same time, some organic solvents can be recovered by distillation, ultrasound and other auxiliary means to enhance the dissolution effect. However, organic solvents usually have higher viscosity, which makes solid–liquid separation in subsequent processes more difficult [12]. Moreover, the price of organic solvents is generally relatively high, requiring the addition of special safety equipment, which also increases the cost of production.
The alkaline leaching method can selectively dissolve the aluminum collector fluid, so that the positive material can fall off from the aluminum collector fluid and achieve effective separation [13]. The main reactions that occur in the solution are shown in Equations (1) and (2) below. Researchers have found that the rate of dissolution of aluminum collector fluid in alkaline solution depends mainly on the concentration of alkali solution [14,15]. Ferreira et al. [16] observed that the leaching rate of aluminum collector increased rapidly as the concentration of NaOH solution increased from 1% to 10% (mass fraction). This is given by the reaction Equations (1) and (2): Al reacts with NaOH solution, producing H2 gas, which is a potential safety hazard. Wu et al. [17] used a roasting method for the first time to convert aluminum into alumina, which made the operation safer and also effectively improved the leaching rate. The alkaline leaching method is widely mentioned because of its simple operation, low cost and easy-to-scale production. However, this process can only achieve a simple separation of the aluminum collector fluid from the positive material. Some adhesives are still partially attached to the positive material of the battery, which requires further processing, such as roasting, to remove impurities, which brings operational complexity. In addition, gases produced during the reaction can carry alkaline solutions into the air, potentially harming operators and equipment, requiring the installation of protective measures to ensure adequate ventilation.
2Al + 2NaOH + 2H2O→2NaAlO2 + 3H2
Al2O3 + 2NaOH + 3H2O→2NaAl(OH)4
High-temperature separation (pyrolysis pretreatment) is an effective method to treat organic binder materials [18,19]. Through the process of high-temperature separation, the bonding force between the binder and the positive active substance is eliminated due to thermal decomposition [20]. At the same time, the organic binder component has a high calorific value and has the values of energy recovery and reuse, which not only saves energy but also effectively achieves its purpose. High-temperature separation can be achieved by burning the carbon and binder at a higher temperature in air or oxygen [21]. Meanwhile, the plastic caps on the used lithium-ion batteries and all the organic compounds they carry are incinerated. Partial-adhesive PVDF can decompose at around 400 °C. At the same time, in the process of high-temperature treatment, the organic binder not only oxidizes at such a high temperature [22], but also destroys the C-F bond in PVDF. In the heat treatment process, graphite can be oxidized and removed to form CO/CO2 [22]. Later in the process, further treatments such as ball milling, vibration and flotation can be used to effectively separate the collector from the anode material [23].
Since PVDF is organic, from the principle of homogeneous dissolution, organic solution can effectively dissolve the binder and separate the positive active material from the Al sheet [24]. However, its high production cost limits its industrial application. The high-temperature separation process eliminates the binding force between the binder and the positive active material. Organic components have high calorific value; energy can be recycled and reused, saving energy [25].
The recovery rate of high-value metals in the subsequent recovery stage is related to the dissociation efficiency and the effect of the pretreatment process. Therefore, effective pretreatment methods are essential to improve recycling efficiency and the resulting environmental protection and sustainability. The pyrolysis process and pyrolysis behavior of spent LIB materials were studied in this paper. The Flynn–Wall–Ozawa (FWO), Friedman and Kissinger–Akahira–Sunose (KAS) conversion methods were used to compare the pyrolysis kinetics of positive electrode materials. Thermogravimetric analysis shows that the cathode material is decomposed into three stages with mass losses of 1.7%, 1.2% and 3.3%, respectively. The activation energy (Eα) calculated by the three model-free methods is best fitted by the FWO method. During the pyrolysis process, Ni, Mn and Co mainly gather on lithium cobaltate particles, while the concentration of F decreases gradually with the increase in temperature, and the concentrations of Ni, Mn, Co and Li remain stable. Most of the harmful element fluorine in spent LIBs is converted into HF gas, which can be adsorbed by alkaline solution. The analysis of pyrolysis kinetics and pyrolysis products is of great significance for the large-scale pretreatment of spent lithium-ion batteries.
2. Materials and Methods
2.1. Experimental Materials
The 18,650 lithium cobaltate battery used in the experiment was decommissioned for use in electric vehicles. At the same time, in order to ensure the repeatability and safety of the experiment, all waste lithium-ion batteries used in the experiment were discharged and disassembled for testing.
2.2. Experimental Process
The spent lithium-ion battery was manually disassembled, and after removing the outer iron sheet, the battery material was put into the tubular furnace, which was heated up to 200 °C, 400 °C and 600 °C at a heating rate of 10 °C/min. Nitrogen was injected into the whole experiment to create an oxygen-free atmosphere to avoid oxidation of the battery material during the pyrolysis process. The solid- and gas-phase products of the battery materials were analyzed after pyrolysis.
2.3. Analysis Method
2.3.1. Thermogravimetry
The discharged lithium battery was removed manually, and then an area of 1 × 1 cm2 of the battery material was cut off. The sample was heated from 30 °C to 600 °C at different heating rates (5, 10, 15, 20 and 25 °C/min) at 100 mL/min in an alumina crucible in a high-purity nitrogen atmosphere (99.99% purity). TGA tests were performed using a synchronous thermal analyzer (RIGAKU, TG-DTA8122).
2.3.2. Analysis of Pyrolysis Products
The temperature was heated up to 200 °C, 400 °C and 600 °C at a rate of 10 °C/min. Nitrogen was injected into the whole experiment process to create an oxygen-free atmosphere to avoid oxidation of battery materials during pyrolysis. Solid- and gas-phase products were analyzed after the battery materials were treated at 0 °C, 200 °C, 400 °C and 600 °C. The morphologic features of the battery materials at four stages were observed by scanning electron microscopy (SEM, Quanta-200, FEI, Hillsboro, OR, USA). The contents and distribution of main elements in the battery materials at different temperatures were observed by surface scanning. Because scanning electron microscopy is not accurate enough to detect the distribution of element content, inductively coupled plasma-mass spectrometry (ICP-MS, Agilent 7700, Santa Clara, CA, USA) was used to quantitatively analyze the four main elements—F, Ni, Mn and Co—from the battery material. Ion chromatography (IC, Integrion & ICS-900, Thermo Fisher Scientific, Waltham, MA, USA) was used for quantitative analysis of Li. Secondly, X-ray diffraction (XRD, D/Max 2200, Rigku, Tokyo, Japan) was analyzed for the battery material treated at different temperatures to qualitatively determine the major phase in the battery material. Finally, gas chromatography–mass spectrometry (GC-MS, Agilent 7890B) was used to qualitatively and quantitatively analyze the gas spectrometry process.
2.3.3. Dynamic Analysis Method
The nonmodel method and the model fitting method are the most representative methods in the system of thermal analysis dynamics theory. The nonmodel method can obtain the reliable value of activation energy Eα without introducing the mechanism function. Therefore, three nonmodel methods are selected in this paper to calculate the activation energy during the pyrolysis of spent lithium cobaltate battery materials.
In this paper, nonmodel methods (Friedman method, KAS method and FWO method) are used to calculate the activation energy. These kinetic methods can be derived based on Equation (1):
where dα/dt—decomposition rate; f(α)—mechanism function; α—conversion rate, %; Eα—activation energy, kJ/mol; A—preexponential factor, min−1; m0—starting mass, mg; mt—Mass at any time, mg; m∞—final mass, mg; β-heating rate, °C/min; T—arbitrary temperature, °C; t—at any time, min.
By integrating Equation (3) and substituting it into Equation (5), the integral expression of constant temperature rate (Equation (6)) is obtained. Different nonmodel methods are substituted into Equation (6), and expressions of different nonmodel methods are obtained, respectively.
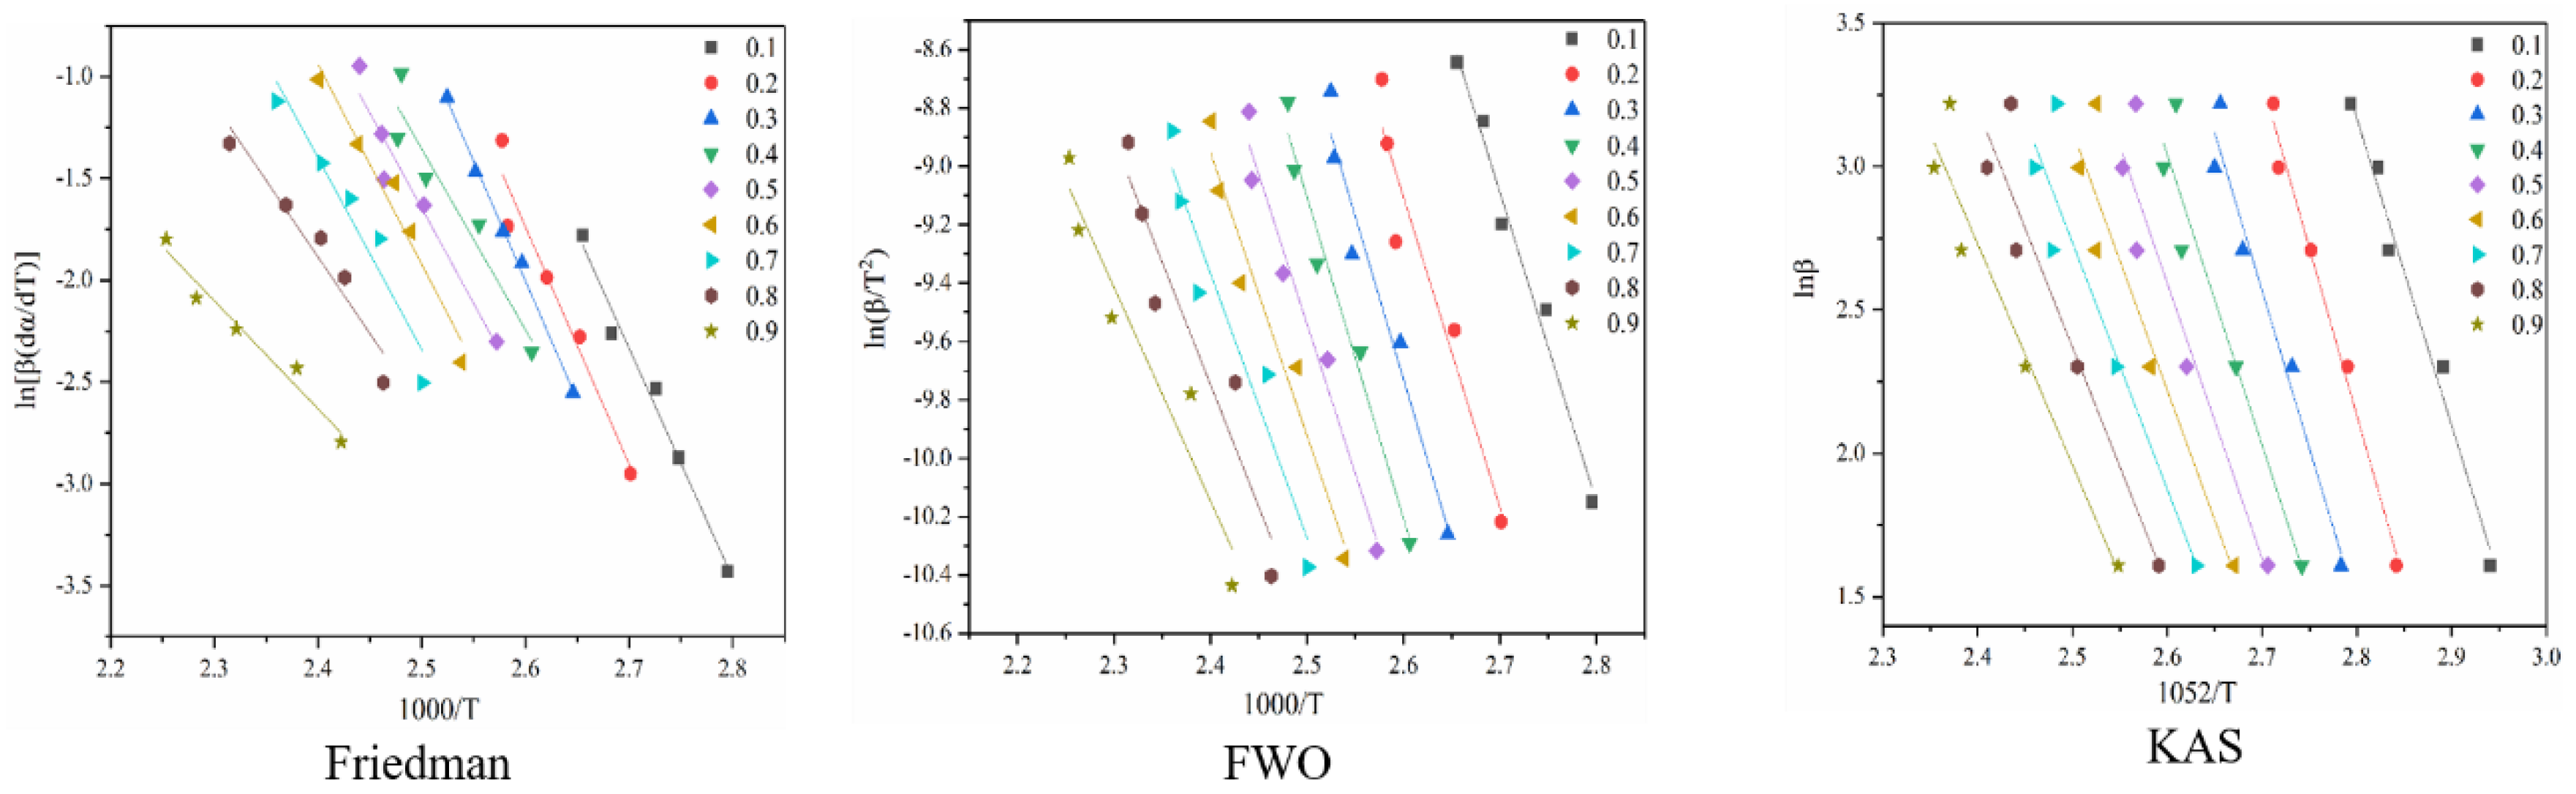
Among them, Formula (5)—Friedman method; Formula (6)—KAS method; Formula (7)—FWO method. Thermogravimetric experiment data are generated into the above four methods: ln beta for 1052/RT, ln beta/T 2 to 1000/RT and ln [beta (𝑑 𝛼 𝑑 𝑇)] of 1000/RT linear fitting curve, respectively. The slope of the fitted curve in the figure a negative number is the E alpha value.
3. Results and Discussion
3.1. Pyrolysis Characteristics of Battery Materials
Spent LIBs mainly contain positive electrode material, negative electrode material, copper foil, aluminum foil, an organic electrolyte and diaphragm and other main substances, so spent LIB materials are a complex mixture; there is a difficult separation in the process of recycling resources. Therefore, our team, combined with the strong inclusivity advantage of pyrometallurgy, proposed a new fire recovery process of spent LIBs. In the process of recycling spent LIBs in fire, you cannot separate the anode and cathode of spent LIBs, but in the process of fire metallurgy, the organic electrolyte and diaphragm in the battery material will crack at a high temperature to produce toxic and harmful substances, so it is necessary to pretreat spent LIB materials before fire metallurgy. At the same time, pyrolysis pretreatment can deal with toxic substances such as organic electrolytes and membranes. Therefore, in this paper, the pyrolysis characteristics of spent LIB materials are deeply studied and analyzed, and the pyrolysis kinetics and pyrolysis products are discussed.
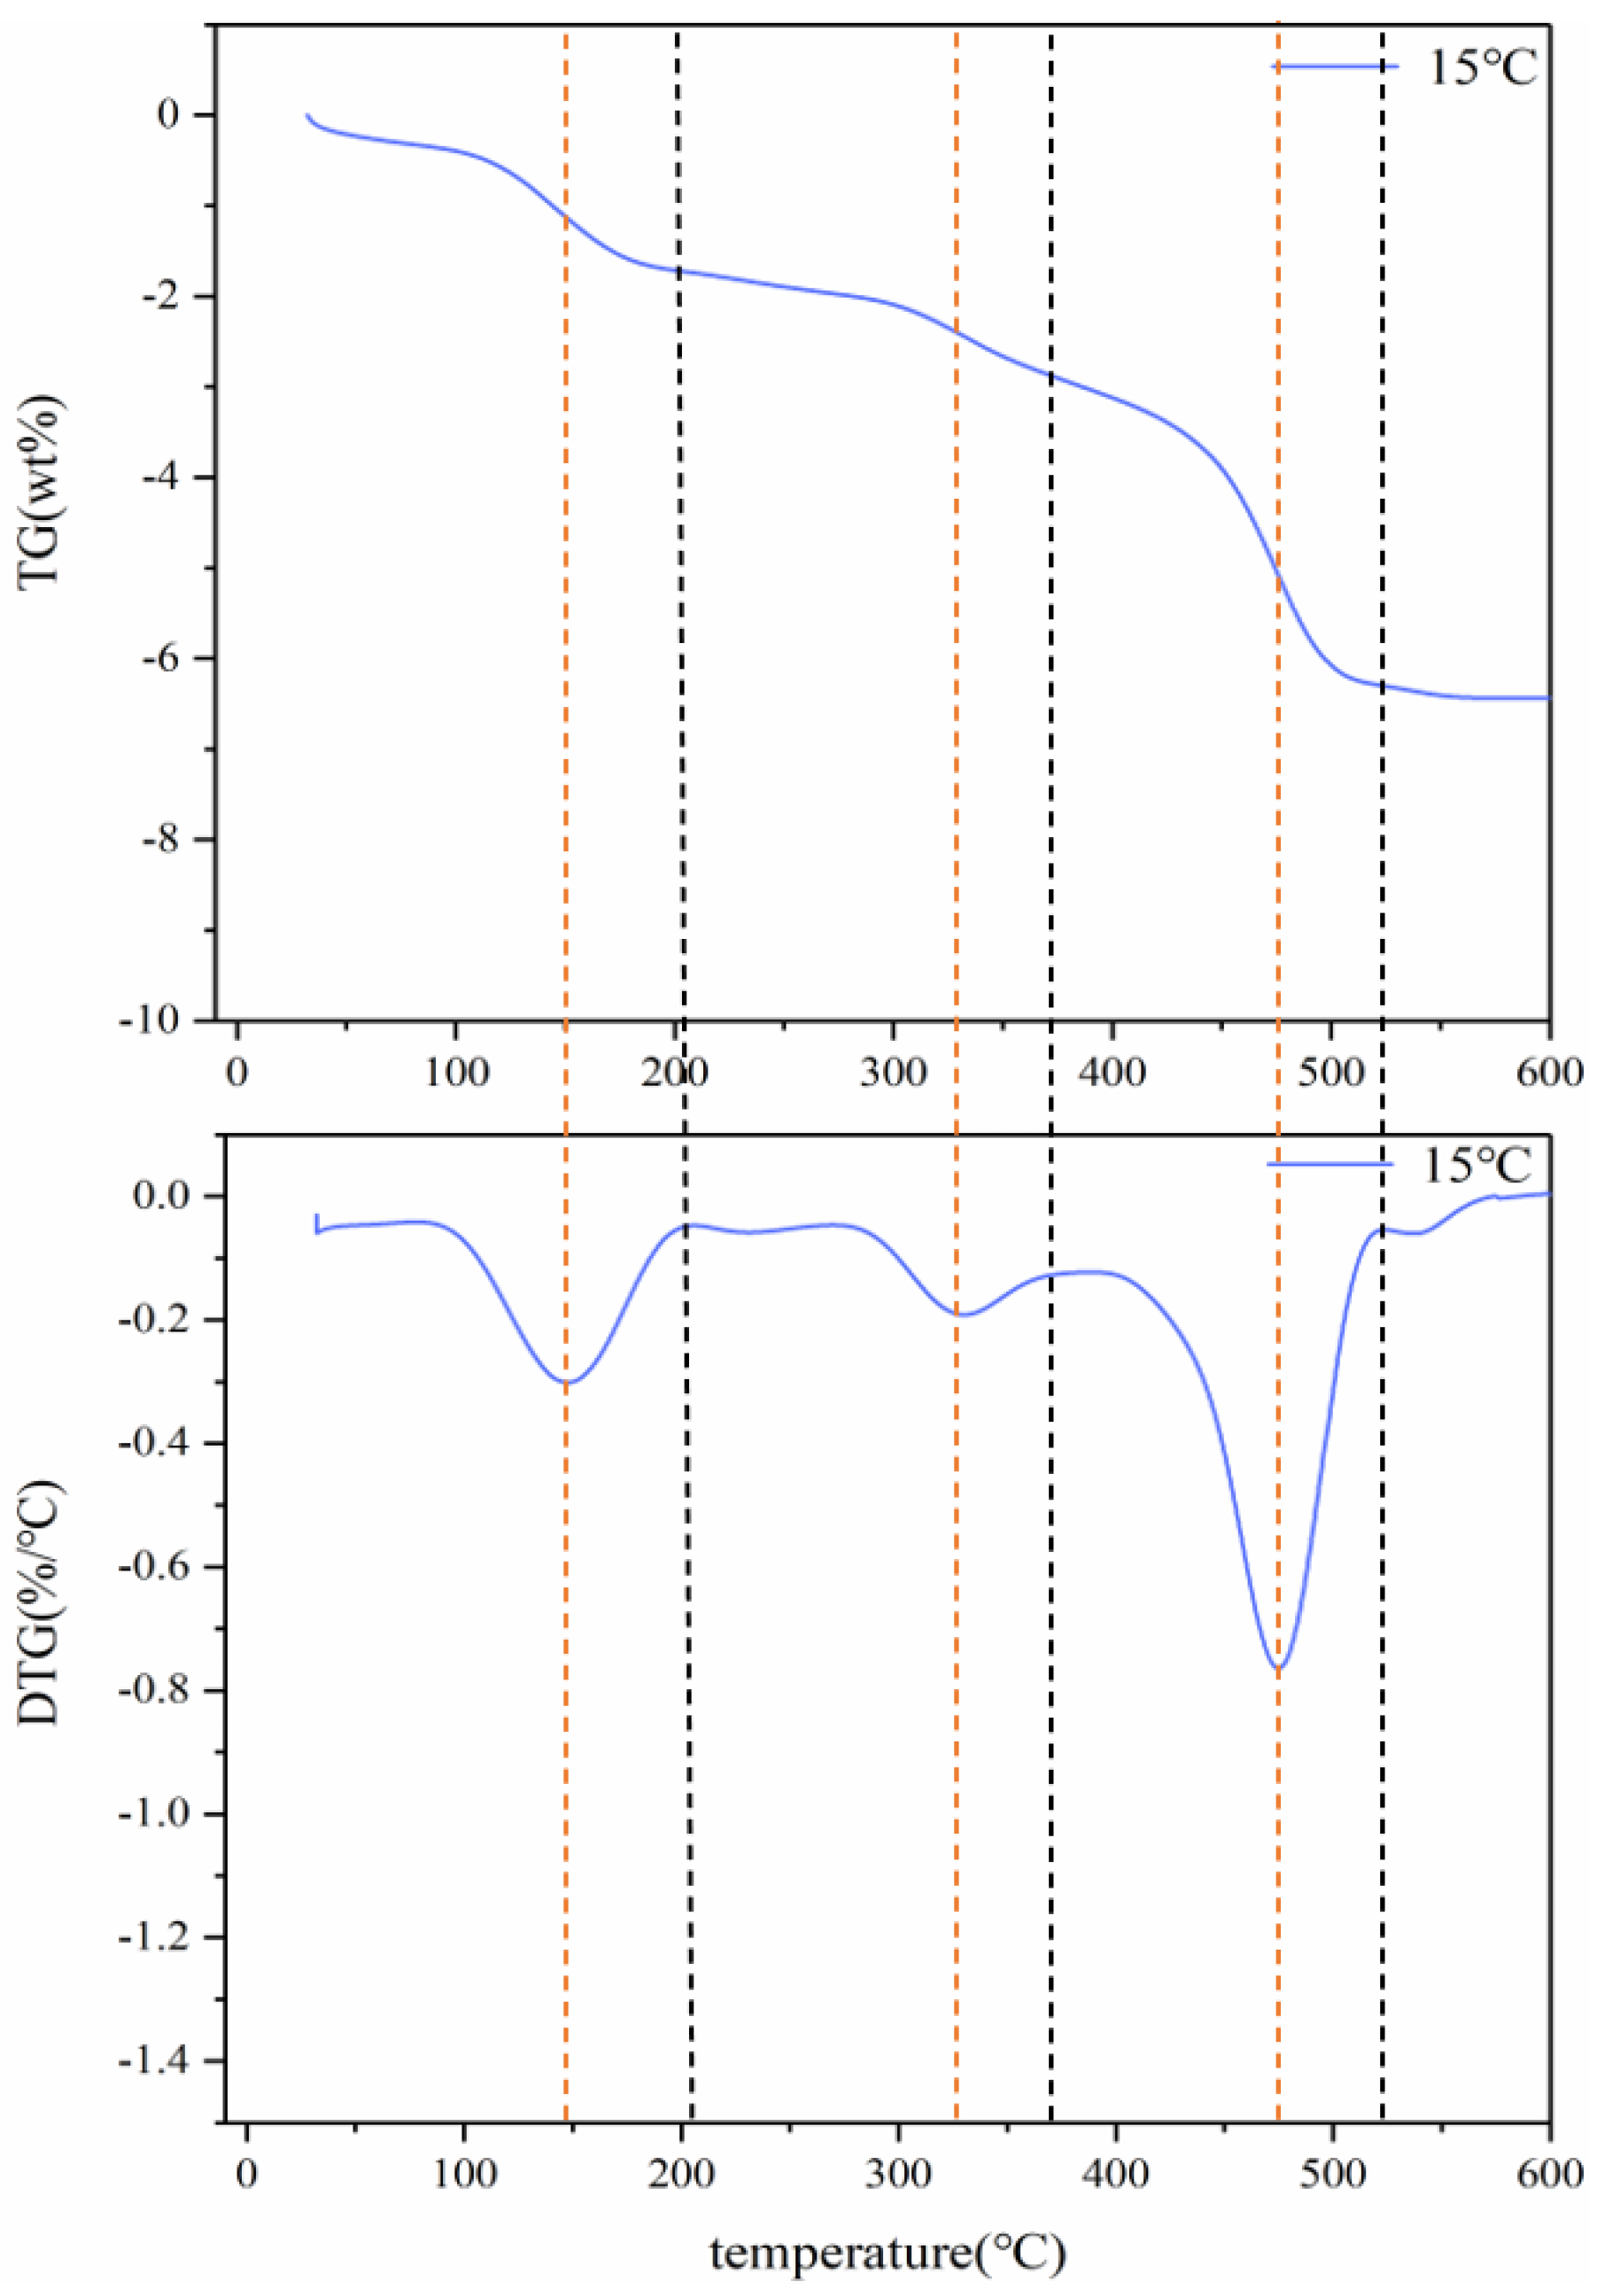
Figure 1 shows the TG and DTG curves of spent LIBs (lithium cobaltate) at a heating rate of 15 °C/min. It can be seen that the pyrolysis process of batteries can be divided into three stages. The first stage occurs at 25–200 °C, which may be due to partial electrolysis at 150 °C of volatilization. The weightlessness rate was 1.7%. The second stage occurs in the temperature range of 275–375 °C, which may be due to the weight loss caused by the decomposition of the diaphragm at around 325 °C, with a weight loss rate of 1.2%. The third stage occurs in the temperature range of 400–520 °C, which may be the decomposition of the organic binder (PVDF) at around 475 °C. The weightlessness rate was 3.3%. Therefore, the kinetic analysis of spent LIB pyrolysis pretreatment is divided into three stages.
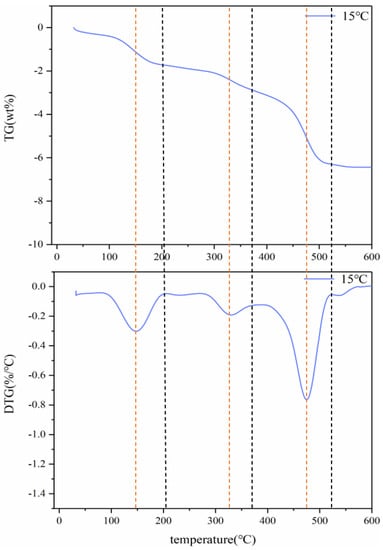
Figure 1.
Thermogravimetric (TG) curves of battery materials at 15 °C.
3.2. Calculation of Activation Energy during the Pyrolysis of Battery Materials
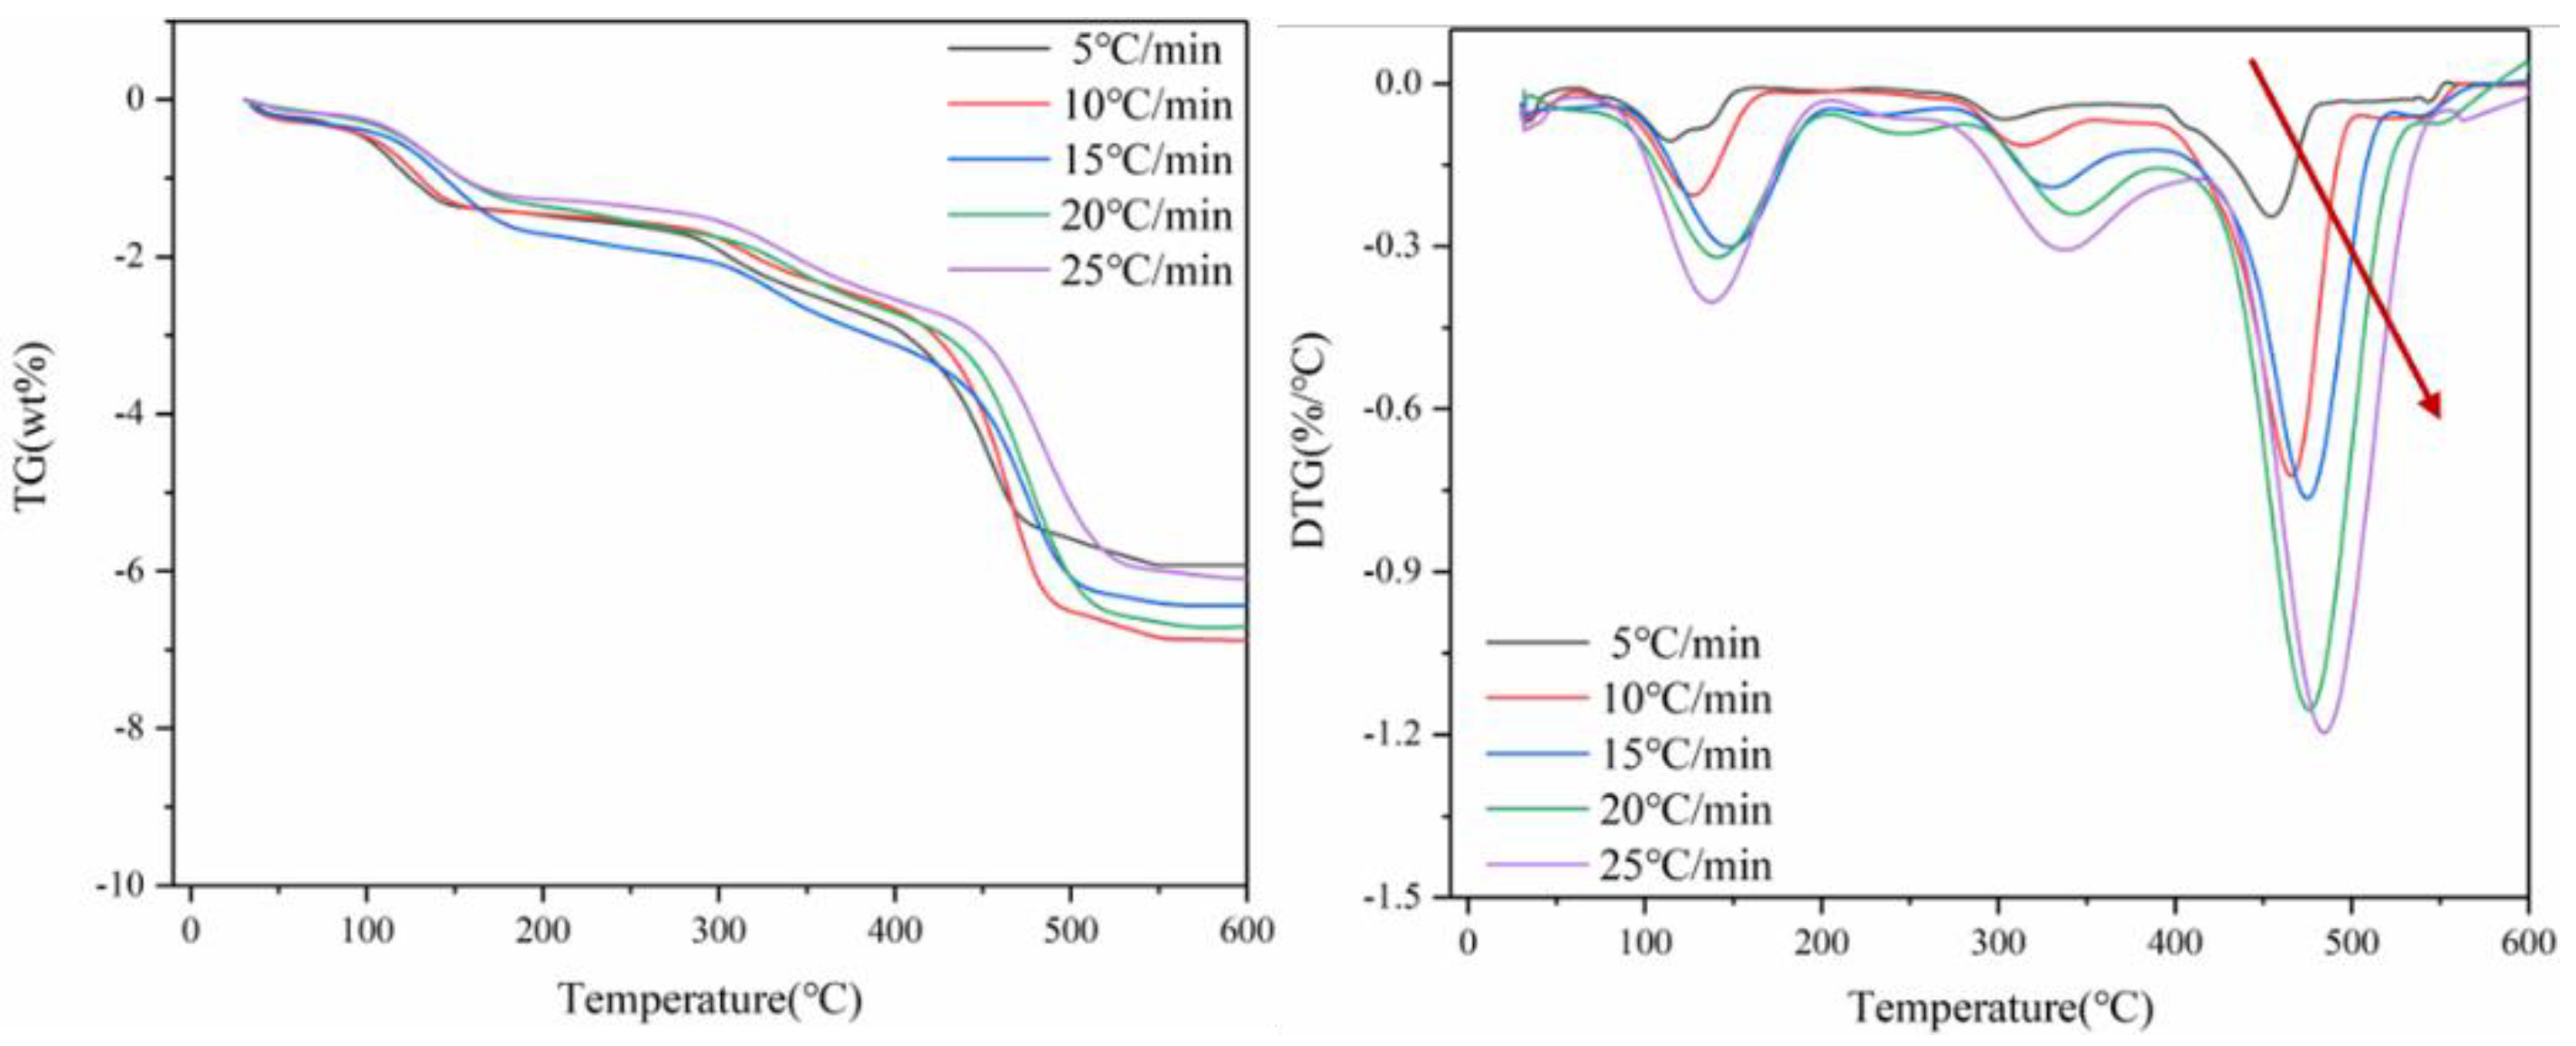
Figure 2 shows TG and DTG curves of thermal decomposition of spent lithium cobaltate battery materials at the heating rate of 5 °C/min, 10 °C/min, 15 °C/min, 20 °C/min and 25 °C/min. The whole pyrolysis process is carried out in a nitrogen atmosphere. According to the DTG curve in Figure 2, heat transfer efficiency is different at different heating rates, and the heating rate has a great influence on the thermogravimetric behavior of positive electrode materials. With the acceleration of the heating rate, the TG peak shifts to the high-temperature region. Because the duration of the low-temperature period is shorter when the heating rate is faster, the organic matter enters the high-temperature period without time to decompose, and the volatilization or decomposition reaction occurs at the high-temperature stage. It can be seen from Figure 2 that the TG curves of the four heating rates have the same trend, and the whole process can be divided into three weightlessness intervals.
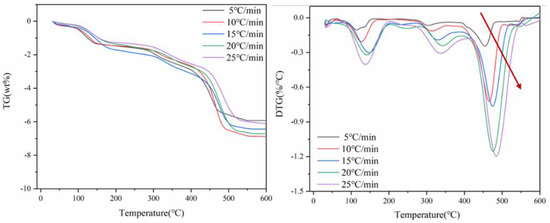
Figure 2.
Curves of TG and DTG of battery materials at four heating rates.
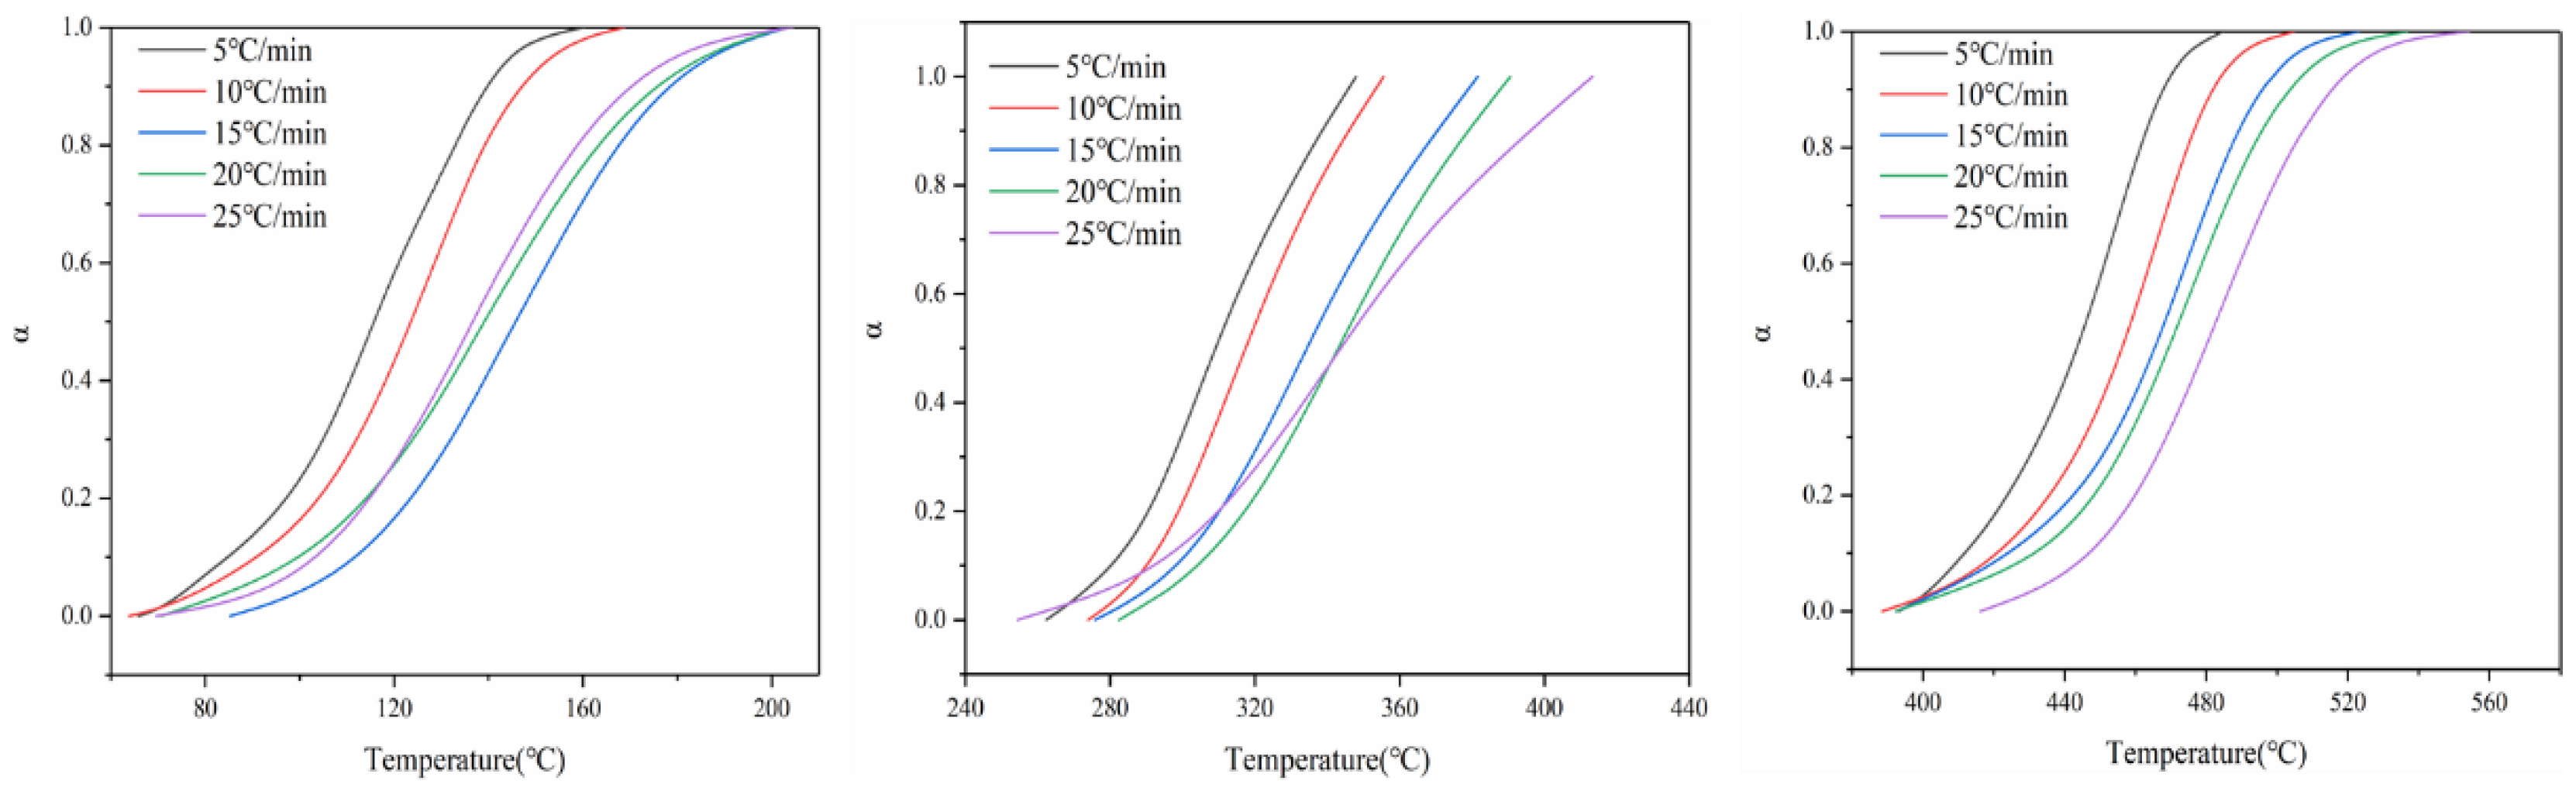
Figure 3 shows the relationship between the conversion rate of battery materials at three thermal decomposition stages and the change in temperature at different heating rates. As can be seen from Figure 3, under different heating rates, the conversion rate of the three thermal decomposition stages of battery materials is basically consistent with the change trend in temperature; that is, the conversion rate increases with the increase in temperature. At the same time, the change in heating rate also has a certain impact on the relationship curve between the conversion rate and temperature. With the increase in heating rate, the conversion curve moves to the high-temperature side; that is, the temperature at which the battery material reaches the same conversion rate moves to the high-temperature side.
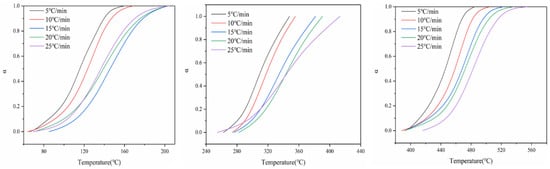
Figure 3.
Conversion curves of three stages of battery material pyrolysis.
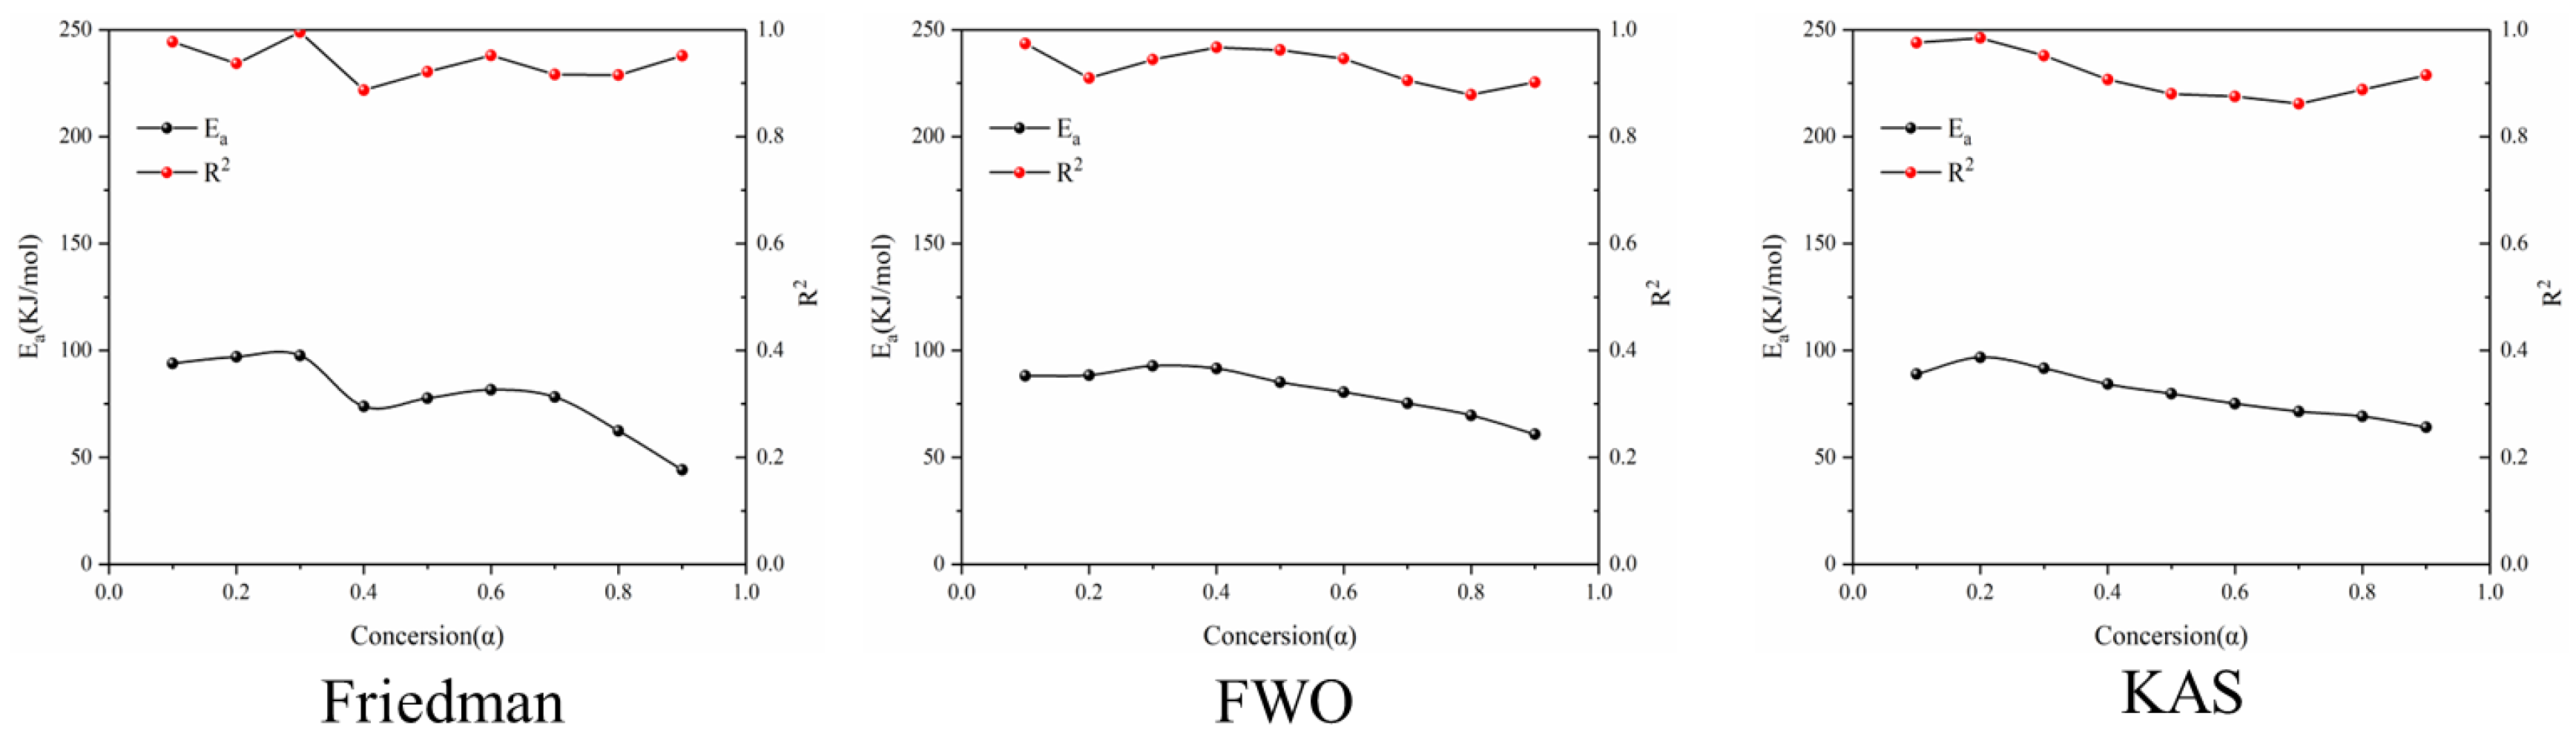
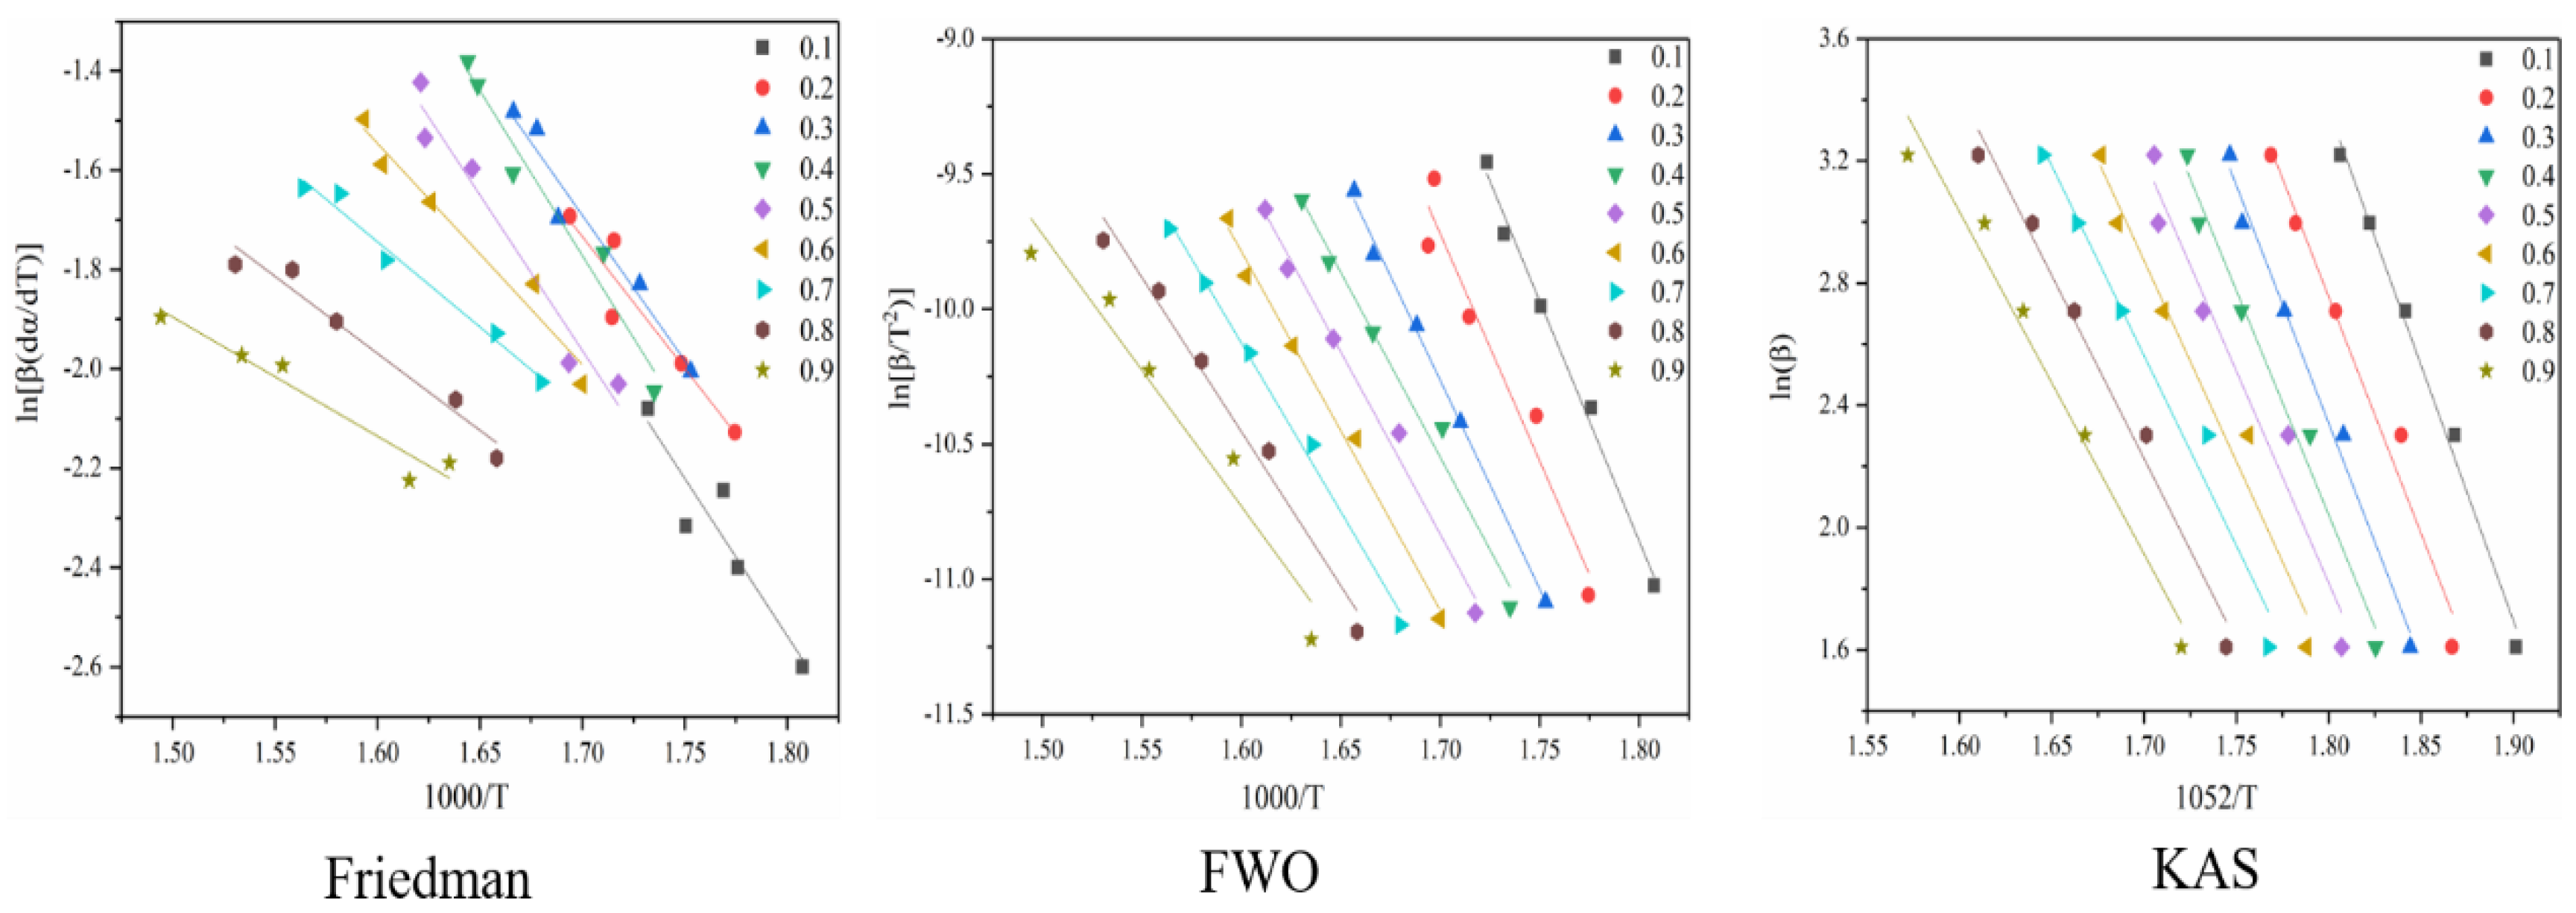
Figure 4 shows the reaction at the first stage of battery thermal decomposition. The fitting curve of activation energy is calculated under the three model-free methods, and the negative slope of the curve is the value of E-α. Figure 4 shows the E-α values in the range of α (0.1~0.9) at different thermal decomposition stages calculated by different nonmodel methods. There is a slight difference between the different nonmodel methods due to differences in approximation and mathematical equations.
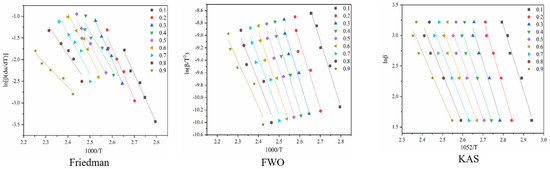
Figure 4.
Conversion curve of the first stage of battery material pyrolysis.
It can be seen from Figure 5 that the average apparent activation energy calculated by the FWO and KAS methods has a similar trend, and the average apparent activation energy calculated by the FWO and KAS methods is 81.35 and 80.11 kJ/mol, respectively. With the increase in α, the Eα firstly decreases and then increases. However, the E-α calculated by the Friedman method does not conform to this trend. The reason is that the Friedman method requires numerical differentiation when analyzing thermogravimetric data, which is an inevitable error.
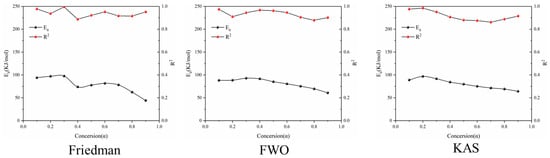
Figure 5.
Ea and R2 of three model-free methods in the first stage of battery material pyrolysis.
According to the R2 values listed in Table 1, it can be seen that the R2 values determined by Friedman, FWO and KAS are 0.93, 0.93 and 0.91, respectively. Comparing the three nonmodel methods, it is found that although the Friedman method has a high degree of fit, it fluctuates greatly, while the dynamics curves determined by the FWO and KAS methods show the same trend, and R2 is very close, showing good correlation compared with the Friedman method.

Table 1.
Ea and R2 of three model-free methods at different conversion rates in the first stage of pyrolysis kinetics of battery materials.
Figure 6 shows the reaction at the second stage of battery thermal decomposition. The fitting curve of activation energy is calculated under the three model-free methods, and the negative slope of the curve is the value of E-α. The figure shows the E-α values in the range of α (0.1~0.9) at different thermal decomposition stages calculated by the different nonmodel methods. It can be seen from Figure 7 that the average apparent activation energy calculated by the FWO and KAS methods has a similar trend, and the average apparent activation energy calculated by the FWO and KAS methods is 114.9 and 115.4 kJ/mol, respectively. With the increase in α, the Eα firstly decreases and then increases. However, the E-α calculated by the Friedman method does not conform to this trend. The reason is that the Friedman method requires numerical differentiation when analyzing thermogravimetric data, which is an inevitable error.
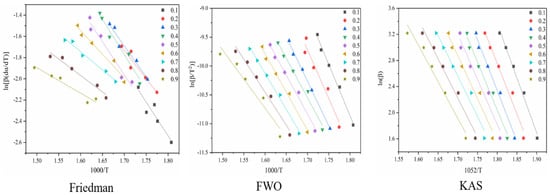
Figure 6.
Conversion curve of the second stage of battery material pyrolysis.
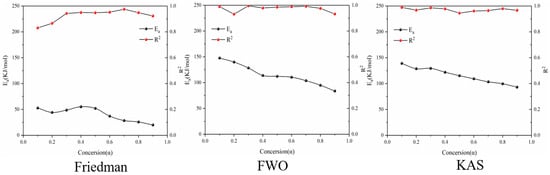
Figure 7.
Ea and R2 of three model-free methods in the second stage of battery material pyrolysis.
According to the R2 values listed in Table 2, it can be seen that the R2 values determined by Friedman, FWO and KAS are 0.92, 0.97 and 0.97, respectively. Comparing the three nonmodel methods, it is found that although the Friedman method has a high degree of fit, it fluctuates greatly, while the dynamics curves determined by the FWO and KAS methods show the same trend and R2 is very close, showing a good correlation compared with the Friedman method.
Table 2.
Ea and R2 of three model-free methods at different conversion rates in the second stage of pyrolysis kinetics of battery materials.
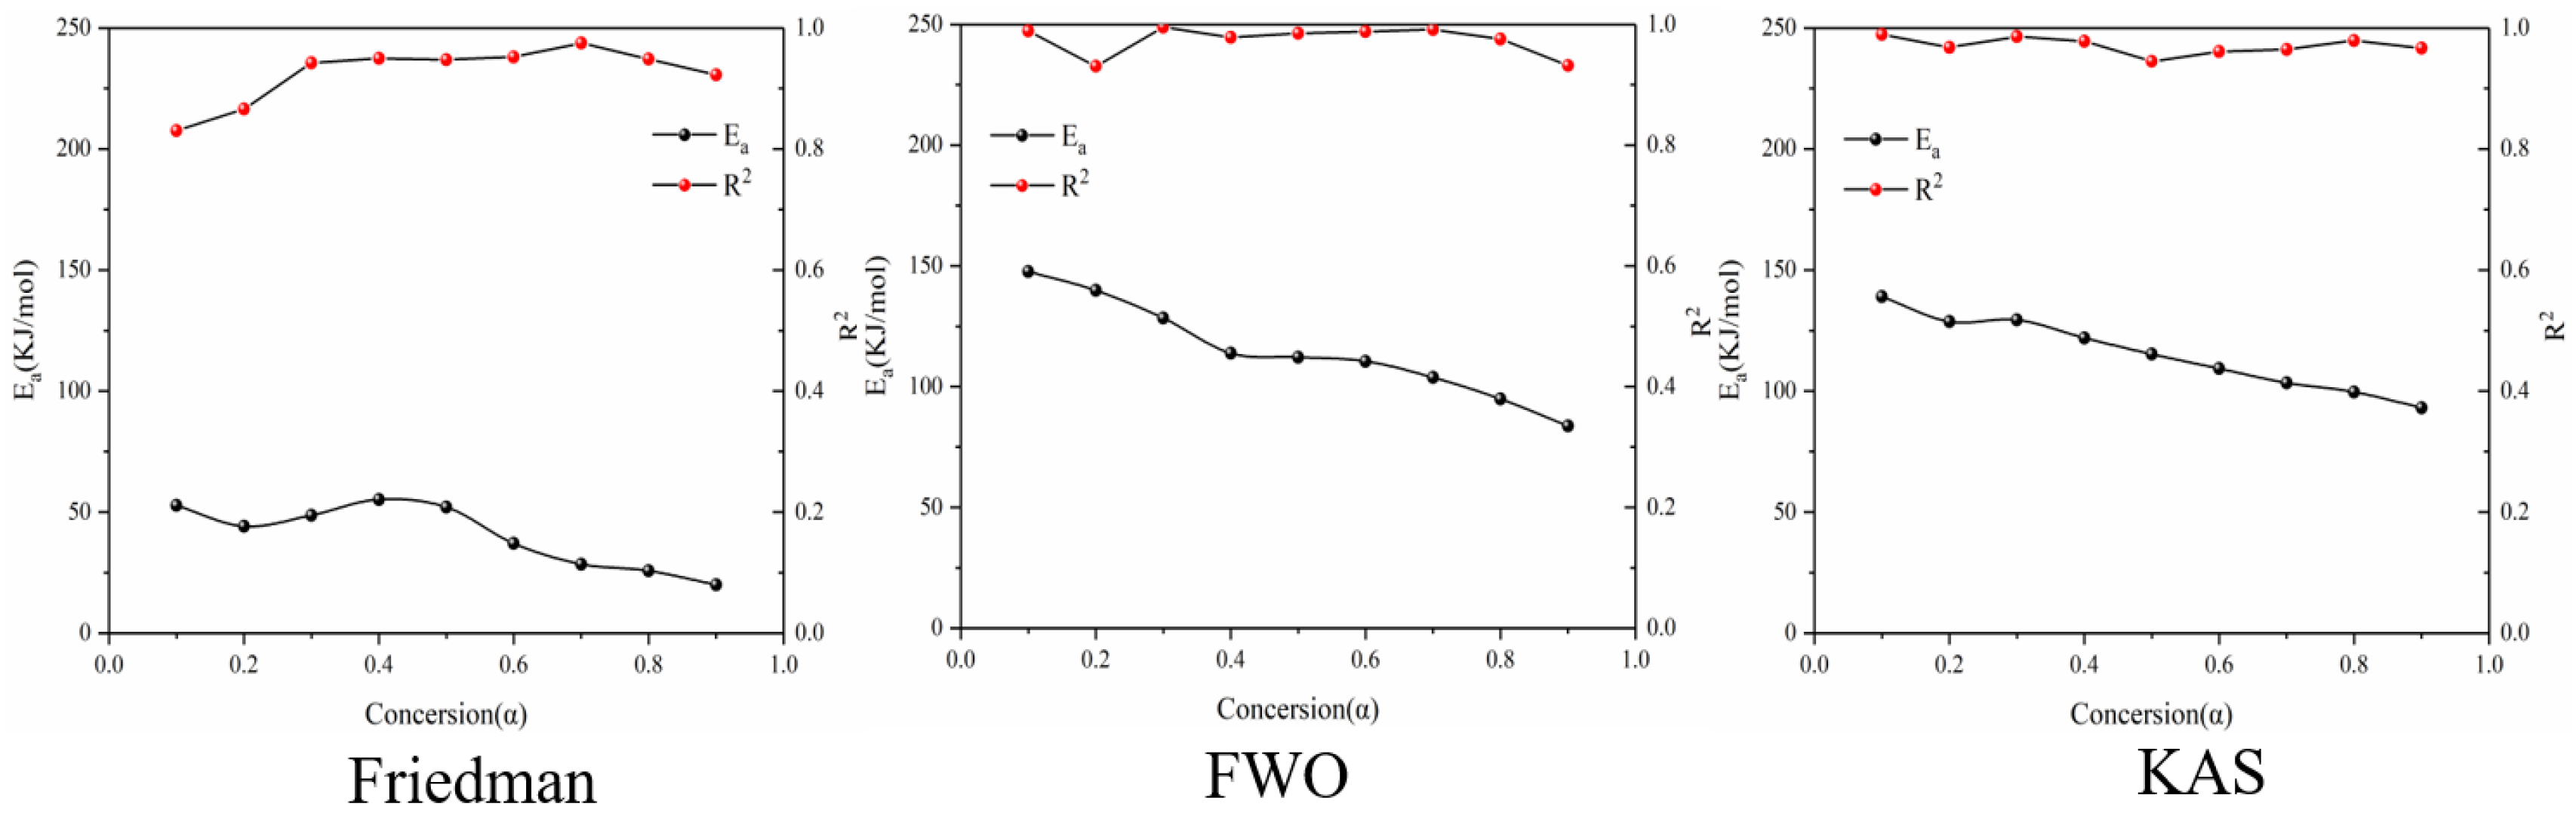
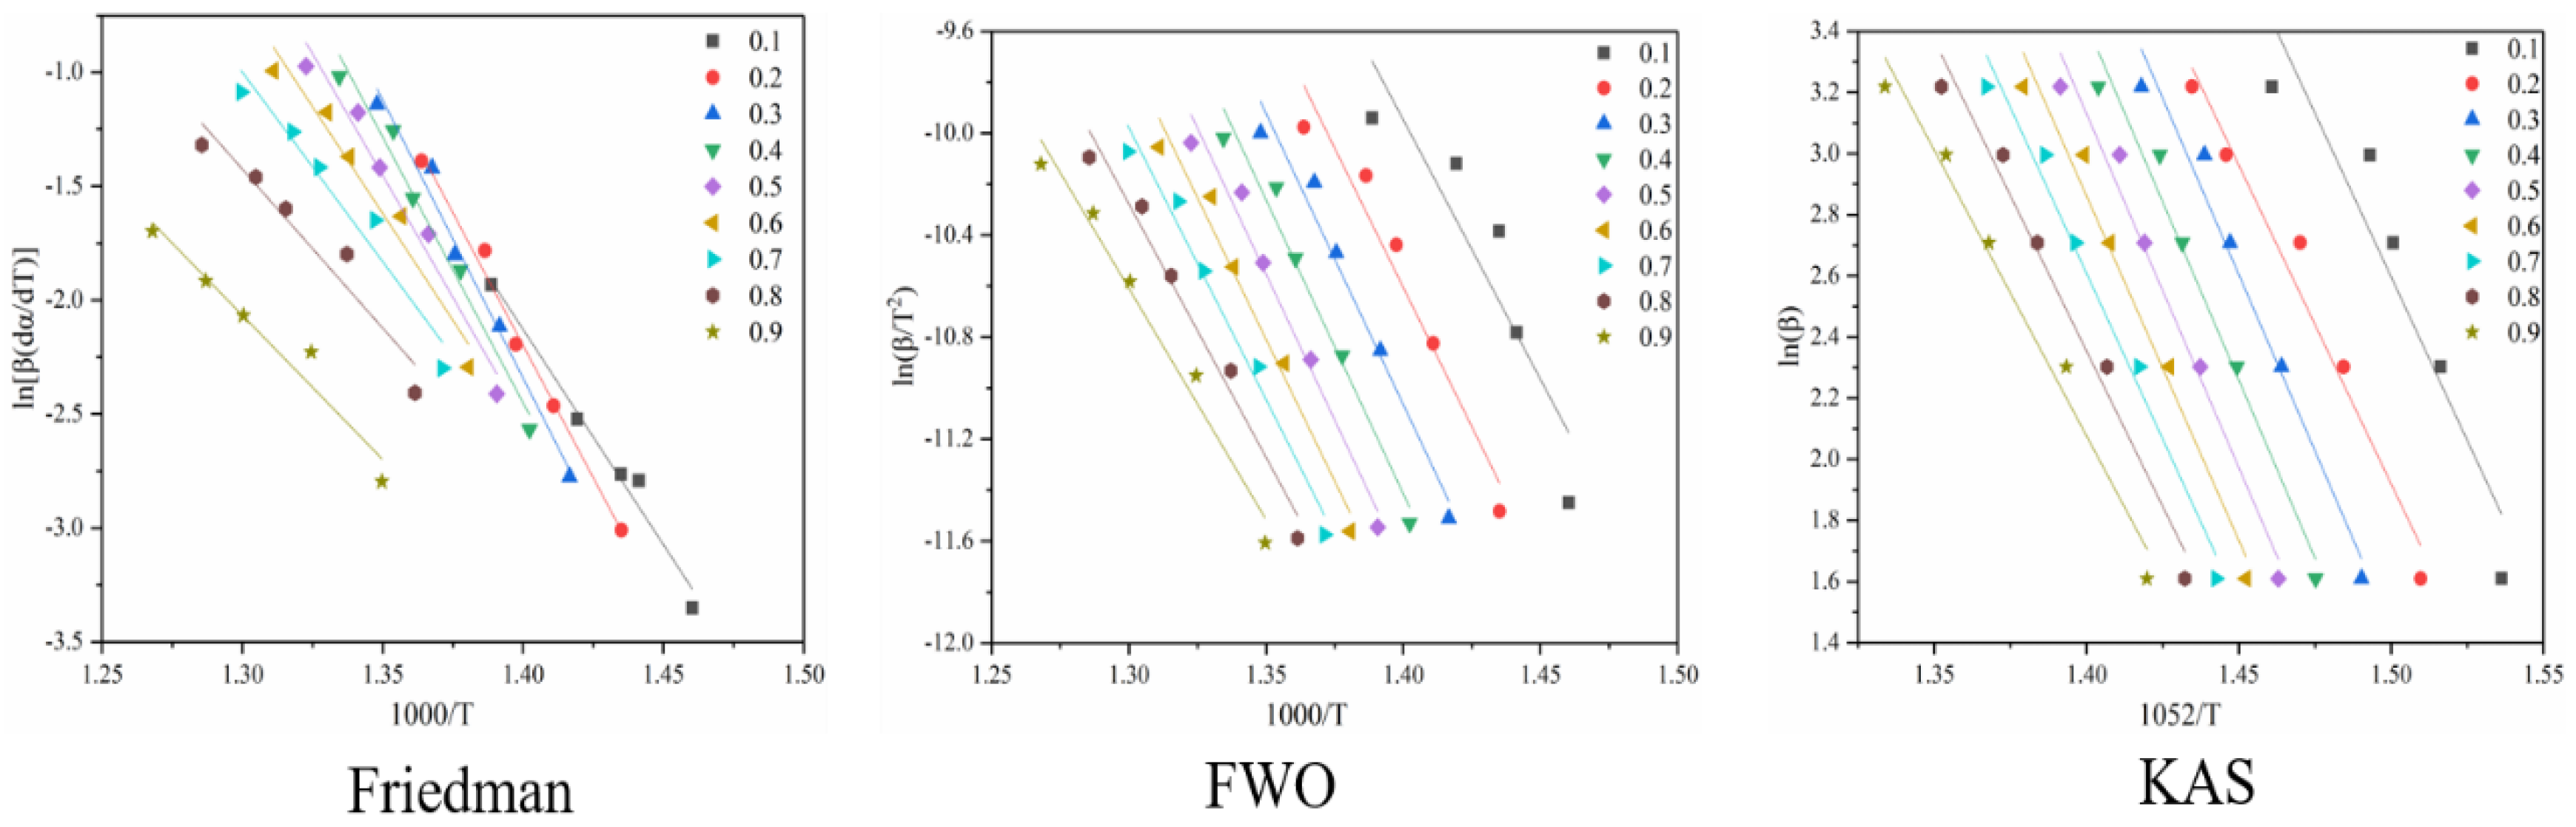
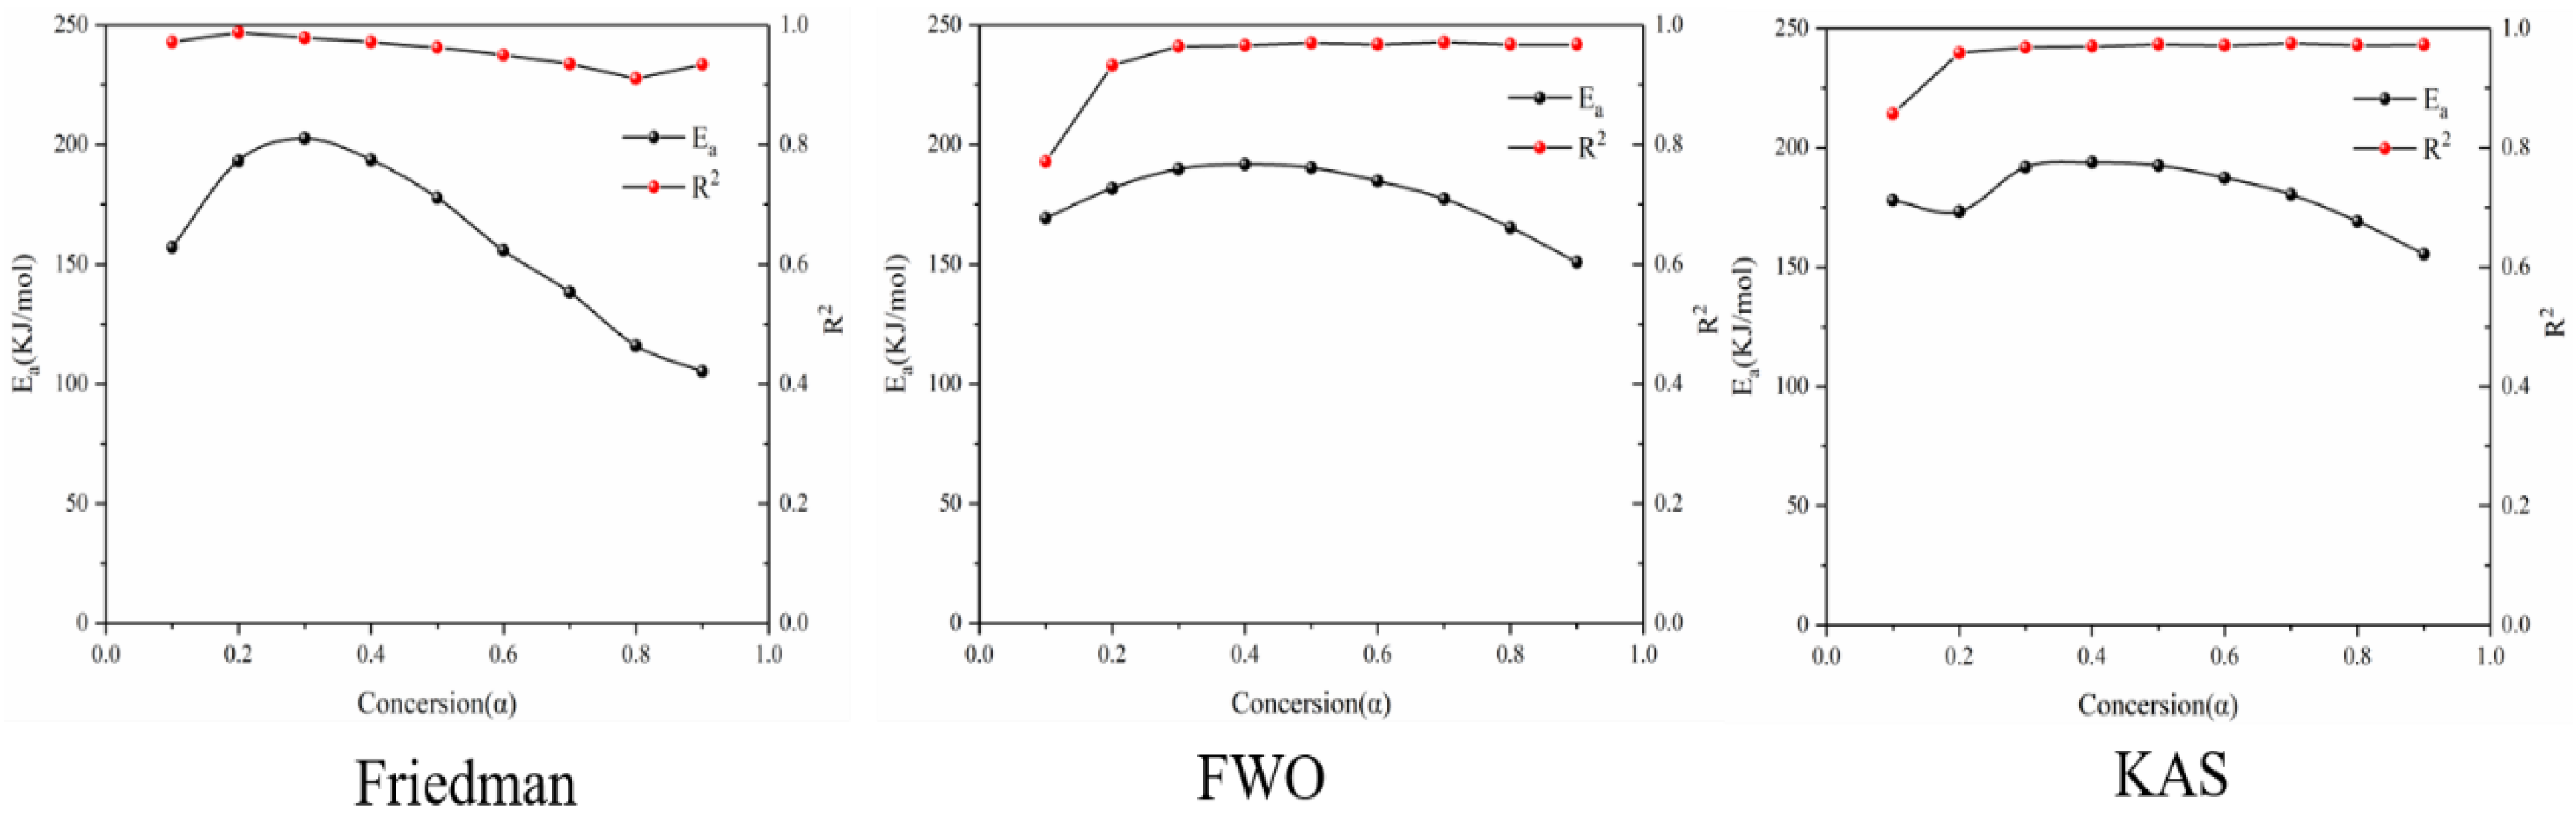
Figure 8 shows the reaction at the third stage of battery thermal decomposition. The fitting curve of activation energy is calculated under the three model-free methods, and the negative slope of the curve is the value of E-α. The figure shows the E-α values in the range of α (0.1~0.9) at different thermal decomposition stages calculated by different nonmodel methods. There is a slight difference between the different nonmodel methods due to differences in approximation and mathematical equations. It can be seen from Figure 9 that the average apparent activation energy calculated by the FWO and KAS methods has a similar trend, and the average apparent activation energy calculated by the FWO and KAS methods is 177.9 and 180.2 kJ/mol, respectively. With the increase in α, the Eα firstly decreases and then increases. However, the E-α calculated by the Friedman method does not conform to this trend. The reason is that the Friedman method requires numerical differentiation when analyzing thermogravimetric data, which is an inevitable error.
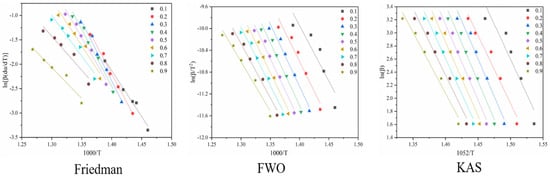
Figure 8.
Conversion curve of the second stage of battery material pyrolysis.
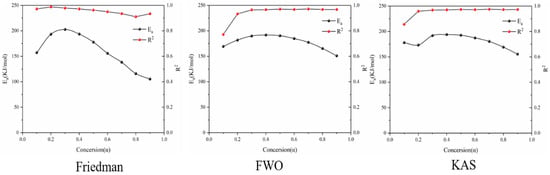
Figure 9.
Ea and R2 of three model-free methods in the second stage of battery material pyrolysis.
According to the R2 values listed in Table 3, it can be seen that R2 values determined by Friedman, FWO and KAS are 0.95, 0.94 and 0.95, respectively. Comparing the three nonmodel methods, it is found that although the Friedman method has a high degree of fit, it fluctuates greatly, while the dynamics curves determined by the FWO and KAS methods show the same trend and R2 is very close, showing a good correlation compared with the Friedman method.
Table 3.
Ea and R2 of three model-free methods at different conversion rates in the third stage of pyrolysis kinetics of battery materials.
Three model-free methods—Friedman, FWO and KAS—were used to calculate the activation energy curves for the three reaction stages. By comparing the three nonmodel methods of dynamics, it is found that although the Friedman method has a high degree of fit, it fluctuates greatly, while the dynamics curves determined by the FWO and KAS methods show the same trend and the R2 is very close, showing a good correlation compared with the Friedman method. Therefore, the FWO method is considered to be the best method to calculate the activation energy of the three-stage pyrolysis of battery materials.
3.3. Analysis of Pyrolysis Products of Battery Materials
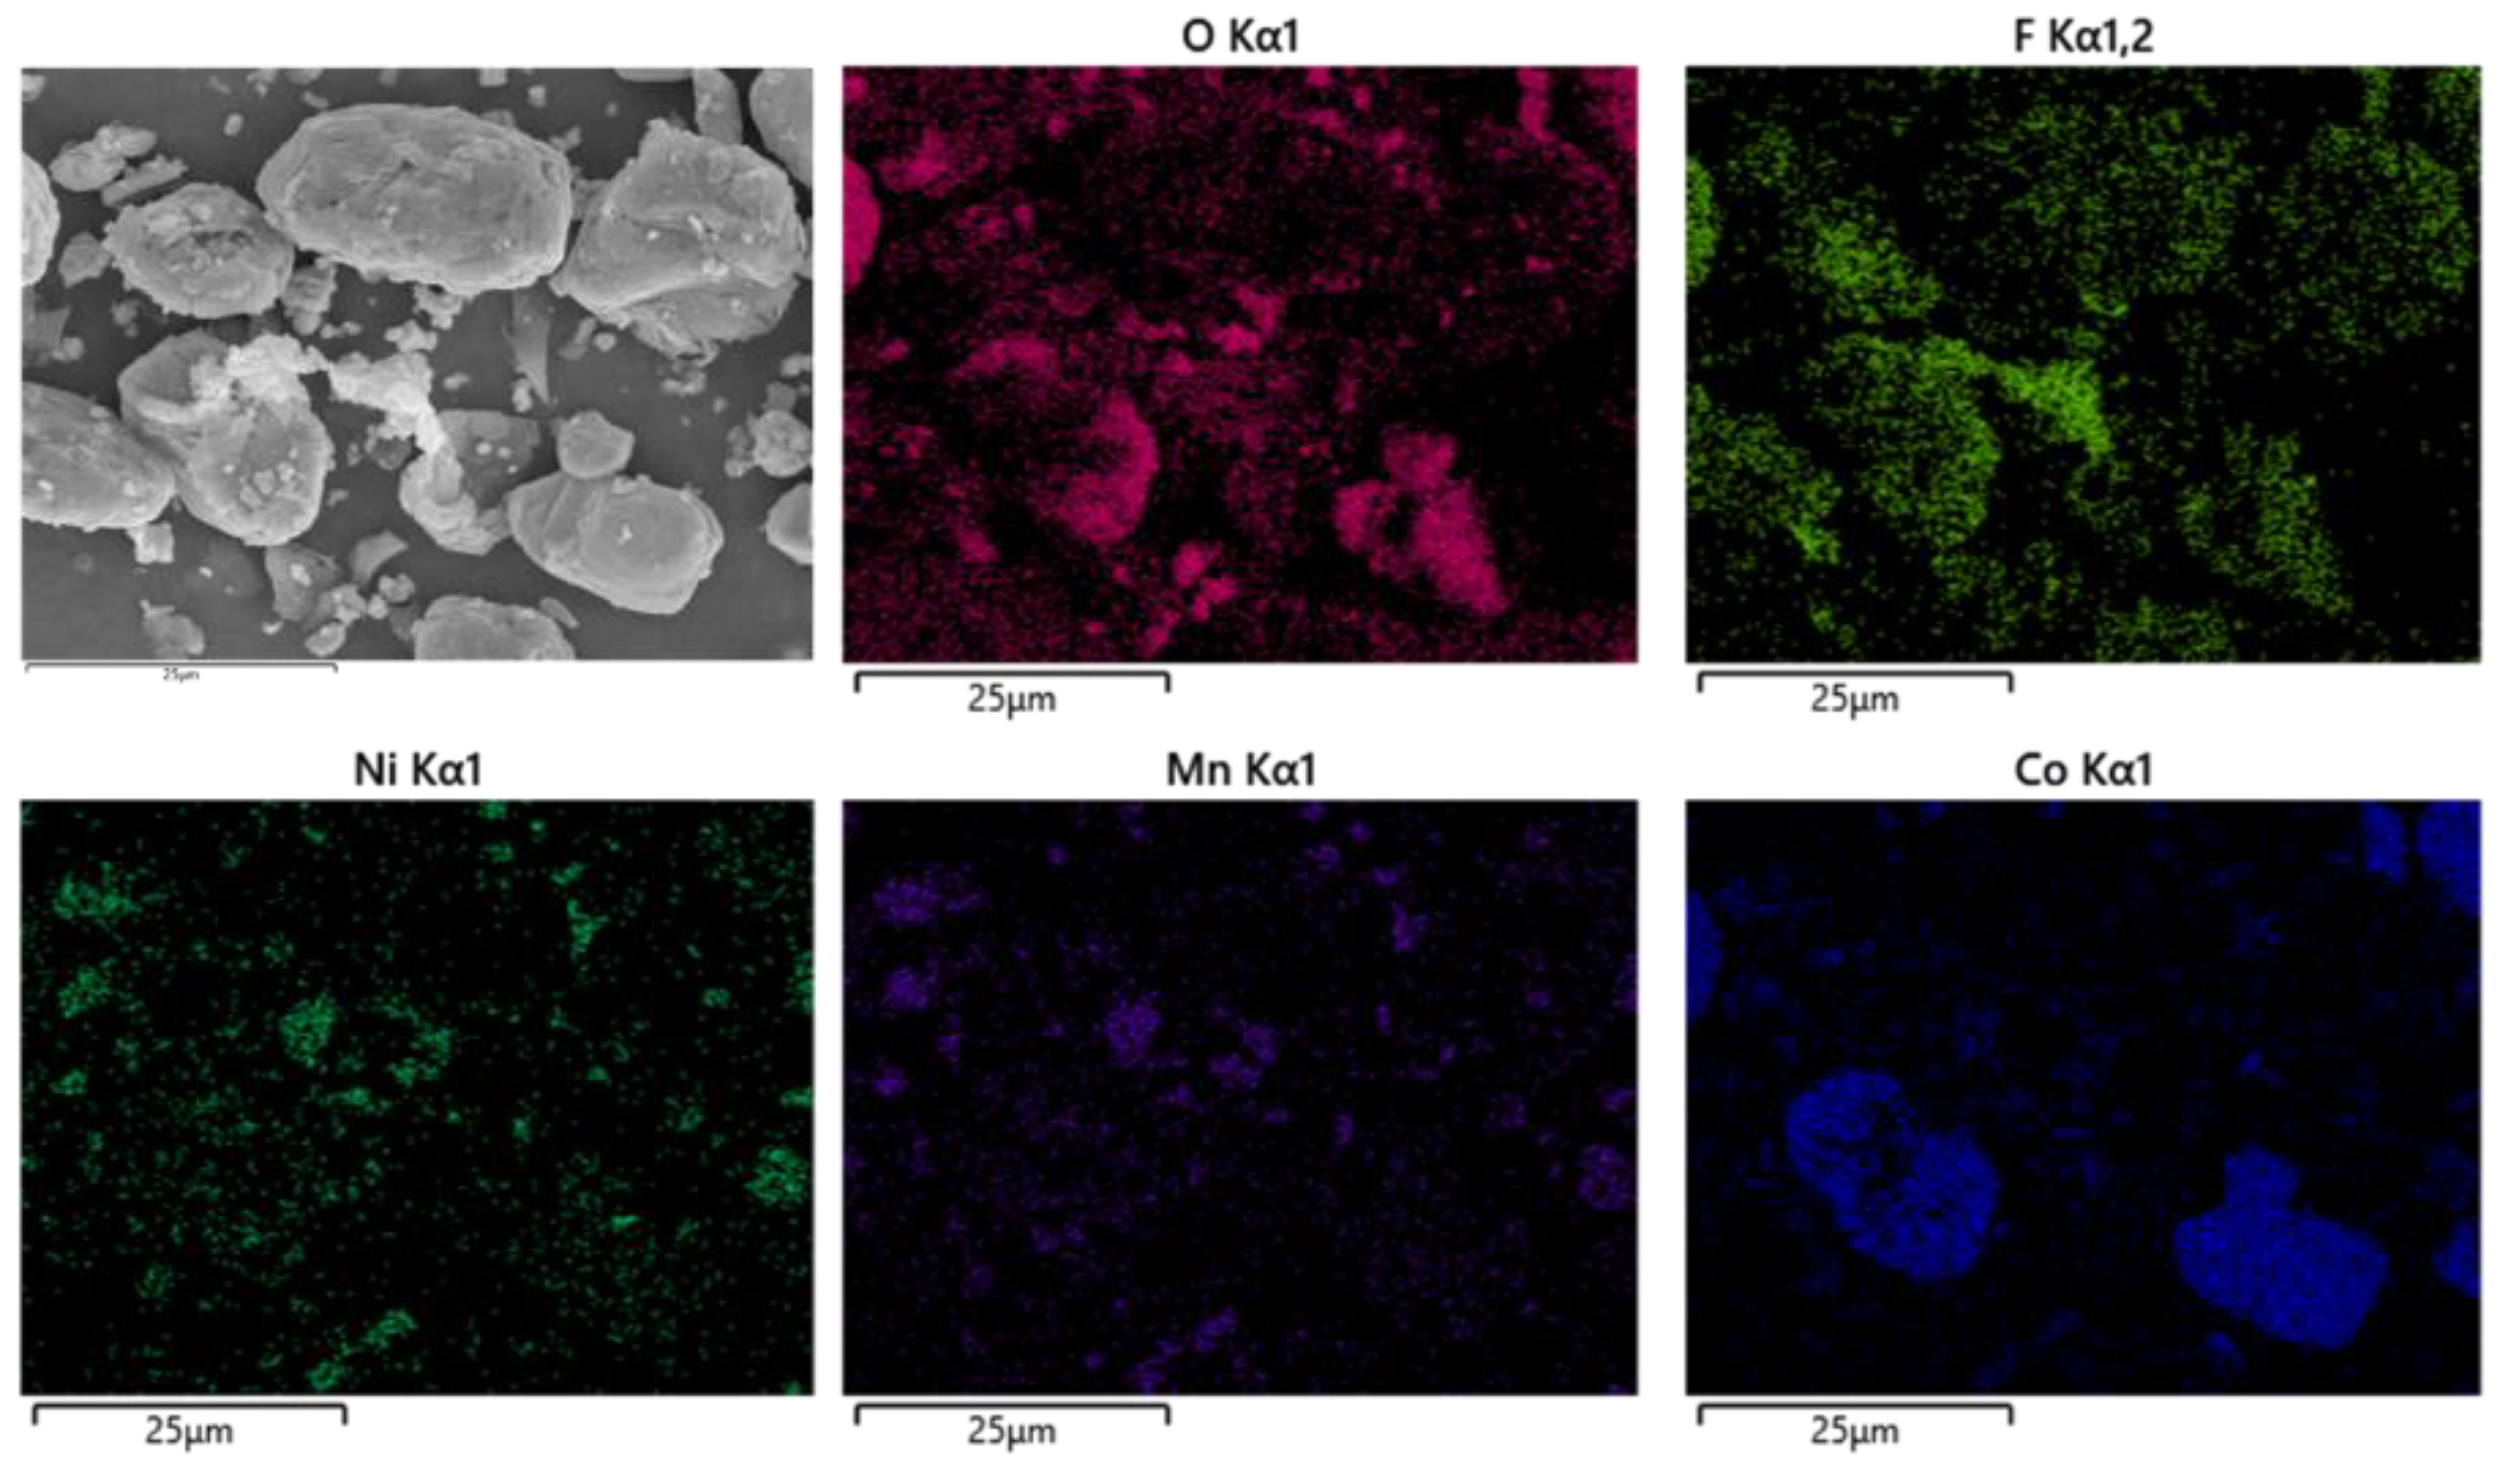
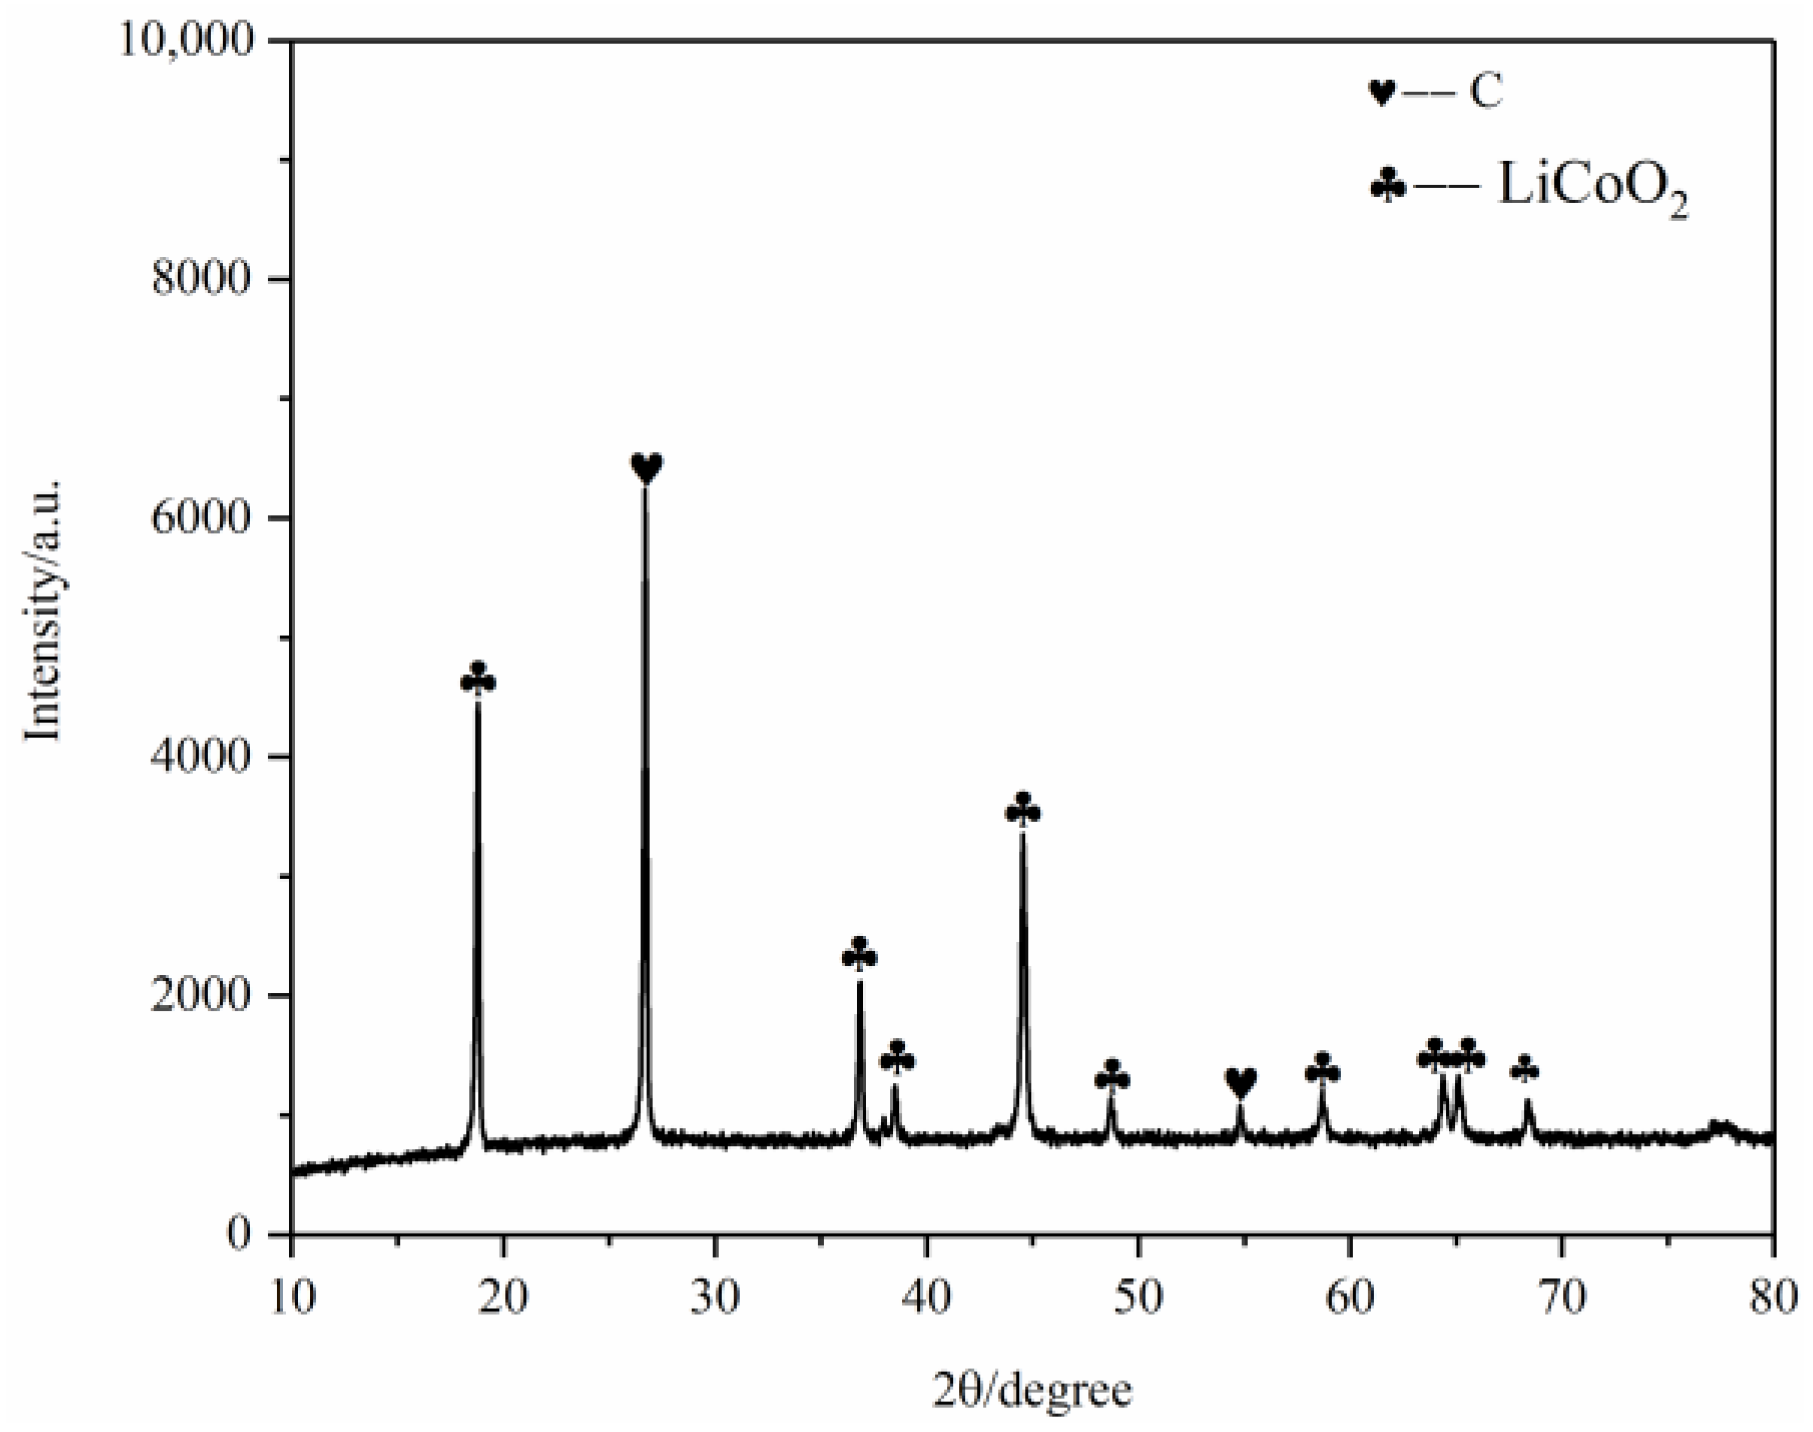
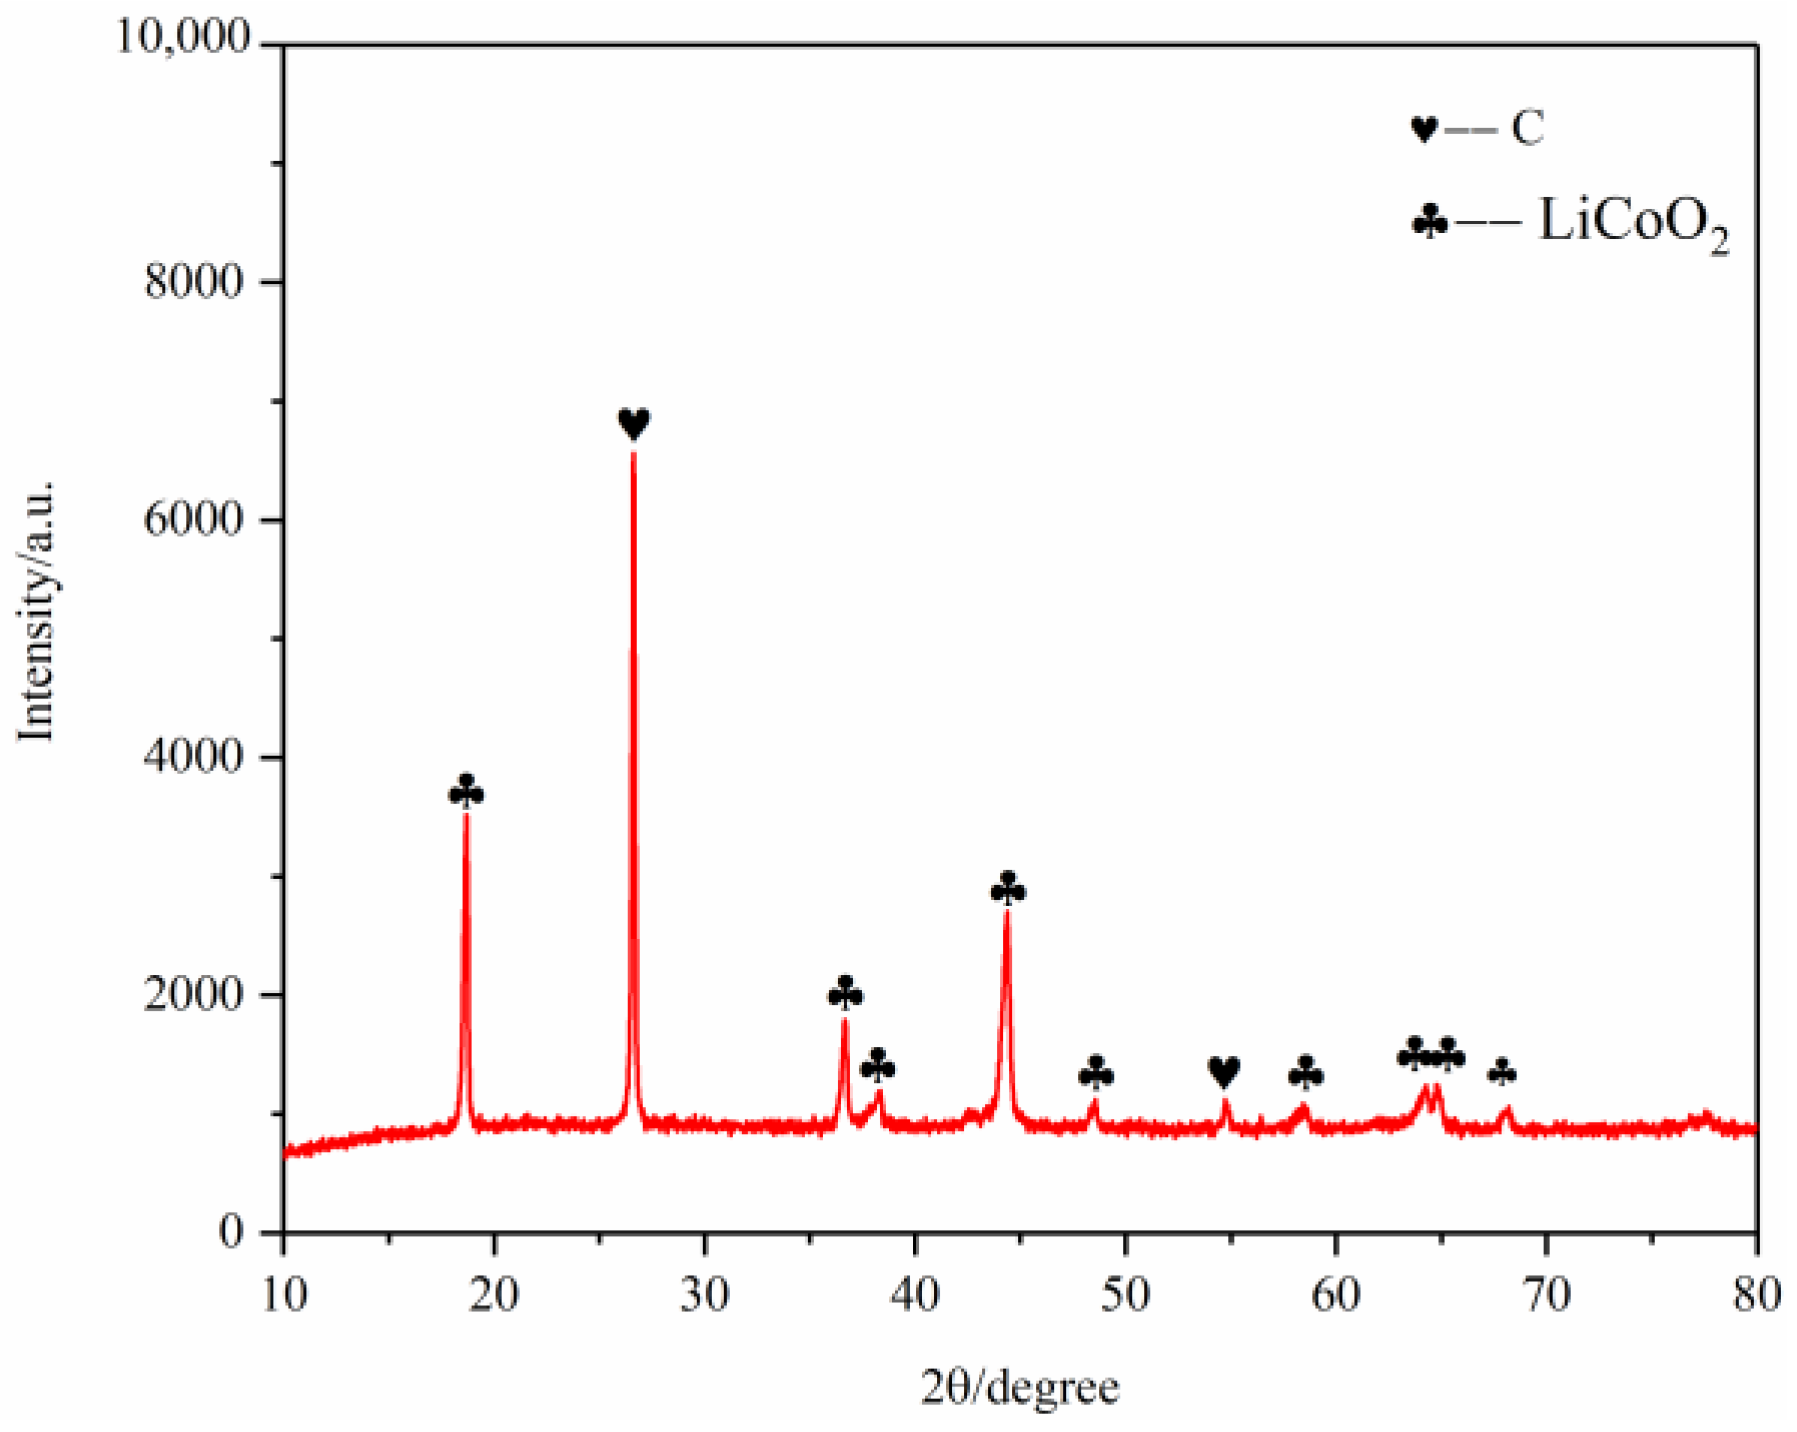
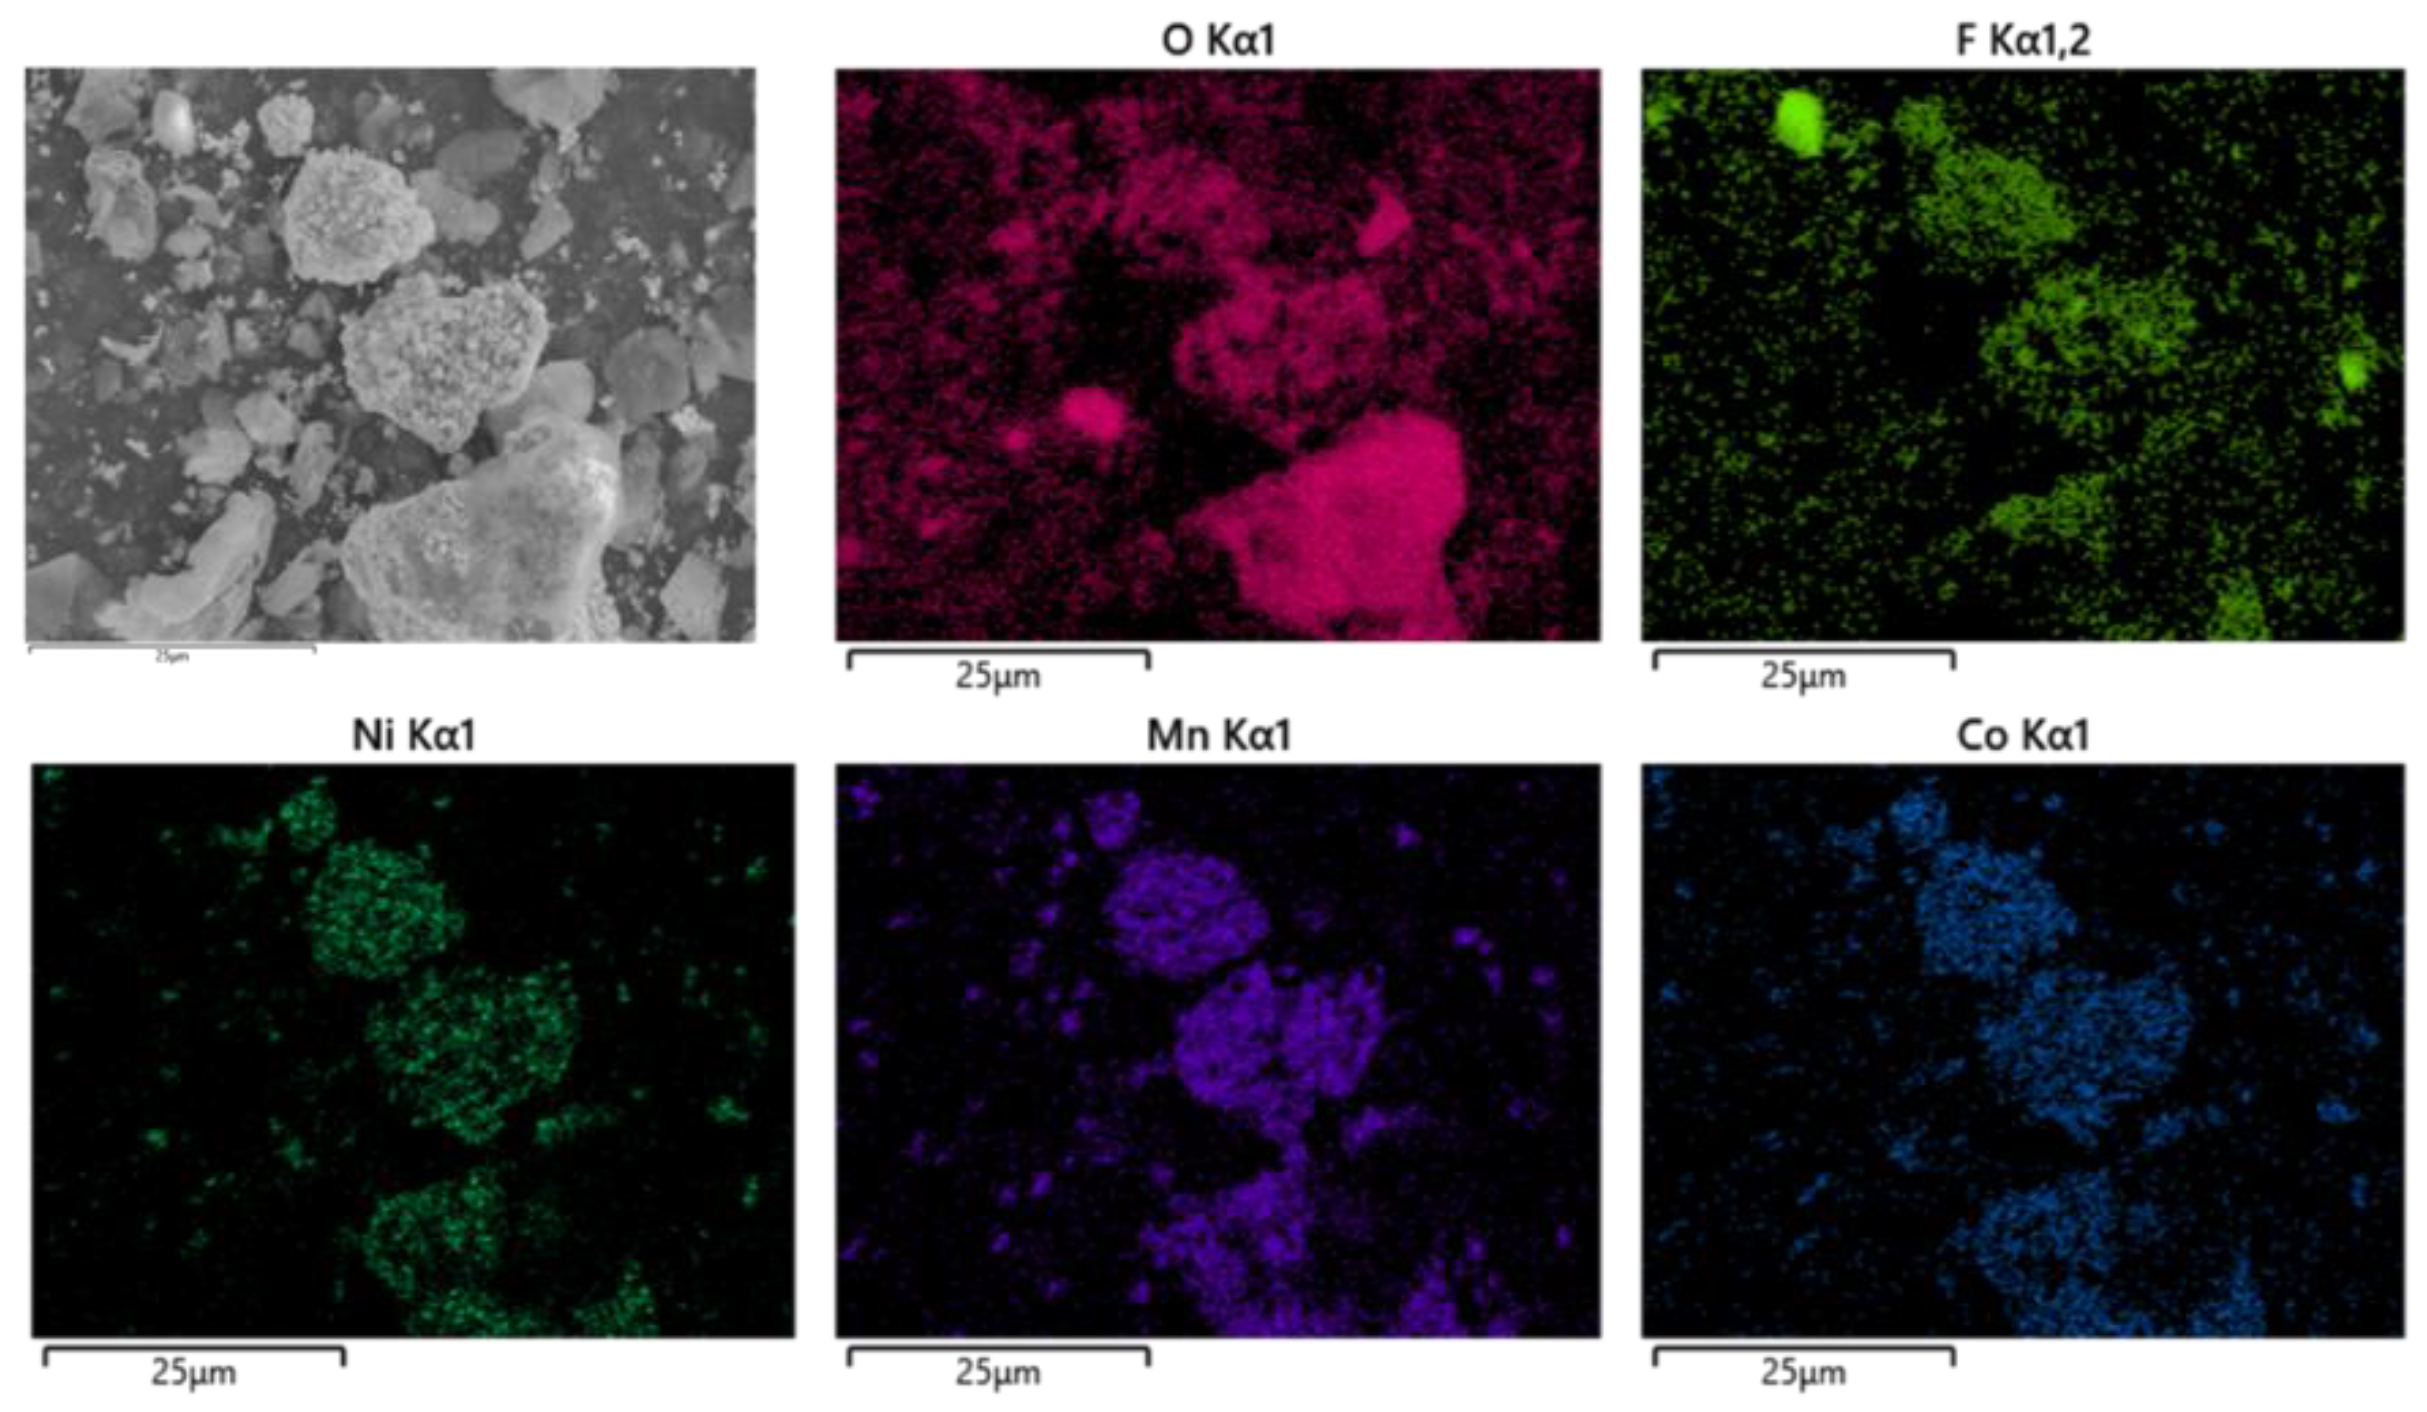
First, the battery materials that were not pyrolyzed were broken and then analyzed by SEM, as shown in Figure 10. The results showed that elements Ni and Mn were combined together, Co was well aggregated and F was dispersed on each particle. At the same time, the battery material was tested by XRD to analyze its main phase. The results are shown in Figure 11. The XRD results show that the main phases of the battery material are C and Li2CoO2.
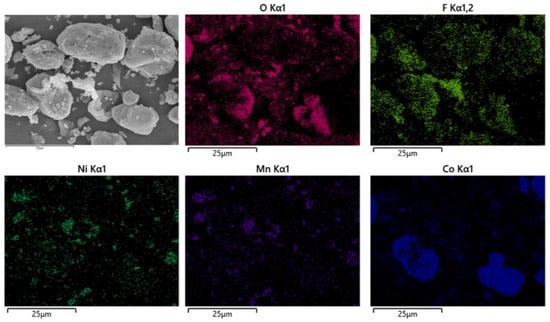
Figure 10.
Scanning electron microscopy of nonpyrolyzed battery materials.
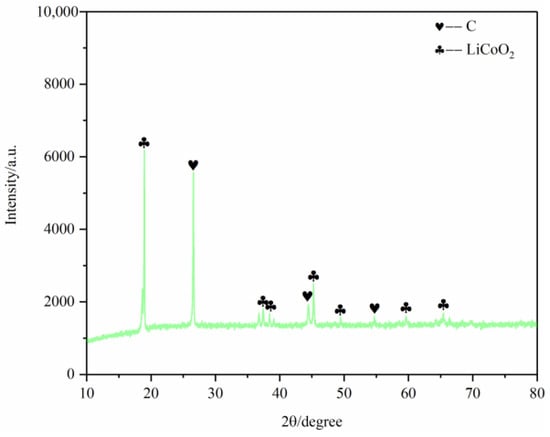
Figure 11.
SEM of nonpyrolyzed battery materials.
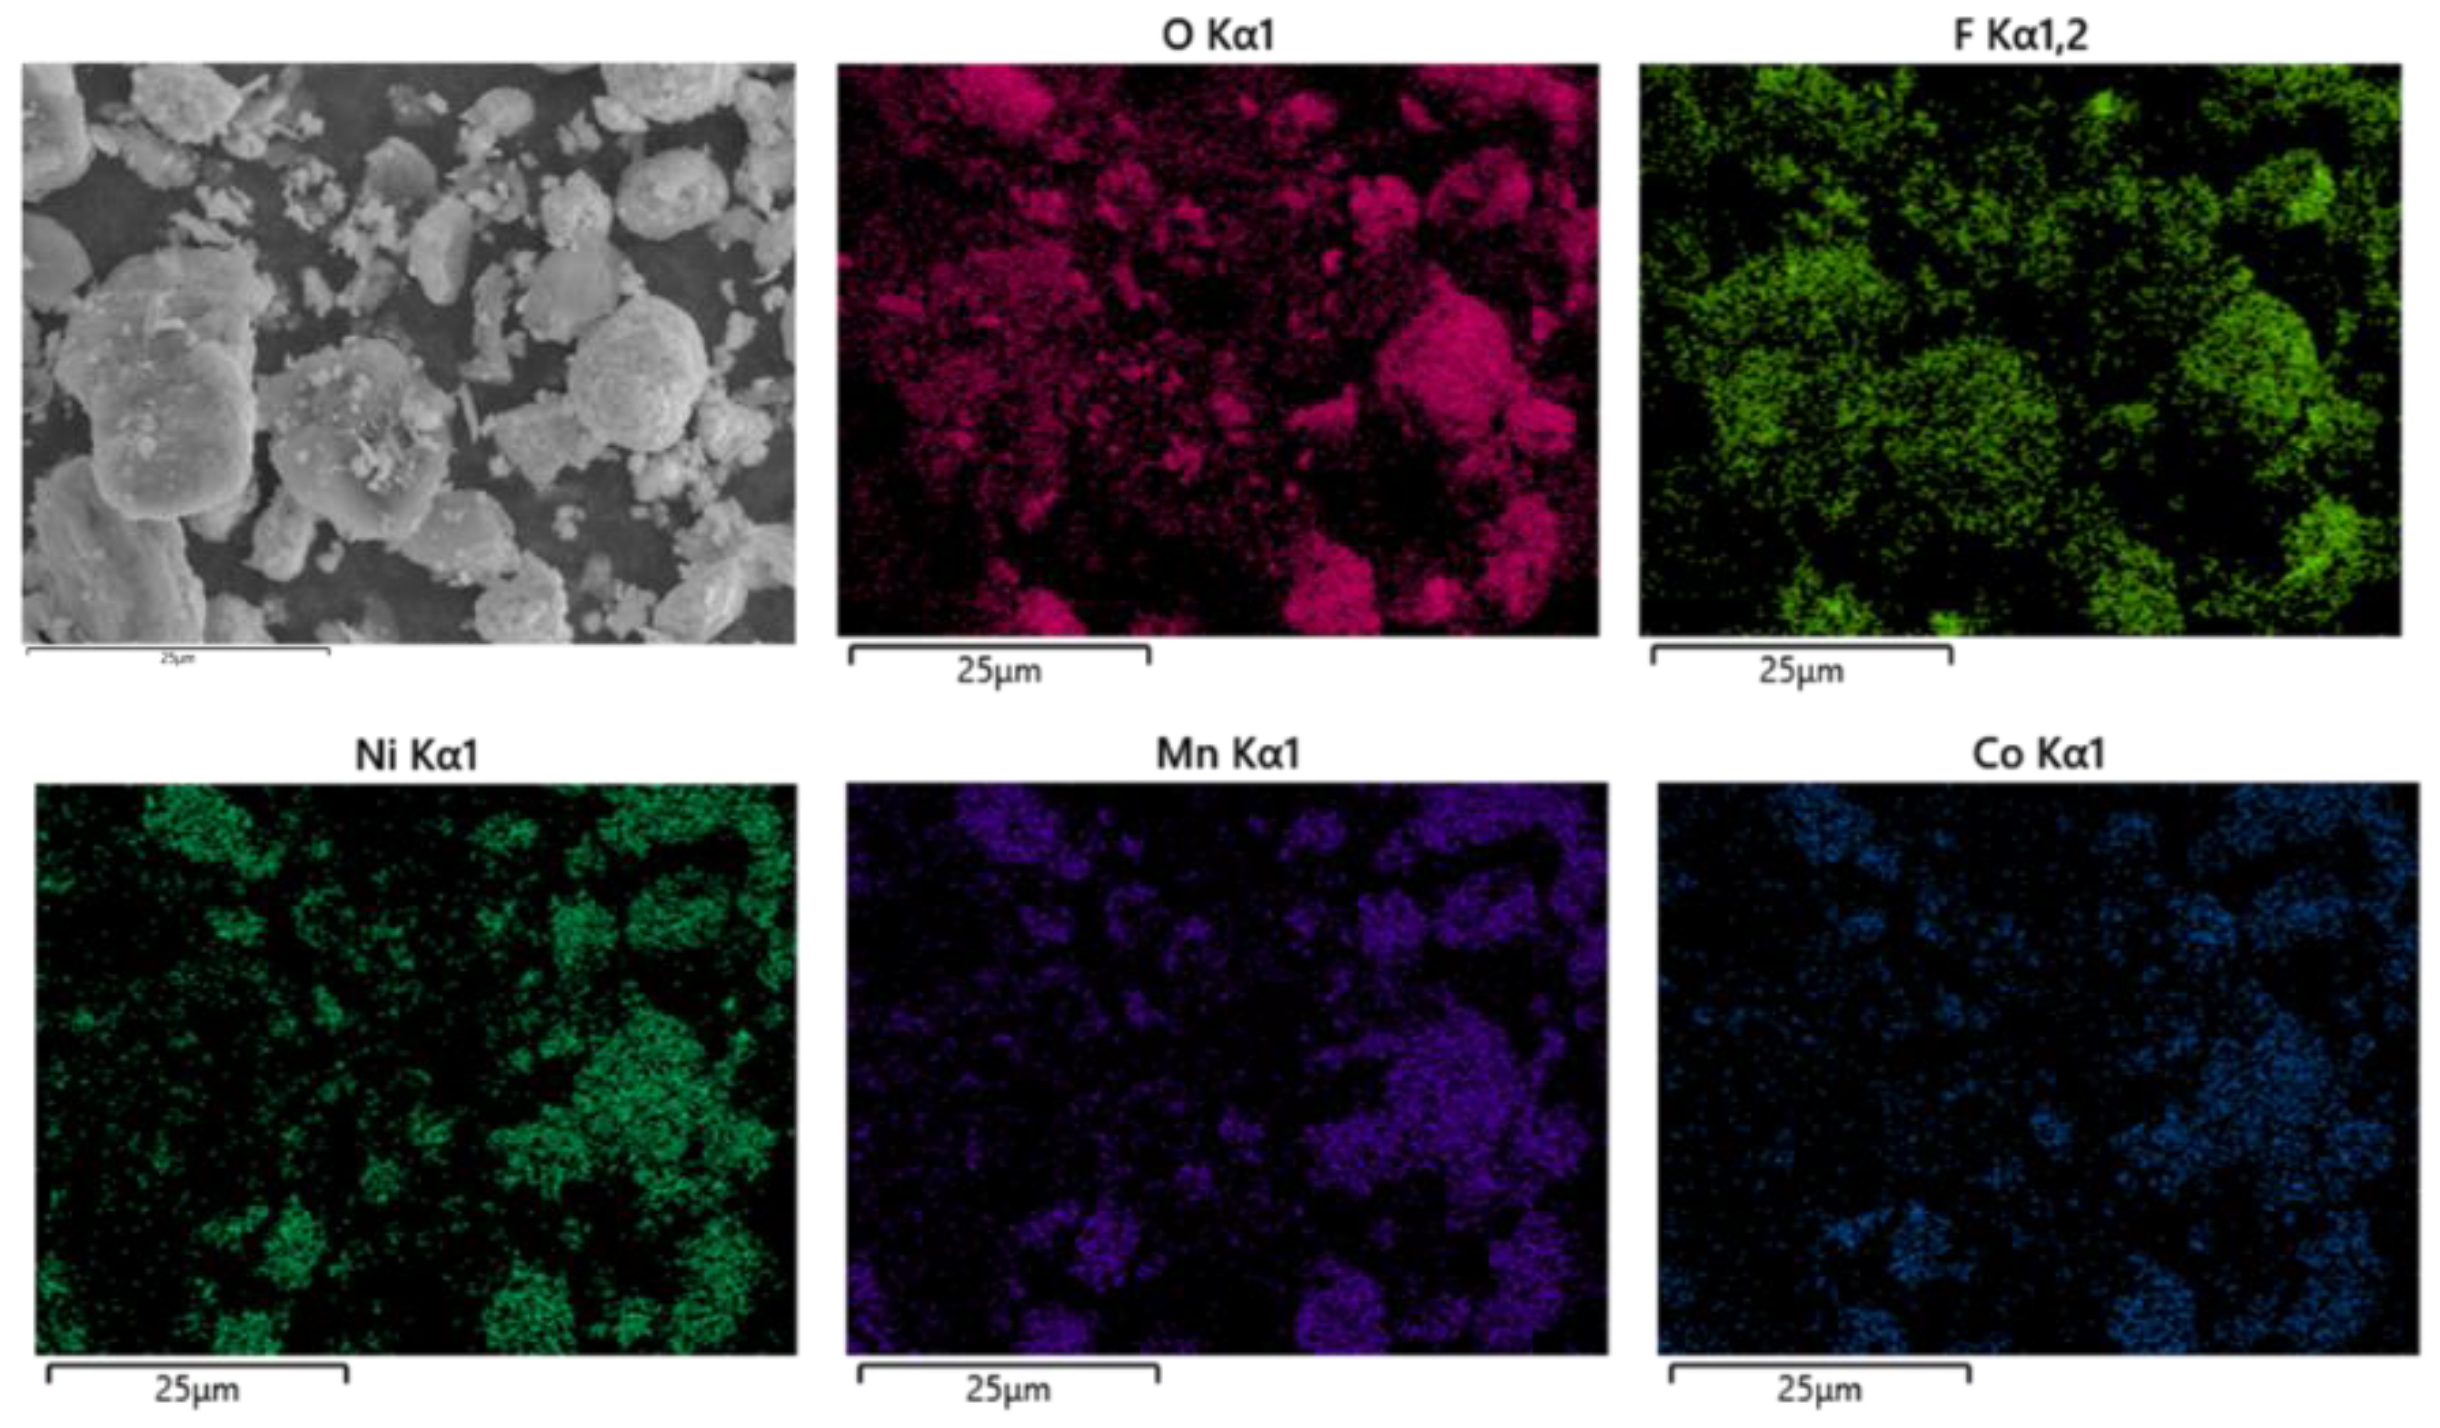
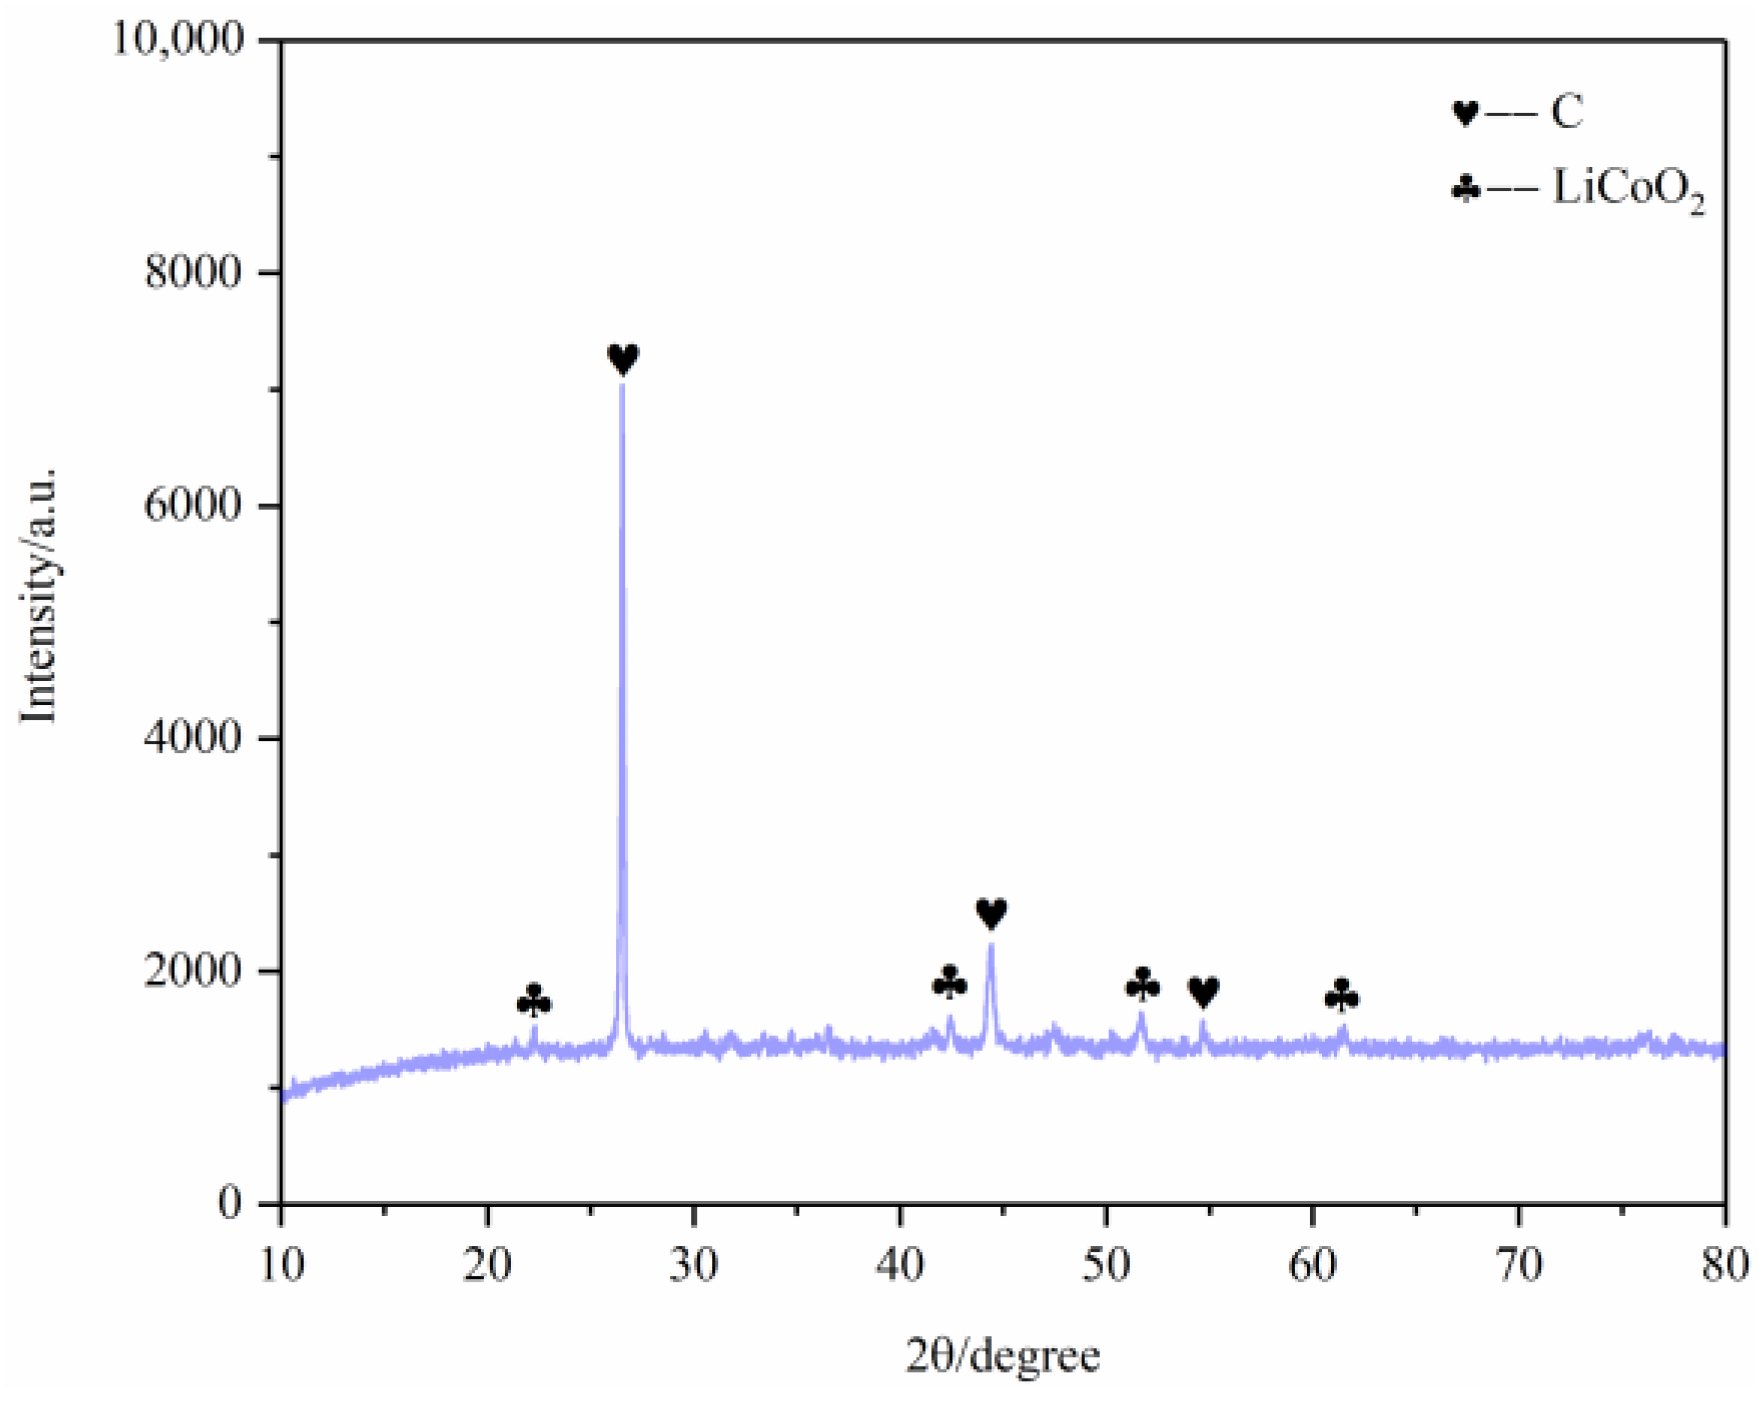
After pyrolysis, the battery materials were broken and analyzed by scanning electron microscopy (SEM), as shown in Figure 12. The results showed that elements Ni, Mn and Co were polymerized together after pyrolysis, and the polymerization was better than that without pyrolysis. However, F was still evenly distributed in graphite particles and Li2CoO2 particles. At the same time, an XRD test was carried out on the battery material, and the results showed that the main phase in the battery material did not change, and the two main phases were still C and Li2CoO2, as shown in Figure 13. This also indicates that pyrolysis pretreatment in an N2 atmosphere does not consume C, and 200 °C does not reach the Li2CoO2 thermal decomposition temperature.
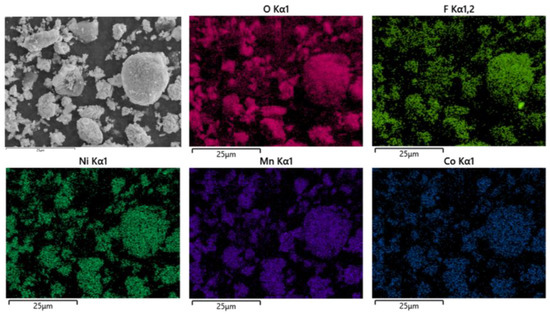
Figure 12.
SEM of battery materials after pyrolysis at 200 °C.

Figure 13.
XRD of battery materials after pyrolysis at 200 °C.
As shown in Figure 14, the battery materials were pyrolyzed at 400 °C in an N2 atmosphere. After pyrolysis, the battery materials were broken and analyzed by scanning electron microscopy. At the same time, an XRD test was carried out on the battery material, and the results showed that the main phase in the battery material did not change, and the two main phases were still C and Li2CoO2, as shown in Figure 15.

Figure 14.
SEM of battery materials after pyrolysis at 400 °C.

Figure 15.
XRD of battery materials after pyrolysis at 400 °C.
As shown in Figure 16, the battery material was pyrolyzed at 400 °C in an N2 atmosphere, and then broken after pyrolysis. The results showed that Ni, Mn and Co were polymerized on Li2CoO2 particles after pyrolysis, while F was evenly distributed on graphite particles and Li2CoO2 particles. At the same time, an XRD test was conducted on the battery material, and the results showed that the main phase of the battery material did not change, which was still C and Li2CoO2. The results are shown in Figure 17.
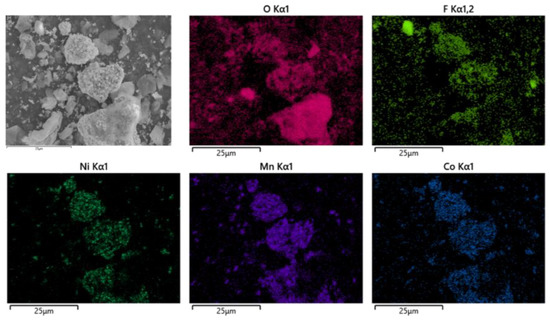
Figure 16.
SEM of battery materials after pyrolysis at 600 °C.
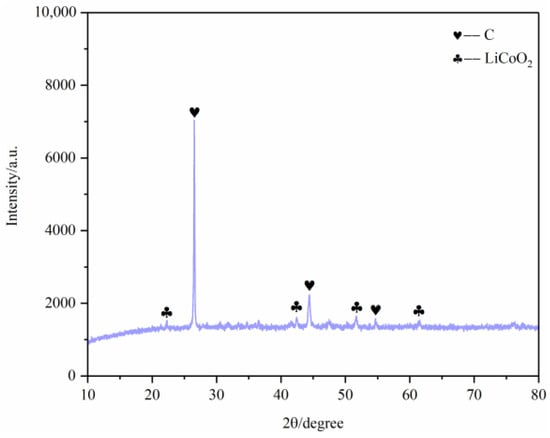
Figure 17.
XRD of battery materials after pyrolysis at 600 °C.
According to thermogravimetric curve and kinetic analysis, the spent LIB materials were divided into three stages of pyrolysis analysis. The solid-phase products at the three pyrolysis temperature stages were analyzed by scanning electron microscopy (SEM), and the results are shown in Figure 10, Figure 12, Figure 14 and Figure 16, indicating that pyrolysis treatment will lead to the polymerization of metal elements in battery materials. Meanwhile, the polymerization effect becomes better with the increase in pyrolysis temperature, while the polymerization of F does not occur with the increase in pyrolysis temperature.
In order to further analyze the characteristics of battery materials after pyrolysis pretreatment, XRD analysis was conducted on the battery materials after pyrolysis pretreatment at different temperatures. The main phase of the pyrolysis products at the four temperatures is carbon and lithium cobaltate, which indicates that the main phase of pyrolysis products at the four temperature segments does not change.
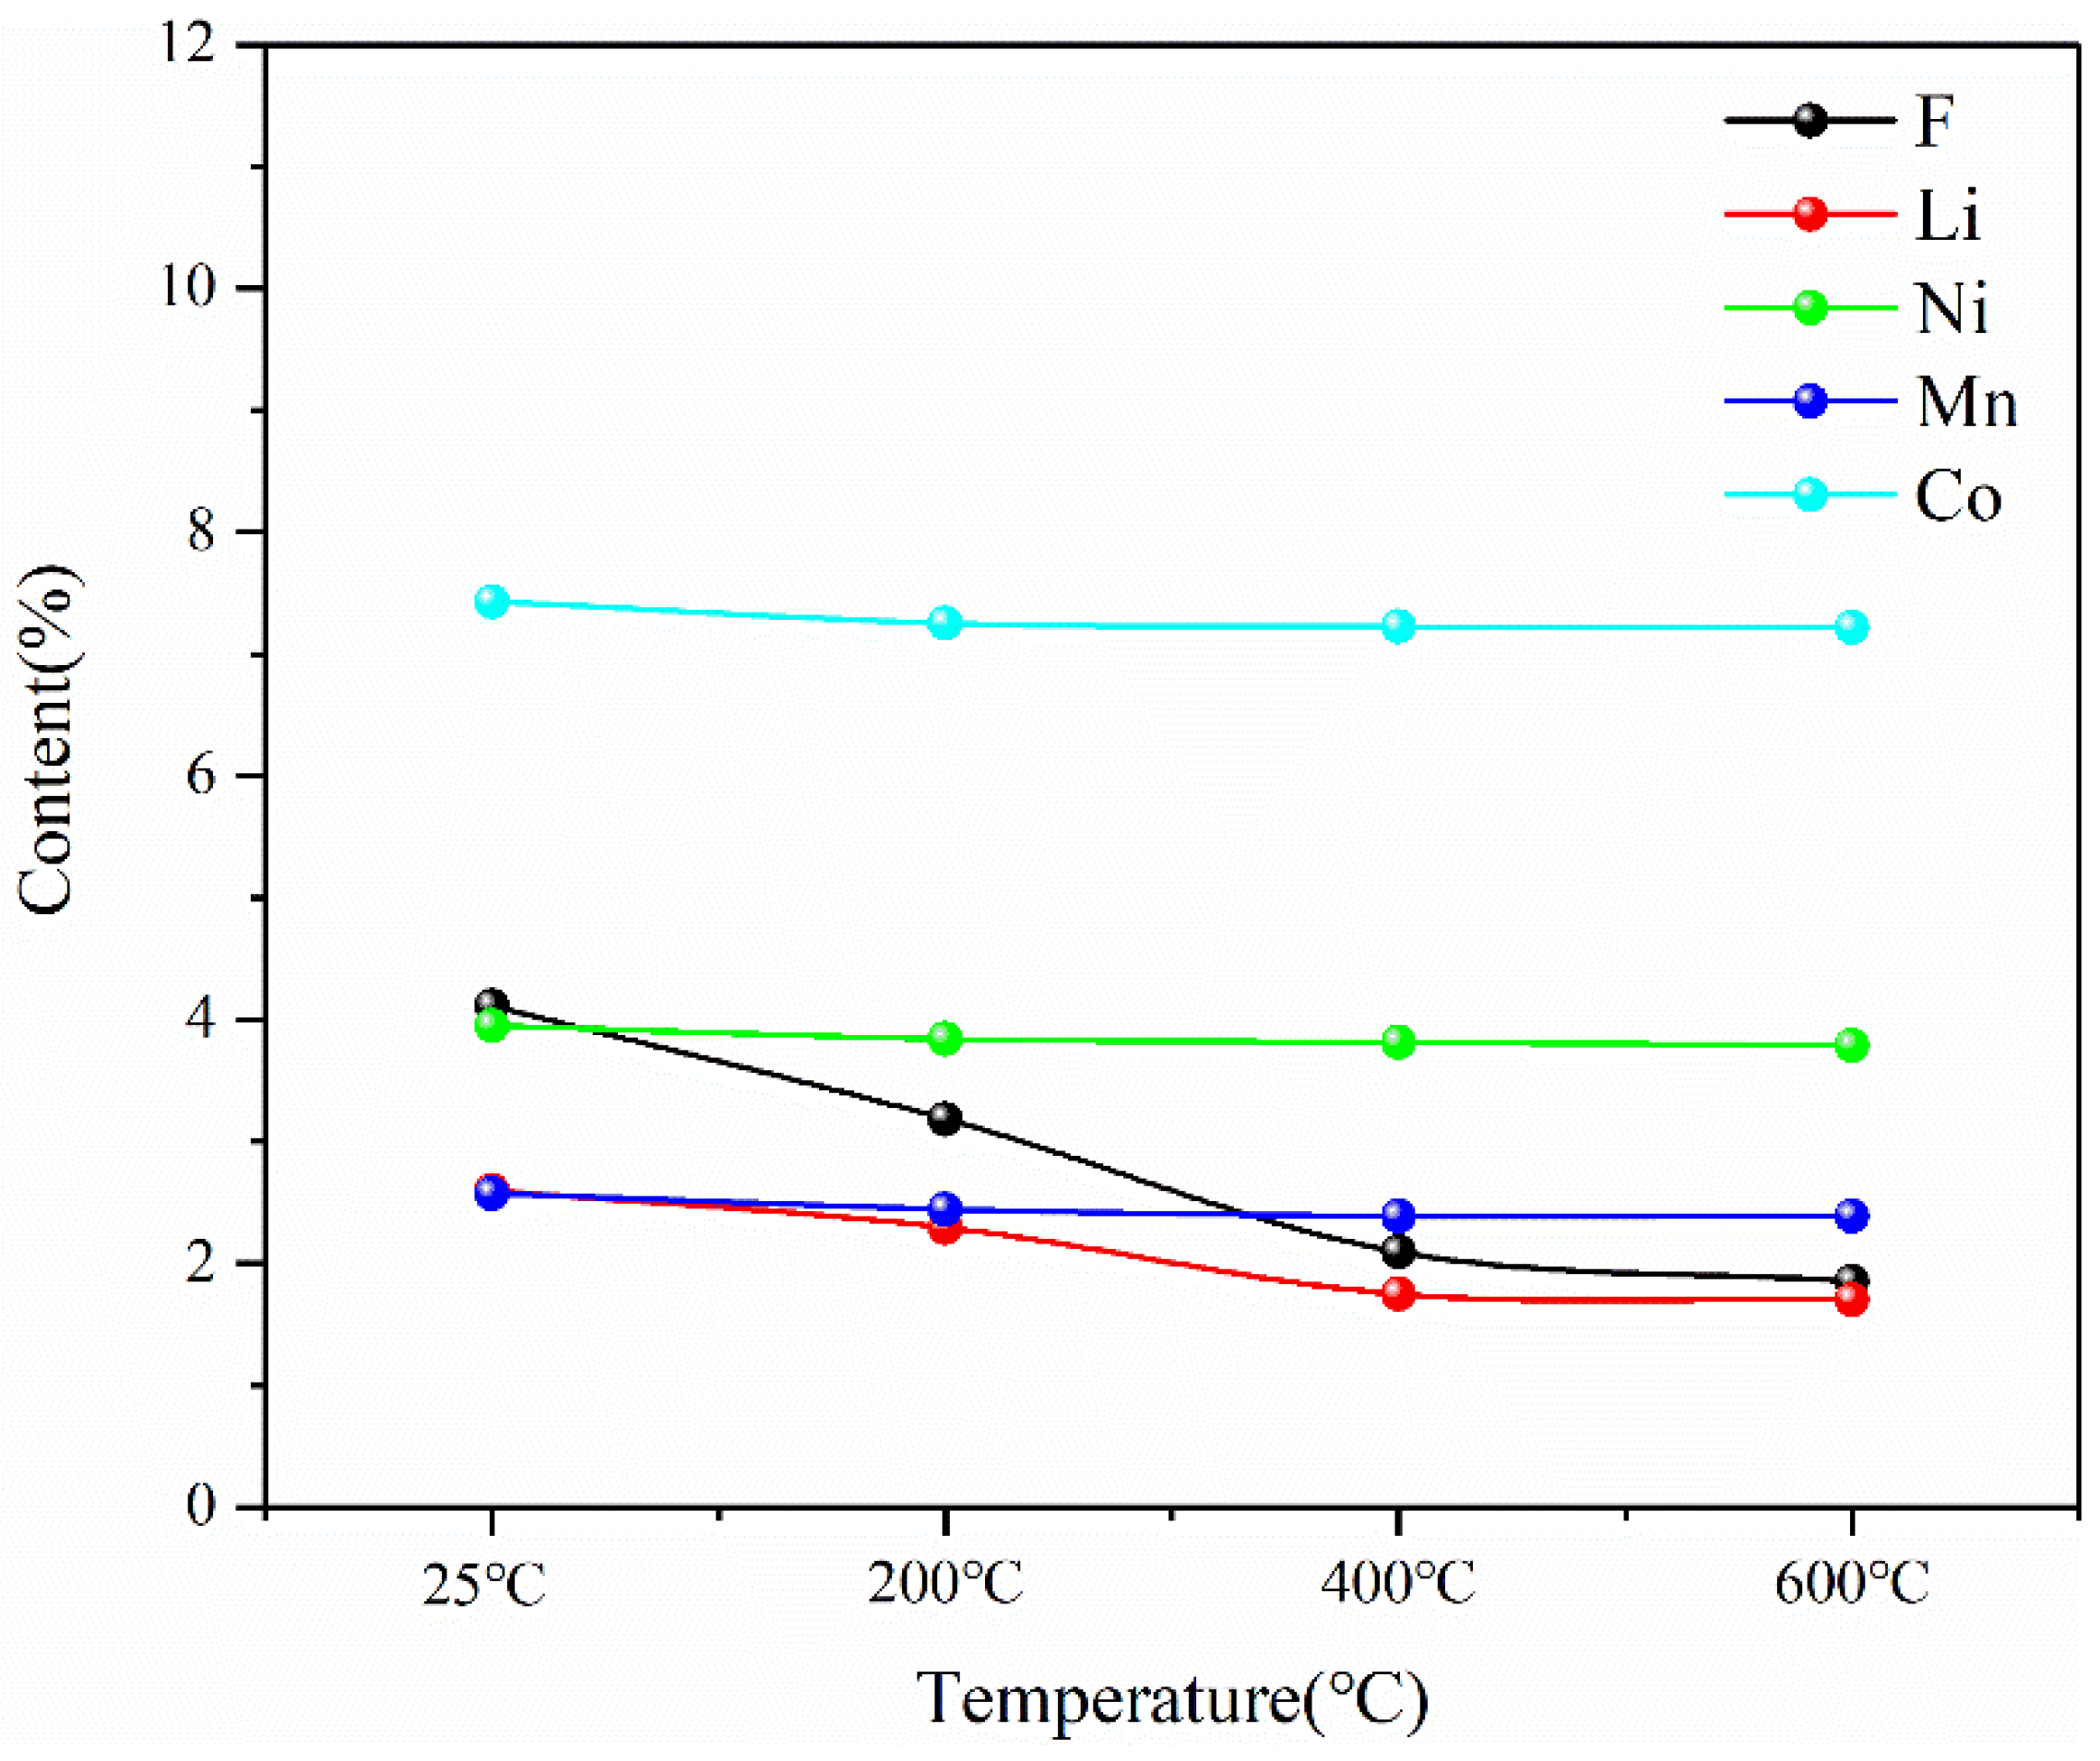
The main elements of Ni, Mn, Co and Li in the pyrolysis products of battery materials were detected by ICP, and the element F was detected by IC. The test results are shown in Figure 18. The contents of three major metal elements—Ni, Mn and Co—remain unchanged during pyrolysis, while the contents of F and Li decrease with the increase in temperature during pyrolysis.
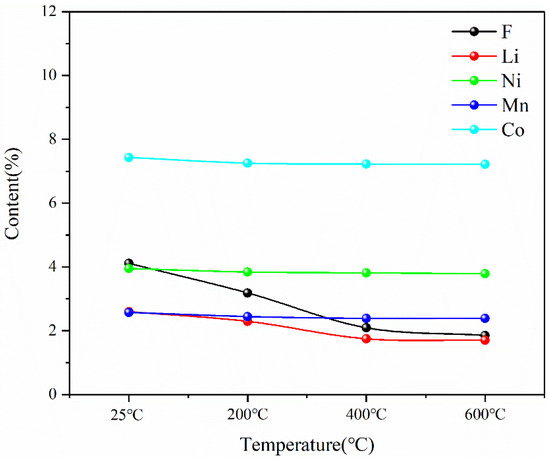
Figure 18.
Contents of main elements in battery materials after pyrolysis at different temperatures.
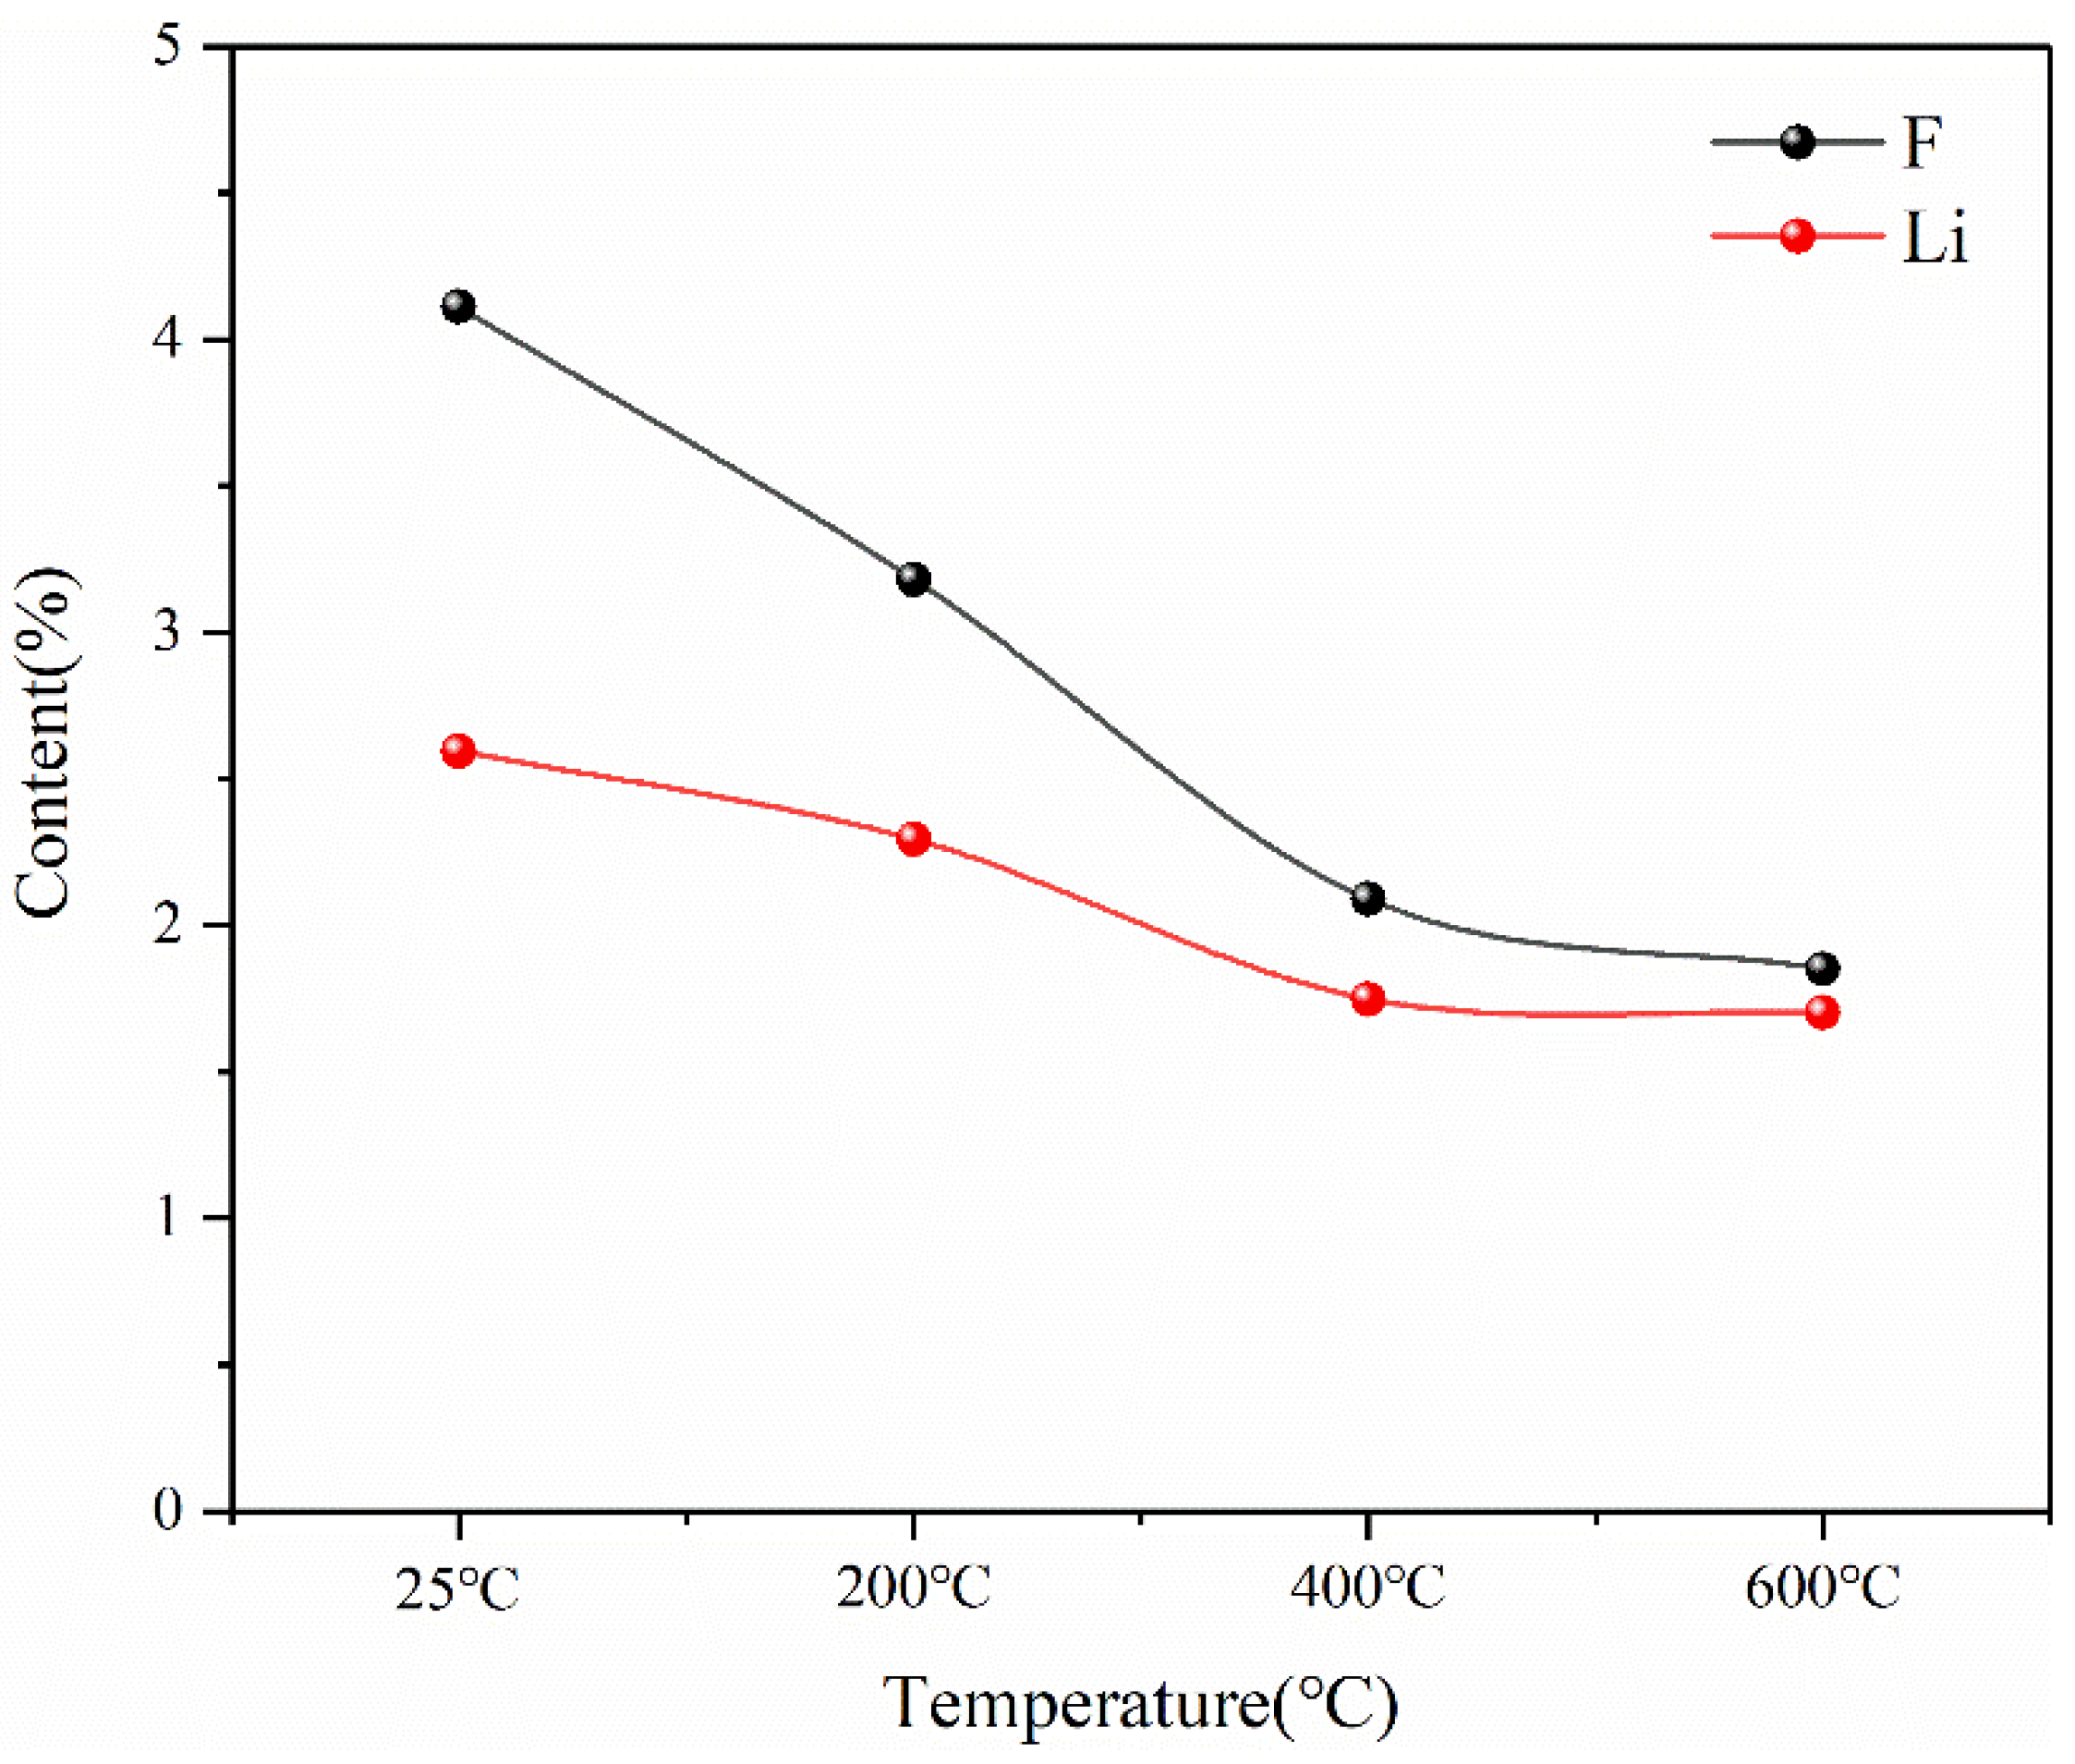
This indicates that the pyrolysis pretreatment can effectively reduce the content of F in spent lithium-ion battery materials, and at the same time, there will be a slight reduction in Li in the pyrolysis process, as shown in Figure 19. The reason for the decrease in F content is that during the pyrolysis process, the thermal decomposition of lithium hexafluorophosphate in the battery material at high temperatures and the thermal decomposition of the diaphragm material (PE) produce F-containing compounds that escape in the form of gas phase. The reason for the reduction in Li is that Li is unstable and will escape in the form of soot phase during pyrolysis at high temperatures. However, according to the experimental results, Li only escapes seriously at 400 °C, but the total amount of loss is not high. Therefore, the results of pyrolysis pretreatment show that pyrolysis is an effective method to separate toxic and harmful substances such as the organic electrolyte and diaphragm, which can reduce F in battery materials by more than 50% while keeping the contents of Ni, Mn and Co as the three main metal elements in battery materials unchanged and the content of Li reduced slightly.
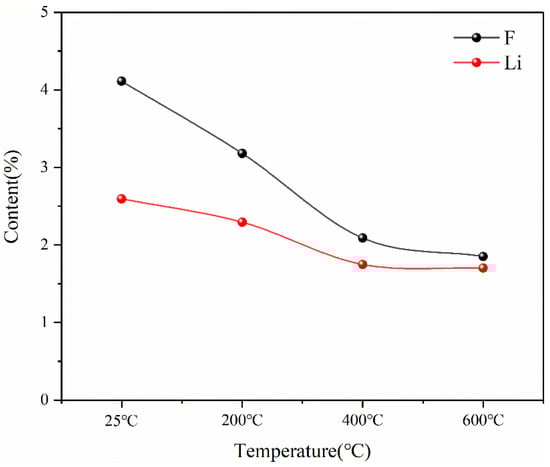
Figure 19.
Content changes of F and Li in battery materials after pyrolysis at different temperatures.
In the process of pyrolysis, all the element losses in battery materials escape in the form of gas phase, so the main gas-phase products in the process of battery pyrolysis are detected by GC-MS, and the results are shown in Table 4. The results show that small molecular organic compounds are produced in the pyrolysis process. Long-term exposure to these alkane gases can lead to dizziness, memory loss, mood changes and drowsiness. F, however, escaped primarily in the form of HF, C6H4F2, and C2H2F2 in the gas phase. Thus, an exhaust treatment device was installed using lye and organic solvents to absorb the pyrolysis products in the gas phase.
Table 4.
Gas composition during pyrolysis detected by GC-MS.
4. Conclusions
(1) Three model-free methods (Friedman, FWO, KAS) were used to calculate the activation energy curves for the three reaction stages. By comparing the three nonmodel methods of dynamics, it was found that although the Friedman method has a high degree of fit, it fluctuates greatly, while the dynamics curves determined by the FWO and KAS methods show the same trend and the R2 is very close, showing a good correlation compared with the Friedman method. Therefore, FWO method is considered to be the best method to calculate the three-stage pyrolysis kinetics of battery materials.
(2) The experiment result shows that the concentration of F in battery materials will gradually decrease with the increase in pyrolysis temperature. Meanwhile, with the increase in pyrolysis temperature, the concentrations of Ni, Mn and Co remain stable, while the concentrations of Li only lose slightly. The results show that pyrolysis pretreatment can reduce the content of the harmful element F in battery materials without affecting the content of valuable metal materials. Therefore, pyrolysis pretreatment is the best method for the fire recovery pretreatment of this project.
Author Contributions
H.W.: Methodology, Validation, Visualization, Writing—Original draft; C.L.: Investigation; G.Q.: Formal analysis; Visualization; S.Z.: Supervision, Project administration; B.L.: Conceptualization, Supervision, Resources; Y.W.: Conceptualization, Writing—Review & Editing, Funding acquisition. All authors have read and agreed to the published version of the manuscript.
Funding
This research was funded by [the National Natural Science Foundation of China] grant number [52064033] and [the Key Project of Basic Research Program of Yunnan Province] grant number [202101AS070025].
Data Availability Statement
Data available on request due to restrictions, e.g., privacy or ethical. The data presented in this study are available on request from the corresponding author.
Conflicts of Interest
The authors declare that they have no known competing financial interests or personal relationships that could have appeared to influence the work reported in this paper.
References
- Natarajan, S.; Aravindan, V. Burgeoning Prospects of Spent Lithium-Ion Batteries in Multifarious Applications. Adv. Energy Mater. 2018, 8, 1802303. [Google Scholar] [CrossRef]
- Zaghib, K.; Dontigny, M.; Guerfi, A.; Charest, P.; Rodrigues, I.; Mauger, A.; Julien, C. Safe and fast-charging Li-ion battery with long shelf life for power applications. J. Power Sources 2011, 196, 3949–3954. [Google Scholar] [CrossRef]
- Liu, X.M.; Liu, G.P. Study of a Lithium Battery Automatic Shell Control System Algorithm. Appl. Mech. Mater. 2015, 738, 3785. [Google Scholar] [CrossRef]
- Rabah, M.A.; Farghaly, F.E.; Motaleb, A.E. Recovery of nickel, cobalt and some salts from spent Ni-MH batteries. Waste Manag. 2008, 28, 1159–1167. [Google Scholar] [CrossRef] [PubMed]
- Sommerville, R.; Shaw-Stewart, J.; Goodship, V.; Rowson, N.; Kendrick, E. A review of physical processes used in the safe recycling of lithium ion batteries. Sustain. Mater. Technol. 2020, 25, e00197. [Google Scholar] [CrossRef]
- Wang, L. Efficient Separation of Aluminum Foil and Cathode Materials from Spent Lithium-Ion Batteries Using a Low-Temperature Molten Salt. ACS Sustain. Chem. Eng. 2019, 7, 8287–8294. [Google Scholar] [CrossRef]
- Bi, H.; Zhu, H.; Zu, L.; Gao, Y.; Gao, S.; Wu, Z. Eddy current separation for recovering aluminium and lithium-iron phosphate components of spent lithium-iron phosphate batteries. Waste Manag. Res. 2019, 37, 1217–1228. [Google Scholar] [CrossRef]
- Li, H.; Dai, J.; Wang, A.; Zhao, S.; Zhang, J. Recycling and Treatment of Waste Batteries. IOP Conf. Ser. Mater. Sci. Eng. 2019, 612, 052020. [Google Scholar] [CrossRef]
- He, L.P.; Sun, S.Y.; Song, X.F.; Yu, J.G. Recovery of cathode materials and Al from spent lithium-ion batteries by ultrasonic cleaning. Waste Manag. 2015, 46, 523–528. [Google Scholar] [CrossRef]
- Martinez, O.V.; Van, D.; Lundstrom, M.; Santasalo-Aarnio, A.; Reuter, M.; Serna-Guerrero, R. Statistical entropy analysis as tool for circular economy: Proof of concept by optimizing a lithium-ion battery waste sieving system. J. Clean. Prod. 2018, 212, 1568–1579. [Google Scholar] [CrossRef]
- Wang, M.; Tan, Q.; Liu, L.; Li, J. A low-toxicity and high-efficiency deep eutectic solvent for the separation of aluminum foil and cathode materials from spent lithium-ion batteries. J. Hazard. Mater. 2019, 380, 120846. [Google Scholar] [CrossRef]
- Liang, S.; Qiu, K. Vacuum pyrolysis and hydrometallurgical process for the recovery of valuable metals from spent lithium-ion batteries. J. Hazard. Mater. 2011, 194, 378–384. [Google Scholar]
- Wang, M.; Tan, Q.; Liu, L.; Li, J. A Facile, Environmentally Friendly, and Low-Temperature Approach for Decomposition of Polyvinylidene Fluoride from the Cathode Electrode of Spent Lithium-ion Batteries. ACS Sustain. Chem. Eng. 2019, 7, 12799–12806. [Google Scholar] [CrossRef]
- Zheng, Y.L.; Chen, R.J.; Wu, F.; Li, L. Progress of Research on the Conductive Mechanism of the Glassy Electrolytes in Lithium Ion Batteries. J. Inorg. Mater. 2013, 28, 1172–1180. [Google Scholar] [CrossRef]
- Yi, Z.; Xiong, D.; Wang, L.; Cao, X.; Liu, J.; Ouyang, S.; Xiong, S. Study on the process of aluminum removal and recovery from waste lithium ion batteries. Nonferrous Met. Sci. Eng. 2018, 9, 26–32. [Google Scholar]
- Ferreira, D.A.; Prados, L.; Majuste, D.; Mansur, M.B. Hydrometallurgical separation of aluminium, cobalt, copper and lithium from spent Li-ion batteries. J. Power Sources 2009, 187, 238–246. [Google Scholar] [CrossRef]
- Yue, W.U.; Pei, F.; Jia, L.L.; Tian, X. Recovery of aluminum, iron and lithium from spent lithium iron phosphate batteries. Chin. J. Power Sources 2014, 38, 629–631. [Google Scholar]
- Makuza, B.; Tian, Q.; Guo, X.; Chattopadhyay, K.; Yu, D. Pyrometallurgical options for recycling spent lithium-ion batteries: A comprehensive review. J. Power Sources 2021, 491, 229622. [Google Scholar] [CrossRef]
- Wang, H.; Liu, J.; Bai, X.; Wang, S.; Yang, D.; Fu, Y.; He, Y. Separation of the cathode materials from the Al foil in spent lithium-ion batteries by cryogenic grinding. Waste Manag. 2019, 91, 89–98. [Google Scholar] [CrossRef]
- Swiatowska, J. Lithium Process Chemistry: Resources, Extraction, Batteries, and Recycling; Elsevier: Amsterdam, The Netherlands, 2015. [Google Scholar]
- Lombardo, G.; Ebin, B.; Foreman, M.; Steenari, B.M.; Petranikova, M. Incineration of EV Lithium-ion batteries as a pretreatment for recycling—Determination of the potential formation of hazardous by-products and effects on metal compounds. J. Hazard. Mater. 2020, 393, 122372. [Google Scholar] [CrossRef]
- Xiao, J.; Li, J.; Xu, Z. Recycling metals from lithium ion battery by mechanical separation and vacuum metallurgy. J. Hazard. Mater. 2017, 338, 124–131. [Google Scholar] [CrossRef] [PubMed]
- Yan, J. Handbook of Clean Energy Systems||Recycling of Lithium-Ion Batteries; 2015; pp. 1–24. [Google Scholar]
- Werner, D.M.; Mütze, T.; Peuker, U.A. Influence of Pretreatment Strategy on the Crushing of Spent Lithium-Ion Batteries. Metals 2022, 12, 1839. [Google Scholar] [CrossRef]
- Mousa, E.; Hu, X.; Ånnhagen, L.; Ye, G.; Cornelio, A.; Fahimi, A.; Bontempi, E.; Frontera, P.; Badenhorst, C.; Santos, A.C.; et al. Characterization and Thermal Treatment of the Black Mass from Spent Lithium-Ion Batteries. Sustainability 2023, 15, 15. [Google Scholar] [CrossRef]


Disclaimer/Publisher’s Note: The statements, opinions and data contained in all publications are solely those of the individual author(s) and contributor(s) and not of MDPI and/or the editor(s). MDPI and/or the editor(s) disclaim responsibility for any injury to people or property resulting from any ideas, methods, instructions or products referred to in the content. |
© 2023 by the authors. Licensee MDPI, Basel, Switzerland. This article is an open access article distributed under the terms and conditions of the Creative Commons Attribution (CC BY) license (https://creativecommons.org/licenses/by/4.0/).