Article

Concurrent Optimization of Ultrasonic-Assisted Extraction of Total Phenolic Compounds and In Vitro Anticancer and Antioxidant Potential of Pulicaria schimperi (Aerial Parts) Using Response Surface Methodology

1
Department of Pharmacognosy, College of Pharmacy, King Saud University, Riyadh 11451, Saudi Arabia
2
College of Pharmacy, King Saud University, Riyadh 11451, Saudi Arabia
*
Authors to whom correspondence should be addressed.
These authors contributed equally to this work.
Separations 2023, 10(3), 208; https://doi.org/10.3390/separations10030208
Submission received: 19 February 2023 / Revised: 8 March 2023 / Accepted: 14 March 2023 / Published: 17 March 2023

Abstract

:
This study aimed to maximize the dependent variables [total phenolic content (TPC), antioxidant (DPPH and ABTS), and anticancer activities (against HepG2 and MCF-7 cells)] from P. schimperi aerial parts by optimizing three independent variables (extraction temperature, extraction time, and liquid-to-solid ratio) of ultrasound-assisted extraction (UAE) using the Box–Behnken design (BBD) of response surface methodology (RSM). For each of the dependent variables, the projected quadratic models were found to be very significant (p < 0.001). The extraction temperature and extraction time had a significant impact on the TPC extraction, antioxidant, and anticancer properties (p < 0.05). The best conditions were identified as an extraction temperature of 54.4 °C, extraction time of 48 min, and liquid-to-solid ratios of 20.72 mL/g for the simultaneous extraction of the TPC, antioxidant, and anticancer properties of P. schimperi. The experimental results and the expected values agreed under these circumstances. Regarding the high extraction effectiveness and antioxidant and anticancer effects at comparably low extraction temperature and duration, UAE demonstrated considerable benefits over conventional solvent extraction (CSE). This improved UAE approach has shown a potential use for effective polyphenolic antioxidant extraction from P. schimperi aerial parts in the nutraceutical sectors.

1. Introduction

Pulicaria is a genus of family Asteraceae (comprising about 200 genera and 2000 species) that consists of about 100 species and is distributed widely in Asia, Africa, Europe, and the Mediterranean region [1]. It has been reported that Pulicaria species have been used traditionally in the treatment of various diseases such as cancer, inflammation, and diabetes. The Pulicaria species has also been found to exhibit different biological properties such as antioxidant, antibacterial, antihistaminic, antifungal, insecticide, and leishmanicidal [2]. There are twelve species of the genus Pulicaria found in the Kingdom of Saudi Arabia, and all of them have reportedly been used as traditional medicine such as P. arabica (for digestive disorders treatment), P. crispa (for treatment of inflammation), and P. incisa (for heart disease treatment). The phytochemical investigation of Pulicaria species revealed the presence of several important classes of natural products such as diterpenes, sesquiterpenes, sesquiterpene lactones, flavonoids, coumarins, and alkaloids [3].
P. schimperi is an annual or biennial herb reaching a high of 8–50 cm and consists of pale grey-lanate branches. The leaves of P. schimperi were found as ovate to oblanceolate with a dentate margin. Phytochemical investigation of P. schimperi revealed the presence of polysaccharides, polyphenols, and flavonoids (like chlorogenic acid) as major classes of compounds [4]. Major phenolic and flavonoid compounds including chlorogenic acid, quercetin 3-galactoside, kaempferol 3-galactoside, 3,4-dicaffeoylquinic acid, 3,5-dicaffeoylquinic acid, 4,5-dicaffeoylquinic acid, quercetin, luteolin, quercetin-3-methyl ether, and quercetin-3,7-dimethyl ether have been reported to be found in the methanol extract of P. schimperi [3]. The extraction of phenolic compounds from P. schimperi has been mainly conducted by using conventional extraction methods such as maceration, Soxhlet, and heat reflux extraction. However, these methods have several disadvantages such as the large consumption of solvents and time consuming. In recent times, various efficient and advanced extraction methods such as ultrasonic-assisted extraction, accelerated solvent extraction, and supercritical fluid extraction have been developed for the effective extraction of different classes of natural products from plant sources [5].
Ultrasonic-assisted extraction (UAE) is a key method for effectively extracting natural products. The UAE uses the cavitation, thermal, and mechanical effect of ultrasonic to treat the plant materials, which efficiently destroys the structure of the cell wall and stimulates intermolecular diffusion, resulting in the complete release of the active intracellular ingredients. UAE has several advantages over conventional extraction methods such as a short extraction time, less consumption of solvent, and a high rate of extraction. Rodiah et al. (2018) [6] found that ultrasonic-assisted extraction enhanced the colorant yield in the mesocarp and exocarp of coconut within a short extraction time compared with stirring extraction [7].
The UAE technique has been widely used for the phytoconstituent extraction from different plant sources such as physcion from Senna occidantalis [8], sennoside A, sennoside B, aloe-emodin, emodin and chrysophanol from Senna alexandrina [9], and parthenolide from Tarchonanthus camphoratus [10]. Nevertheless, the phenolic compound extraction from P. schimperi (aerial parts) has not been evaluated by using UAE. The productivity of the UAE process is generally affected by numerous extraction variables such as the extraction temperature, extraction time, and the solvent-to-sample ratio [11]. Hence it is essential to optimize these extraction variables to attain the maximum yield of phytoconstituents from the raw materials. Response surface methodology (RSM) was used to determine the individual, quadratic, and interaction effects of the UAE variables to warrant the best extraction ability. RSM allows for the optimization of all variables simultaneously and predicts the most efficient conditions using the least number of experiments. RSM has lately been used to optimize the phenolic extraction conditions from several plants [5].
Hence, this experiment aimed to optimize the UAE conditions (extraction temperature, extraction time, and liquid-to-solid ratio) using RSM to maximize the total phenolic content (TPC) extraction and the antioxidant and anticancer activities of the P. schimperi aerial parts.

2. Materials and Methods

2.1. Plant Material

The aerial parts of P. schimperi (voucher specimen no. 15802) was collected in 2014 from Jabal Shada (Al Baha region, Saudi Arabia) by the field taxonomist Dr. Md. Yusuf (Pharmacognosy Department, College of Pharmacy, KSU, Riyadh, Saudi Arabia) and the specimen was kept in the department herbarium. The aerial parts were washed with water, dried in a shed, and coarsely powdered to be used in the experiment.

2.2. Apparatus and Reagents

The reference compounds quercetin, ascorbic acid, and vinblastine were purchased from Sigma-Aldrich (St. Louis, MO, USA). Methanol (Analytical grade) was procured from WINLAB (Market Harborough, Leicestershire, UK). High-quality pure water was obtained from Millipore Milli-Q® (Bedford, MA, USA) assembly. The extraction of P. schimperi aerial parts was carried out using a sonicator (Model VCX-750, Sonics, Newtown, CT, USA).

2.3. Extraction Process

2.3.1. Ultrasound-Assisted Extraction of Aerial Parts of P. schimperi

The P. schimperi aerial parts were dried and coarsely powdered. The powdered material (1 g/50 mL) was placed in a conical flask and extracted using methanol as the extraction solvent by ultrasound-assisted extraction (UAE; Model VCX-750; Sonics, Newtown, CT, USA). Upon the completion of extraction, the extract was cooled, filtered, and dried using a rotavapor (R-300, Buchi, Flawil, Switzerland) to obtain the dried extract of P. schimperi. The final percentage yield was calculated. The dried extract was used for a preliminary study of the total phenolic content, antioxidant, and anticancer properties. The same procedure was applied for the extraction in the process of the optimization of different extraction variables of UAE.

2.3.2. Conventional Solvent Extraction (CSE)

One gram of the P. schimperi aerial parts powder was mixed with 25 mL of methanol, and the mix was kept in a thermostatic water bath (Grant W14, Cambridge, England) at 75 °C for 60 min with constant shaking. After completion of the extraction, the extract was cooled and dried using a rotavapor to obtain the dried mass. The dried extract was used to evaluate the total phenolic content, antioxidant, and anticancer properties.

2.4. Determination of Total Phenolic Content (TPC)

The method of Singleton and Rossi [12] was used to determine the phenolic content of P. schimperi aerial part extracts, with a few minor adjustments. In a nutshell, 100 µL of an aliquot sample (1 mg/mL) of gallic acid, a common phenolic (31.25–1000 µg/mL), were combined with 1.5 mL of distilled water and 100 µL Folin–Ciocalteu reagent. They were then left to remain at room temperature for 8 min before 300 µL of sodium carbonate (20%) was added. The reaction mixture was properly stirred after incubation and left to stand at room temperature in the dark for 30 min. Using a spectrophotometer, the absorbance of each sample solution was measured at 765 nm (phenolic content was expressed as gallic acid equivalent per gram).

2.5. Antioxidant Activity

2.5.1. Scavenging Activity of DPPH Radical

DPPH (2,2-diphenyl-1-picrylhydrazyl) was used to assess the ability of the P. schimperi aerial part extracts to scavenge free radicals. The test was carried out in accordance with the illustrations by Alqahtani et al. [13]. This test measures the extract’s ability to scavenge free radicals, and different concentrations of the extract (10, 50, 100, 500, and 1000 µg/mL) were utilized to do so. In order to make 1 mL of the test combination, 500 µL of the extract was combined with 375 µL of methanol, and 125 µL of a 0.04% DPPH ethanol solution was added last. A positive control was used, which was ascorbic acid. The decrease in absorbance at λmax = 517 nm was measured 30 min after incubation at room temperature in the dark. The following equation was used to calculate the radical scavenging capacity:
% of radical scavenging activity = {(Abs control − Abs sample/Abs control)} × 100

2.5.2. ABTS Radical Scavenging Activity

The evaluation of the ABTS (2,2′-Azino-bis-3-ethylbenzothiazoline-6-sulfonic acid) radical scavenging capacity of the P. schimperi aerial part extracts was conducted by a spectrophotometric method as illustrated by Almarfadi et al. [14]. Briefly, ABTS aqueous solutions (7 mM) and potassium persulfate (2.45 mM) were mixed (1:1) and incubated for 0.5 h, and preserved in the freezer for 24 h before being diluted with ethanol. Subsequently, various volumes of ABTS solution (50 µL) were mixed with the plant sample and preserved for one hour in the dark. The reduction in ABTS was optically detected at λmax = 734 nm and the antioxidant percentage activity of the P. schimperi aerial part extracts was calculated by using the formula given below [15]:
% of radical scavenging activity = {(Abs control − Abs sample/Abs control)} × 100

2.6. Anticancer Activity

Two human cancer cells, MCF-7 (breast) and HepG2 (liver), were employed to assess the anticancer activity of the P. schimperi aerial part extracts. The experiment was carried out as illustrated by Alam et al. [16]. DMEM, supplemented with 10% FBS and 1% penicillin-streptomycin, was used to keep the cells viable. Around 1 × 10⁵ cells was added to each well of the 24-well tissue culture plates with 1 mL of media, and the cells were then incubated at 37 °C with 5% CO2. Following 24 h, the cells were exposed to P. schimperi extracts at various concentrations (10 µg/mL, 25 µg/mL, 50 µg/mL, and 100 µg/mL) for 48 h. Following this, 100 µL of MTT (5 mg/mL) was added to each well, and then left to incubate for 2–4 h. After the incubation period, 1 mL of 0.01N HCL/isopropanol was put in the wells to dissolve the formazan and then shaken for 10 min. At a wavelength of 490 nm, the transformed MTT’s absorbance was measured using a microplate reader (Bio-Tek, Winooski, VT, USA). Wells with untreated cells were utilized as controls, while vinblastine was employed as a positive control. The dose–response curves were used to calculate the IC50 (concentration of the tested drug required to inhibit cell growth by 50%) for each extract tested.

2.7. Box–Behnken Design (BBD) Experimental Design

2.7.1. Single Factor Experimental Design

Single-factor design was used to analyze the effect of the different extraction parameters of UAE such as the extraction temperature, extraction time, and liquid-to-solid ratio on the total phenol content (TPC) of the P. schimperi extracts. Using a range of one extraction parameters while holding the other two extraction parameters constant, the single factor influence on TPC was evaluated. By using the results of the single-factor effects on TPC, a range of these extraction parameters (used to optimize UAE parameters by the BBD method) were identified.

2.7.2. Optimization of Extraction Variables Using the BBD Method and Method Validity Testing

The extraction parameters [extraction temperature (K1), extraction duration (K2), and liquid-to-solid ratio (K3)] were optimized using a 3-factorial (33) Box–Behnken design (BBD; version 14, Design-Expert Software, Stat-Ease Inc., Minneapolis, MN, USA) (Table 1). To maximize the TPC and the antioxidant and anticancer impact of the P. schimperi extracts, the BBD model generated seventeen (17) experimental runs utilizing the three independent variables, together with five central points fitted to a second-order polynomial equation. Using 3D response surface plots, the effects of independent variables on the TPC, DPPH, ABTS, HepG2 and MCF-7 were deduced. The idea of “biggest-is-best” was applied to each variable to determine the best outcome, with p-values below 0.05 being considered significant. In order to validate the proposed model, an assenting experiment (n = 3) was conducted by utilizing the optimized independent variables. The experimental values obtained were compared to the projected values.

2.8. Statistical Analysis

The data was presented as the mean SEM. At a significance threshold of p < 0.05, the data were statistically analyzed using the Student’s t-test to compare the means.

3. Results

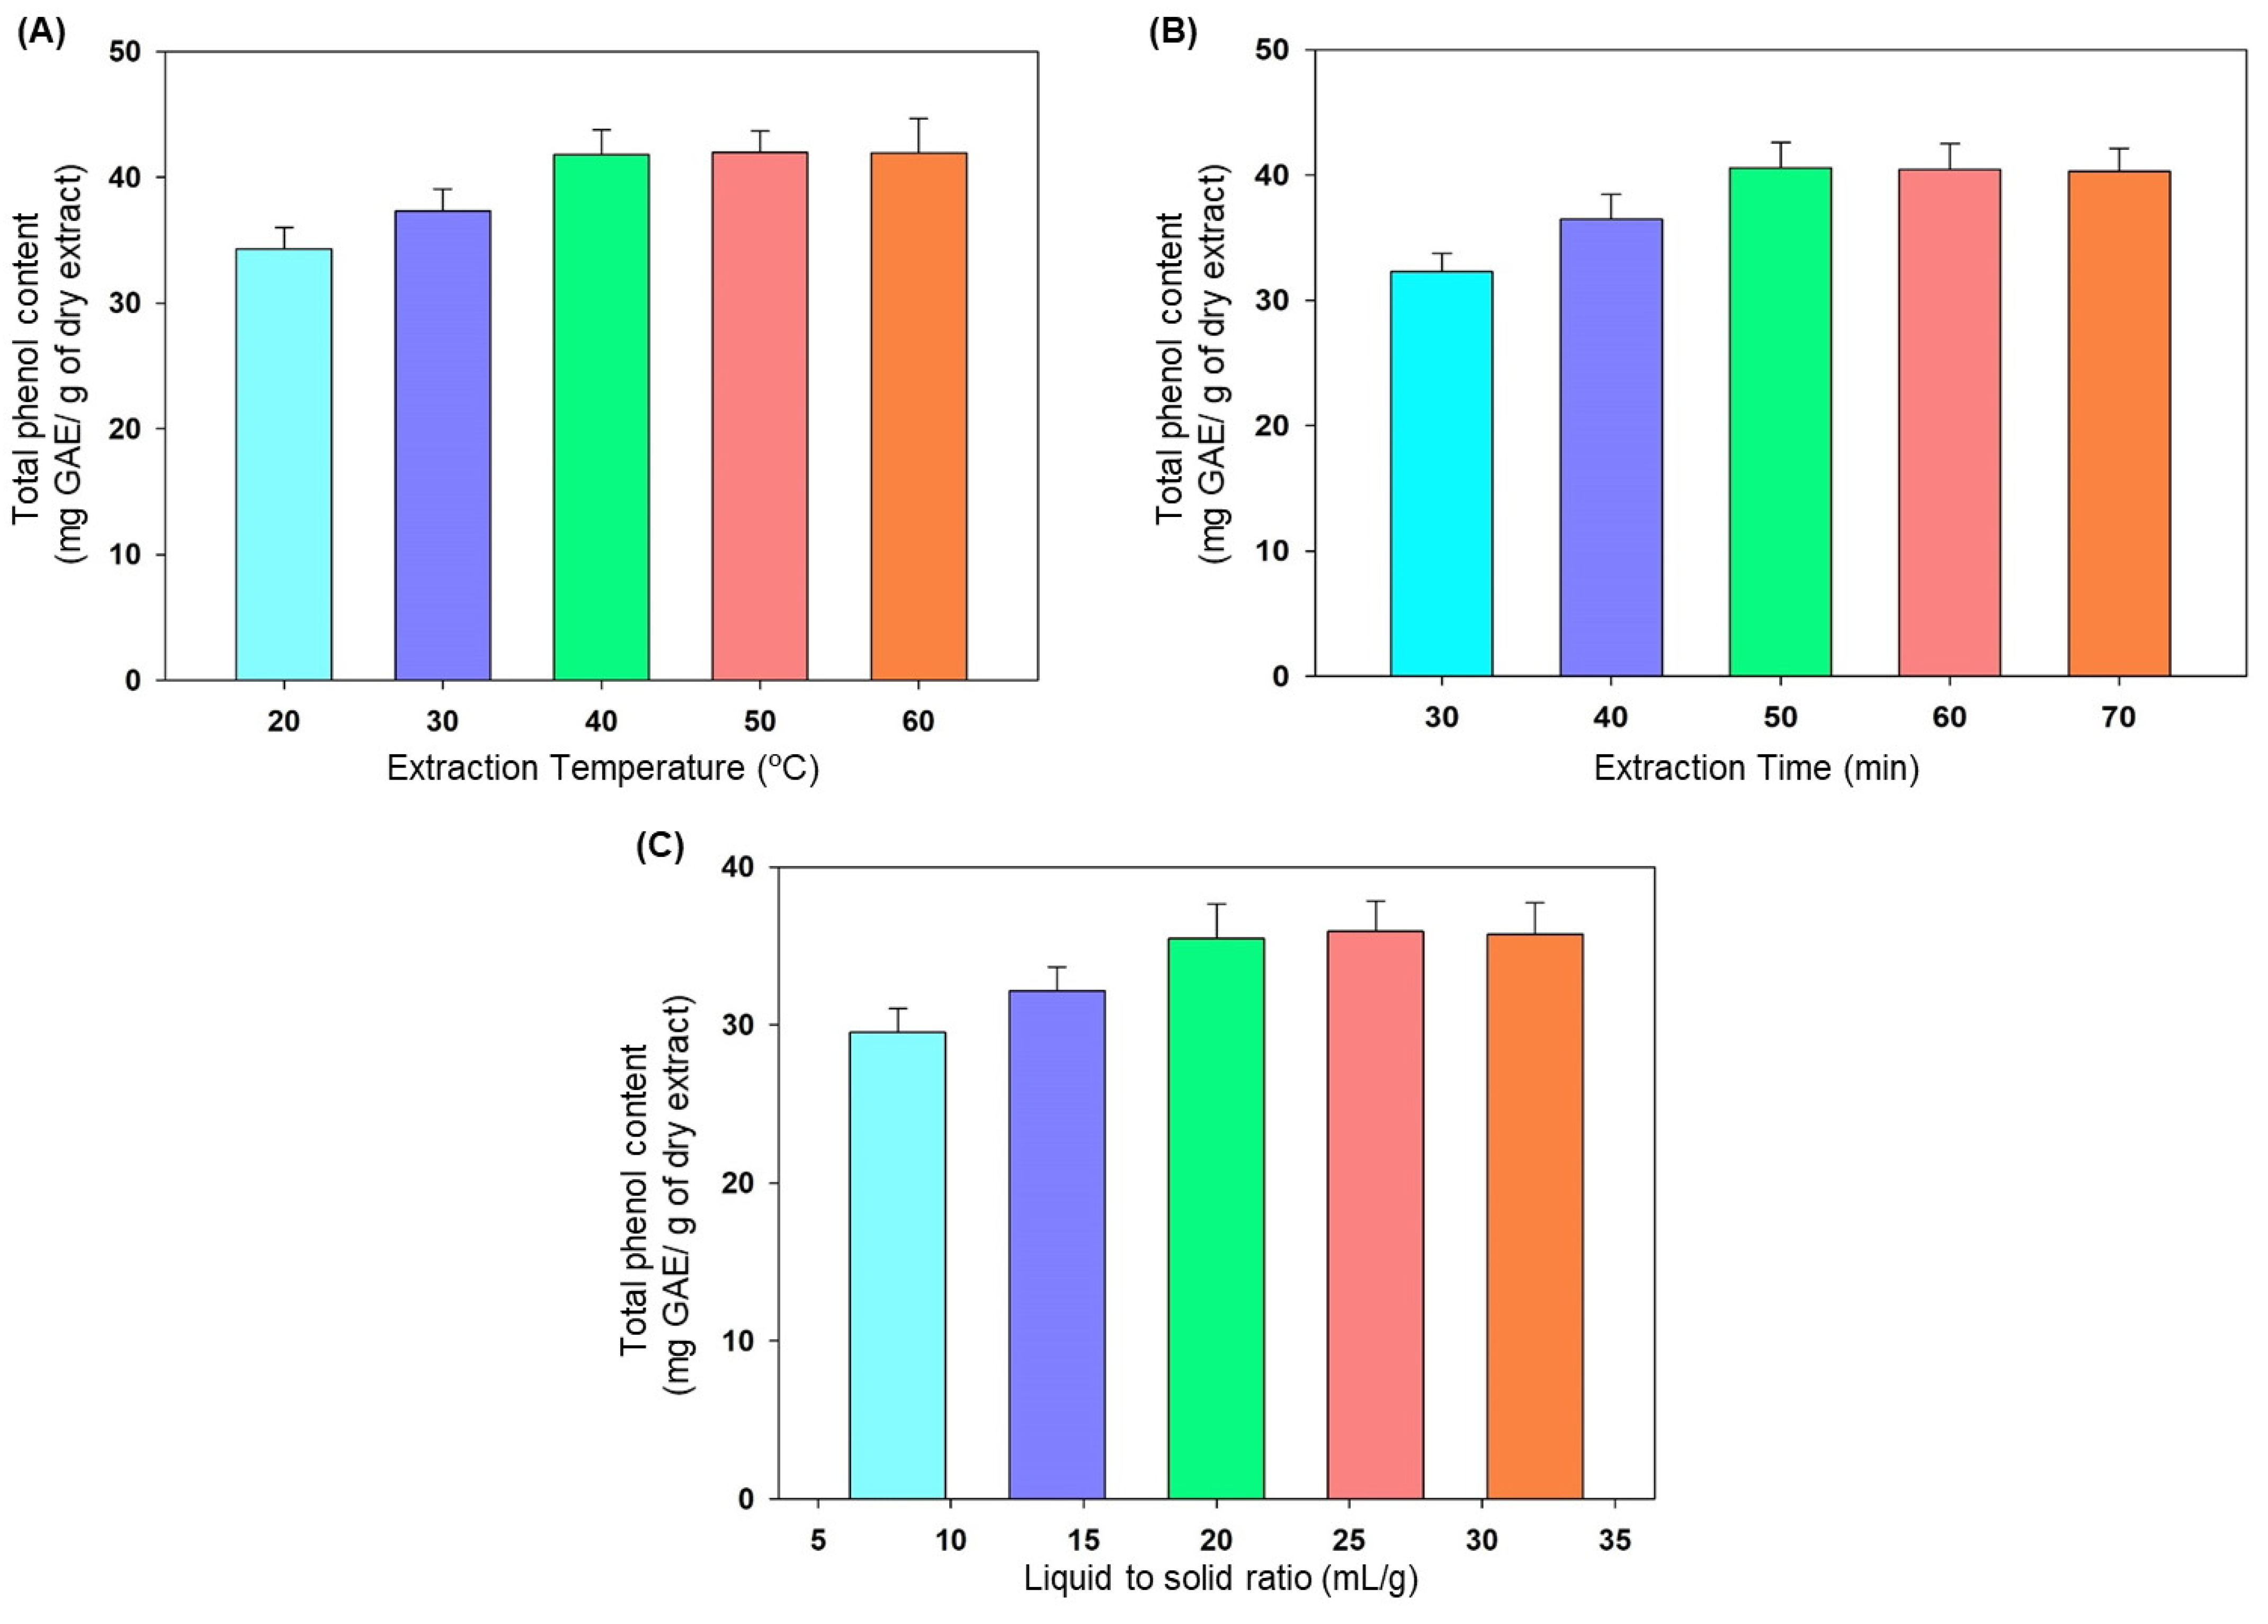
3.1. Single Extraction Factor Effect on Total Phenol Content (TPC)

The single extraction factor effect of all of the UAE extraction variables (extraction temperature, extraction time and liquid-to-solid ratio) on the total phenol content (TPC) was carried out to fix a range of these variables for their optimization by BBD. The ranges of the single factor to analyze their effect on TPC were as follows: extraction temperature (20–60 °C), extraction time (30–70 min), and liquid-to-solid ratio (8–32 mL/g). The effect of one extraction factor on TPC was analyzed while keeping the other two extraction factors constant and the same was repeated while analyzing the effect of other two factors. The different constant level for all the extraction factors were: extraction temperature (40 °C), extraction time (40 min), and liquid-to-solid ratio (20 mL/g).

3.2. BBD Optimization of Extraction Conditions

3.2.1. Model Fitting

A Box–Behnken design (BBD) was used to analyze the linear, quadratic, and interactions effects of the UAE extraction parameters [(extraction temperature (K1; °C), extraction time (K2; min) and liquid-to-solid ratio (K3; mL/g)] on TPC (R1), DPPH (R2), ABTS (R3), HepG2 (R4), and MCF-7(R5). The 3-factorial (33) BBD experimental design and their corresponding responses (R1, R2, R3, R4, and R5) are presented in Table 1.
The experimental values achieved for TPC ranged from 69.19 to 104.82 mg GAE/g, for DPPH inhibition, the IC50 was 18.1 to 96.8 µg/mL, for ABTS inhibition, the IC50 was 19.2 to 47.3 µg/mL, the HepG2 cell viability inhibition (IC50) was 30.76–40.66, and for MCF-7, the cell viability inhibition IC50 was 44.99–58.72 (Table 2). ANOVA findings revealed that, in comparing to other models, the quadratic polynomial model for all responses was very significant (p < 0.0001) (Table 3). Table 4 lists the values of the analysis of variance (ANOVA) and regression coefficients (β) for each response.

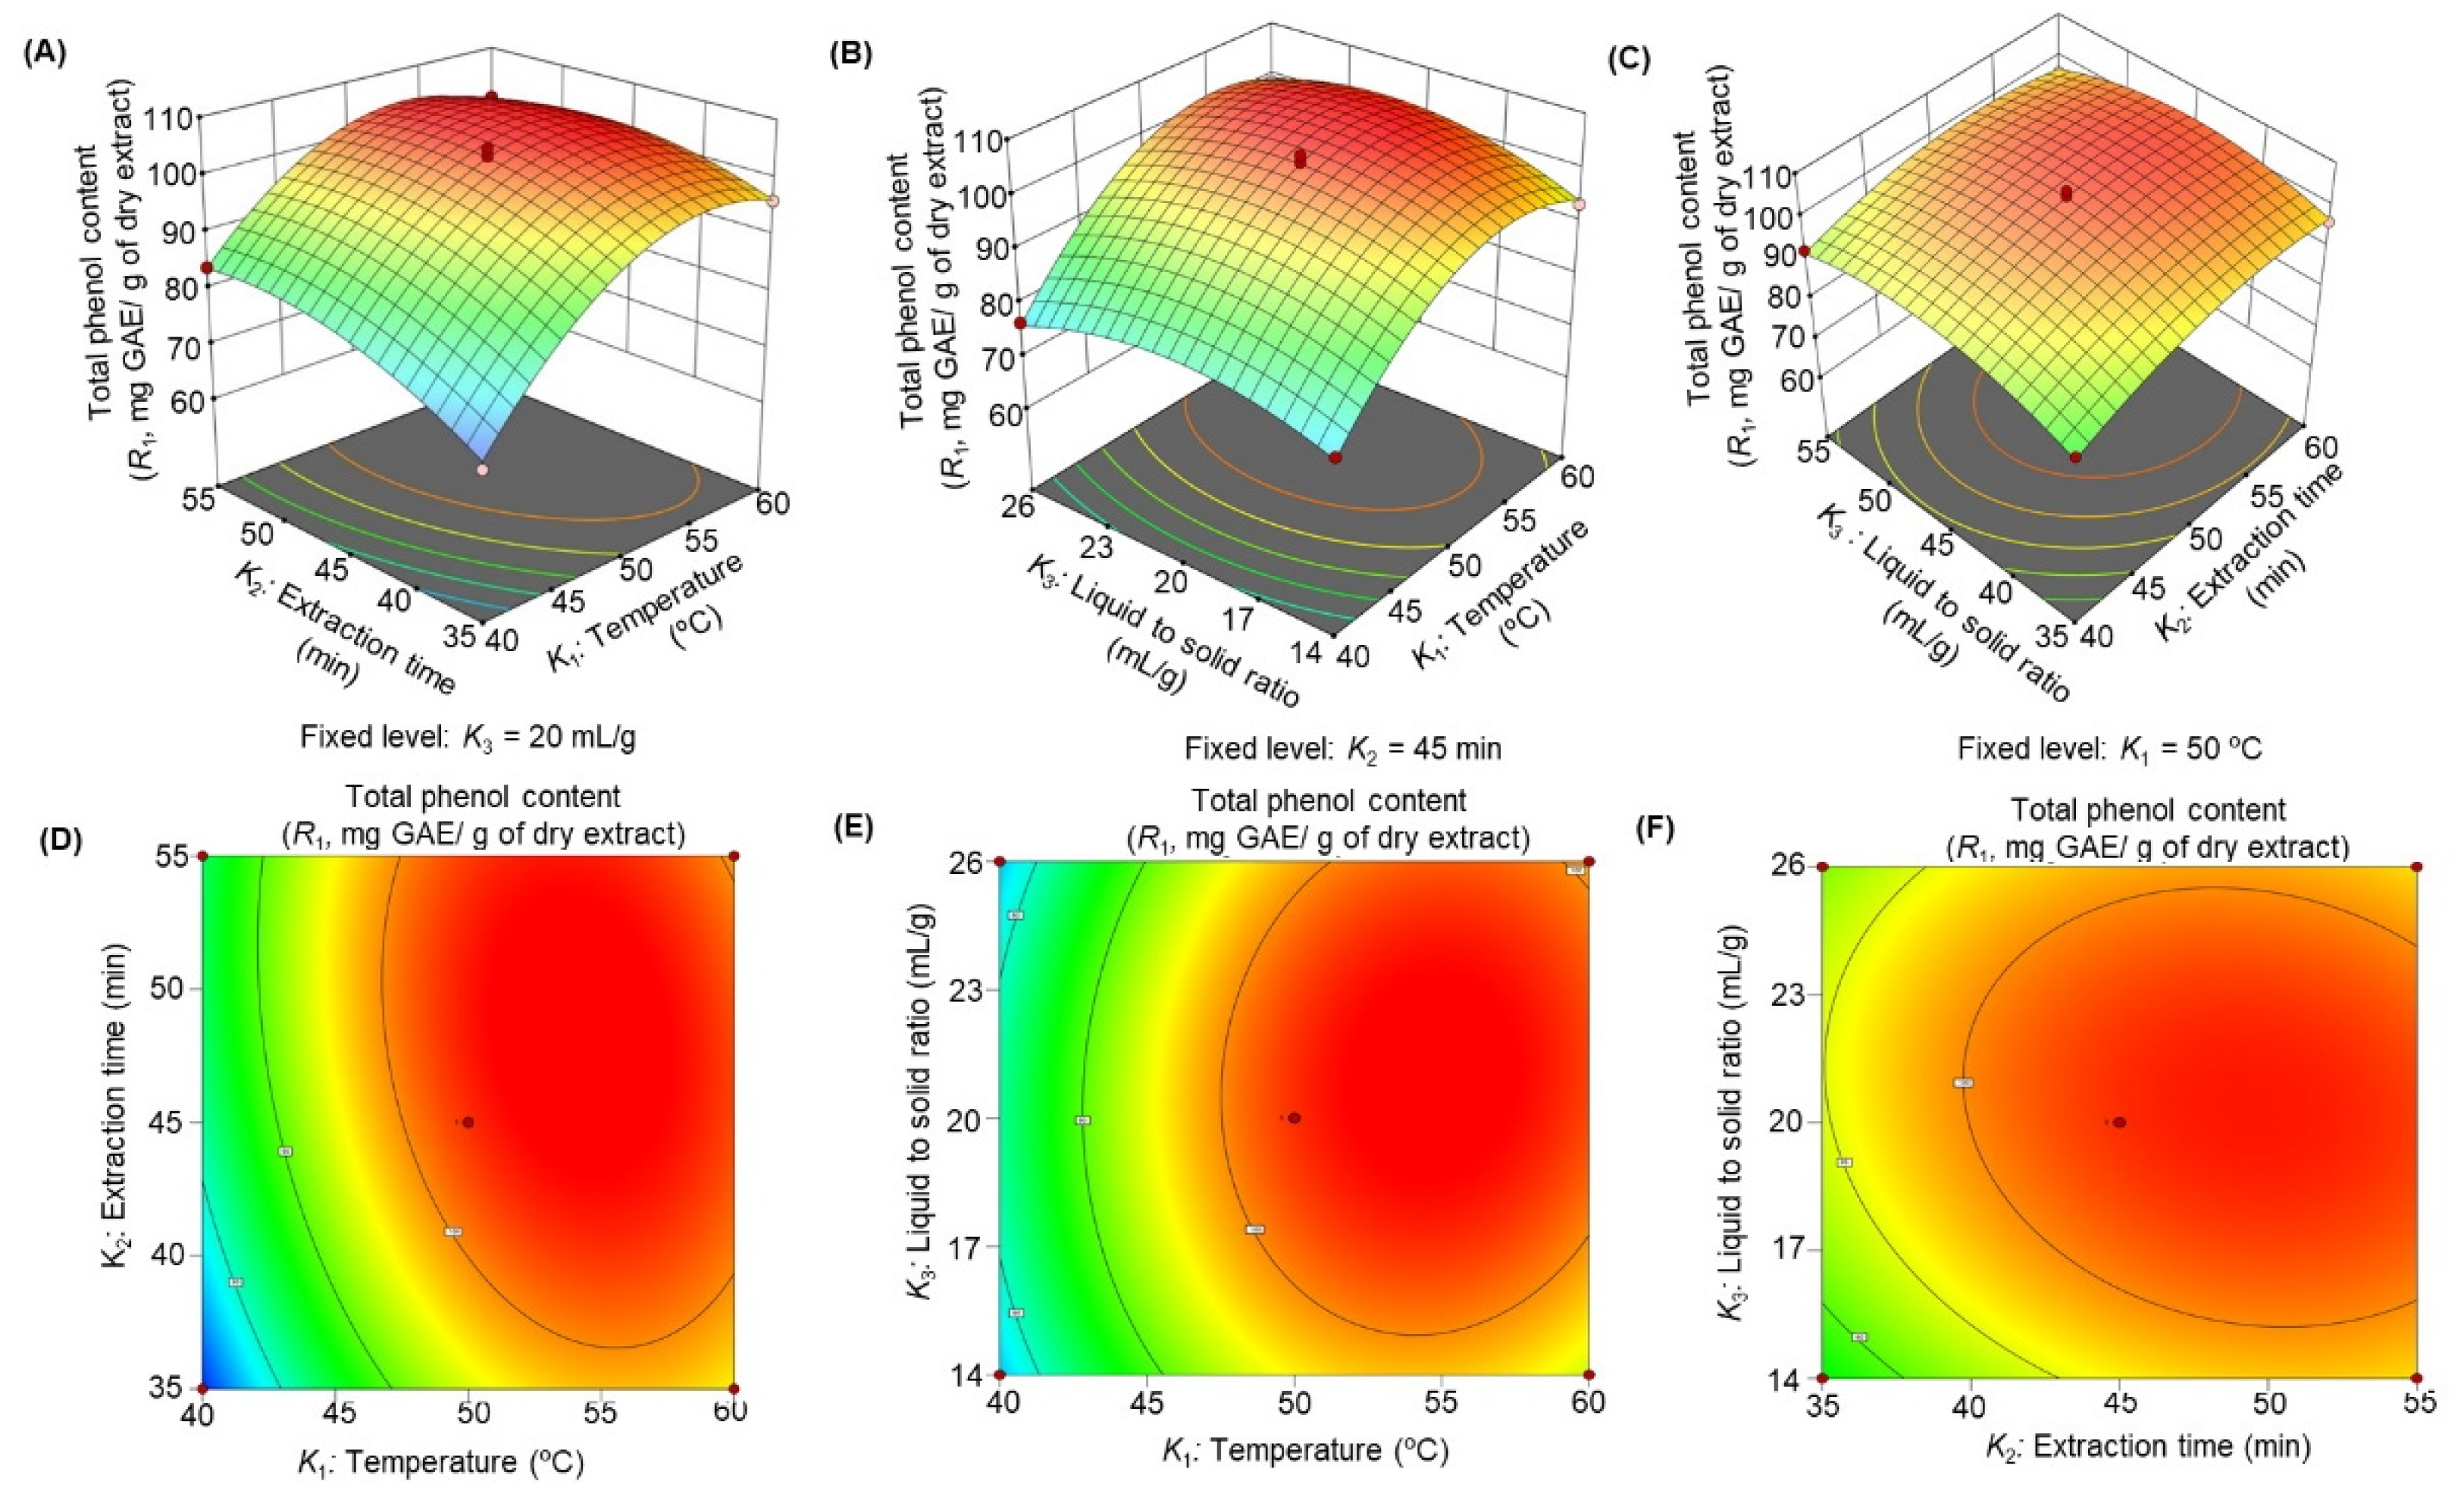
3.2.2. Influence of Extraction Parameters on Total Phenolic Content (TPC)

The TPC in the methanol extract of the P. schimperi aerial parts varied from 69.19 to 104.82 mg GAE/g (Table 2). The lowest and highest yield of TPC for 1 g of sample (constant K3 = 20 mL/g) was found at K1 of 40 °C after 35 min of K2, and K1 at 50 °C after 45 min of K2, respectively. Table 5 shows that K1 and K2 had significantly (p < 0.05) positive effects on TPC and the most crucial factor was K1 (F-value = 514.68). The quadratic effects (K12, K22 and K32) also had a significant (p < 0.05) impact on the TPC. Out of the quadratic effects of K12, K22, and K32 on the TPC extraction, the extraction temperature (F value = 320.33) exhibited the most favorable impact. The interaction of K1 and K2 was found to have a significant (p < 0.05) impact on TPC extraction, while the effects of the other interactions K1 and K3 and K2 and K3 were found to be insignificant (p > 0.05). The second-order polynomial equation for TPC was expressed as:
R1 = 103.23 + 10.34 K1 + 4.06 K2 + 1.24 K3 − 2.52 K1 K2 + 1.26 K1 K3 − 1.27 K1 K2 − 11.24 K12 − 4.55 K22 − 5.72 K32

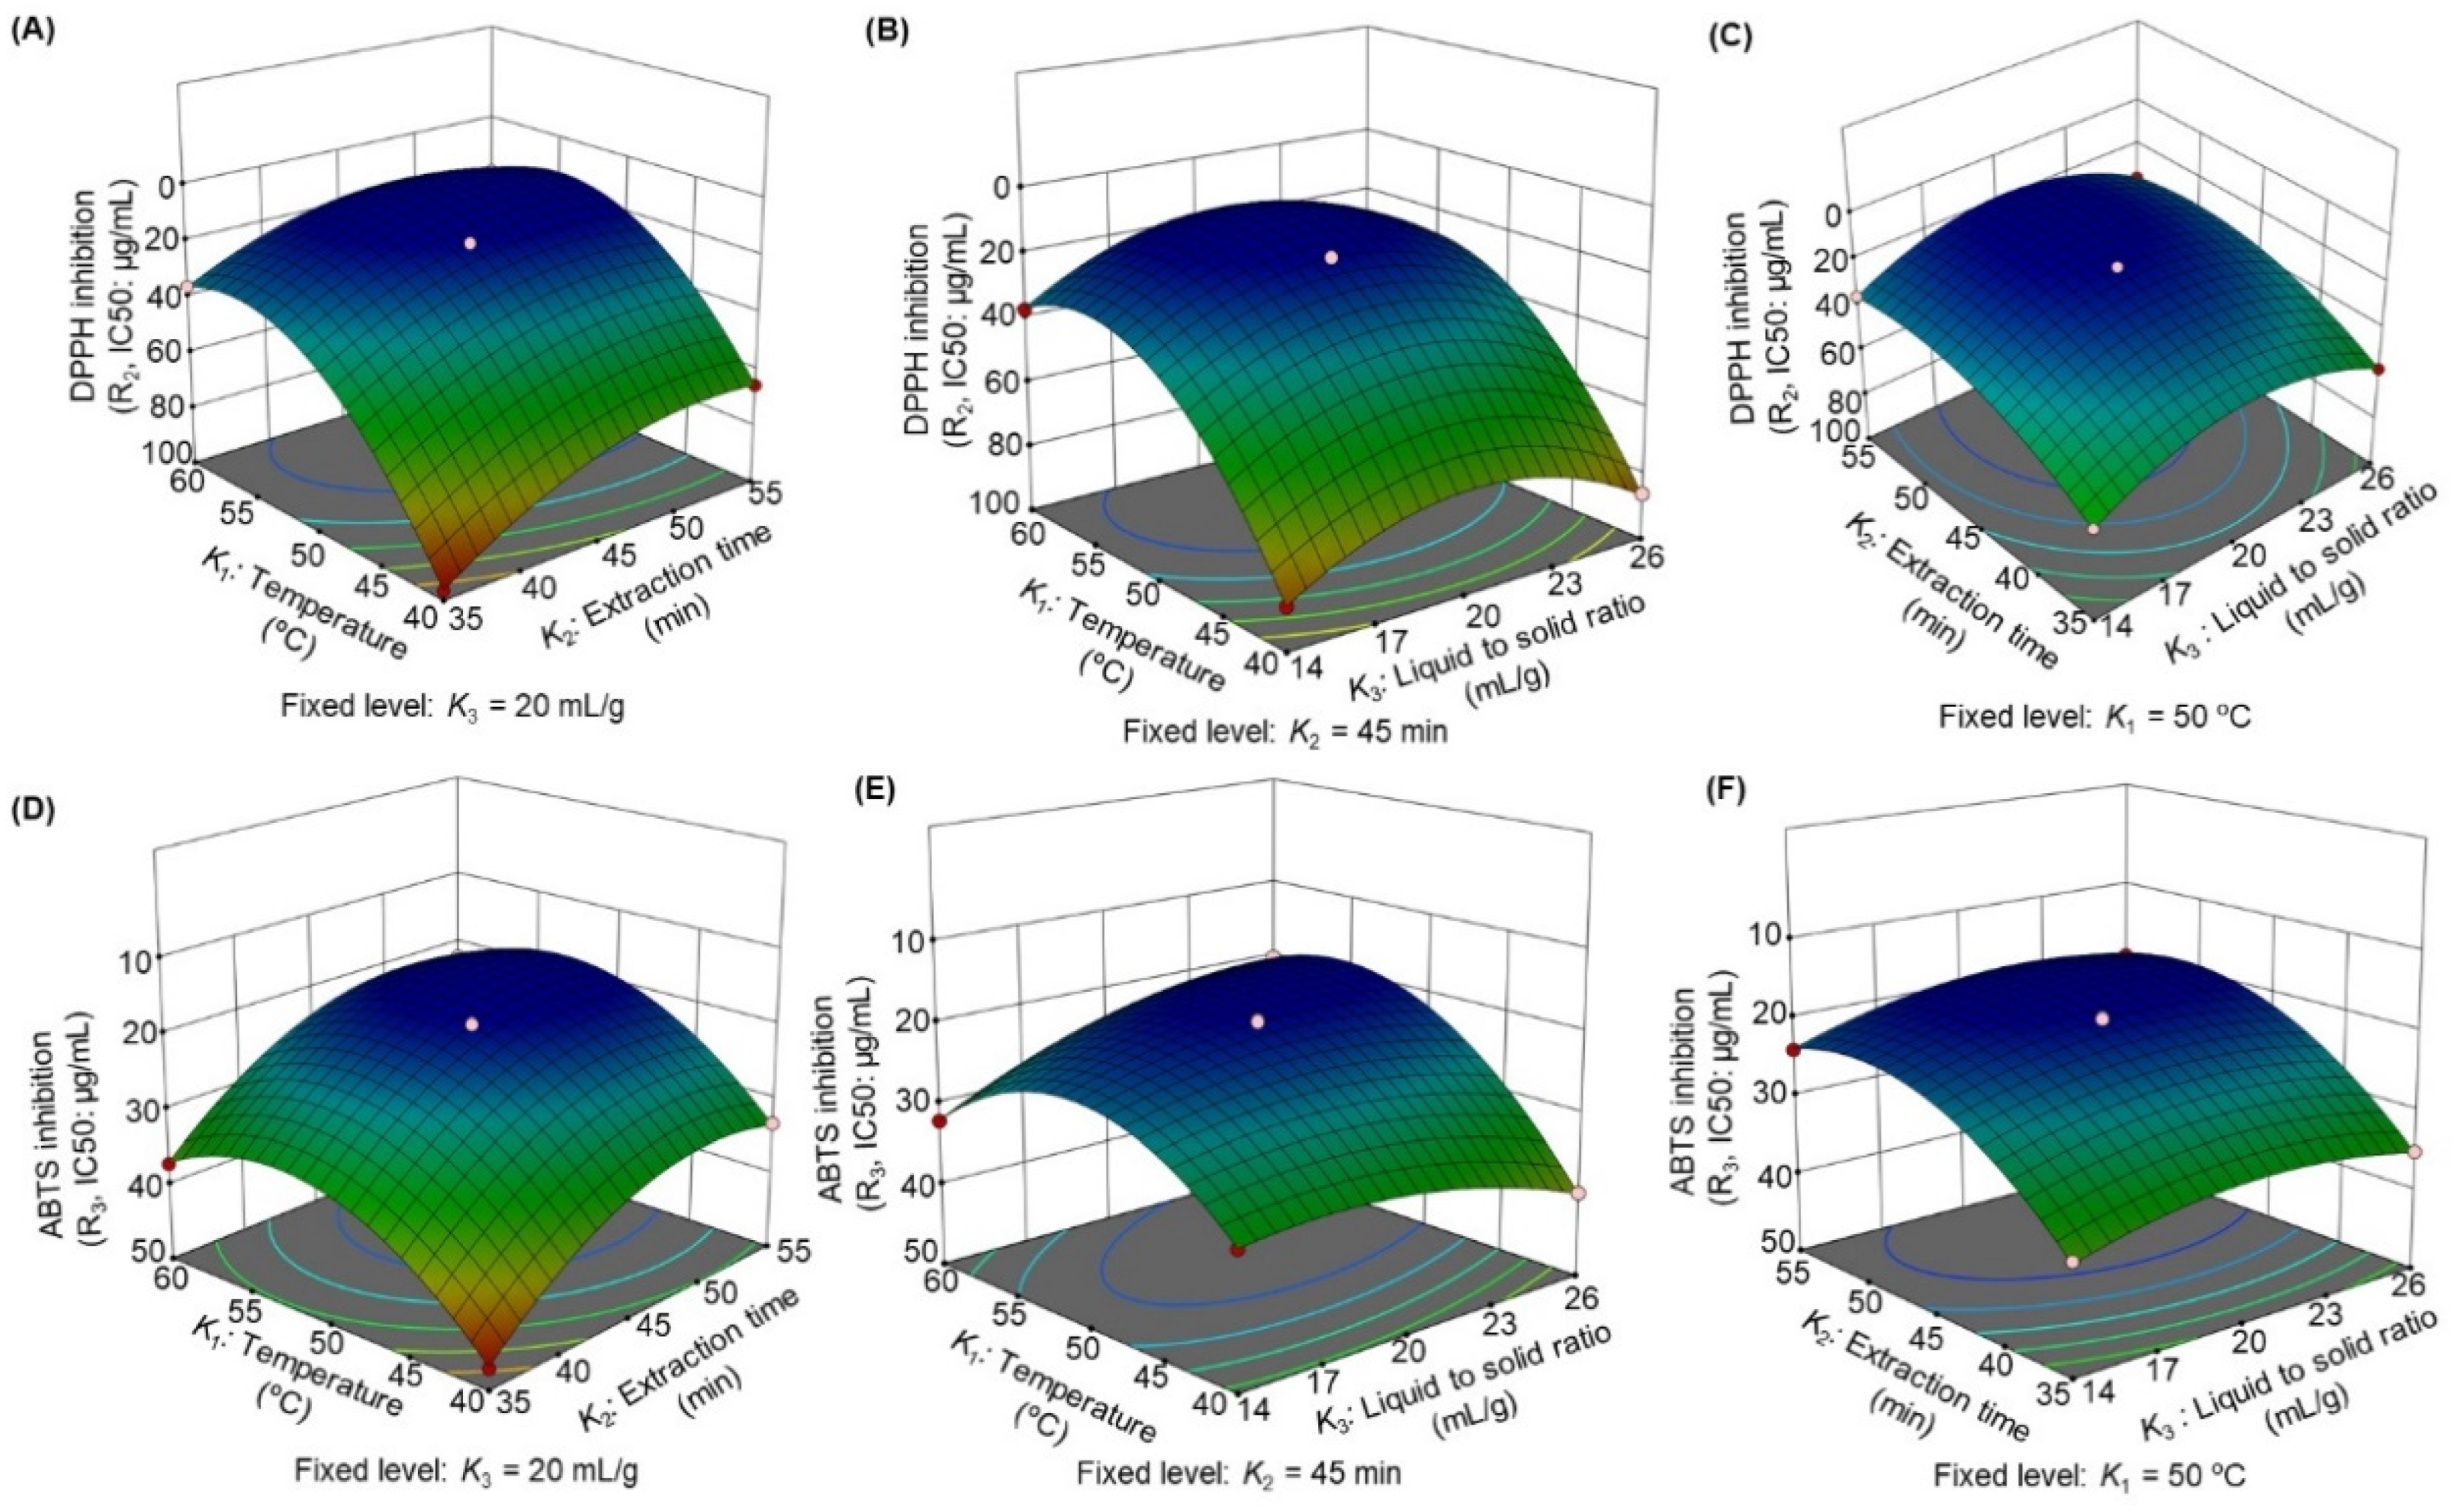
3.2.3. Influence of the Extraction Parameters on Antioxidant Activity

The antioxidant activity of the P. schimperi aerial part extract was evaluated by using ABTS and DPPH assays. The results in Table 2 and Table 5 showed that the DPPH and ABTS scavenging activity of the extract were influenced by K1, K2, and K3. The antioxidant activity (IC50) of the P. schimperi methanol extract varied from 18.1 to 96.8 µg/mL against the DPPH free radicals and 19.2 to 47.3 µg/mL against the ABTS free radicals. The lowest and highest free radical scavenging properties of P. schimperi were found at K1 of 40 °C after 35 min of K2 and, K1 at 50 °C after 45 min of K2, respectively, at constant K3 (20 mL/g). The model equation for DPPH (R2) and ABTS (R3) scavenging activity can be represented as follows:
R2 = 18.40 − 26.12 K1 − 11.68 K2 − 1.27 K3 + 4.07 K1 K2 − 0.98 K1 K3 + 0.63 K1 K2 + 24.99 K12 + 11.34 K22 + 17.39 K32
R3 = 19.50 − 5.31 K1 − 7.06 K2 − 1.42 K3 − 0.23 K1 K2 − 4.4 K1 K3 + 0.65 K1 K2 + 8.99 K12 + 6.44 K22 + 3.01 K32

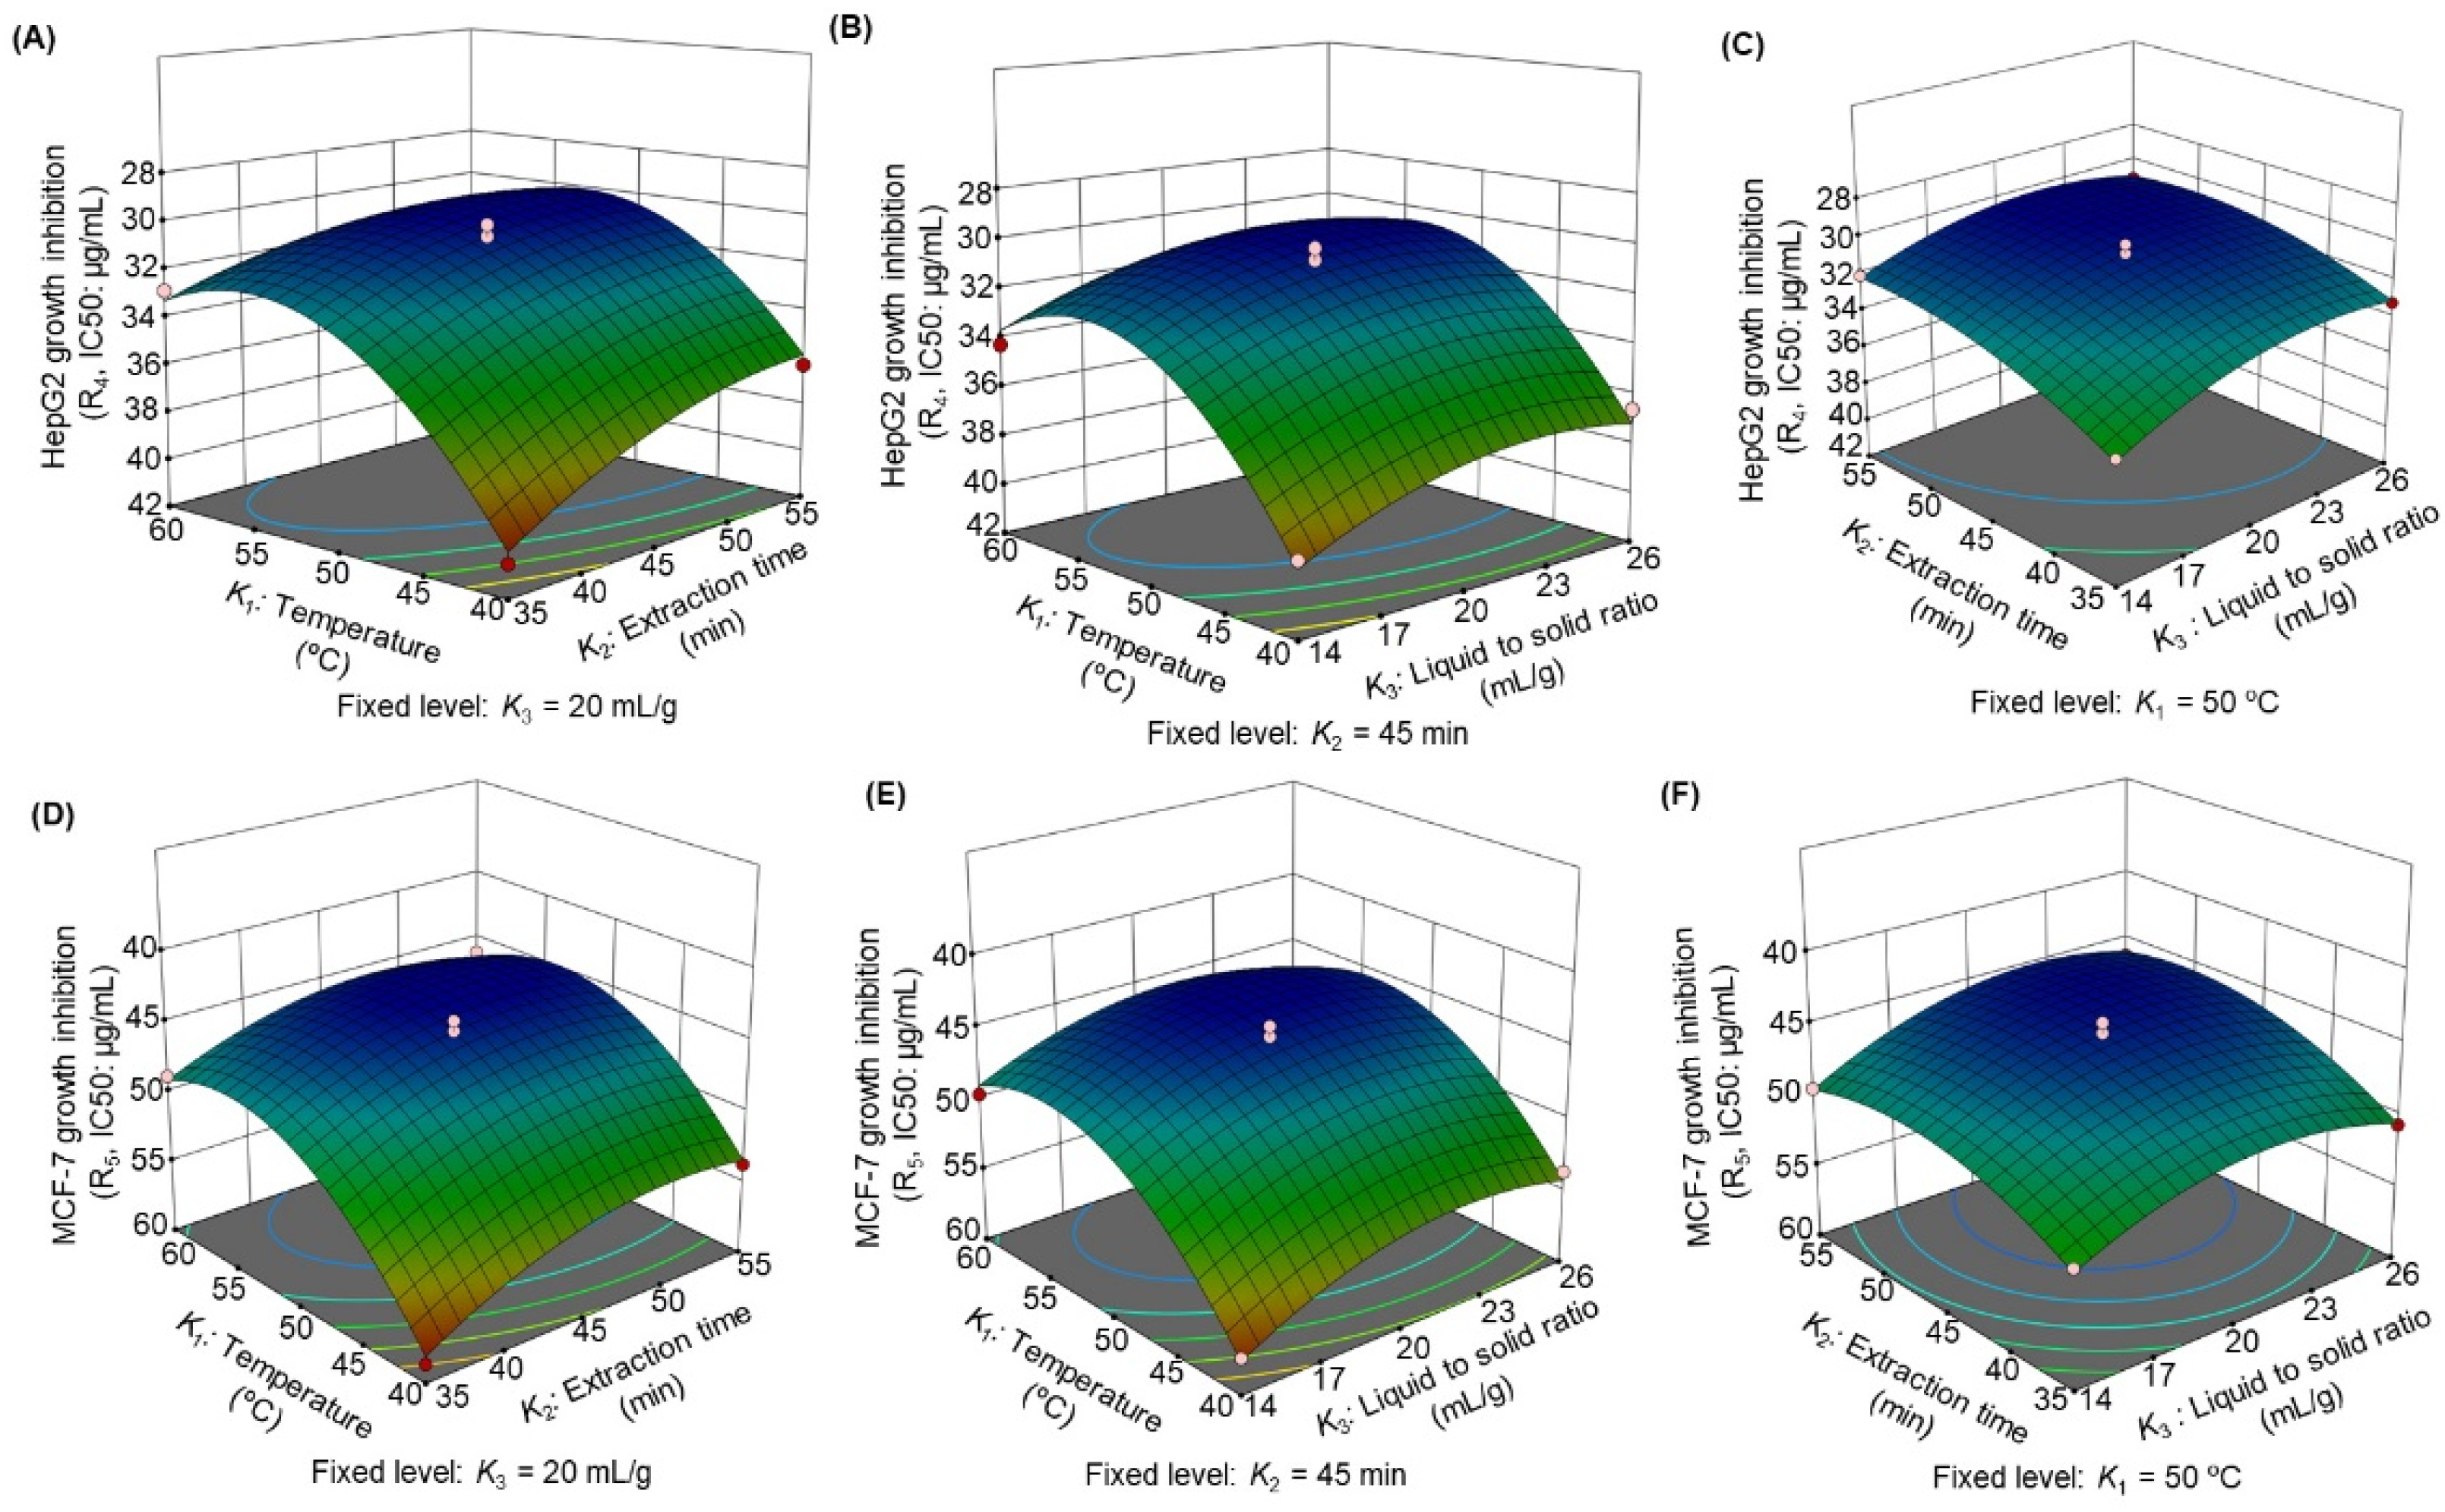
3.2.4. Influence of the Extraction Parameters on Anticancer Activity

The anticancer activity of the methanol extract of the P. schimperi aerial parts was evaluated using the human liver cancer cell line (HepG2) and breast cancer cell line (MCF-7). The results in Table 2 and Table 5 showed that the anticancer activity of the extract against the HepG2 and MCF-7 cells were influenced by all the extraction parameters (K1, K2, and K3). The anticancer activity (IC50 is the concentration required for 50% inhibition of cell viability) of the extract varied from 30.76 to 40.66 µg/mL against the HepG2 cells and 44.99 to 58.72 µg/mL against the MCF-7 cells. The lowest and highest inhibition of HepG2 and MCF-7 cells by the P. schimperi extract was found at K1 at 40 °C, 35 min of K2 and, K1 at 50 °C, 45 min of K2, respectively, at constant K3 (20 mL/g). The model equation for the HepG2 (R4) and MCF-7 (R5) cell inhibition can be represented as follows:
R4 = 30.76 − 2.72 K1 − 1.42 K2 − 0.98 K3 + 0.73 K1 K2 + 0.13 K1 K3 + 0.35 K1 K2 + 3.58 K12 + 0.99 K22 + 1.24 K32
R5 = 45.03 − 3.94 K1 − 1.82 K2 − 1.35 K3 + 0.59 K1 K2 + 0.43 K1 K3 − 0.44 K1 K2 + 4.63 K12 + 2.18 K22 + 2.41 K32

3.2.5. Optimization of Extraction Conditions and Verification of Predictive Model

By maximizing the desirability of the responses using BBD, the optimal extraction conditions for the maximal extraction of the phenolic compounds (TPC), antioxidant (DPPH and ABTS), and anticancer (against HepG2 and MCF-7 cells) activity of P. schimperi aerial parts were predicted. The ideal ultrasonic extraction parameters were identified as an extraction temperature of 54.4 °C, extraction period of 48 min, and liquid-to-solid ratio of 20.72 mL/g for the best TPC, DPPH, ABTS, HepG2, and MCF-7 in a single experiment. The maximum anticipated value for TPC from the numerical optimization was 107.23 mg GAE/g, while the IC50 values for the inhibition of DPPH, ABTS, HepG2, and MCF-7 were 15.1 mg/mL, 16.5 mg/mL, 26.2 mg/mL, and 31.3 mg/mL, respectively. Under the ideal extraction circumstances, the experiments were conducted, and the outcomes are given in Table 6. The actual results were found to be consistent with the projected results, demonstrating the validity of the model developed by BBD to forecast the total phenolic content, antioxidant capacity, and anticancer activity utilizing UAE.

3.2.6. Comparison of UAE with CSE

Table 7 shows the outcomes of the TPC, antioxidant, and anticancer activity from P. schimperi aerial parts by UAE and CSE. In comparison to CSE, the UAE technique considerably (p < 0.05) boosted the total phenolic content as well as the antioxidant and anticancer properties. Compared to CSE, UAE dramatically lowered the solvent usage and extraction time in addition to improving the extraction efficiency. The intracellular plant product was effectively discharged by ultrasound, which generates cavitation bubbles from ultrasonic waves that allow for penetration of the extraction solvent through the plant cell wall more effectively than previous techniques [17].

4. Discussion

In a single extraction factor experiment, it was discovered that when TPC was extracted at various extraction temperatures, it increased with higher temperatures and reached its maximum extraction value (41.96 mg GAE/g of dried extract) at 50 °C. After that, it remained constant as the extraction temperature was raised (Figure 1A). Similar to the effect of extraction temperature on TPC yield, it was discovered that the TPC extraction increased with increasing extraction time and reached the maximum extraction level at 50 min (40.57 mg GAE/g of dried extract), whereas the maximum TPC extraction was achieved at 26 mL/g of liquid-to-solid ratio (35.91 mg GAE/g of dried extract) (Figure 1 B,C). However, the TPC values were discovered to be constant with an increase in extraction time and liquid-to-solid ratio. These results contributed to the establishment of ranges for the UAE extraction variables including the extraction temperature (40–60 °C), extraction duration (35–55 min), and liquid-to-solid ratio (14–26 mL/g), which were optimized using the Box–Behnken design (BBD) of the response surface method (RSM).
The impact of the UAE extraction parameters [extraction temperature (K1), extraction duration (K2), and liquid-to-solid ratio (K3)] on the dependent variables [TPC (R1), DPPH (R2), ABTS (R3), HepG2 (R4), and MCF-7(R5)] were examined using a Box–Behnken design (BBD). The values obtained (Table 2) exhibited significant dependency of the dependent variables on the extraction conditions, which recommends the necessity to optimize the extraction method. For extraction method optimization, a quadratic polynomial model was developed using ANOVA to evaluate the model fitness and its adequacy. The results obtained by applying ANOVA showed that the quadratic polynomial model, in comparison to other models such as linear, 2FI, and cubic models, was highly significant (p < 0.0001) for all the dependent variables (R1, R2, R3, R4, and R5) (Table 3). The values of R2, adjusted R2, and predicted R2 for R1 (0.9938, 0.9858, and 0.0.9347, respectively), R2 (0.9999, 0.9998, and 0.9990, respectively), R3 (0.9995, 0.9990, and 0.9948, respectively), R4 (0.9872, 0.9708, and 0.8279, respectively), and R5 (0.9919, 0.9815, and 0.9081, respectively) were found to be close to 1, which indicated an excellent correlation between the predicted and actual values. Furthermore, the small values of the coefficient of variation (CV, %) for R1, R2, R3, R4, and R5 (1.38, 0.82, 1.05, 1.60 and 1.23, respectively) (Table 4) suggested the reliability and reproducibility of the experimental values [12]. The model’s F-values for R1, R2, R3, R4, and R5 were determined to be 124.78, 9968.65, 1697.08, 60.09, and 95.39, respectively, indicating that the model was significant and that there was only a 0.01% chance that noise could have caused such a high F-value. The residual/pure error of the proposed model for R1, R2, R3, R4, and R5 were found to be 11.62/4.39, 0.91/0.21, 0.60/0.2, 2.01/0.35, and 2.58/0.82, respectively. The precision for R1, R2, R3, R4, and R5 were found to be 33.09, 284.35, 122.05, 23.1, and 28.29, respectively, indicating adequate signal, which suggested that the model can be used to navigate the design space. Moreover, the lack of fit values for R1, R2, R3, R4, and R5 (2.19, 4.67, 2.72, 6.26, and 2.82, respectively) (Table 4) were not significant (p > 0.05), demonstrating the capability of the proposed model in envisaging the ultrasound-assisted extraction of phenolic compounds as well as the antioxidant and anticancer activities of P. schimperi aerial parts.
The different interaction impact of the independent variables (K1, K2, and K3) on TPC can be seen on the three-dimensional response surface plots (Figure 2A–C) and contour plots (Figure 2D–F). The UAE of TPC from P. schimperi initially increased and decreased with the increase in the extraction temperature (Figure 2A,B). Figure 2A,D shows that the TPC yield was high at 50 °C of extraction temperature after 45 min of extraction at 20 mL/g of the liquid-to-solid ratio. Supposedly, at high temperature, the tissues of the plant soften and the cell membranes are affected by weak interactions. Consequently, the phenolic compounds were extracted easily by the solvent [18]. However, the extraction yield decreased when it continued for a long time at 50 °C because the oxidation and degradation of the desired compounds took place due to high temperature [19]. Figure 2B,E exhibits the impact of the extraction temperature and liquid-to-solid ratio on the TPC yield at a constant extraction time of 45 min. The maximum TPC yield (103.18 mg GAE/g) was achieved at 50 °C and a liquid-to-solid ratio of 20 mL/g. At a high extraction temperature, the penetrating power of methanol increased, which led to the increased extraction of the plant matrix and an increase in the TPC yield. However, increasing the extraction temperature to 60 °C significantly reduced the yield because of the heat sensitivity of the compounds. Figure 2C,F demonstrates the effect of the liquid-to-solid ratios and extraction times on the TPC yields. At a fixed temperature of 50 °C, an increase in the extraction time reduced the yield to some extent. The maximum yield was about 102.11 mg GAE/g at a liquid-to-solid ratio of 20 mL/g and an extraction time of 45 min. The liquid-to-solid ratio alone had little impact on the TPC yield.
The antioxidant activity of the P. schimperi extract was evaluated by using ABTS and DPPH assays. The linear effects of K1, K2, K3 showed a negative effect on the DPPH and ABTS scavenging activity. The F-values for the linear effects of K1, K2, K3 were found to be 42,467.64, 8481.24, and 101.15, respectively, for the DPPH activity, and 2601.59, 4597.89, and 187.19, respectively for the ABTS activity. Likewise, the quadratic effects of K1, K2, K3 exhibited highly significant (p < 0.0001) positive effects on the DPPH and ABTS scavenging activity, with F-values of 20,447.37, 4209.46, 9900.71, respectively, for DPPH activity, and 3918.92, 2010.59, 440.29, respectively, for ABTS activity (Table 5). From Figure 3A, it is evident that there was a significant positive impact (p < 0.0001) of K1 K2 interaction on the DPPH scavenging activity (Table 4 and Table 5), while it showed a negative insignificant impact (>0.05) on ABTS. The other interaction of the extraction variables showed either a negative impact on the DPPH and ABTS scavenging activity (Figure 2B,D–F) or they were insignificant (>0.05) (Figure 2C). This indicated that the DPPH and ABTS scavenging activity of the extract was mainly affected quadratically by K1, K2, and K3 and not by their interaction, except for the effect of K1 K2 on the DPPH scavenging activity (Table 4 and Table 5). Consequently, the extract’s ability to scavenge DPPH and ABTS was improved by higher extraction temperatures and longer extraction times. Similar observations from the marc of chardonnay grapes were reported by Garrido et al. [20]. The presence of numerous phenolic compounds in the extract, which use different kinetics and reaction mechanisms for various antioxidant activities [21], similar to findings reported from vine pruning residues [22], may be the cause of the slight differences in the ABTS and DPPH scavenging patterns that were observed. The other species of genus Pulicaria such as P. inuloides and P. somalensis were found to exhibit excellent DPPH radical scavenging properties with IC50 values of 4.95 μg/mL and 81.2 μg/mL, respectively [23].
The anticancer activity of the P. schimperi aerial part methanol extract was evaluated using the human liver cancer cell line (HepG2) and breast cancer cell line (MCF-7). The linear effects of K1, K2, K3 exhibited (p < 0.001) a negative impact on the inhibition of the growth of HepG2 and MCF-7 cells with a high F-value for K1 [(206.53 for HepG2 and 337.49 for MCF-7 cells inhibition)]. Similarly, the quadratic effects of K1, K2, K3 exhibited highly significant (p < 0.0001) positive effects on the inhibition of HepG2 and MCF-7 cell growth. The F-values of the quadratic effects (K12, K22, and K32) were found to be 188.4, 14.61, and 22.58, respectively, for the HepG2 cells and 244.98, 54.27, and 66.20, respectively, for the MCF-7 cells. This indicates that the quadratic effect of the extraction temperature had the maximum impact on the inhibition of HepG2 and MCF-7 cells. From Figure 4A–E, it is evident that there was an insignificant impact (p > 0.05) of interaction between K1 K2, K1 K3, and K2 K3, on the growth inhibition of HepG2 and MCF-7 cells (Table 4 and Table 5). This suggests that the inhibition of HepG2 and MCF-7 cell growth was chiefly affected quadratically by linear factors K1, K2, and K3 and not by their interaction. Thus, the higher the extraction temperature, the better the growth inhibition of HepG2 and MCF-7 cells by the extract. This finding is in line with the findings of Aljawharah et al. (2022), which stated that P. schimperi extract was highly effective in controlling the growth of A375 cells (human melanoma cell line) [GI50 (the average growth inhibition of 50%) = 19 μg/mL] by arresting the cell cycle at the S phase and activating caspase 3/7. The other species of Pulicaria genus (e.g., P. undulata and its phytoconstituents) also exhibited good anticancer properties against multi-drug resistant cell lines [4]. Some other species of the Pulicaria genus exhibited anticancer property against HepG2 cells such as P. incisa (IC50 = 11.4 μg/mL), P. crispa (IC50 = 20.11 μg/mL), and P. wightiana (IC50 = 12.9 μg/mL), while significant action (IC50 = 5.36 μg/mL) was shown by P. vulgaris oil against the MCF-7 cell line [2].
Using information from the BBD analysis, the optimal extraction conditions for P. schimperi were identified as an extraction temperature of 54.4 °C, extraction time of 48 min, and a liquid-to-solid ratio of 20.72 mL/g min. These conditions allowed for the maximum extraction of phenolic compounds (TPC), antioxidants (DPPH and ABTS), and anticancer (against HepG2 and MCF-7 cells) activities. A model was developed to predict the total phenolic contents, antioxidant levels, and anticancer activities. Tests were conducted under these optimal extraction conditions, and the experimental values discovered were in accordance with the predicted values.
The results of the TPC, antioxidant, and anticancer activities from the P. schimperi aerial parts by UAE and CSE showed that the UAE method significantly (p < 0.05) increased the total phenolic content as well as the antioxidant and anticancer activities compared to CSE. Along with the improved extraction efficacy, the solvent use and time of extraction were reduced significantly by UAE when compared with CSE.

5. Conclusions

In this study, the BBD of RSM was used to efficiently optimize three extraction parameters of UAE for the maximal extraction of the total phenol content and antioxidant and anticancer properties of the P. schimperi extracts. The findings showed that the TPC extraction, antioxidant (DPPH and ABTS), and anticancer (HepG2 and MCF-7) activities of P. schimperi were substantially influenced by the temperature and duration of the extraction process and its TPC, antioxidant (DPPH and ABTS), and antitumor (HepG2 and MCF-7) activities were best extracted at the same time under the optimal conditions of 54.4 °C, 48 min, and 20.72 mL/g of the liquid-to-solid ratio. Under these improved UAE extraction settings, the experimental findings were discovered to conform with the expected values. With regard to the high extraction effectiveness, antioxidative, and anticancer properties at low extraction temperature and duration, UAE demonstrated considerable benefits over conventional solvent extraction (CSE). In order to extract polyphenolic antioxidants and anticancer secondary metabolites from the P. schimperi aerial parts for industrial uses, the optimized UAE approach may be useful.

Author Contributions

Conceptualization, P.A. and O.I.F.; Methodology, P.A., O.I.F., M.A. and O.M.A.; Investigation, P.A., O.I.F., G.A.A.-H., M.F.H. and A.S.A.; Writing—original draft preparation, P.A.; Software, A.A.; Validation, O.M.A. and G.A.A.-H.; Formal analysis, G.A.A.-H. and O.M.A.; Writing—review and editing, O.I.F., M.A., O.M.A., G.A.A.-H., A.A., M.F.H. and A.S.A.; Resources, P.A. and O.I.F.; Supervision, P.A. and A.S.A.; Project administration, P.A.; Funding acquisition, A.S.A. All authors have read and agreed to the published version of the manuscript.

Funding

This study was supported by King Saud University (RSP2023R132).

Data Availability Statement

Samples of the P. schimperi aerial parts are available from the authors upon reasonable request.

Acknowledgments

The authors are thankful to the Researchers Supporting Project number (RSP2023R132), King Saud University, Riyadh, Saudi Arabia.

Conflicts of Interest

The authors declare no conflict of interest.

References

  1. Zou, H.Q.; Lu, G.; Liu, Y.; Bauer, R.; Tao, O.; Gong, J.T.; Zhao, L.Y.; Li, J.H.; Ren, Z.Y.; Yan, Y.H. Is it possible to rapidly and noninvasively identify different plants from Asteraceae using electronic nose with multiple mathematical algorithms? J. Food Drug Anal. 2015, 23, 788–794. [Google Scholar] [CrossRef] [PubMed] [Green Version]
  2. Salleh, W.M.N.H.W.; Kassim, H.; Tawang, A. Volatile components and biological activities of Pulicaria essential oils. A review. Riv. Ital. Sostanze Grasse 2021, 98, 49–58. [Google Scholar]
  3. Wang, Y.-H.; Al-Rehaily, A.J.; Yousaf, M.; Ahmad, M.S.; Khan, I.A. Characterization and discrimination of different Pulicaria species using UHPLC-UV-MS QTOF (quadrupole time-of-flight mass spectrometer). J. Chem. Soc. Pak. 2015, 37, 967–973. [Google Scholar]
  4. AlQathama, A.; Bader, A.; Al-Rehaily, A.; Gibbons, S.; Prieto, J.M. In vitro cytotoxic activities of selected Saudi medicinal plants against human malignant melanoma cells (A375) and the isolation of their active principles. Eur. J. Integr. Med. 2022, 49, 102083. [Google Scholar] [CrossRef]
  5. Weremfo, A.; Adulley, F.; Adarkwah-Yiadom, M. Simultaneous Optimization of Microwave-Assisted Extraction of Phenolic Compounds and Antioxidant Activity of Avocado (Persea americana Mill.) Seeds Using Response Surface Methodology. J. Anal. Methods Chem. 2020, 2020, 7541927. [Google Scholar] [CrossRef]
  6. Rodiah, M.H.; Nur Asma Fhadhila, Z.; Noor Asiah, H.; Aziah, M.Y.; Kawasaki, N. Ultrasound-assisted extraction of natural colourant from husk of Cocos nucifera: A comparison with agitated-bed extraction. Pertanika J. Sci. Technol. 2018, 26, 1039–1052. [Google Scholar]
  7. Yang, J.; Li, N.; Wang, C.; Chang, T.; Jiang, H. Ultrasound-homogenization-assisted extraction of polyphenols from coconut mesocarp: Optimization study. Ultrason. Sonochem. 2021, 78, 105739. [Google Scholar] [CrossRef]
  8. Alam, P.; Noman, O.M.; Herqash, R.N.; Almarfadi, O.M.; Akhtar, A.; Alqahtani, A.S. Efficient Extraction of an Anthraquinone Physcion Using Response Surface Methodology (RSM) Optimized Ultrasound-Assisted Extraction Method from Aerial Parts of Senna occidentalis and Analysis by HPLC-UV. Separations 2022, 9, 142. [Google Scholar] [CrossRef]
  9. Alam, P.; Noman, O.M.; Herqash, R.N.; Almarfadi, O.M.; Akhtar, A.; Alqahtani, A.S. Response Surface Methodology (RSM)-Based Optimization of Ultrasound-Assisted Extraction of Sennoside A, Sennoside B, Aloe-Emodin, Emodin, and Chrysophanol from Senna alexandrina (Aerial Parts): HPLC-UV and Antioxidant Analysis. Molecules 2022, 27, 298. [Google Scholar] [CrossRef]
  10. Siddiqui, N.A.; Alam, P.; Alrehaily, A.J.; Alqahtani, A.S.; Akhtar, A.; Alhowiriny, T.A.; Almarfadi, O.M.; Mothana, R.A. Optimization of ultrasound-assisted parthenolide extraction from Tarchonanthus camphoratus leaves using response surface methodology: HPTLC and cytotoxicity analysis. Arab. J. Chem. 2021, 14, 103194. [Google Scholar] [CrossRef]
  11. Alam, P.; Siddiqui, N.A.; Alqahtani, A.S.; Haque, A.; Basudan, O.A.; Alqasoumi, S.I.; AL-Mishari, A.A.; Khan, M.U. Response surface methodology-based optimization of ultrasound-assisted extraction of β-sitosterol and lupeol from Astragalus atropilosus (roots) and validation by HPTLC method. Asian Pac. J. Trop. Biomed. 2020, 10, 281–292. [Google Scholar] [CrossRef]
  12. Singleton, C.P.; Rossi, J.A. Colorimetry of Total Phenolic Compounds with Phosphomolybdic-Phosphotungstic Acid Reagents. Am. J. Enol. Vitic. 1965, 16, 144–158. [Google Scholar]
  13. Alqahtani, A.S.; Noman, O.M.; Rehman, M.T.; Siddiqui, N.A.; Alajmi, M.F.; Nasr, F.A.; Shahat, A.A.; Alam, P. The influence of variations of furanosesquiterpenoids content of commercial samples of myrrh on their biological properties. Saudi Pharm. J. 2019, 27, 981–989. [Google Scholar] [CrossRef]
  14. Almarfadi, O.M.; Siddiqui, N.A.; Shahat, A.A.; Alqahtani, A.S.; Alam, P.; Nasr, F.A.; Alshahrani, S.S.; Noman, O.M. Quantification of biomarkers and evaluation of antioxidant, anti-inflammatory, and cytotoxicity properties of Dodonaea viscosa grown in Saudi Arabia using HPTLC technique. Open Chem. 2022, 20, 559–569. [Google Scholar] [CrossRef]
  15. Li, X.; Wang, X.; Chen, D.; Chen, S. Antioxidant activity and mechanism of protocatechuic acid in vitro. Funct. Food Health Dis. 2011, 1, 232–244. [Google Scholar] [CrossRef]
  16. Alam, P.; Al-Yousef, H.M.; Siddiqui, N.A.; Alhowiriny, T.A.; Alqasoumi, S.I.; Amina, M.; Hassan, W.H.B.; Abdelaziz, S.; Abdalla, R.H. Anticancer activity and concurrent analysis of ursolic acid, β-sitosterol and lupeol in three different Hibiscus species (aerial parts) by validated HPTLC method. Saudi Pharm. J. 2018, 26, 1060–1067. [Google Scholar] [CrossRef]
  17. Lee, M.H.; Lin, C.C. Comparison of technique for extraction of isoflavones from the root of Radix Puerariae: Ultrasonic and pressurised solvent extraction. Food Chem. 2007, 105, 223–228. [Google Scholar] [CrossRef]
  18. Shi, J.; Yu, J.; Pohorly, J.; Young, J.C.; Bryan, M.; Wu, Y.; Canada, A. Optimization of the extraction of polyphenols from grape seed meal by aqueous ethanol solution. J. Food Agric. Environ. 2003, 1, 42–47. [Google Scholar]
  19. Naczk, M.; Shahidi, F. Extraction and analysis of phenolics in food. J. Chromatogr. A 2004, 1054, 95–111. [Google Scholar] [CrossRef]
  20. Garrido, T.; Gizdavic-Nikolaidis, M.; Leceta, I.; Urdanpilleta, M.; Guerrero, P.; de la Caba, K.; Kilmartin, P.A. Optimizing the extraction process of natural antioxidants from chardonnay grape marc using microwave-assisted extraction. Waste Manag. 2019, 88, 110–117. [Google Scholar] [CrossRef]
  21. Pandey, A.; Belwal, T.; Sekar, K.C.; Bhatt, I.D.; Rawal, R.S. Optimization of ultrasonic-assisted extraction (UAE) of phenolics and antioxidant compounds from rhizomes of Rheum moorcroftianum using response surface methodology (RSM). Ind. Crops Prod. 2018, 119, 218–225. [Google Scholar] [CrossRef]
  22. Jesus, M.S.; Genisheva, Z.; Roman, A.; Pereira, R.N.; Teixeira, J.A.; Domingues, L. Bioactive compounds recovery optimization from vine pruning residues using conventional heating and microwave-assisted extraction methods. Ind. Crops Prod. 2019, 132, 99–110. [Google Scholar] [CrossRef] [Green Version]
  23. Hussein, K.; Ahmed, A.H.; Al-Maqtari, M.A. Composition and Radical Scavenging Activity of Edible Wild Pulicaria jaubertii (Asteraceae) volatile Oil. PSM Biol. Res. 2017, 2, 21–29. [Google Scholar]
Figure 1. The effects of single factors on the total phenol content (mg GAE/g of dry extract). (A) Effect of extraction temperature (°C); (B) effect of extraction time (min); (C) effect of liquid-to-solid ratio (mL/g). Each value represents a mean ± SD (n = 5).
Separations 10 00208 g001
Figure 2. Response surface 3D and 2D contour plots showing the interaction effects of the UAE parameters on the TPC (R1). (A) 3-D response surface plots shows the effects of K1 and K2 interaction on TPC yield at constant K3 (20 mL/g); (B) 3-D response surface plots shows the effects of K1 and K3 interaction on TPC yield at constant K2 (45 min); (C) 3-D response surface plots shows the effects of K2 and K3 interaction on TPC yield at constant K1 (50 °C); (D) 2-D contour plots shows the effects of K1 and K2 interaction on TPC yield at constant K3 (20 mL/g); (E) 2-D contour plots shows the effects of K1 and K3 interaction on TPC yield at constant K2 (45 min); (F) 2-D contour plots shows the effects of K2 and K3 interaction on TPC yield at constant K1 (50 °C).
Separations 10 00208 g002
Figure 3. Response surface 3D plots showing the interaction effects of the UAE parameters on the DPPH (R2) and ABTS (R3) activity. (A) 3-D response surface plots shows the effects of K1 and K2 interaction on DPPH inhibition (IC50) at constant K3 (20 mL/g); (B) 3-D response surface plots shows the effects of K1 and K3 interaction on DPPH inhibition (IC50) at constant K2 (45 min); (C) 3-D response surface plots shows the effects of K2 and K3 interaction on DPPH inhibition (IC50) at constant K1 (50 °C); (D) 3-D response surface plots shows the effects of K1 and K2 interaction on ABTS inhibition (IC50) at constant K3 (20 mL/g); (E) 3-D response surface plots shows the effects of K1 and K3 interaction on ABTS inhibition (IC50) at constant K2 (45 min); (F) 3-D response surface plots shows the effects of K2 and K3 interaction on ABTS inhibition (IC50) at constant K1 (50 °C).
Separations 10 00208 g003
Figure 4. Response surface 3D plots showing the interaction effects of UAE variables on human liver cancer cell line (HepG2; R4) and breast cancer cell line (MCF-7; R5). (A) 3-D response surface plots shows the effects of K1 and K2 interaction on growth inhibition of HepG2 cells (IC50) at constant K3 (20 mL/g); (B) 3-D response surface plots shows the effects of K1 and K3 interaction on growth inhibition of HepG2 cells (IC50) at constant K2 (45 min); (C) 3-D response surface plots shows the effects of K2 and K3 interaction on growth inhibition of HepG2 cells (IC50) at constant K1 (50 °C); (D) 3-D response surface plots shows the effects of K1 and K2 interaction on growth inhibition of MCF-7 cells (IC50) at constant K3 (20 mL/g); (E) 3-D response surface plots shows the effects of K1 and K3 interaction on growth inhibition of MCF-7 cells (IC50) at constant K2 (45 min); (F) 3-D response surface plots shows the effects of K2 and K3 interaction on growth inhibition of MCF-7 cells (IC50) at constant K1 (50 °C).
Separations 10 00208 g004
Table 1. Three levels of the three variables of the extraction process.
Independent
Variable
Factor LevelDependent VariablesGoal
−10+1Total phenolic content
(mg GAE/g of dry extract)
(R1)
DPPH inhibition
(IC50: µg/mL)
(R2)
ABTS inhibition
(IC50: µg/mL)
(R3)
HepG2 growth inhibition
(IC50: µg/mL)
(R4)
MCF-7 growth
inhibition
(IC50: µg/mL)
(R5)
Maximized
Extraction
temperature (°C) (K1)
405060
Extraction time
(min) (K2)
354555
Liquid-to-solid
ratio (mL/g) (K3)
142026
Table 2. Box–Behnken design (BBD) with the observed response of the dependent variables (TPC, DPPH, ABTS, HepG2, and MCF-7) from the UAE of P. schimperi (aerial parts).
RunCoded VariablesActual VariablesTotal Phenolic ContentAntioxidant ActivityAnticancer Activity
(K1) (°C)(K2) (min)(K3) (mL/g)(K1) (°C)(K2) (min)(K3) (mL/g)(mg AE/g of Dry Extract) (R1)DPPH
IC50 (µg/mL) (R2)
ABTS
IC50 (µg/mL) (R3)
HepG2
IC50 (µg/mL) (R4)
MCF-7
IC50 (µg/mL) (R5)
1000504520103.53 ± 4.9118.3 ± 0.7919.4 ± 0.7730.28 ± 1.1744.27 ± 1.94
2−1−1040352069.19 ± 2.8596.8 ± 4.9547.3 ± 1.7440.66 ± 1.7858.72 ± 2.51
3110605520100.64 ± 4.2120.8 ± 0.9622.1 ± 0.8131.48 ± 1.1546.14 ± 2.13
41−1060352096.08 ± 3.7836.1 ± 0.1537.1 ± 1.5132.89 ± 1.3748.82 ± 1.71
5−11040552083.85 ± 3.5965.2 ± 2.5433.2 ± 1.2636.33 ± 1.5653.66 ± 1.97
6000504520104.82 ± 4.4918.1 ± 0.6719.2 ± 0.5830.76 ± 1.1144.99 ± 2.03
710160452698.57 ± 4.6632.3 ± 1.3520.3 ± 0.7132.33 ± 1.3247.44 ± 1.95
801−150551496.35 ± 4.5135.9 ± 1.7924.1 ± 0.7732.1 ± 1.3749.5 ± 2.12
910−160451493.47 ± 4.2937.3 ± 1.6132.1 ± 1.4834.27 ± 1.6149.63 ± 2.09
10−10140452676.54 ± 3.7286.2 ± 3.2639.7 ± 1.6536.63 ± 1.53 53.62 ± 2.49
110−1150352692.11 ± 4.4557.1 ± 2.3335.1 ± 1.2233.2 ± 1.1850.61 ± 2.32
12−10−140451476.49 ± 2.8887.3 ± 3.7333.9 ± 1.1139.1 ± 1.6857.56 ± 2.52
13000504520102.11 ± 4.0518.7 ± 0.7719.8 ± 0.7230.98 ± 1.3745.13 ± 2.24
14000504520102.51 ± 3.8818.5 ± 0.8619.6 ± 0.7130.77 ± 1.1345.39 ± 2.08
150−1−150351487.19 ± 3.7560.4 ± 2.7936.5 ± 1.5735.6 ± 1.6652.04 ± 2.14
1601150552696.18 ± 3.5235.1 ± 1.7620.1 ± 0.8731.1 ± 1.2946.3 ± 1.68
17000504520103.18 ± 4.5118.4 ± 0.5919.5 ± 0.6931.03 ± 1.3545.36 ± 1.95
Quercetin 7.46 ± 0.26
Ascorbic Acid 7.74 ± 0.29
Vinblastine 2.3 ± 0.072.8 ± 0.05
K1 = extraction temperature; K2 = extraction time; K3 = liquid-to-solid ratio; TPC = total phenolic content; DPPH = 2,2-diphenyl-1-picrylhydrazyl radical scavenging ability; ABTS = 2,2′-azinobis-(3-ethylbenzothiazoline-6-sulfonic acid) scavenging ability; HepG2 = human liver cancer cell line; MCF-7 = breast cancer cell line.
Table 3. Regression analysis and response regression equation results for the final proposed model.
Dependent VariablesSourceR2Adjusted R2Predicted R2SDSequential p-ValueLack of Fit
p-Value
R1Linear0.53210.42420.28628.220.01680.0003
2FI0.55260.2841−0.19489.160.92590.0002
Quadratic 0.99380.98580.93471.29<0.00010.2312Suggested
Cubic0.99770.9906 1.050.2312
R2Linear0.56900.46950.364819.560.0101<0.0001
2FI0.57520.3203−0.072422.140.9849<0.0001
Quadratic0.99990.99980.99900.35<0.00010.0854Suggested
Cubic1.00000.9999 0.220.0854
R3Linear0.48340.36420.19257.260.0308<0.0001
2FI0.54320.2692−0.20847.780.7317<0.0001
Quadratic0.99950.99900.99480.29<0.00010.1793Suggested
Cubic0.99980.9994 0.220.1793
R4Linear0.52810.41920.24462.390.01770.0003
2FI0.54530.2724−0.37022.670.94270.0001
Quadratic0.98720.97080.82790.53<0.00010.0542Suggested
Cubic0.99780.9910 0.290.0542
R5Linear0.51880.40780.27973.430.02000.0004
2FI0.52810.2450−0.23173.880.97680.0002
Quadratic0.99190.98150.90810.61<0.00010.1712Suggested
Cubic0.99740.9896 0.450.1712
Table 4. Regression coefficients (β) and analysis of variance (ANOVA) of the predicted second-order polynomial modes for TPC, antioxidant, and anticancer activity.
FactorCoefficient (β)
R1R2R3R4R5
Intercept103.2318.4019.5030.7645.03
Linear
K110.34−26.12−5.31−2.72−3.94
K24.06−11.68−7.06−1.42−1.82
K31.24−1.27−1.42−0.98−1.35
Interaction
K1 K2−2.524.07−0.230.730.59
K1 K31.26−0.97−4.400.130.44
K2 K3−1.270.62−0.650.35−0.44
Quadratic
K12−11.2424.998.993.584.63
K22−4.5511.346.440.992.18
K32−5.7217.393.011.242.41
F-value (model)124.789968.651697.0860.0995.39
p-value (model)<0.0001 s<0.0001 s<0.0001 s<0.0001 s<0.0001 s
F-value (lack of fit)2.19 ns4.67 ns2.72 ns6.26 ns2.82 ns
CV(%)1.380.821.051.601.23
Adeq precision33.09284.35122.0523.128.29
Residual11.620.910.60752.012.58
Pure error4.390.210.200.350.8277
s Significant; ns Not significant.
Table 5. Significance of each response variable effect shown by using the F ratio and p-value in the near second-order model.
Dependent VariablesIndependent VariablesSS aDF bMS cF-Valuep-Value d
R1Linear effects
K1854.701854.70514.68<0.0001
K2131.631131.6379.26<0.0001
K312.25112.257.380.0299
Quadratic effects
K1K225.50125.5015.360.0058
K1K36.3816.383.840.0909
K2K36.4816.483.900.0888
Interaction effects
K12531.951531.95320.33<0.0001
K2287.17187.1752.490.0002
K32137.881137.8883.03<0.0001
R2Linear effects
K15460.1215460.1242467.64<0.0001
K21090.4411090.448481.24<0.0001
K313.01113.01101.15<0.0001
Quadratic effects
K1K266.42166.42516.62<0.0001
K1K33.8013.8029.570.0010
K2K31.5611.5612.150.0102
Interaction effects
K122628.9512628.9520447.37<0.0001
K22541.221541.224209.46<0.0001
K321272.9511272.959900.71<0.0001
R3Linear effects
K1225.781225.782601.59<0.0001
K2399.031399.034597.89<0.0001
K316.24116.24187.19<0.0001
Quadratic effects
K1K20.202510.20252.330.1705
K1K377.44177.44892.31<0.0001
K2K31.6911.6919.470.0031
Interaction effects
K12340.111340.113918.92<0.0001
K22174.491174.492010.59<0.0001
K3238.21138.21440.29<0.0001
R4Linear effects
K159.13159.13206.53<0.0001
K216.07116.0756.140.0001
K37.6217.6226.630.0013
Quadratic effects
K1K22.1312.137.440.0294
K1K30.070210.07020.24530.6356
K2K30.490010.49001.710.2321
Interaction effects
K1253.94153.94188.40<0.0001
K224.1814.1814.610.0065
K326.4716.4722.580.0021
R5Linear effects
K1124.271124.27337.49<0.0001
K226.61126.6172.26<0.0001
K314.47114.4739.300.0004
Quadratic effects
K1K21.4211.423.850.0907
K1K30.765610.76562.080.1925
K2K30.783210.78322.130.1881
Interaction effects
K1290.20190.20244.98<0.0001
K2219.98 19.9854.270.0002
K3224.37124.3766.20<0.0001
a Sum of squares; b Degree of freedom; c Mean sum of squares; d p-values < 0.05 were considered to be significant; ns: insignificant.
Table 6. Experimental and predicted values of the responses at the optimum extraction condition.
Response VariablesOptimum Extraction ConditionMaximum Value
K1 (°C)K2 (min)K3 (mL/g)Experimental ValuePredicted Value
TPC (mg GAE/g) (R1)54.44820.72107.93 ± 3.28107.23
DPPH [IC50 (µg/mL)] (R2)15.7 ± 0.5115.1
ABTS [IC50 (µg/mL)] (R3)17.1 ± 0.6816.5
HepG2 [IC50 (µg/mL)] (R4)25.67 ± 1.0726.2
MCF-7 [IC50 (µg/mL)] (R5)31.87 ± 1.3331.3
Table 7. Comparison of UAE and CSE.
Extraction MethodTemp
(°C)
Time
(min)
Methanol
(mL/g)
TPC
(mg GAE/g)
DPPH
IC50 (µg/mL)
ABTS
IC50 (µg/mL)
HepG2
IC50 (µg/mL)
MCF-7
[IC50 (µg/mL)]
UAE54.44820.72107.16 ± 4.9615.7 ± 0.5117.1 ± 0.6825.67 ± 1.0731.87 ± 1.33
CSE75602574.29 ± 3.2147.3 ± 2.1754.1 ± 2.5257.11 ± 2.6461.28 ± 2.77
Disclaimer/Publisher’s Note: The statements, opinions and data contained in all publications are solely those of the individual author(s) and contributor(s) and not of MDPI and/or the editor(s). MDPI and/or the editor(s) disclaim responsibility for any injury to people or property resulting from any ideas, methods, instructions or products referred to in the content.

