Article

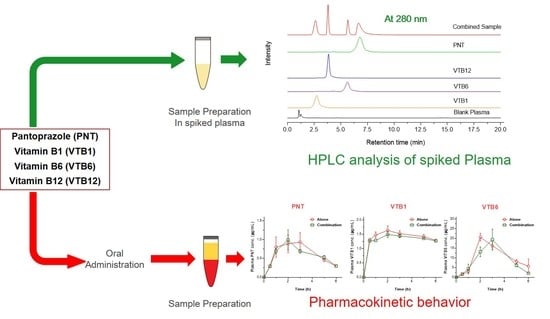
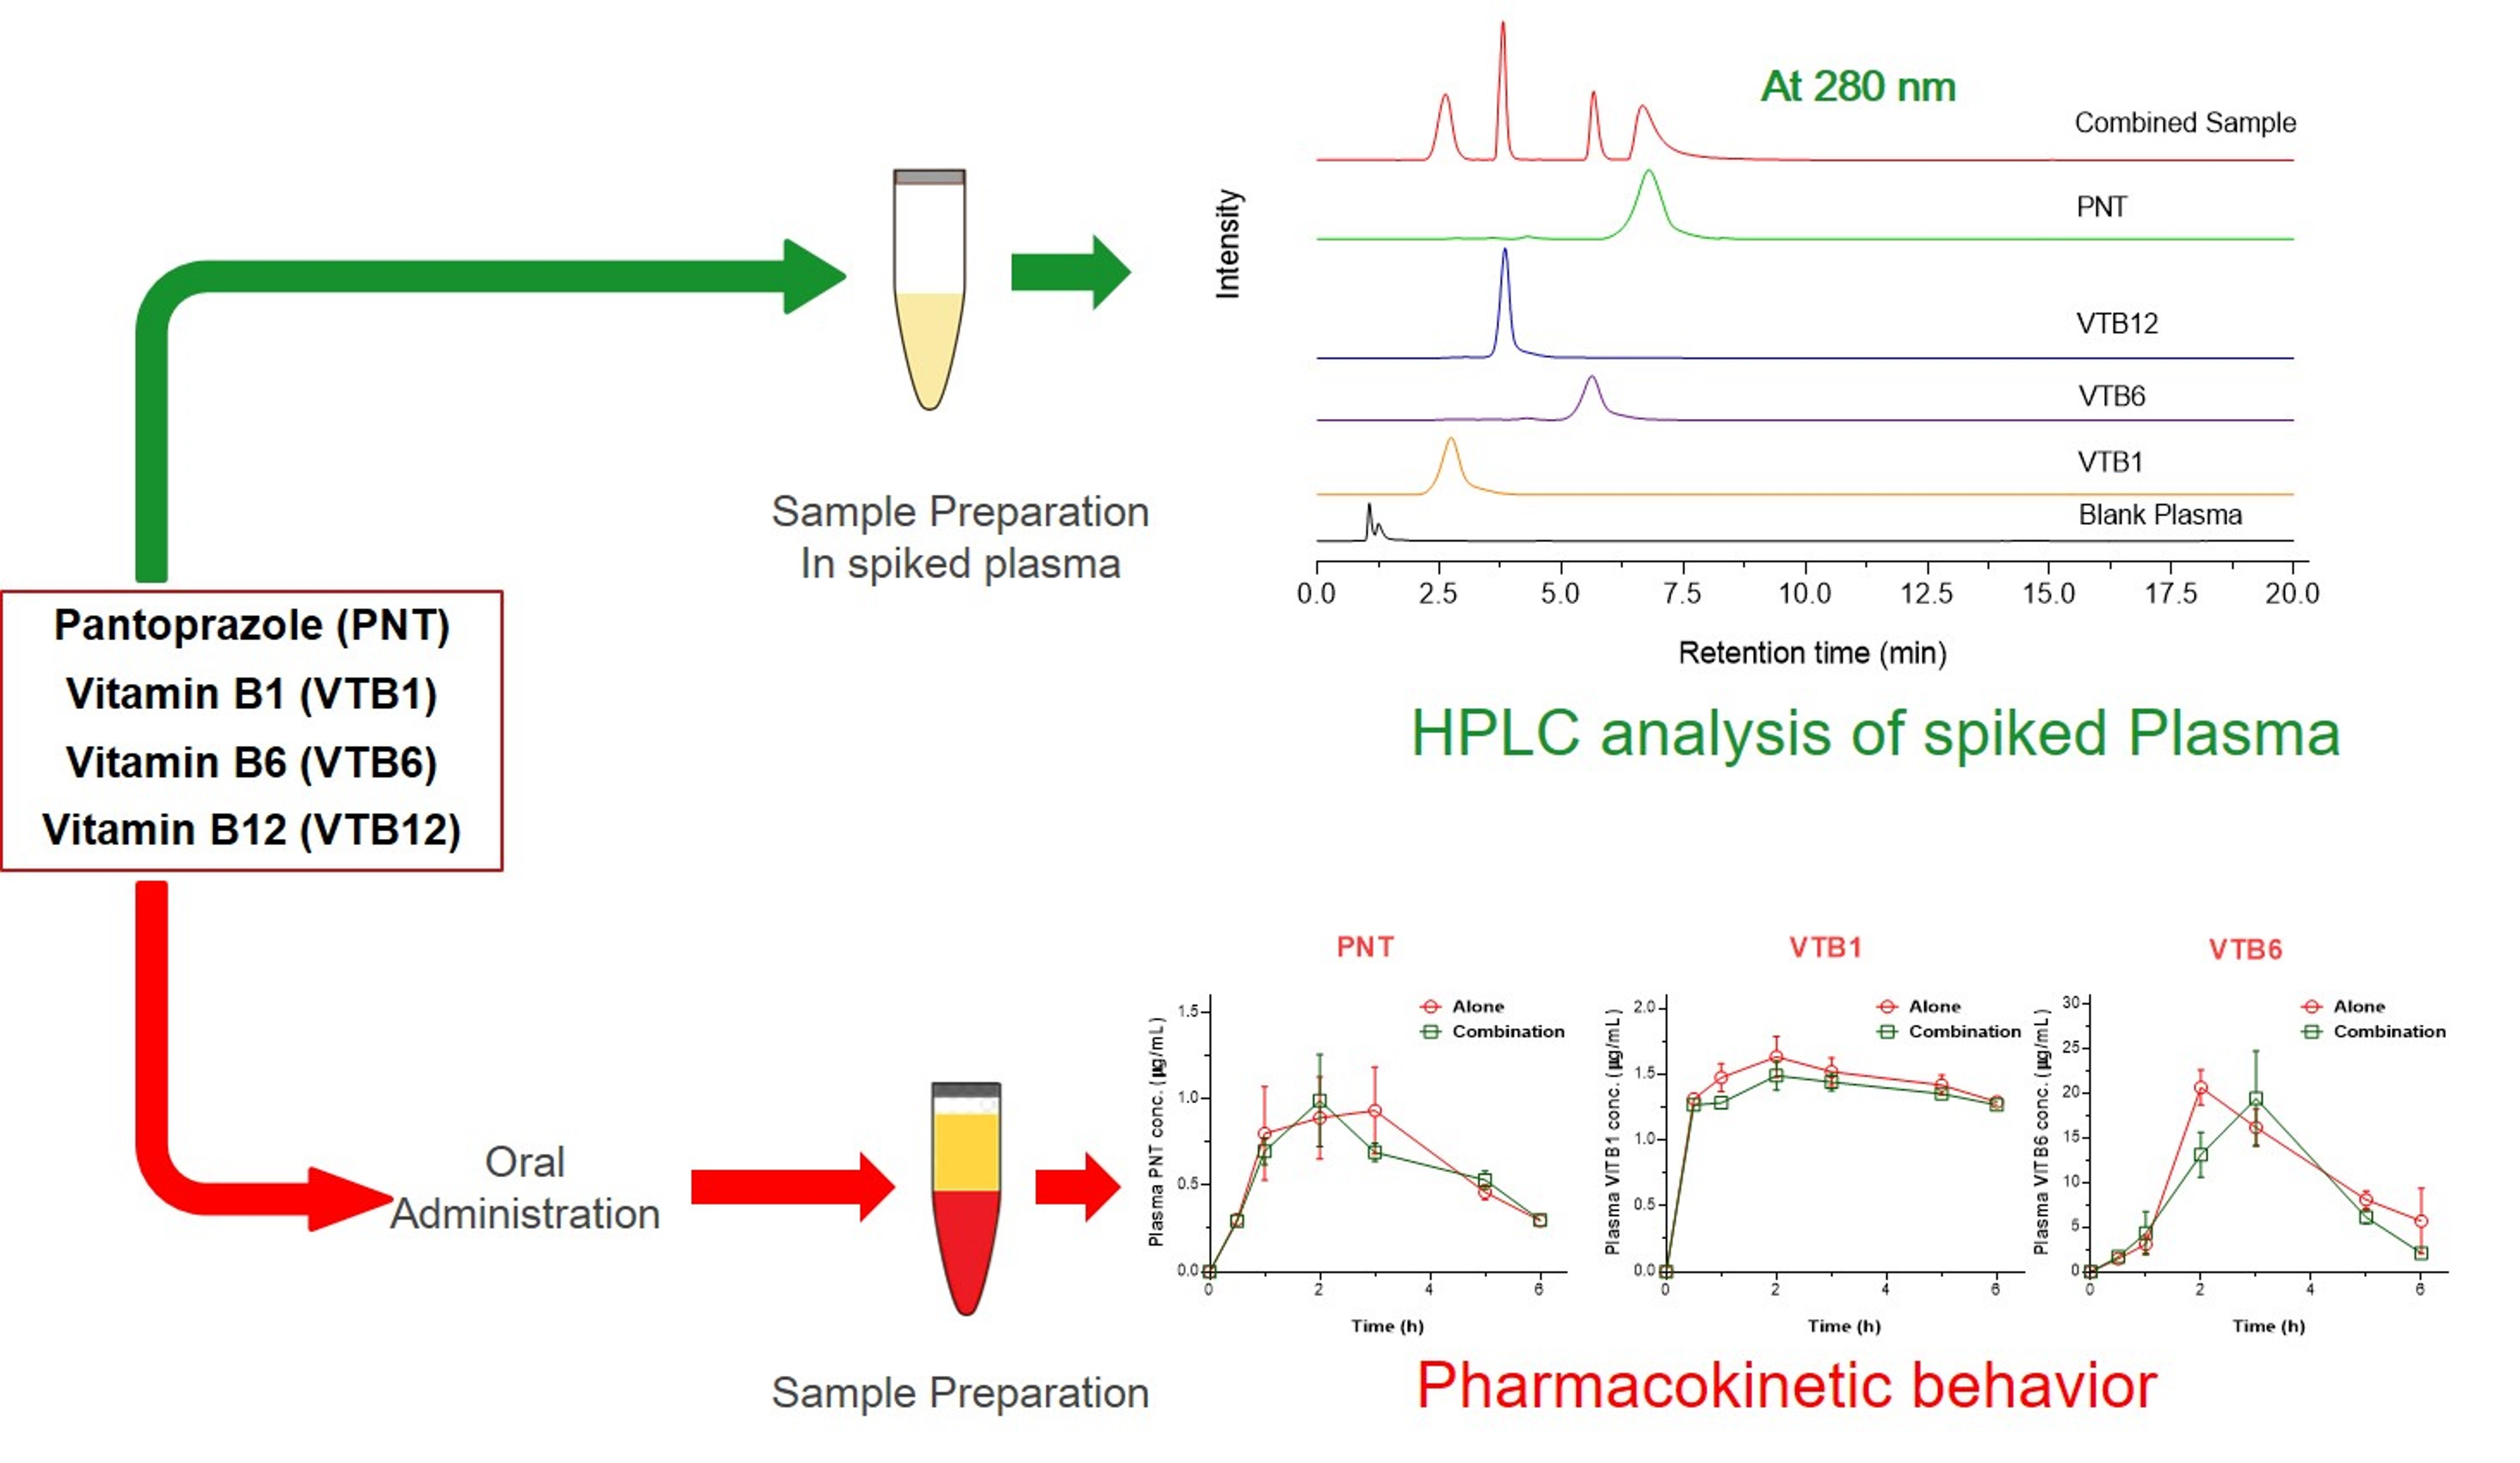
Simultaneous Pharmacokinetic Evaluation of Pantoprazole and Vitamin B Complex for Assessing Drug–Drug Interactions in Healthy Bangladeshi Adults by a Newly Developed and Validated HPLC Method

1
Department of Clinical Pharmacy and Pharmacology, Faculty of Pharmacy, University of Dhaka, Dhaka 1000, Bangladesh
2
Department of Pharmaceutical Technology, Faculty of Pharmacy, University of Dhaka, Dhaka 1000, Bangladesh
*
Authors to whom correspondence should be addressed.
Separations 2023, 10(3), 170; https://doi.org/10.3390/separations10030170
Submission received: 9 February 2023 / Revised: 26 February 2023 / Accepted: 27 February 2023 / Published: 2 March 2023
(This article belongs to the Section Analysis of Natural Products and Pharmaceuticals)

Abstract

:
The present study has been designed to evaluate the impact of the co-administration of pantoprazole (PNT) with vitamin B (VTB) complex (VTB comprising VTB1, VTB6, and VTB12 in this study) on pharmacokinetic behavior. In this study, HPLC-based sensitive and efficient methods for simultaneous determination in human plasma were developed per US-FDA bioanalytical standards. The pharmacokinetic parameters of PNT, VTB1, VTB6, and VTB12 were also evaluated when the medicines were administered alone and co-administered. Following linearity, it was observed that the plasma PNT, VTB1, VTB6, and VTB12 retention times were 6.8 ± 0.2, 2.7 ± 0.1, 5.5 ± 0.2, and 3.8 ± 0.1 min, respectively, over the range of 1−100 μg/mL. For all analytes at the lower limit of quantification and all other values, intra-assay and inter-assay bias were within 15% and 13.5%, respectively. They barely interacted when PNT and VTB samples were evaluated in physical combinations through in vitro tests. Moreover, in the pharmacokinetics study, treatment with VTB did not significantly alter the pharmacokinetic characteristics of PNT. Therefore, the current work’s results might help assess drug–drug interactions that may be applied to bioequivalence studies and therapeutic drug monitoring.

Graphical Abstract

1. Introduction

Polypharmacy, or using various medications to treat multiple health conditions, is common among the elderly with numerous illnesses [1]. Polypharmacy is related to adverse effects such as death, falls, unfavorable drug reactions, a more extended hospital stay, and hospital readmission soon after discharge [2,3]. Increasing the number of drugs increases the chance of adverse effects and catastrophes [4]. Several factors, such as drug–drug interactions (DDIs) and drug–disease interactions, might cause harm [5]. Polypharmacy has been associated with adverse outcomes, including higher healthcare expenses, an increased risk of adverse drug events and DDIs, medication nonadherence, decreased functional ability, and numerous geriatric syndromes [6,7].
DDIs, which have a prevalence of 20–40 percent in industrialized nations and are particularly common in the elderly due to polytherapy, are among the most common causes of medication errors [8]. Mainly, polytherapy raises the bar for therapeutic control and, thus, the danger of clinically significant DDIs, which can lead to adverse drug responses and lower clinical efficacy [9,10]. DDIs can be divided into two primary categories: pharmacokinetic and pharmacodynamic. They result from the concurrent administration of medications that can alter the pharmacokinetics and pharmacodynamics of co-administered therapies, decreasing their therapeutic efficacy or increasing their toxicity [11,12]. DDIs are often taken into account based on each drug’s knowledge and are determined by monitoring changes in plasma drug concentrations and the patient’s clinical symptoms [13].
In a recent survey, Proton pump inhibitors (PPI) and multivitamins were prescribed in 500 prescriptions between 2015 and 2017 (data not published yet). Only 200 out of 500 prescriptions were confirmed to contain PPI and multivitamins. This study mainly used Omeprazole, Pantoprazole, Esomeprazole, and Rabeprazole with multivitamins, especially vitamin B (VTB) complexes. Additionally, this survey observed that patients between 20 and 35 take PPI and VTB together more frequently. In the evidence-based treatment of upper gastrointestinal illnesses such as gastroesophageal reflux disease, erosive esophagitis, dyspepsia, and peptic ulcer disease, PPIs are the best option globally [14,15]. PPIs have been linked to a higher risk of vitamin and mineral deficiencies, which can affect the metabolism of VTB12, vitamin C, calcium, iron, and magnesium [16].
Pantoprazole (PNT) is a gastric (H+/K+-ATPase) inhibitor which is one of the PPIs that has been prescribed. It prevents H+/K+-ATPase from forming in the secretory canaliculus of the activated parietal cell. As a powerful medication with a low rate of first-pass metabolism and a bioavailability of 77%, PNT helps treat gastric and duodenal ulcers and erosive esophagitis [17]. Compared to other proton pump inhibitors, it is a more effective inhibitor of acid secretion and activates tetracyclic cationic sulfenamide at low pH levels [18]. In addition, VTBs are a collection of eight water-soluble vitamins that work as co-enzymes in a wide range of catabolic and anabolic enzymatic activities [19]. They play crucial, closely connected roles in cellular activity. VTBs are essential for several physiological functions, including energy production, DNA/RNA synthesis and repair, genomic and non-genomic methylation, and the production of several neurochemicals and signaling molecules [20,21].
Our research on any potential DDI between PNT and VTB in the healthy Bangladeshi population was prompted by an adverse drug report (ADR) regarding the development of VTB deficiency while being treated with PNT [22]. Although VTB and PNT are prescribed concurrently in a significant percentage of cases in Bangladesh, there is still little information on potential pharmacokinetic interactions or their potential effects.
The current study aimed to identify potential drug–drug interactions and their potential pharmacokinetic effects when PNT and VTBs (Figure 1) were administered concurrently to healthy Bangladeshi volunteers. To our knowledge, no analytical technique can simultaneously determine PNT and VTB in biological fluids and pharmaceutical formulations. To better understand the pharmacodynamic and combinatorial effects of the target medications, new analytical methodologies for pharmacokinetics, DDI, and bioequivalence investigations are therefore considered necessary. Therefore, this study was designed for method development and validation of the determination of PNT and VTBs administered concurrently and evaluation of their pharmacokinetic parameters for possible DDIs.

2. Materials and Methods

2.1. Materials

Reference standard samples of PNT, VTB1, VTB6, and VTB12 were procured from Sigma-Aldrich (St. Louis, MO, USA). Aristopharma Ltd., Dhaka, Bangladesh, provided working samples as a generous gift. The commercial dosage forms of PNT and VTB were collected from local drug shops. Acetonitrile (HPLC grade), water (HPLC grade), and methanol (HPLC grade) were procured from RCI Labscan Limited (Bangkok, Thailand). All other chemicals and reagents were purchased from commercial sources as analytical or reagent grade.

2.2. In Vitro Drug–Drug Interaction Study

2.2.1. Sample Preparation

To evaluate the in vitro interaction between PNT and VTB, solid-state characterization in terms of X-Ray Powder Diffraction, Differential Scanning Calorimetry, and Fourier Transform Infrared Spectroscopic studies were carried out. For solid-state physicochemical characterization, a 1:1 ratio of PNT, VTB1, VTB6, and VTB12 was taken in a mortar and appropriately mixed using a pestle.

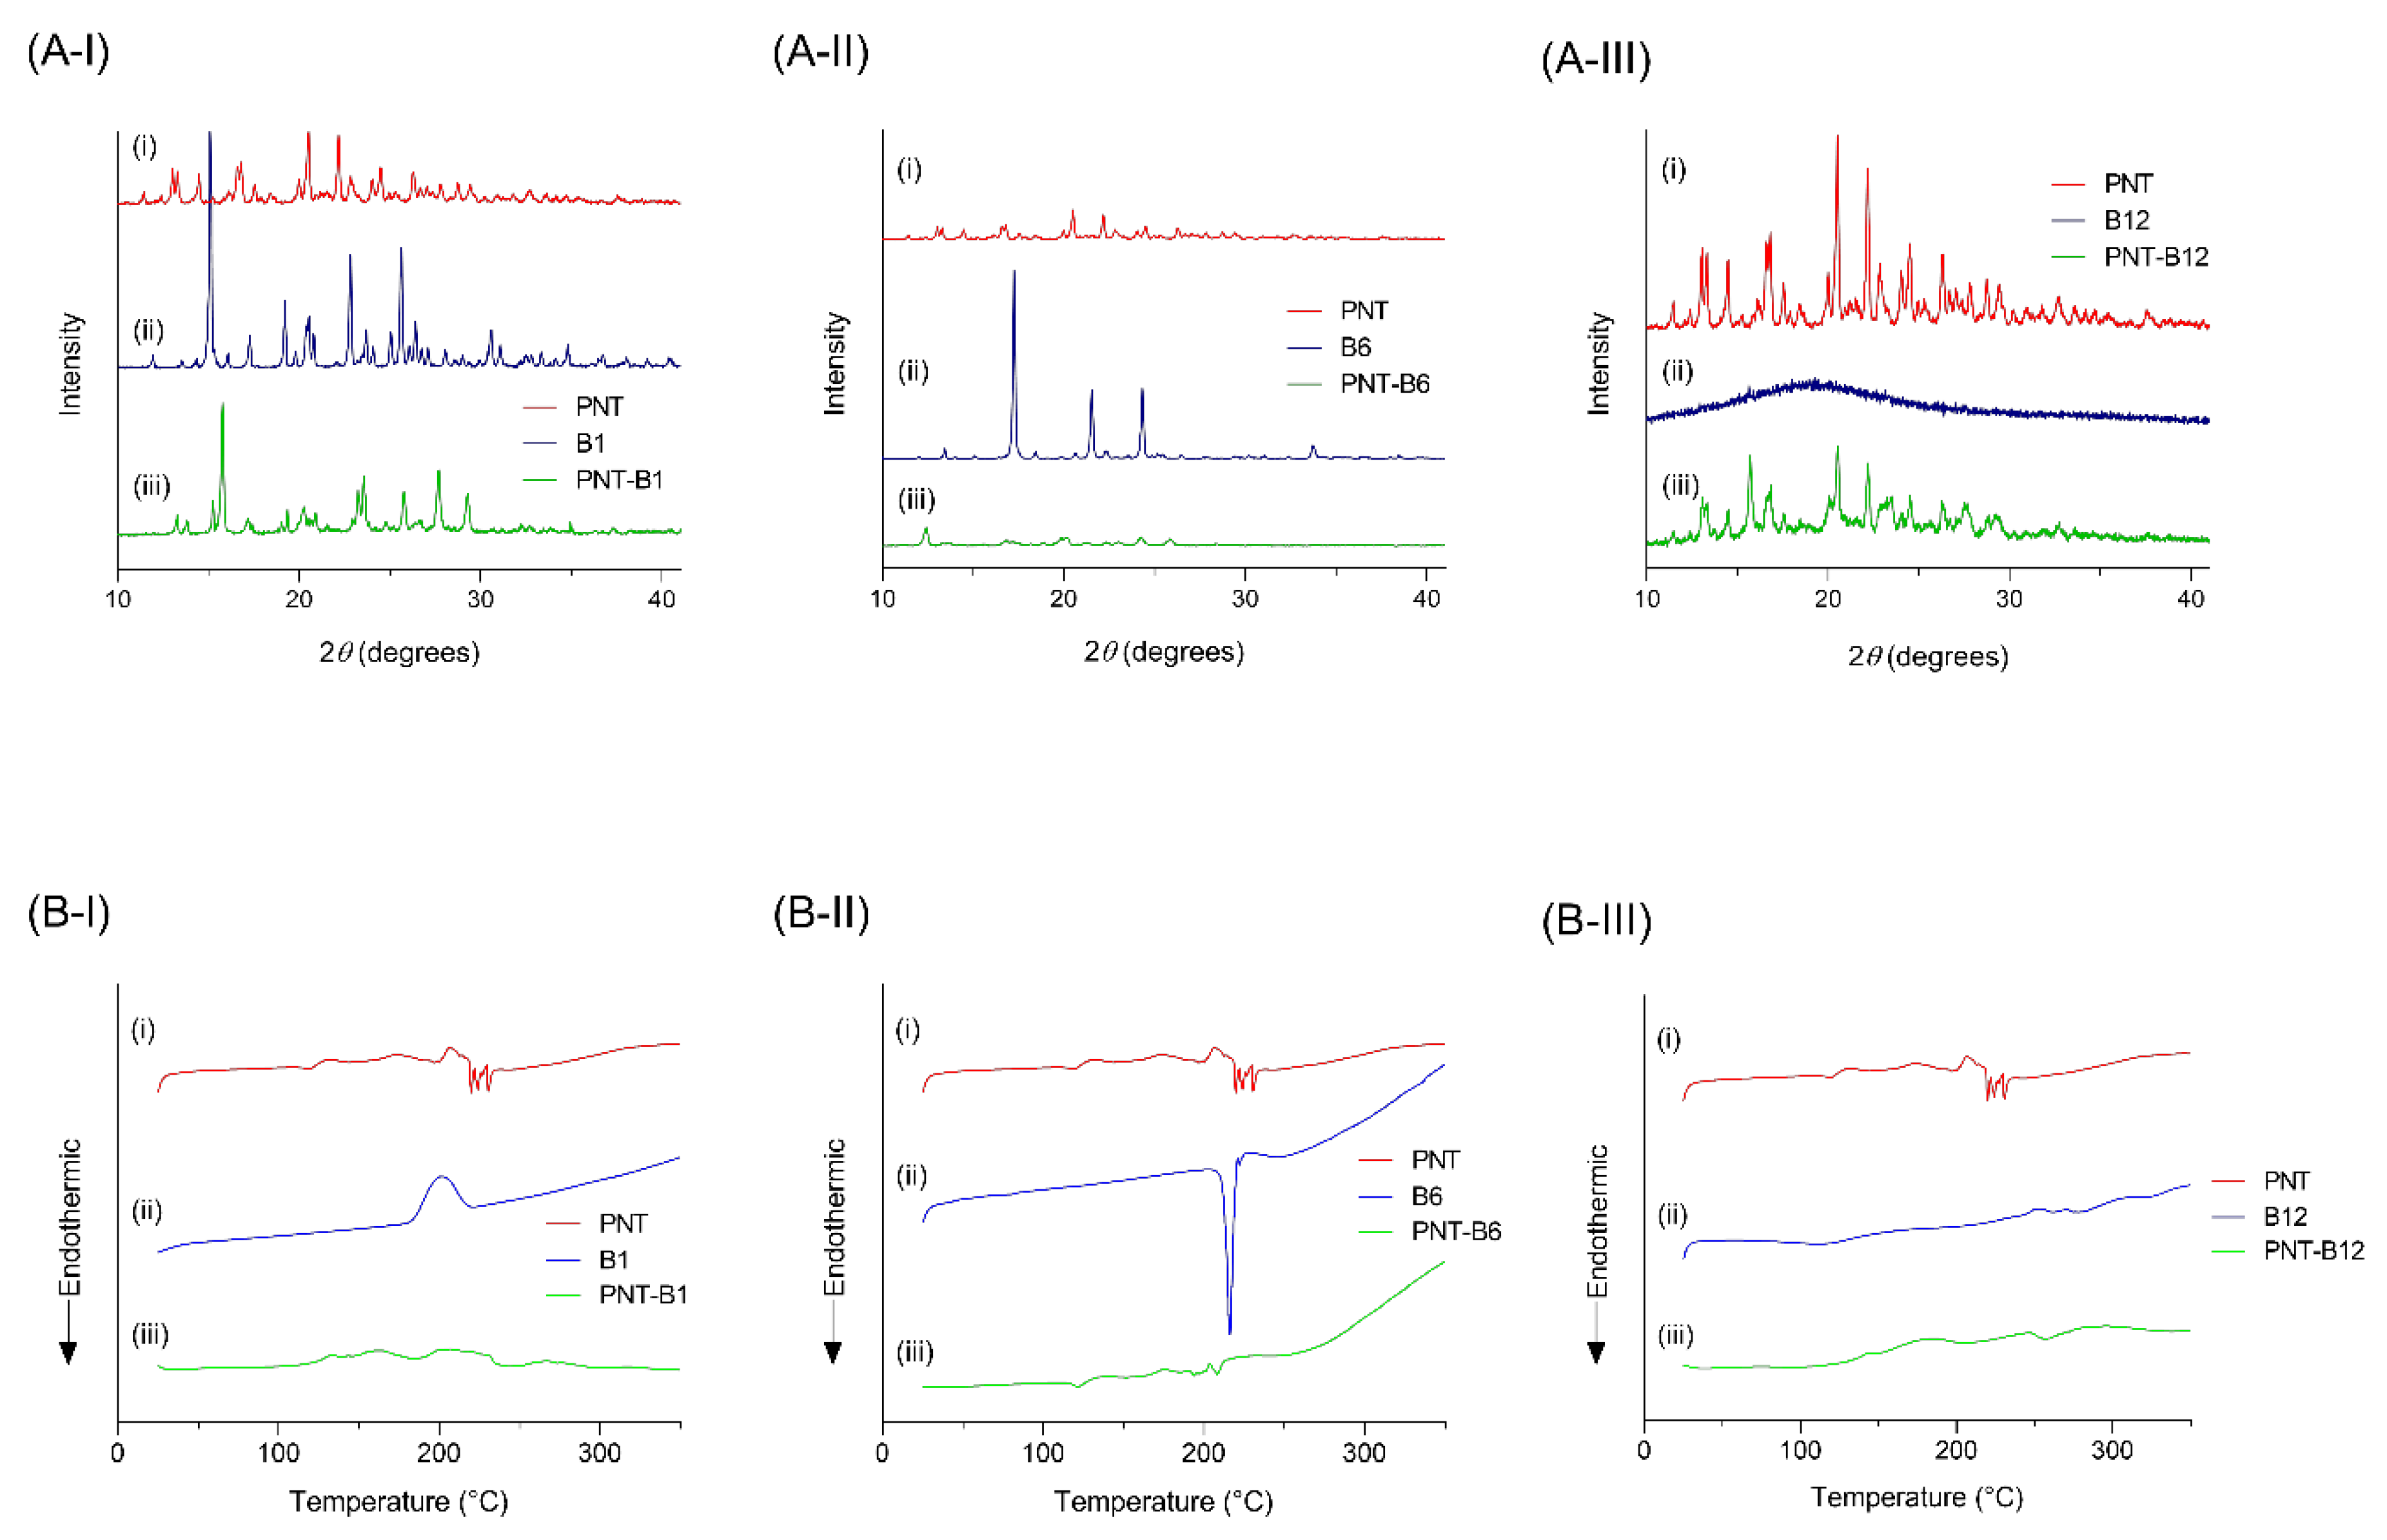
2.2.2. X-ray Powder Diffraction (XRPD)

An X-ray diffractometer from an innovative lab studio (Rigaku, Tokyo, Japan) was used to record the XRPD patterns of PNT, VTB1, VTB6, and VTB12 samples that generate Cu-Kα radiation at 30 mA and 40 kV. All the samples were scanned at 2θ angles of short-range from 5° to 35° that maintained 0.2° step size and scanning speed of 4°/min.

2.2.3. Differential Scanning Calorimetry (DSC)

To determine the thermal behavior of PNT, VTB1, VTB6, and VTB12 samples, 3 mg samples were put in closed aluminum pans and heated at a rate of 5 °C/min using a DSC (Netzsch, Germany) with nitrogen gas (50 mL/min) purged. Indium was used as a reference standard to calibrate the system (99.999 percent pure, 8–10 mg, onset at 156.6 °C).

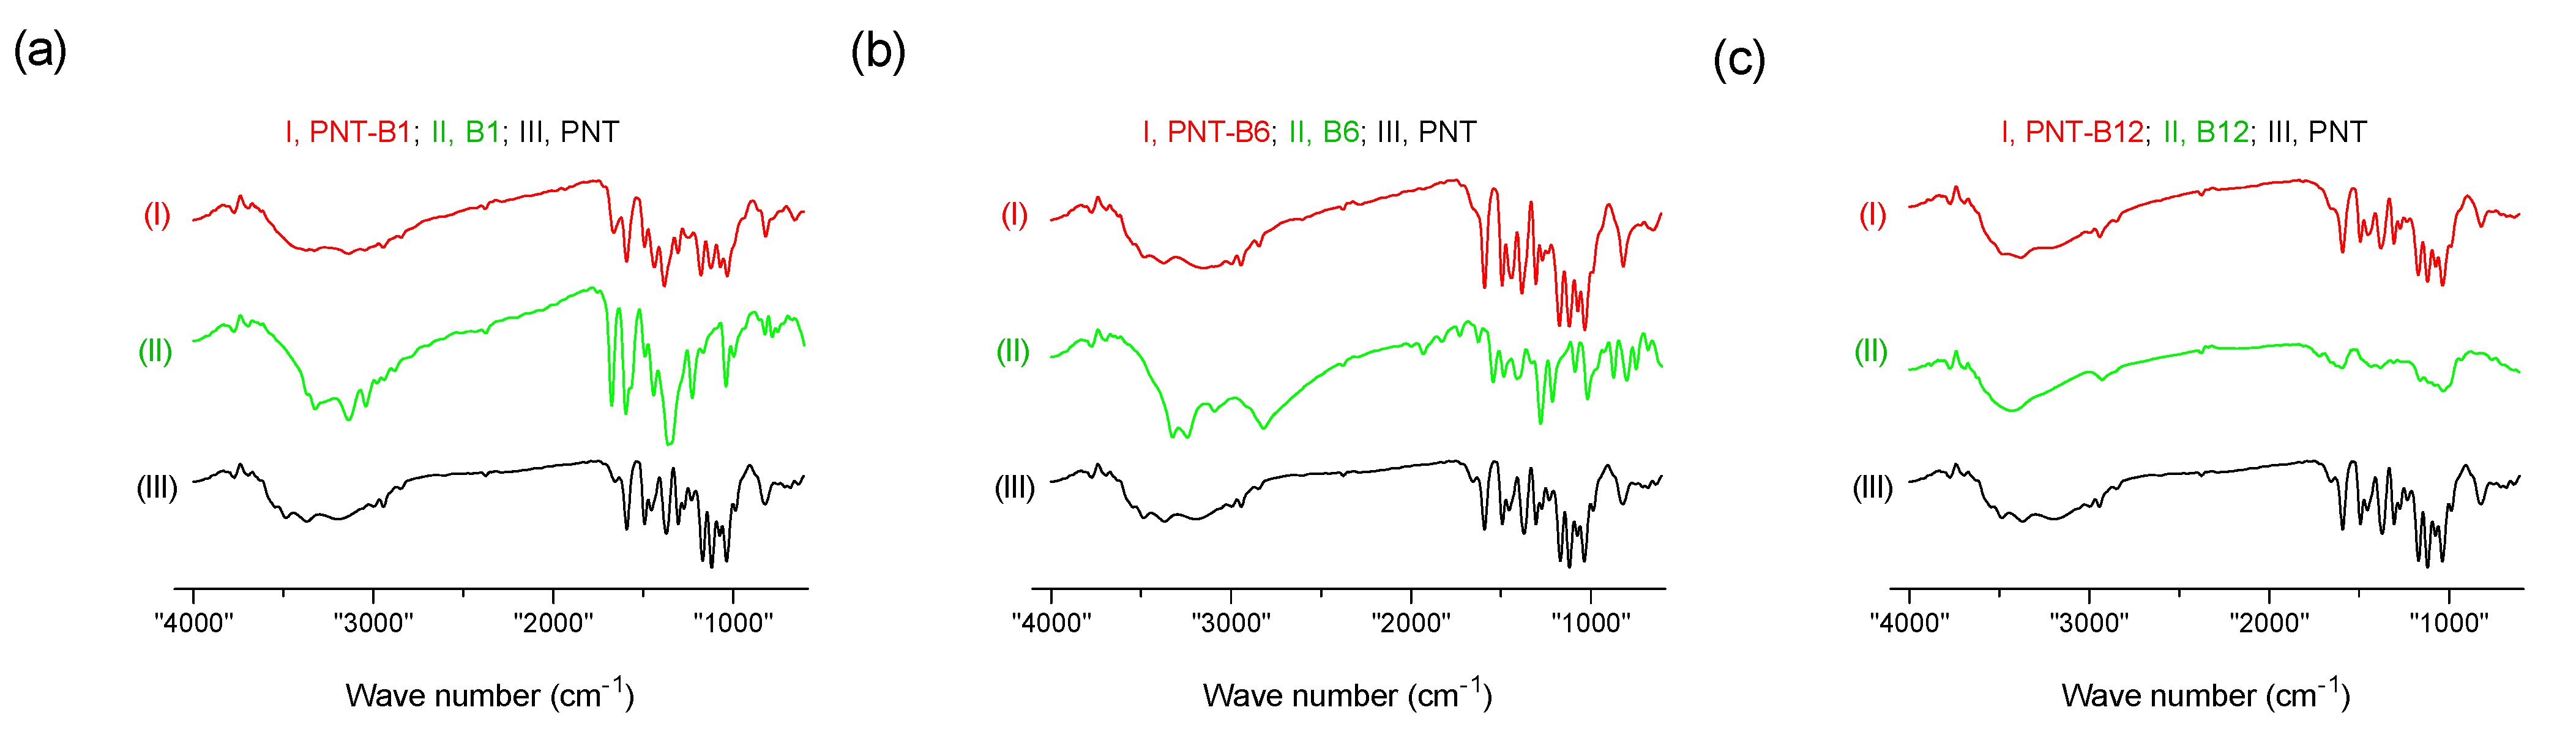
2.2.4. Fourier Transform Infrared Spectroscopy (FT-IR)

FT-IR analysis determined the likelihood of hydrophobic interactions between the polymers and the drug. The samples were placed separately on the sample platform of the instrument (Perkin Elmer, L160000A, Waltham, MA, USA), and IR spectra were collected in the range of 4000–600 cm−1 using Spectrum 10 STD software. During the analysis, the baseline was corrected and normalized for each sample. A smoothing function of 9 points was applied to smooth the obtained spectra.

2.3. Method Development

2.3.1. Instrumentation

The content of PNT, VTB1, VTB6, and VTB12 were determined by using the HPLC system with UV detection, Shimadzu HPLC system (LC-20A VP, Shimadzu, Kyoto, Japan) consisting of an SCL-10Avp system controller, an LC-20ADvp solvent delivery pump, a DGU-14A degasser, a CTO-20Avp column oven, and an SPD-20Avp UV-vis detector. The analysis was performed at 280 nm wavelength with an ODS, reversed-phase C18, 150 mm × 4.6 mm, 5 μm column maintained at 35 °C [23,24].

2.3.2. Preparation of Stock and Working Standard Solutions

Stock solutions of PNT (100 μg/mL), VTB1 (100 μg/mL), VTB6 (100 μg/mL), VTB12 (100 μg/mL), and internal standard (IS) (diclofenac sodium at a fixed concentration of 10 μg/mL) were separately prepared in methanol and stored shaded from light at −20 °C. The working solutions were prepared by serially diluting the stock solutions with methanol.

2.3.3. Chromatographic Separation

The separation of PNT, VTB1, VTB6, and VTB12 was performed on a Phenomenex C18 column (150 × 4.6 mm) with 5 μm particle size (UV detector 20A, Shimadzu, Kyoto, Japan), using HPLC grade water A and acetonitrile as mobile phase B in linear gradient elution mode (A:B). The gradient conditions of the mobile phase were as follows: 0–20 min. The flow rate was set at 0.5 mL/min, and the column temperature was maintained at 35 °C. A Shimadzu HPLC system described in the preceding section was used to analyze the filtrate using an internal standard method. The analysis of the PNT, VTB1, VTB6, and VTB12 samples was determined simultaneously at 280 nm wavelength [23,24].

2.4. Method Validation

The HPLC method was validated by evaluating the following parameters: specificity and selectivity, sensitivity, accuracy, precision, and recovery. Limits of detection (LOD) and Limits of quantitation (LOQ), defined as concentrations having a signal-to-noise ratio of at least 3 and 10, respectively, were used to determine sensitivity. The correlation coefficient (r), representing linearity, was assessed by calculating a least-squares regression line. As previously mentioned, three quality control (QC) samples at low, middle, and high concentrations of 10, 20, and 30 (μg/mL, respectively) were used to evaluate the intra- and inter-day precision and accuracy. Calculating the percent recovery for the QC samples in triplicates was used to calculate the intra-day precision. The analysis of the QC samples on three different days was used to estimate the inter-day accuracy. The closeness between the expected value and the value discovered expresses an analytical method’s accuracy. It is quantified by figuring out the percent recovery of the analyte (%R). In this instance, three subsequent analyses (n = 3) for three distinct concentrations of standard sample solution (10 μg/mL, 20 μg/mL, and 30 μcg/mL) were conducted using the suggested approach to assess the accuracy of the procedure. To evaluate the recovery and validity of the proposed method, the experiment’s results were statistically analyzed using the formula [%Recovery = (Recovered conc./Injected conc.) × 100]. The stability of target analytes in plasma was evaluated for brief periods of up to 24 h at 4 °C and room temperature, for extended periods of up to two weeks at −80 °C, and after three freeze–thaw cycles.

2.5. Pharmacokinetic and Drug–Drug Interaction Studies

2.5.1. Study Design

This was an open-label, 3 × 3 crossover pharmacokinetic study designed to evaluate the potential pharmacokinetic interaction between PNT and VTB. In this crossover study, all subjects received the same number of treatments involving PNT and VTB and were engaged in the same number of periods. Unlike the parallel study, subjects were assigned to study into three groups, group 1 (on the combined dose PNT and VTB) or group 2 (single-dose pharmacokinetics of VTB), or group 3 (single dose PNT). Among these groups, pharmacokinetic sampling was performed following overnight fasting, which continued for 6 h after dosing. Blood samples were taken in each group to analyze samples. After the washing periods of 10 days, the same procedures were repeated for each group with another alternative dose. Subjects remained at the sampling center for the entire duration of the study. The number of subjects was calculated by single-tailed unpaired t-test [25].

2.5.2. Volunteers

Thirty healthy young adults, 18 to 35 years of age (inclusive), with a weighted average of 40–75 kg, were included in the study. Among them, 22 were male, and 8 were female volunteers. Individuals with previous disease histories (diabetes, hypertension, genetic disorder, pregnancy, psychological disorder, etc.) were excluded. The demographic and baseline characteristics of the subjects are presented in Table 1. Before sampling, they were given a balanced diet chart for maintaining proper body function. In group 1, subjects were co-administering a 20 mg dose of PNT and; 100 mg of VTB1, 200 mg of VTB6, and 200 µg of VTB12. In group 2, subjects were given only VTB doses of 100 mg of VTB1, 200 mg of VTB6, and 200 µg of VTB12. In group 3, subjects only received 20 mg of PNT.

2.5.3. Collection of Blood Sample

Volunteers signed a consent form as an undertaken for collecting a blood sample. Blood samples were collected from volunteers as a fasting condition. Samples were collected intravenously with specific time intervals and randomly transferred into an EDTA tube, precipitating blood cells. After that, all collected samples were centrifuged and transferred supernatant with discarding red cells. Finally, new EDTA plasma samples were stored with the label until further investigation started.

2.5.4. Ethical Declaration

The regulations of the US Food and Drug Administration, the Declaration of Helsinki as currently revised, and the International Conference on Harmonization were all followed in this study [26,27]. The Faculty of Biological Science, University of Dhaka’s ethical committee evaluated and approved the study protocol and informed consent form (approved number: 111). Before study participation, all subjects signed a written consent and were allowed to withdraw at any stage.

2.5.5. Safety Parameters

Throughout the trial, the safety and tolerability of PNT and VTB were assessed by looking at adverse events, clinical laboratory results, vital sign assessments, skin evaluations, and concurrent drug use.

2.5.6. Plasma Sample Preparation

A stock solution of PNT, VTB1, VTB6, and VTB12 (100 μg/mL) and diclofenac as an internal standard (10 μg/mL) were prepared in methanol. The stock solutions were diluted with methanol to prepare working solutions before use. Plasma PNT, VTB1, VTB6, and VTB12 standards were prepared by spiking 10 μL of PNT, VTB1, VTB6, and VTB12 and 10 μL of diclofenac stock solution into 180 μL of blank plasma resulting in PNT, VTB1, VTB6, and VTB12 concentrations ranging 1−100 μg/mL, respectively. For the plasma concentration analysis of PNT and VTB from the blood samples, plasma stored at −80 °C was thawed at room temperature and vortexed for 30 s before preparation. A 1.5 mL fresh Eppendorf tube added 100 μL aliquot of plasma, followed by 10 μL of IS. The samples were vortexed for 30 s and deproteinized by adding an excess of acetonitrile. The spiked sample and acetonitrile ratio was 1:4, where acetonitrile was a deproteinizing agent. The samples were centrifuged for 10 min at10,000× g at 4 °C. The supernatant was separated, transferred to a fresh tube, and kept in a refrigerator until analysis.

2.5.7. Determination of Pharmacokinetic Parameters

The pharmacokinetic parameters were calculated employing noncompartmental methods using the PKSolver Version 2 (a freely available menu-driven add-in program for Microsoft Excel) [28].

2.6. Statistical Analysis

All data are represented as mean ± standard deviation (SD). GraphPad, Prism 8.0, was used to create the graphs (GraphPad Software, LaJolla, CA, USA). A one-way analysis of variance with pairwise comparisons using Fisher’s least significant difference approach was used for statistical comparisons. A p-value of less than 0.05 was considered significant in all analyses.

3. Results and Discussion

3.1. Physicochemical Interaction of the Solid Samples

3.1.1. Solid-State Characterization

To clarify any transitions in the chemical structures of PNT and VTB, the samples’ solid-state physicochemical characterization of physical mixture (PM) was characterized using XRPD and DSC studies (Figure 2). The results indicated that PNT exhibited a crystalline state with several intense peaks in XRPD analysis. In contrast, when mixed with VTBs, minor changes were observed in intensities indicating the absence of significant interactions. In DSC analysis, no shift in the endothermic peak of PNT when mixed with VTBs means negligible transitions on the melting endotherm of PNT and VTBs. Based on XRPD and DSC analysis, the recrystallization/phase transformation of PNT and VTB samples was minor and suggested that the particles were still stable.

3.1.2. Drug-Drug Interaction Using FT-IR

FT-IR analysis was also performed to evaluate the molecular status of PNT, VTBs, and PMs. The corresponding FT-IR spectra are presented in Figure 3. FT-IR range of PNT (Figure 3) showed intense, well-defined characteristic infrared absorption bands at 3485.37, 1589.34, 1035.77, 1168.86, and 1035.77 cm−1 due to N-H, C-O, C-F, C=S, and Sp2 C-O aromatic ether stretch. Comparing the FT-IR spectrum of PNT with those of VTBs and physical mixtures in Table 2 indicates that no new chemical bond was constructed between these functional groups. From the results in distinction to FT-IR spectrum analyses, the identical FT-IR spectra curves suggested that adding VTBs might not affect the chemical structure of PNT. The above results indicated negligible in vitro drug–drug interactions could be detected. Theoretically, this situation is advantageous since some drug–drug interactions might even decrease the dissolution rate, and the thermodynamic driving force for dissolution will be higher in the case of very weak or no drug–drug interactions [29,30].

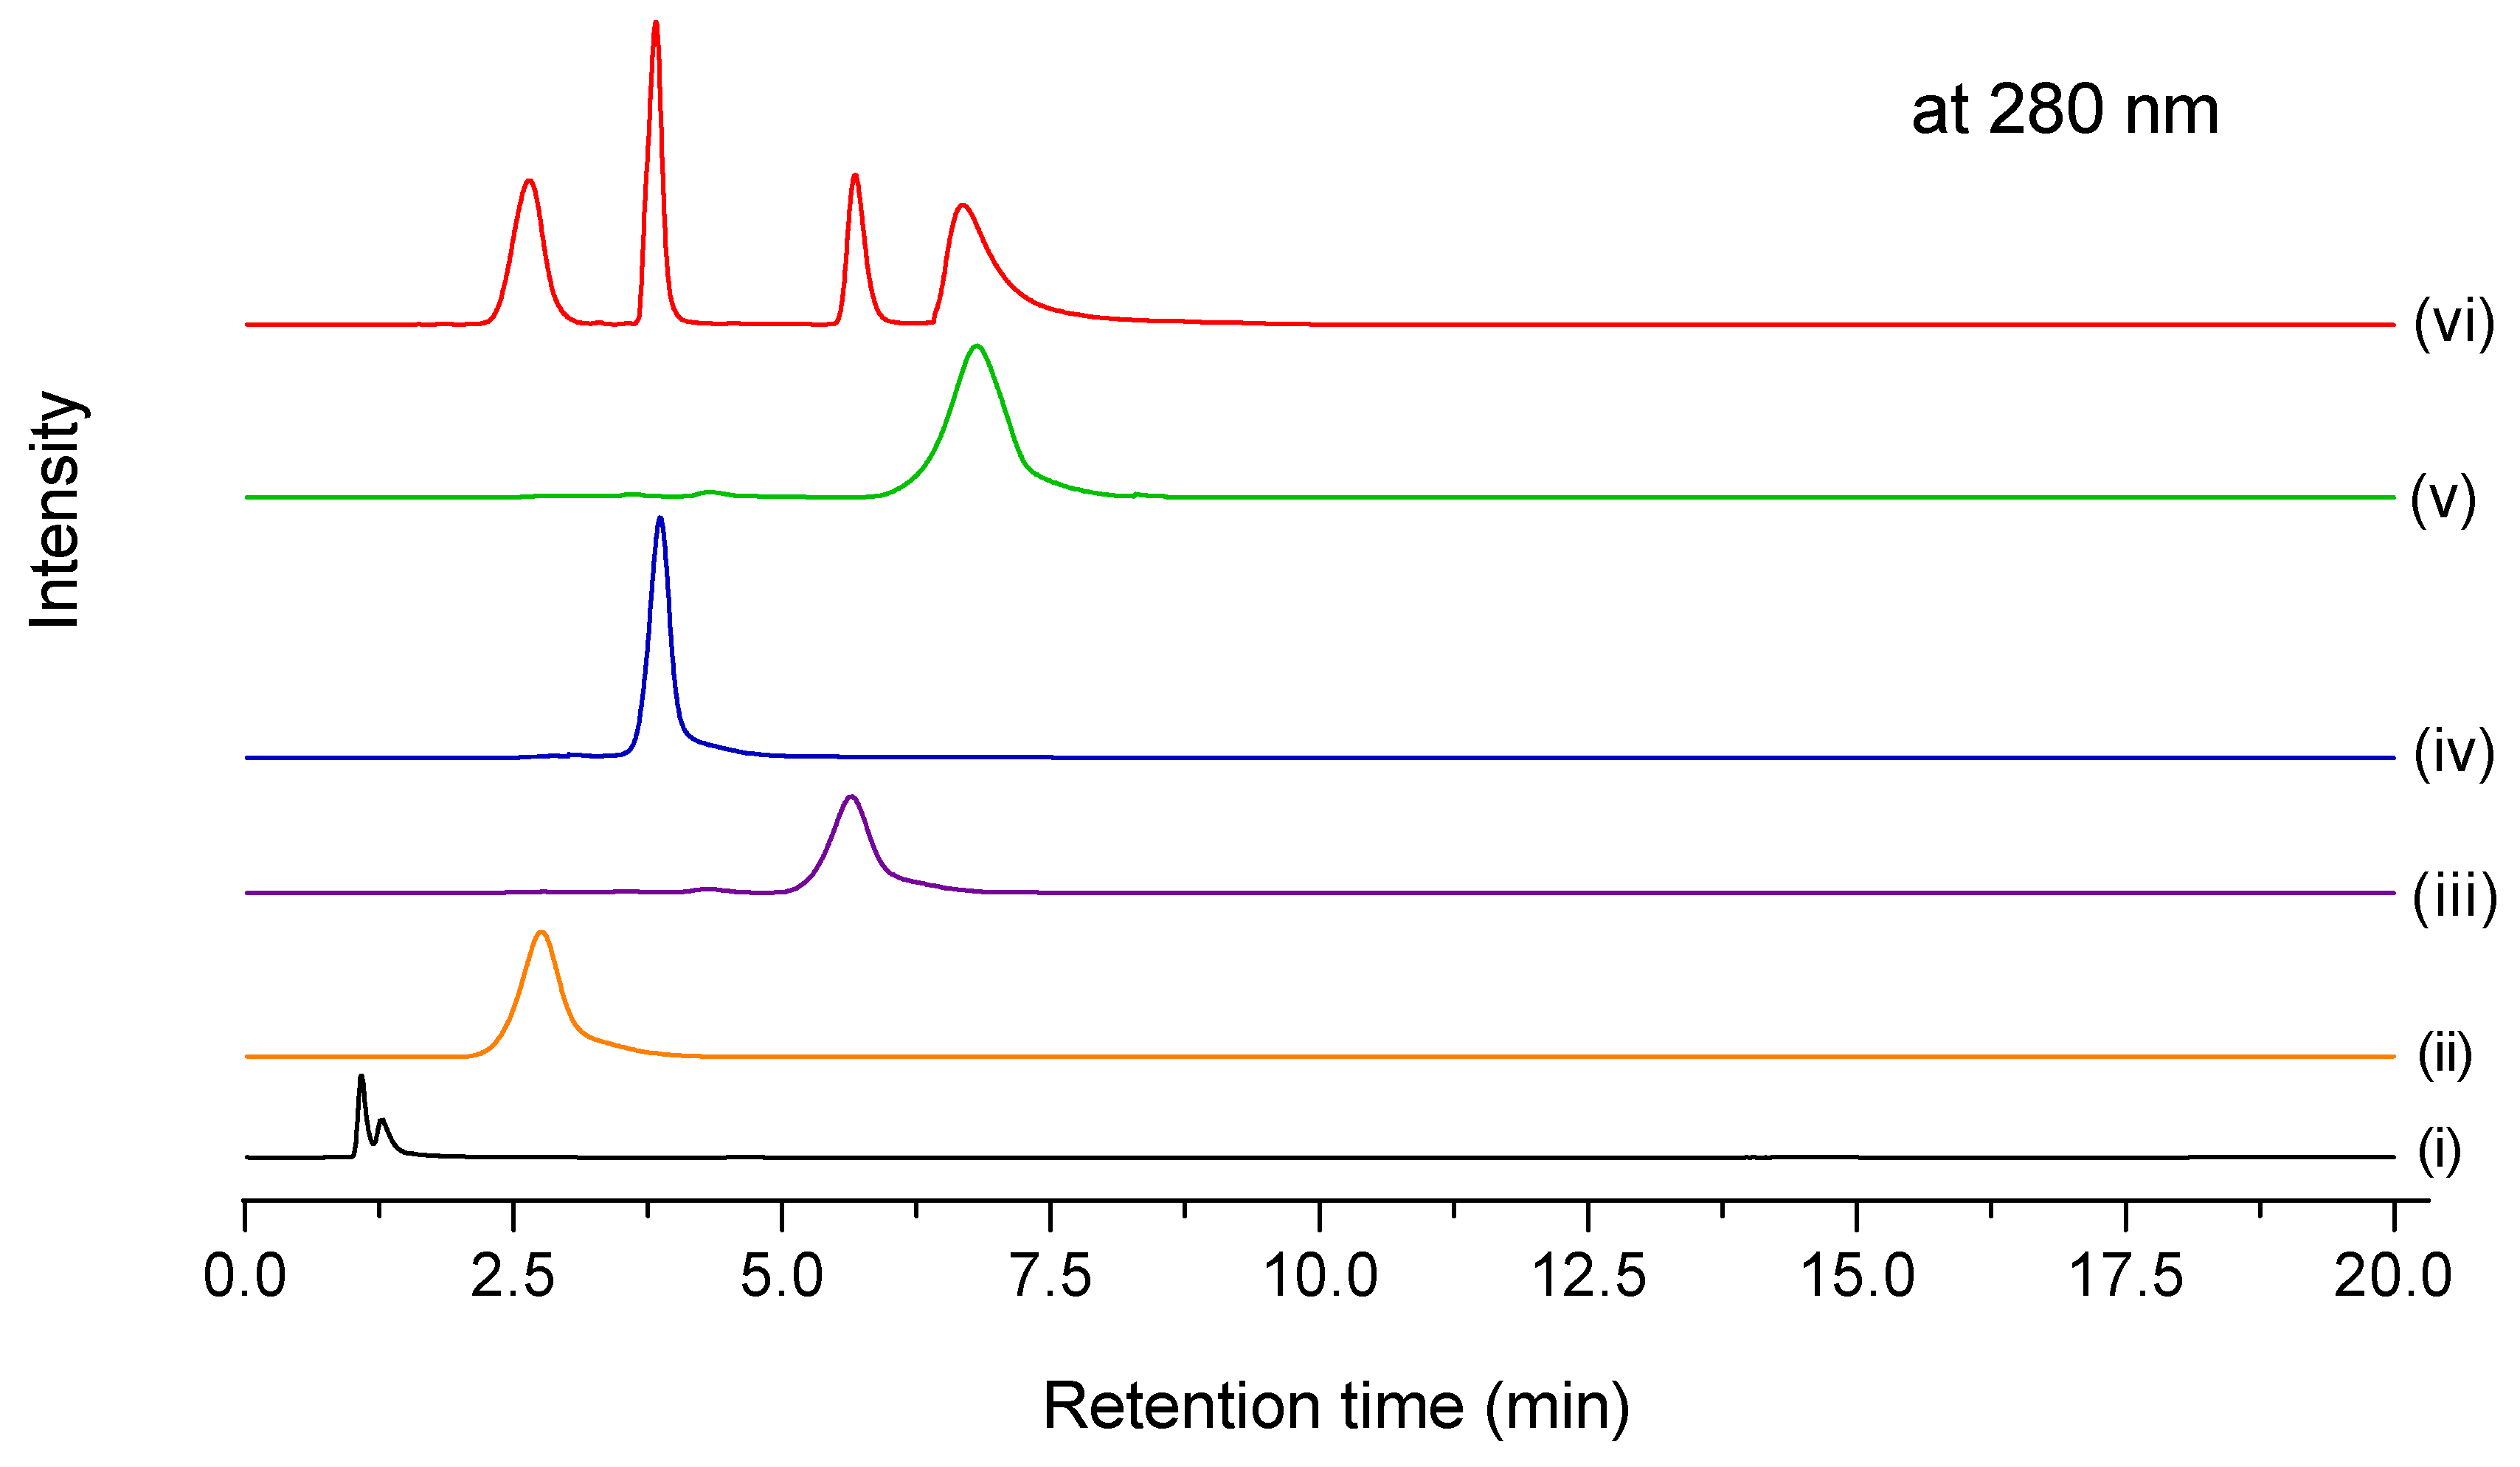
3.2. Method Development

Various chromatographic methods have been developed to measure PNT, VTB1, VTB6, and VTB12 in specific formulations, often in conjunction with other substances [31,32,33,34,35]. Many of these techniques necessitate lengthy analysis timeframes, making them unsuitable for regular analysis. In addition, there is currently no method for simultaneously determining the subject of the study utilizing HPLC detection in biological fluids. Hence, there is a pressing need to develop a more practical method that gives more convenient options with acceptable detection and determination limits. We, therefore, developed and validated an RP-HPLC method for their quantification in plasma. The conditions required to obtain high sensitivity and selectivity were optimized as follows.

Optimization of Separation Conditions

Different reversed-phase columns and gradient mobile phases were investigated to determine the ideal conditions for chromatographic separation of the target analytes from a simultaneous technique. Table 3 shows the analytical parameters for the robustness of the HPLC method in the simultaneous quantification of PNT and VTBs. PNT and VTBs are hydrophilic; thus, the reversed-phase column C18 columns were used for reasonable run time, symmetric peak shape, and good resolution. The excellent resolution of these drugs was achieved on the Phenomenex C18 (4.6 × 150 mm, 5 µm) column, which was widely used to separate PNT and VTB. At first, isocratic elution was applied for the separation of the analytes. However, it could not separate the target analytes simultaneously; the gradient elution was then selected for optimum separation and reasonable resolution. The separation of PNT, VTB1, VTB6, and VTB12 was performed on a Phenomenex C18 column (150 × 4.6 mm) with 5 μm particle size (Shimadzu, UV detector 20A, Kyoto, Japan), using HPLC grade water A and acetonitrile as mobile phase B in linear gradient elution mode (A:B). The flow rate was set at 0.5 mL/min, and the column temperature was maintained at 35 °C. The analysis of the PNT, VTB1, VTB6, and VTB12 samples was determined simultaneously by the internal standard method at a 280 nm wavelength. The internal standard was studied at a 280 nm wavelength under the same conditions.

3.3. Method Validation

The current method was validated based on the U.S. Guidance of Industry on Bioanalytical Method Validation and the criteria outlined in the Experimental Procedures section. A straightforward straight-line equation produced a linear relationship under ideal experimental circumstances. The calibration curve was established using peak area versus concentration. The analysis of blank plasma evaluated this method; blank plasma spiked with the analytes, and plasma was collected at 0.5.1, 2, 3, 5, and 6 h after administering the combination. Typical chromatograms of these samples are shown in Figure 4. The detection of PNT, VTB1, VTB6, VTB12, and IS by an HPLC with a UV detector was highly selective, with no interference from each other and the endogenous substances. The retention time for PNT, VTB1, VTB6, and VTB12 were 6.8 ± 0.2, 2.7 ± 0.1, 5.5 ± 0.2, and 3.8 ± 0.1 min, respectively, in a runtime of 20.00 min. All the calibration curves showed good linearity within the designed ranges, with correlation coefficient (r) values greater than 0.96. LOD and LOQ were determined by injecting lower concentrations of the standard solutions into the HPLC column using the optimized chromatographic conditions (Table 4). The LOD values were 0.5 ng/mL for PNT, 0.59 ng/mL for VTB1, 15.34 ng/mL for VTB6, and 0.04 ng/mL for VTB12, respectively. The LOQs values were 1.50, 1.78, 69.34, and 0.10 ng/mL for PNT, VTB1, VTB6, and VTB12, respectively. All the analytes tested with an assay, peak eight, theoretical plates, tailing factor, and capacity factors were within the range. The assay value was found within the 90–115% range, which was satisfactory according to the FDA Guidance for Industry Bioanalytical Method Validation [36]. The tailing factor and a capacity factor of PNT, VTB1, VTB6 and VTB12 was 0.79, 1.47, 0.81, and 1.81 and 2.5, 0.71, 1.48 and 0.79, respectively. The obtained results further demonstrated the absence of any interferences in the samples and the absence of any peaks in the blank plasma associated with any of the investigated analytes.

Precision, Accuracy, Recovery and Robustness

This method’s precision, accuracy, recovery and absolute matrix effect were evaluated (Table 5). The intra and inter-assay bias precision and accuracy were expressed as standard deviation (SD) and relative error (RE), respectively, which did not exceed ±15%. The calculated recoveries and absolute matrix effect values were in the ranges of 85.0–115%. All the results indicated that the assay was reproducible and accurate for determining PNT, VTB1, VTB6, and VTB12 in human plasma. In Table 3, 0.3 mL/min and 0.5 mL/min flow rates were applied, where chromatographic conditions were the same with a wavelength of 280 nm, column size 150 × 4.6 mm, and column temperature 35 °C. Acetonitrile and methanol were individually used in gradient elution, but the most suitable sample separation was observed with acetonitrile. Using methanol, sample separation was not achieved due to the polar nature of methanol. Moreover, acetonitrile has a lower UV cut-off than methanol, making it more suitable for applications requiring low UV detection wavelengths. In addition, acetonitrile/water mixers have lower viscosity than methanol/water mixes, generating substantially lower back pressures across the column. This lower back pressure is often seen as advantageous as it puts less strain on the system components and column and provides scope to increase the flow rate and reduce run times. It can be seen that when acetonitrile and methanol are mixed with water in the same ratio, an acetonitrile mobile phase displays greater elution strength. In chromatographic conditions, the oven temperature was monitored in between 30–35 °C indicating no effective change in temperature.

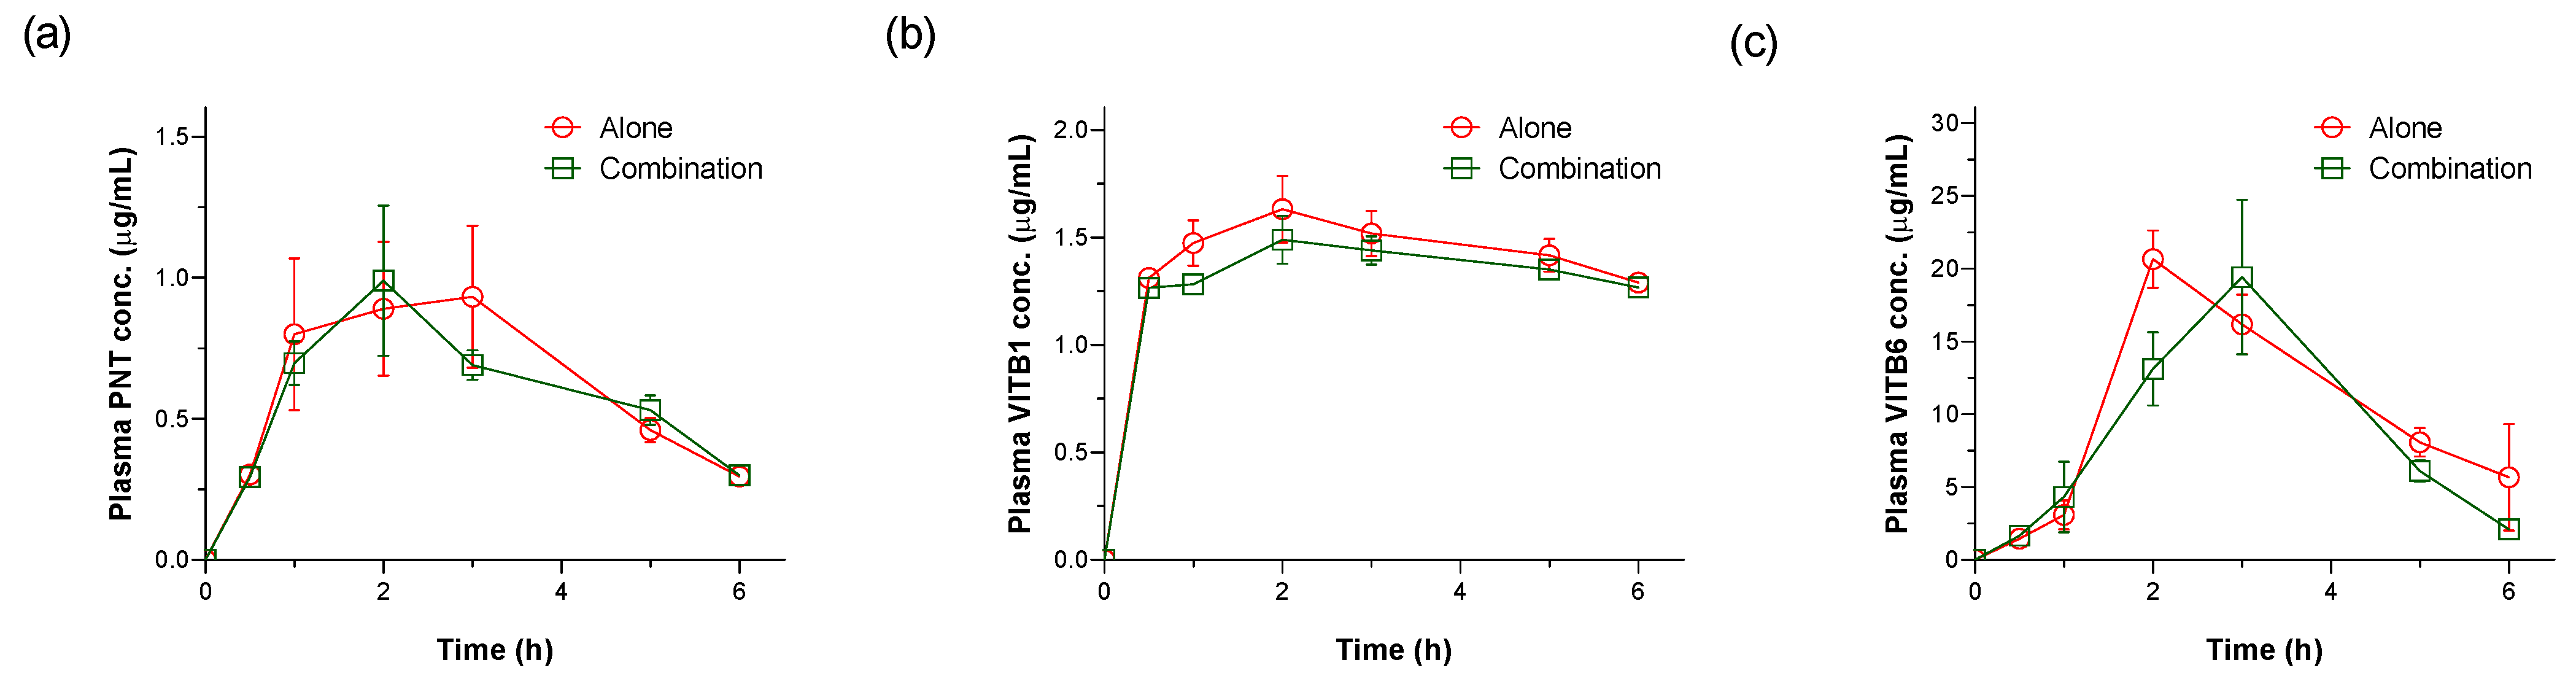
3.4. Pharmacokinetic and DDI Studies in Healthy Adults

DDIs are a crucial factor when evaluating drug combinations’ safety and efficacy. The effect can often explain the Pharmacokinetic (PK) interactions that each drug has on a particular enzyme, membrane drug transporter, and plasma transport protein. Many such DDIs arise during metabolism, for which the cytochrome P450 (CYP450) enzyme superfamily is primarily responsible [37]. Depending on the drug combination, drugs that do not have CYP metabolic enzymes and drug transporters can also contribute to DDIs [38]. Depending on the medicine and the animal model, a wide range of additive, synergistic, and antagonistic pharmacological effects occasionally switched between in vitro and in vivo models.
The current HPLC method was successfully applied to determine the pharmacokinetic parameters of PNT and VTBs in human plasma after single oral administration, alone or combined. The mean plasma concentration-time curves are shown in Figure 5, and the main pharmacokinetic parameters, calculated by PKSolver, are summarized in Table 6. PNT absorbed quickly (Tmax, 2.67 ± 0.33 h), resulting in a peak plasma concentration (Cmax) of 0.95 ± 0.347 g/mL−1 and a large area under the curve (AUC0–6) of 3.88 ± 1.239 µg * mL−1h−1. PNT exhibited a long terminal half-life (t1/2) of 2.74 ± 0.827 h and mean residence time of 4.95 ± 0.993 h that results from a large volume of distribution of 17.94 ± 6.516 L and low plasma clearance of 4.33 ± 0.731 Lh−1. On the other hand, VTB1 and VTB6 showed excellent pharmacokinetic profiles, which are unique among VTBs. VTB1 is well absorbed with AUC0–6 of VTB1 was 8.44 ± 0.514 µg * mL−1h−1, and Cmax was 1.63 ± 0.154 µg * mL−1, which was attained in a brief time (Tmax, 1.67 ± 0.333 h). VTB1 has a prolonged half-life (17.01 ± 6.17 h) with a moderate volume of distribution (59.06 ± 6.071 L) and plasma clearance 2.78 ± 0.601 Lh−1. In addition, VTB6 is also well absorbed with AUC0–6 of 62.91 ± 3.046 µg * mL−1h−1, and Cmax was 20.66 ± 1.969 µg * mL−1, which was attained in a brief time (Tmax, 2.0 ± 1.20 h). VTB6 has a prolonged t1/2 (2.38 ± 1.20 h) with a moderate volume of distribution (7.58 ± 3.021 L) and plasma clearance 2.18 ± 0.914 Lh−1. In addition, due to the administration of shallow doses, VTB12 could not be detected in human plasma. Due to very low concentration of VTB12 in plasma after oral administration, the RP-HPLC method might not be suitable for detecting VTB12. However, other more sensitive methods such as LC-MS or the Chemiluminescence ImmunoAssay (CLIA) Test, might be ideal for quantifying VTB12 in human plasma [39,40]. It can also be assumed that PNT may also interfere with the absorption of VTB12 via suppressing gastric acid secretion.
Recent studies showed that excessive use of acid-inhibiting medications, mainly PPIs, was associated with a subsequent diagnosis of VTB deficiency [41]. The magnitude of the association was more substantial in women and younger age groups with more potent acid suppression and decreased after discontinuation of use. There was no significant trend with increasing duration of use and no strong evidence for confounding by utilization of medical care [42]. Consistent with the pharmacokinetics after combination with PNT observed in previous studies in healthy subjects, PNT has little influence on drug absorption, which was negligible [43]. Moreover, People with achlorhydria (lack of stomach acid) or hypochlorhydria may not adequately metabolize B vitamins, placing them at risk for numerous nutritional deficiencies, which may lead to the development of a wide variety of health issues. Therefore, those who need both PPI and vitamin B complex therapy should consider it effectively by monitoring each drug’s effectiveness. PNT is metabolized by the cytochrome P450 (CYP) system and can alter the metabolism of other drugs metabolized by CYP enzymes. Thus, it can delay the elimination of vitamins, especially water-soluble vitamins [44]. However, the pharmacokinetic interaction between the two drugs is not well understood. The current HPLC method showed that the co-administration of PNT and VTB could negligibly influence the pharmacokinetic profiles of each drug. Additionally, the absorption of each drug was not affected by the presence of another drug, which is evident from the steadiness of Tmax and AUC. AUC0–6 of PNT decreases slightly when administered with VTB; this means that the exposed amount of PNT was reduced, and the influx amount to the liver, where it exerts its pharmacological activity, was increased.
All the calculated p values were higher than 0.05 (Table 6), indicating no significant differences between combination and single administration groups of PNT, VTB1, VTB6, and VTB12 contents. In summary, no significant drug–drug interaction was found between PNT and VTB. Therefore, the co-prescription of PNT and VTB is feasible and would benefit clinical applications and improve patients’ compliance.

3.5. Safety Parameters

Throughout the trial, adverse events were evaluated to determine the safety and tolerability of PNT and VTB when administered alone or in combination. For instance, there was no convincing evidence of adverse events after administering a single PNT or VTB under steady-state conditions with other medications. Volunteers did not report any adverse events during the study period. During the study, there were no clinically significant changes in laboratory testing, vital signs, physical examination, or suicidality assessment results.

4. Conclusions

For the first time, the simultaneous determination of PNT, VTB1, VTB6, and VTB12 in human plasma was facilitated primarily by developing a fully validated HPLC method. The suggested approach offers valuable resources for evaluating the pharmacokinetic profiles of the target medications. The current process, the first type, validates DDI between PNT and VTBs when co-administering concurrently. Additionally, this study might offer a standard for dosage monitoring and bioequivalence in healthy adults. Even though the results of this study may be beneficial for therapeutic drug monitoring and DDI, more thorough investigations of the pharmacokinetics parameters of PNT and VTBs are still required to fully comprehend the risks and benefits, if any, of their concomitant administration.

Author Contributions

Conceptualization, S.S., S.H. and S.M.A.R.; Methodology, S.S. and S.H.; Validation, S.S. and S.H.; Formal analysis S.S. and S.H.; Investigation, S.S.; Resources, S.H. and S.M.A.R.; Data curation, S.H. and S.M.A.R.; Writing-original draft, S.S.; Writing-review & editing, S.H. and S.M.A.R.; Visualization, S.H.; Supervision, S.H. and S.M.A.R.; Project Administration, S.H., and S.M.A.R. All authors have read and agreed to the published version of the manuscript.

Funding

This research received no external funding.

Institutional Review Board Statement

All procedures used in the present study were approved by the Institutional Animal Care and Ethical Committee of the Faculty of Biological Sciences at the University of Dhaka (approved number: 111). All animal experiments followed the international guidelines.

Informed Consent Statement

Not applicable.

Data Availability Statement

The data presented in this study are contained within this article.

Acknowledgments

The authors would like to thank the Bangladesh Council of Scientific and Industrial Research (BCSIR) for their gracious support with the solid-state physicochemical characterization of the samples. The authors also thank the University of Dhaka for supporting the Open Access Publication charges.

Conflicts of Interest

The authors confirm that they have no known financial or interpersonal conflicts that would have appeared to have impacted the study findings of this re-search.

Abbreviations

AUC, area under the concentration curve; Cmax, maximum plasma concentration; DDI; drug–drug interaction; DSC, differential scanning calorimetry; FT-IR, fourier transform infrared spectroscopy; HPLC, high performance liquid chromatography; LOD, limit of detection; LOQ, limit of quantification; PK, pharmacokinetics; PM, physical mixture; PNT, pantoprazole; PPI, proton pump inhibitor; QC, quality control; SD, standard deviation; RT, room temperature; Tmax, time to reach maximum plasma concentration; UV, ultraviolet; VTB, vitamin B; VTB1, vitamin B1; VTB12, vitamin B12; VTB6, vitamin B6; XRPD, X-ray powder diffraction.

References

  1. Masnoon, N.; Shakib, S.; Kalisch-Ellett, L.; Caughey, G.E. What is polypharmacy? A systematic review of definitions. BMC Geriatr. 2017, 17, 230. [Google Scholar] [CrossRef] [PubMed] [Green Version]
  2. Esumi, S.; Ushio, S.; Zamami, Y. Polypharmacy in Older Adults with Alzheimer’s Disease. Medicina 2022, 58, 1445. [Google Scholar] [CrossRef] [PubMed]
  3. Villén, N.; Roso-Llorach, A.; Gallego-Moll, C.; Danes-Castells, M.; Fernández-Bertolin, S.; Troncoso-Mariño, A.; Monteagudo, M.; Amado, E.; Violán, C. Polypharmacy Patterns in Multimorbid Older People with Cardiovascular Disease: Longitudinal Study. Geriatrics 2022, 7, 141. [Google Scholar] [CrossRef] [PubMed]
  4. Lleal, M.; Baré, M.; Ortonobes, S.; Sevilla-Sánchez, D.; Jordana, R.; Herranz, S.; Gorgas, M.Q.; Espaulella-Ferrer, M.; Arellano, M.; de Antonio, M.; et al. Comprehensive Multimorbidity Patterns in Older Patients Are Associated with Quality Indicators of Medication—MoPIM Cohort Study. Int. J. Environ. Res. Public Health 2022, 19, 15902. [Google Scholar] [CrossRef]
  5. Benny Gerard, N.; Mathers, A.; Laeer, C.; Lui, E.; Kontio, T.; Patel, P.; Dolovich, L. A Descriptive Quantitative Analysis on the Extent of Polypharmacy in Recipients of Ontario Primary Care Team Pharmacist-Led Medication Reviews. Pharmacy 2020, 8, 110. [Google Scholar] [CrossRef]
  6. Khandeparkar, A.; Rataboli, P. V A study of harmful drug-drug interactions due to polypharmacy in hospitalized patients in Goa Medical College. Perspect. Clin. Res. 2017, 8, 180–186. [Google Scholar] [CrossRef]
  7. Georgiev, K.D.; Hvarchanova, N.; Stoychev, E.; Kanazirev, B. Prevalence of polypharmacy and risk of potential drug-drug interactions among hospitalized patients with emphasis on the pharmacokinetics. Sci. Prog. 2022, 105, 00368504211070183. [Google Scholar] [CrossRef]
  8. Palleria, C.; Di Paolo, A.; Giofrè, C.; Caglioti, C.; Leuzzi, G.; Siniscalchi, A.; De Sarro, G.; Gallelli, L. Pharmacokinetic drug-drug interaction and their implication in clinical management. J. Res. Med. Sci. 2013, 18, 600–609. [Google Scholar]
  9. Hermann, M.; Carstens, N.; Kvinge, L.; Fjell, A.; Wennersberg, M.; Folleso, K.; Cronfalk, B.S. Polypharmacy and Potential Drug—Drug Interactions in Home-Dwelling Older People—A Cross-Sectional Study. J. Multidiscip. Healthc. 2021, 14, 589–597. [Google Scholar] [CrossRef]
  10. Wolff, J.; Hefner, G.; Normann, C.; Kaier, K.; Binder, H.; Hiemke, C.; Toto, S.; Domschke, K.; Marschollek, M.; Klimke, A. Polypharmacy and the risk of drug-drug interactions and potentially inappropriate medications in hospital psychiatry. Pharmacoepidemiol. Drug Saf. 2021, 30, 1258–1268. [Google Scholar] [CrossRef]
  11. Peng, Y.; Cheng, Z.; Xie, F. Evaluation of Pharmacokinetic Drug-Drug Interactions: A Review of the Mechanisms, In Vitro and In Silico Approaches. Metabolites 2021, 11, 75. [Google Scholar] [CrossRef] [PubMed]
  12. Yu, J.; Wang, Y.; Ragueneau-Majlessi, I. Strong Pharmacokinetic Drug-Drug Interactions With Drugs Approved by the US Food and Drug Administration in 2021: Mechanisms and Clinical Implications. Clin. Ther. 2022, 44, 1536–1544. [Google Scholar] [CrossRef]
  13. Kristensen, M.B. Drug interactions and clinical pharmacokinetics. Clin. Pharmacokinet. 1976, 1, 351–372. [Google Scholar] [CrossRef] [PubMed]
  14. Strand, D.S.; Kim, D.; Peura, D.A. 25 Years of Proton Pump Inhibitors: A Comprehensive Review. Gut Liver 2017, 11, 27–37. [Google Scholar] [CrossRef] [PubMed]
  15. Malfertheiner, P.; Kandulski, A.; Venerito, M. Proton-pump inhibitors: Understanding the complications and risks. Nat. Rev. Gastroenterol. Hepatol. 2017, 14, 697–710. [Google Scholar] [CrossRef]
  16. Cheer, S.M.; Prakash, A.; Faulds, D.; Lamb, H.M. Pantoprazole. Drugs 2003, 63, 101–132. [Google Scholar] [CrossRef] [PubMed]
  17. Jungnickel, P.W. Pantoprazole: A new proton pump inhibitor. Clin. Ther. 2000, 22, 1268–1293. [Google Scholar] [CrossRef]
  18. Cheer, S.M.; Prakash, A.; Faulds, D.; Lamb, H.M.; Adamek, R.J. Pantoprazole An Update of its Pharmacological Properties and Therapeutic Use in the Management of Acid-Related Disorders. Drugs 2003, 63, 101–133. [Google Scholar] [CrossRef]
  19. Kennedy, D.O. B Vitamins and the Brain: Mechanisms, Dose and Efficacy--A Review. Nutrients 2016, 8, 68. [Google Scholar] [CrossRef] [Green Version]
  20. Sarwar, M.F.; Sarwar, M.H.; Sarwar, M. Deficiency of Vitamin B-Complex and Its Relation with Body Disorders. In B-Complex Vitamins; LeBlanc, J.G., Ed.; IntechOpen: Rijeka, Croatia, 2021. [Google Scholar]
  21. Hrubša, M.; Siatka, T.; Nejmanová, I.; Vopršalová, M.; Kujovská Krčmová, L.; Matoušová, K.; Javorská, L.; Macáková, K.; Mercolini, L.; Remião, F.; et al. Part 1: Vitamins B1, B2, B3, and B5. Nutrients 2022, 14, 484. [Google Scholar] [CrossRef]
  22. Pelluri, R.; Shafiya Begum, S.; Sowmya, N.; Jyothsna, M.; Prathyusha, S.; Divya, Y.; Poornachand, T.; Vivek Reddy, T.; Jhansirani, K.; Umamounika, B.; et al. A Case Report on Pantoprazole Induced VIT.B12 Deficiency. Indian J. Pharm. Pract. 2016, 9, 63–64. [Google Scholar] [CrossRef]
  23. Ashour, S.; Omar, S. A modified high-performance liquid chromatographic method for the analysis of pantoprazole sodium in pharmaceutical dosage forms using lansoprazole as internal standard. Arab. J. Chem. 2016, 9, S114–S119. [Google Scholar] [CrossRef] [Green Version]
  24. Chatzimichalakis, P.F.; Samanidou, V.F.; Verpoorte, R.; Papadoyannis, I.N. Development of a validated HPLC method for the determination of B-complex vitamins in pharmaceuticals and biological fluids after solid phase extraction. J. Sep. Sci. 2004, 27, 1181–1188. [Google Scholar] [CrossRef] [PubMed]
  25. Röhrig, B.; Du Prel, J.B.; Wachtlin, D.; Kwiecien, R.; Blettner, M. Fallzahlplanung in klinischen studien: Teil 13 der serie zur bewertung wissenschaftlicher publikationen. Dtsch. Arztebl. 2010, 107, 552–556. [Google Scholar] [CrossRef]
  26. Association, W.M. Declaration of Helsinki. Ethical Principles for Medical Research Involving Human Subjects. Jahrb. für Wiss. Und Ethik 2009, 14, 233–238. [Google Scholar] [CrossRef]
  27. Krleza-Jerić, K.; Lemmens, T. 7th revision of the Declaration of Helsinki: Good news for the transparency of clinical trials. Croat. Med. J. 2009, 50, 105–110. [Google Scholar] [CrossRef]
  28. Zhang, Y.; Huo, M.; Zhou, J.; Xie, S. PKSolver: An add-in program for pharmacokinetic and pharmacodynamic data analysis in Microsoft Excel. Comput. Methods Programs Biomed. 2010, 99, 306–314. [Google Scholar] [CrossRef]
  29. Boonsongrit, Y.; Mueller, B.W.; Mitrevej, A. Characterization of drug-chitosan interaction by 1H NMR, FTIR and isothermal titration calorimetry. Eur. J. Pharm. Biopharm. 2008, 69, 388–395. [Google Scholar] [CrossRef]
  30. Pandey, M.M.; Jaipal, A.; Charde, S.Y.; Goel, P.; Kumar, L. Dissolution enhancement of felodipine by amorphous nanodispersions using an amphiphilic polymer: Insight into the role of drug–polymer interactions on drug dissolution. Pharm. Dev. Technol. 2015, 21, 463–474. [Google Scholar] [CrossRef]
  31. Emami, J.; Rezazadeh, M.; Kalani, M. Quantification of pantoprazole by high performance liquid chromatography (HPLC) method: In vitro and in vivo applications. J. Liq. Chromatogr. Relat. Technol. 2014, 37, 681–695. [Google Scholar] [CrossRef]
  32. El Zaher, A.A.; El Kady, E.F.; EL Messiry, H.M.; El Ghwas, H.E.; El Houssini, O.M. Synchronous LC-MS/MS determination of pantoprazole and amitriptyline in rabbit plasma: Application to comparative in vivo pharmacokinetic study of novel formulated effervescent granules with its marketed tablet dosage form. Heliyon 2021, 7, e07752. [Google Scholar] [CrossRef] [PubMed]
  33. Zhang, Y.; Zhou, W.E.; Yan, J.Q.; Liu, M.; Zhou, Y.; Shen, X.; Ma, Y.L.; Feng, X.S.; Yang, J.; Li, G.H. A review of the extraction and determination methods of thirteen essential vitamins to the human body: An update from 2010. Molecules 2018, 23, 1484. [Google Scholar] [CrossRef] [Green Version]
  34. Zendelovska, D.; Atanasovska, E.; Gjorgjievska, K.; Pavlovska, K.; Jakjovski, K.; Zafirov, D.; Trojacanec, J. A new solid-phase extraction method for determination of pantoprazole in human plasma using high-performance liquid chromatography. Open Access Maced. J. Med. Sci. 2019, 7, 1757–1761. [Google Scholar] [CrossRef] [PubMed] [Green Version]
  35. Puts, J.; de Groot, M.; Haex, M.; Jakobs, B. Simultaneous Determination of Underivatized Vitamin B1 and B6 in Whole Blood by Reversed Phase Ultra High Performance Liquid Chromatography Tandem Mass Spectrometry. PLoS ONE 2015, 10, e0132018. [Google Scholar] [CrossRef] [PubMed]
  36. Booth, B.P.; Simon, W.C. Analytical method validation. In New Drug Development; CRC Press: Boca Raton, FL, USA, 2016; pp. 138–159. [Google Scholar] [CrossRef]
  37. Neodo, A.; Schulz, J.D.; Huwyler, J.; Keiser, J. In vitro and in vivo drug-drug interaction study of the effects of ivermectin and oxantel pamoate on tribendimidine. Antimicrob. Agents Chemother. 2019, 63, e00762-18. [Google Scholar] [CrossRef] [Green Version]
  38. Zhang, L.; Reynolds, K.S.; Zhao, P.; Huang, S.M. Drug interactions evaluation: An integrated part of risk assessment of therapeutics. Toxicol. Appl. Pharmacol. 2010, 243, 134–145. [Google Scholar] [CrossRef]
  39. Castelli, M.C.; Wong, D.F.; Friedman, K.; Riley, M.G.I. Pharmacokinetics of Oral Cyanocobalamin Formulated With Sodium N-[8-(2-hydroxybenzoyl)amino]caprylate (SNAC): An Open-Label, Randomized, Single-Dose, Parallel-Group Study in Healthy Male Subjects. Clin. Ther. 2011, 33, 934–945. [Google Scholar] [CrossRef]
  40. Kahoun, D.; Fojtíková, P.; Vácha, F.; Čížková, M.; Vodička, R.; Nováková, E.; Hypša, V. Development and validation of an LC-MS/MS method for determination of B vitamins and some its derivatives in whole blood. PLoS ONE 2022, 17, e0271444. [Google Scholar] [CrossRef]
  41. Heidelbaugh, J.J. Proton pump inhibitors and risk of vitamin and mineral deficiency: Evidence and clinical implications. Ther. Adv. Drug Saf. 2013, 4, 125–133. [Google Scholar] [CrossRef] [Green Version]
  42. Lam, J.R.; Schneider, J.L.; Zhao, W.; Corley, D.A. Proton pump inhibitor and histamine 2 receptor antagonist use and vitamin B12 deficiency. JAMA J. Am. Med. Assoc. 2013, 310, 2435–2442. [Google Scholar] [CrossRef] [Green Version]
  43. Wedemeyer, R.S.; Blume, H. Pharmacokinetic drug interaction profiles of proton pump inhibitors: An update. Drug Saf. 2014, 37, 201–211. [Google Scholar] [CrossRef] [PubMed] [Green Version]
  44. Spechler, S.J. Proton Pump Inhibitors: What the Internist Needs to Know. Med. Clin. N. Am. 2019, 103, 1–14. [Google Scholar] [CrossRef] [PubMed]
Figure 1. Chemical Structure of (A) PNT; (B) VTB1; (C) VTB6; and (D) VTB12.
Separations 10 00170 g001
Figure 2. Solid state characterization of physically mixed samples using (A) XRPD and (B) DSC. (I) PNT-VTB1, (II) PNT-VTB6, and (III) PNT-VTB12.
Separations 10 00170 g002
Figure 3. Baseline-corrected and normalized FT-IR spectrum. (a), PNT-VTB1; (b), PNT-VTB6; and (c), PNT-VTB12.
Separations 10 00170 g003
Figure 4. Typical RP-HPLC chromatograms plasma at 280 nm. (i) Blank Plasma; (ii) VTB1; (iii) VTB6; (iv) VTB12; (v) PNT; and (vi) representative chromatogram of PNT, VTB1, VTB6, and VTB12 in spiked human plasma.
Separations 10 00170 g004
Figure 5. Pharmacokinetic study after single and combined dose administration in healthy adults. (a), PNT (20 mg-PNT/kg, p.o.); (b), VTB1 (100 mg-VTB1/kg, p.o.); and (c), VTB6 (200 mg-VTB6/kg, p.o.). Data represent the mean ± SE of 21–25 experiments.
Separations 10 00170 g005
Table 1. Demographic and baseline characteristics of study participants.
Group 1Group 2Group 3
Age (years)23.00 ± 2.6622.63 ± 3.6121.66 ± 0.96
Weight (kg)64.90 ± 9.5165.63 ± 12.1166.50 ± 14.02
Height (cm)165.20 ± 9.29165.18 ± 11.35166.30 ± 1.07
BMI, (kg/m2)23.64 ± 1.6223.67 ± 2.5623.78 ± 2.95
GenderMale868
Female242
Table 2. Some important peaks observed in FT-IR spectra of PNT, VTB1, VTB6, and VTB12 and their composite with their possible assignment.
Peak AssignmentPeak Position (cm−1)
PNTVTB1VTB6VTB12PM of PNT
and VTB1
PM of PNT
and VTB6
PM of PNT
and VTB12
N-H3485.373321.423323.35 3373.503373.50
O-H 3136.25 3776.62
3431.36
3136.253155.543772.76
N-H3369.643041.743242.34 2943.373379.29
C-H3196.052881.653091.892926.012945.302845.002941.44
C=O1589.34 1543.051593.201591.271589.341591.27
C-N1371.391359.82 1159.221381.031382.961377.17
C-O1118.71 1276.881029.991118.511118.71
S=O1035.771037.70 1031.921031.921033.85
Table 3. Analytical parameters for robustness of HPLC method.
ParametersVariablesPNTVTB1VTB6VTB12
RT% RecoveryRT% RecoveryRT% RecoveryRT% Recovery
Flow rate (mL/min)0.313.283.2 ± 5.345.1113.25 ± 2.879.2112.8 ± 1.986.568.05 ± 2.67
0.56.6123.70 ± 8.873.583.45 ± 3.255.598.73 ± 2.304.3107.44 ± 1.34
Mobile PhaseAcetonitrile7.5123.70 ± 8.873.583.45 ± 3.253.598.73 ± 2.304.3107.44 ± 1.34
MethanolNDNDNDNDNDNDNDND
Column (µm)250 × 4.69.2102.22 ± 3.433.277.45 ± 2.39NDNDNDND
150 × 4.66.8123.70 ± 8.872.783.45 ± 3.255.598.73 ± 2.303.8107.44 ± 1.34
Wavelength (nm)270NDNDNDNDNDND4.265.44 ± 4.90
2807.6123.70 ± 8.873.283.45 ± 3.255.5124.36 ± 2.304.5107.44 ± 1.34
305NDNDNDNDNDNDNDND
505NDNDNDNDNDND4.4125.67 ± 7.32
Column Tem. (°C)306.5123.70 ± 8.873.298.37 ± 2.496.1112.23 ± 5.654.2107.44 ± 1.34
357.5123.70 ± 8.873.483.45 ± 3.255.598.73 ± 2.304.1107.44 ± 1.34
ND, not detected; RT, retention time; Data represent the mean ± S.D. of 3 experiments
Table 4. Analytical parameters for system suitability test of HPLC method.
ParameterPNTVTB1VTB6VTB12
Retention time (min)6.8 ± 0.22.7 ± 0.15.5 ± 0.23.8 ± 0.1
Assay (%)104.13 ± 2.30102.99 ± 2.56114.36 ± 1.9490.01 ± 1.56
Peak height3539 ± 175.687308 ± 956.7251,846 ± 1749.483993.33 ± 633.33
No of theoretical plates547.66 ± 72.231214 ± 61.024360 ± 1480.811058 ± 249.52
USP Tailing Factor0.79 ± 0.061.47 ± 0.270.81 ± 0.31.81 ± 0.07
Capacity factor2.5 ± 1.180.71 ± 0.071.48 ± 0.500.79 ± 0.21
LOD (ng/mL)0.500.5915.340.04
LOQ (ng/mL)1.501.7869.340.10
Data represent the mean ± S.D. of 3 experiments.
Table 5. Intra-day and inter-day accuracy, precision, and recovery matrix effects for PNT, VTB1, VTB6, and VTB12 determination in plasma.
SampleSpiked Analyte
(µg/mL)
Intra DayInter Day
Mean ± S.DCV%Accuracy
(RE%)
Recovery
(%)
Mean ± S.DCV%Accuracy
(RE%)
Recovery
(%)
PNT1013.07 ± 0.987.53−10.78114.7013.12 ± 1.3410.22−11.22113.83
2019.65 ± 0.723.623.6798.4517.93 ± 3.1712.7210.2389.65
3027.36 ± 1.445.268.7791.2028.34 ± 0.993.495.5394.56
VTB11010.89 ± 1.4813.69−8.92108.909.53 ± 0.788.244.7395.30
2017.37 ± 0.784.50−2.4586.8515.51 ± 3.4512.2112.4377.55
3025.73 ± 1.566.0714.2085.7626.16 ± 1.967.3811.2887.20
VTB61010.23 ± 1.342.33−2.33102.3011.27 ± 0.232.343.45112.70
2019.23 ± 0.0241.446.2296.1518.54 ± 0.346.342.3492.70
3029.34 ± 0.032.448.2297.826.97 ± 4.7613.547.2389.90
VTB12107.31 ± 0.506.8414.8073.158.28 ± 0.273.3614.1282.8
2021.23 ± 3.566.09−14.18106.1526.19 ± 7.1012.12−10.9587.3
3030.45 ± 3.5811.77−1.57101.5038.08 ± 3.169.38−10.24112.33
Data represent the mean ± S.D. of 3 experiments. The accuracy of an analytical method expresses the nearness between the expected value and the value found. It is expressed by calculating the percent recovery (%) of analyte recovered.
Table 6. Pharmacokinetic parameters of PNT, VTB1, and VTB6 in healthy volunteers after oral administration of single dose and combined doses.
ParametersUnit PNT (20 mg/kg, p.o.)VTB1 (100 mg/kg, p.o.)VTB6 (200 mg/kg, p.o.)
AloneCombinationpAloneCombinationpAloneCombinationp
Cmaxμg/mL0.95 ± 0.347 0.98 ± 0.2950.9491.63 ± 0.1541.58 ± 0.0530.74220.66 ± 1.96924.09 ± 3.1790.410
Tmaxh2.67 ± 0.3332.67 ± 0.333>0.991.67 ± 0.3332.33 ± 0.3330.2302.00 ± 1.202.67 ± 0.3330.116
AUC0−6μg/mL * h3.88 ± 1.2393.56 ± 0.3560.8168.44 ± 0.5147.90 ± 0.1300.36662.91 ± 3.04656.52 ± 6.8160.440
AUC0−infμg/mL * h5.03 ± 0.9504.73 ± 0.3440.78239.72 ± 10.41751.37 ± 18.4690.61295.03 ± 29.34960.61 ± 6.7320.317
MRTh 4.95 ± 0.9934.71 ± 0.3340.83224.93 ± 8.89034.83 ± 14.7360.5965.13 ± 1.8823.36 ± 0.1650.402
CLLh−14.33 ± 0.7314.27 ± 0.2910.9362.78 ± 0.6012.44 ± 0.6970.7252.18 ± 0.9143.16 ± 0.3700.376
VdL17.94 ± 6.51616.78 ± 1.6050.96959.06 ± 6.07163.60 ± 4.7630.5887.58 ± 3.0219.71 ± 6.2580.774
t1/2h2.74 ± 0.8272.72 ± 0.1550.98817.01 ± 6.17723.85 ± 10.3020.6002.38 ± 1.2001.18 ± 0.4420.401
Keh−10.32 ± 0.1200.26 ± 0.0140.6090.05 ± 0.0160.04 ± 0.0140.6100.45 ± 0.1690.75 ± 0.2290.354
Cmax: maximum concentration; Tmax: time to maximum concentration; AUC0–6: area under the curve of blood concentration vs. time from 0 h to 6 h; AUC0–∞: area under the curve of blood concentration vs. time from 0 h to infinity; MRT: mean residence time; Vd: volume of distribution; CL: clearance; t1/2: elimination half-life; and Ke: elimination rate constant. Data represent the mean ± S.E. of 21–24 experiments. P, with respect to single administration and co-administration.
Disclaimer/Publisher’s Note: The statements, opinions and data contained in all publications are solely those of the individual author(s) and contributor(s) and not of MDPI and/or the editor(s). MDPI and/or the editor(s) disclaim responsibility for any injury to people or property resulting from any ideas, methods, instructions or products referred to in the content.

