
Validation of a Liquid Chromatography Coupled to Mass Spectrometry Method for Glyphosate and Aminomethylphosphonic Acid in Urine for Human Biomonitoring Using Combined Hybrid Anion-Exchange and Hydrophilic Interaction Liquid Chromatography


Abstract
:1. Introduction
2. Materials and Methods
2.1. Chemicals
2.2. Standard, Calibration, and Quality-Control Solutions
2.3. Equipment
2.4. LC-MS/MS Analysis
2.5. Sample Preparation
2.6. Set Up of the Analytical Sequence
2.7. Chromatographic Method
2.7.1. Analytical Column Selection and MS/MS Analysis
2.7.2. SPE Extraction and Purification
2.8. Assay Validation
2.8.1. Calibration Curve, Limits of Detection and Quantification, Carryover, Mid-Term Stability, Precision, Accuracy, Selectivity, and Matrix Effect
2.8.2. External Verification
2.9. Method Application
3. Results and Discussion
3.1. Method Development
3.1.1. Analytical Column Selection and MS/MS Analysis
3.1.2. SPE Extraction and Purification
3.2. Assay Validation
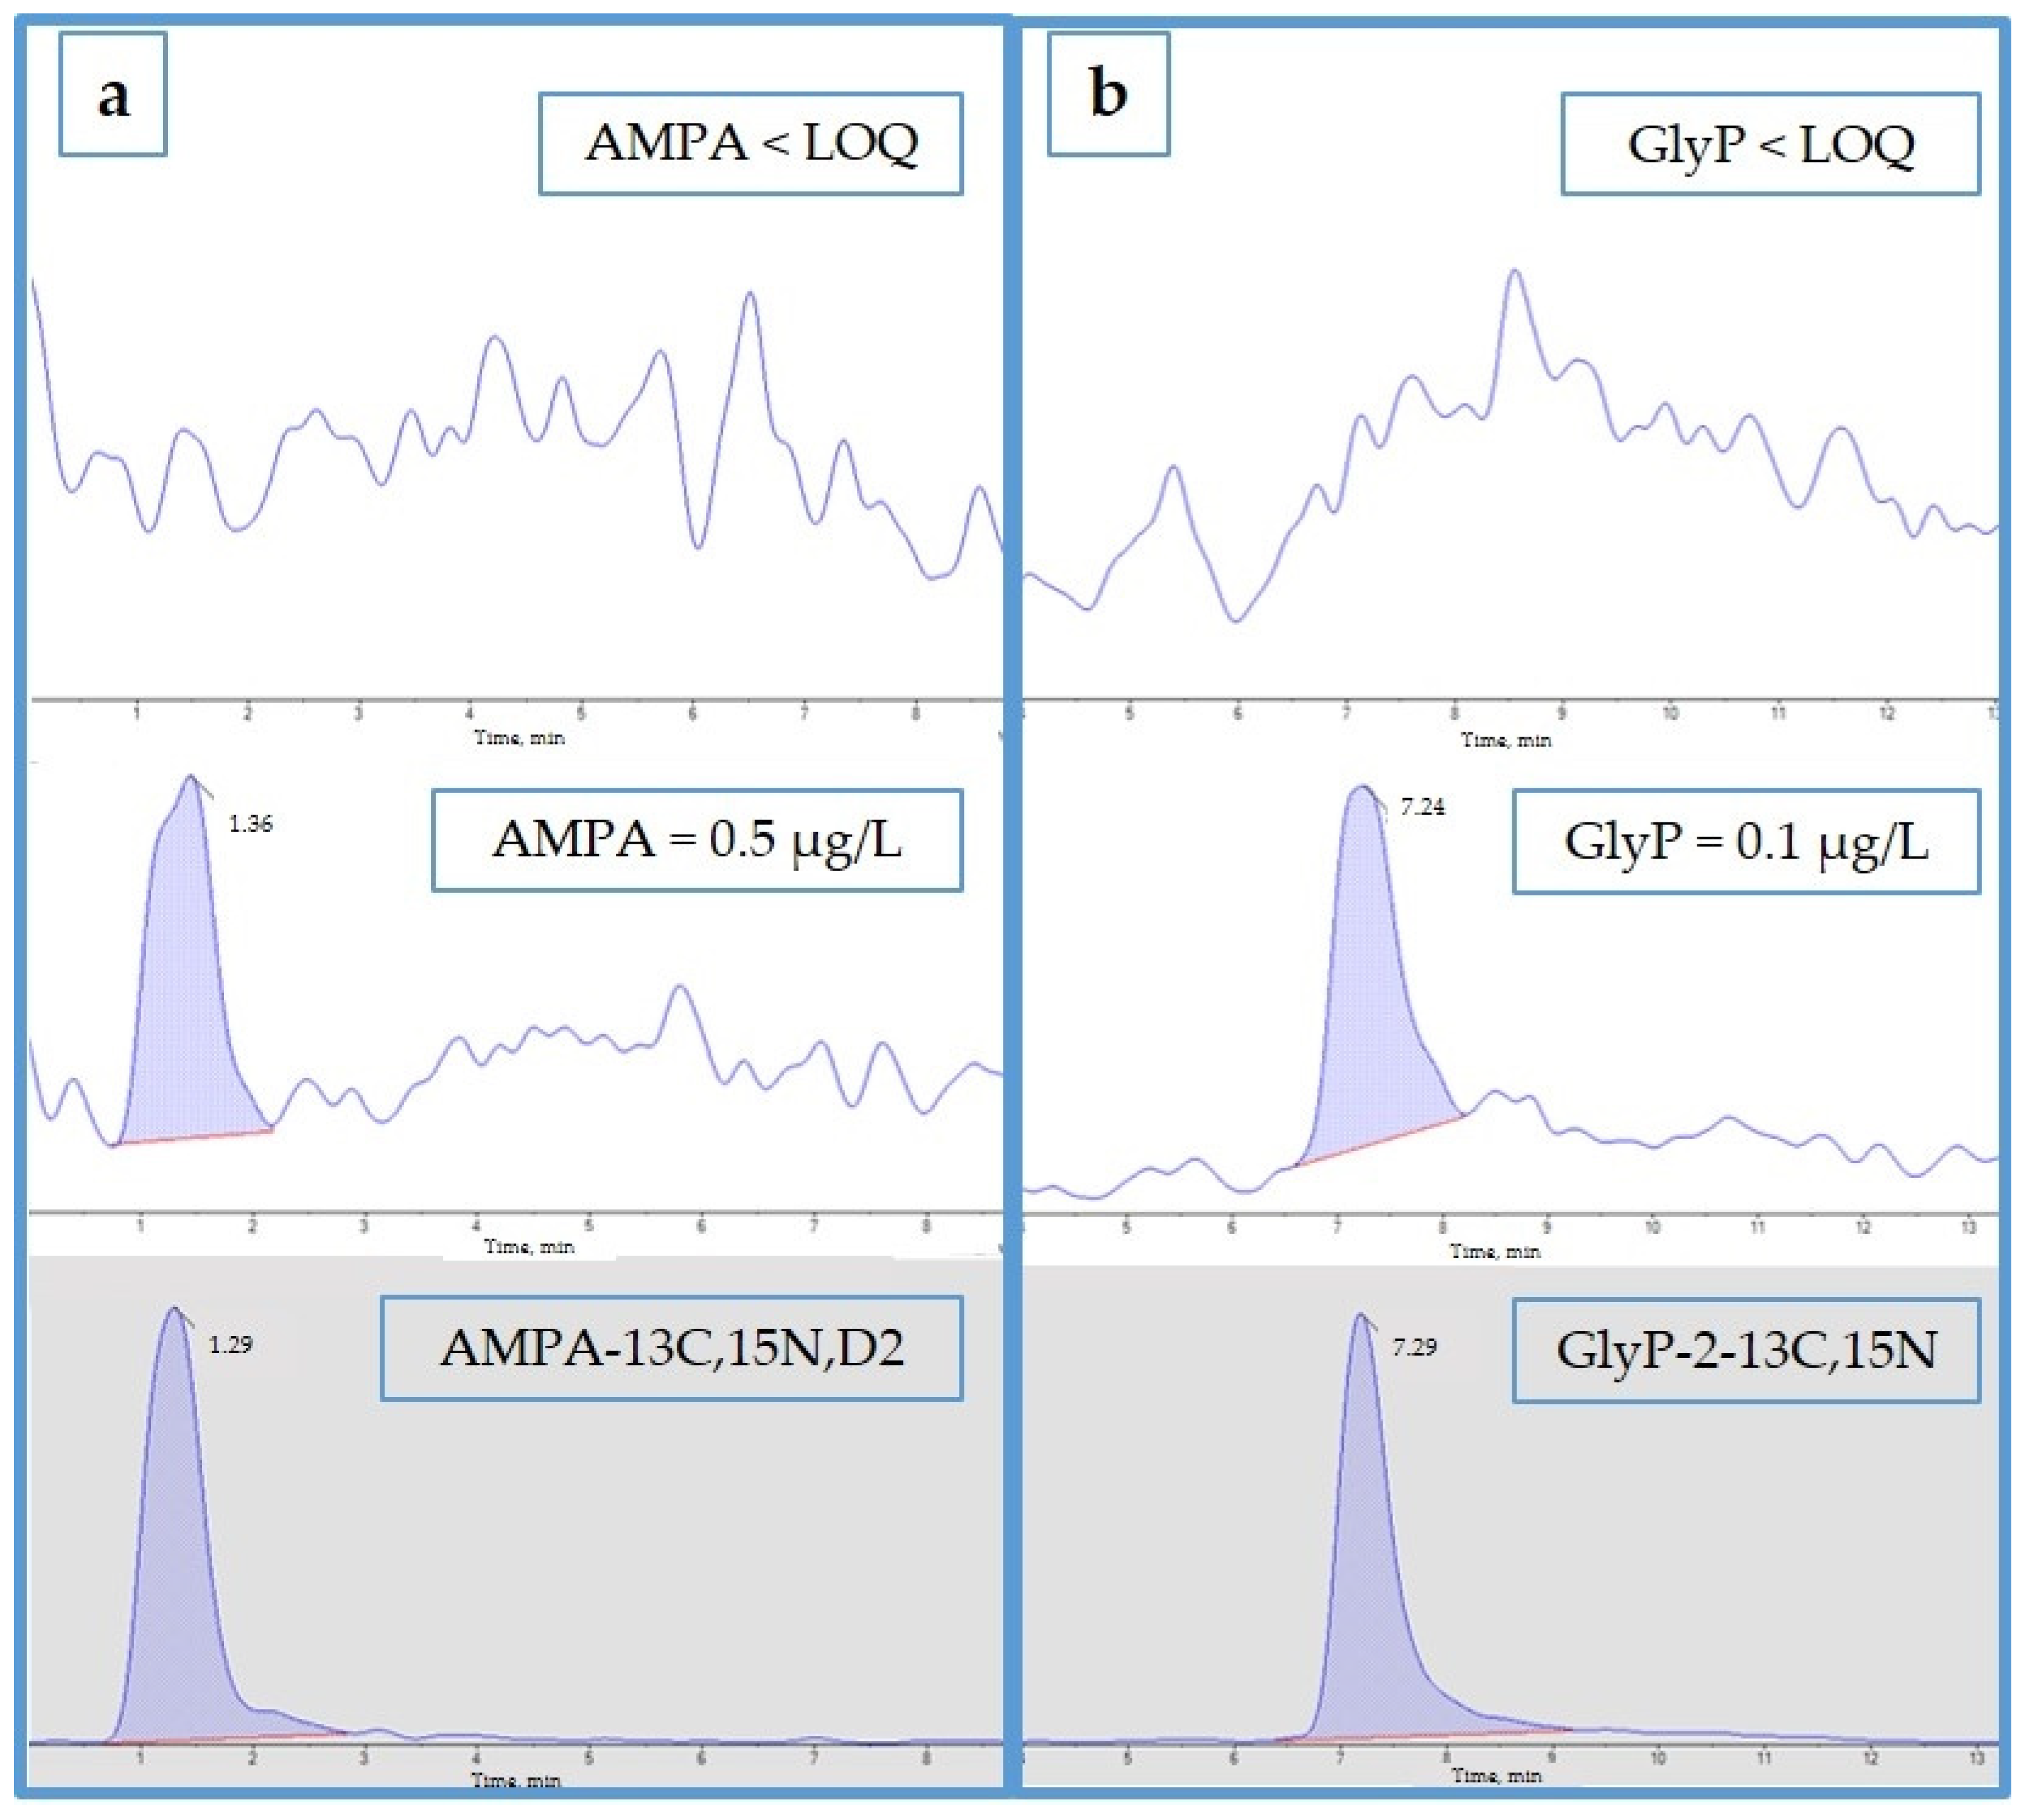
3.2.1. Calibration Curve, Limits of Detection and Quantification, Carryover, Mid-Term Stability, Precision, Accuracy, Selectivity, and Matrix Effect
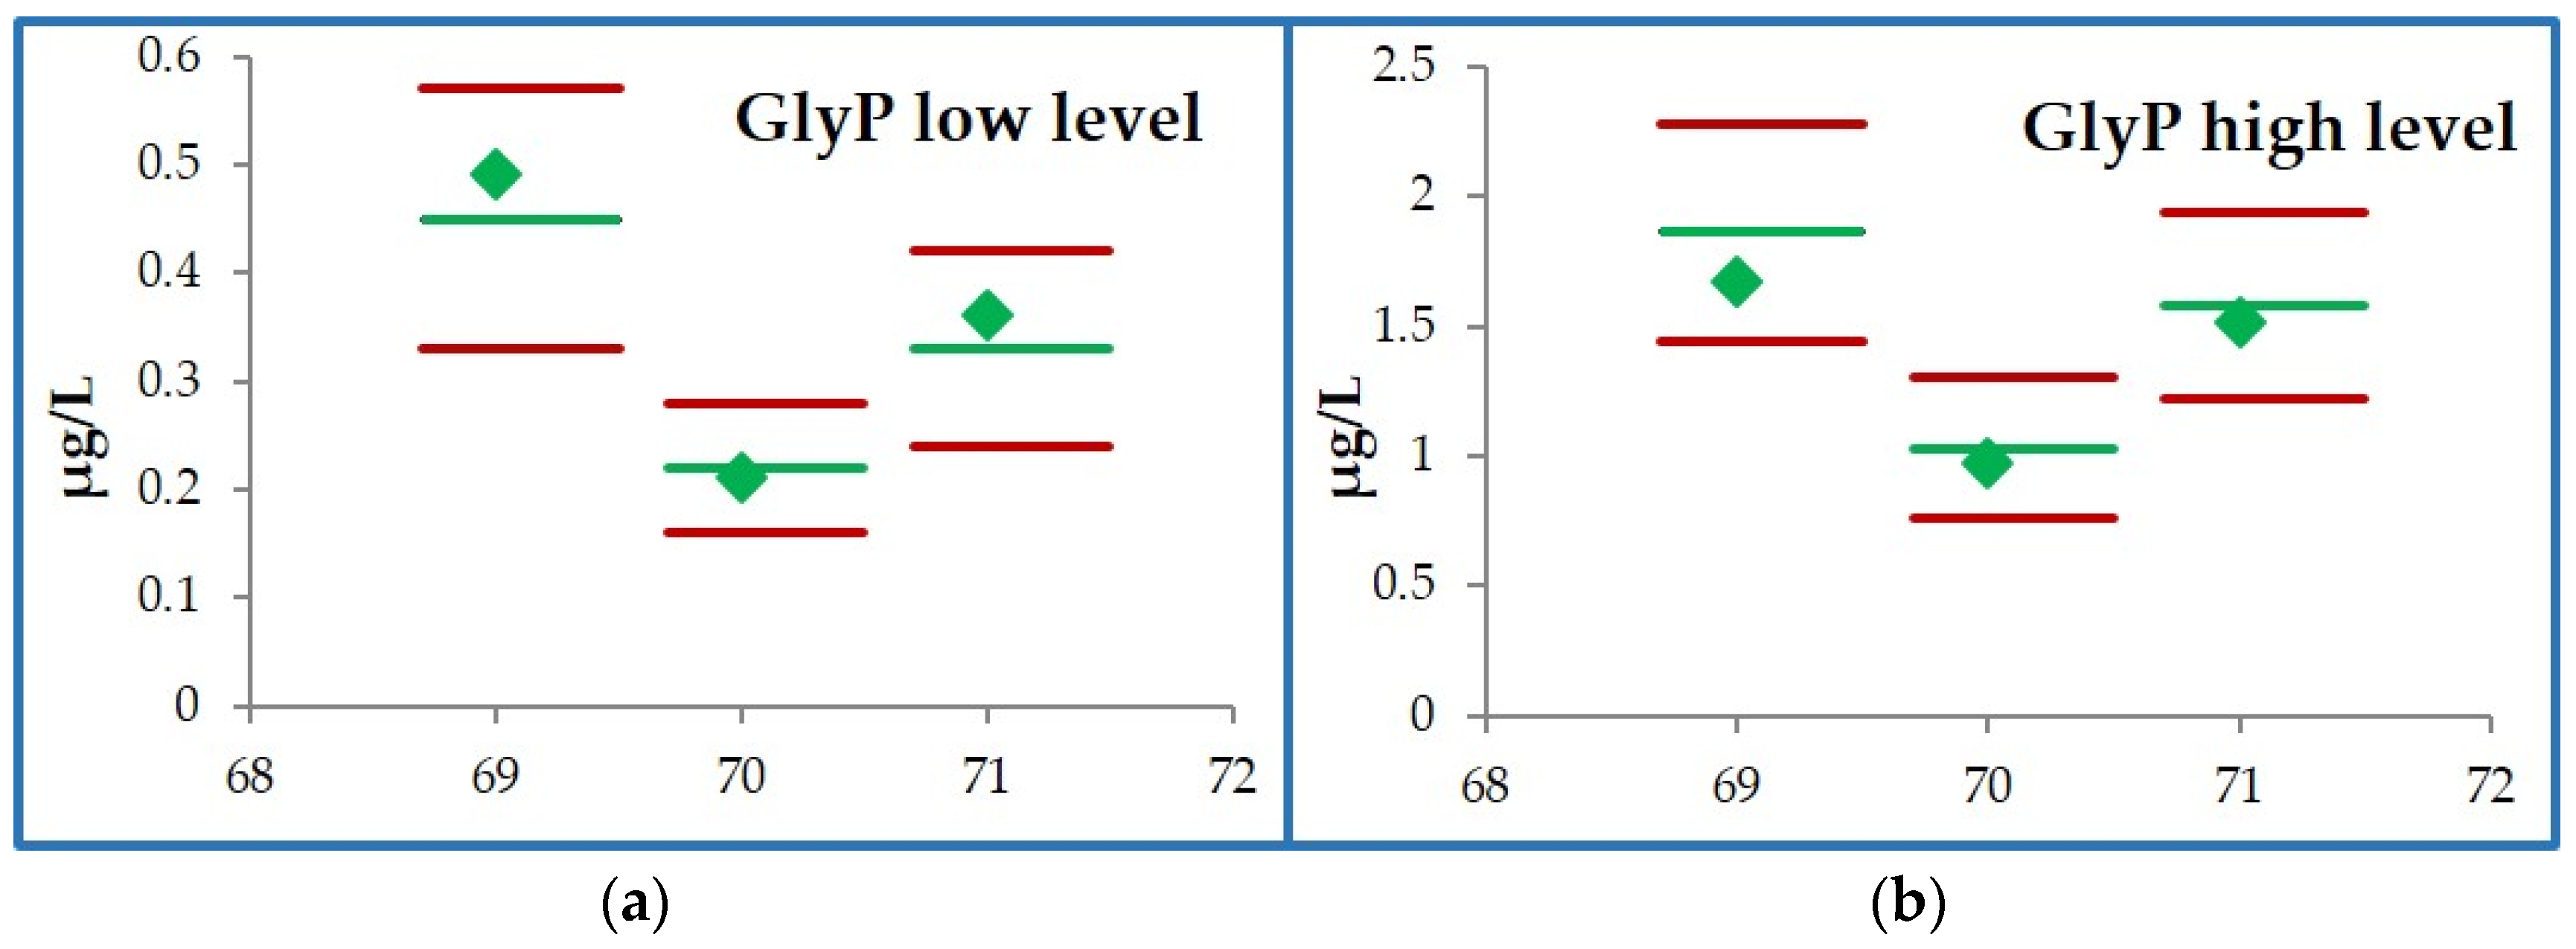
3.2.2. External Verification
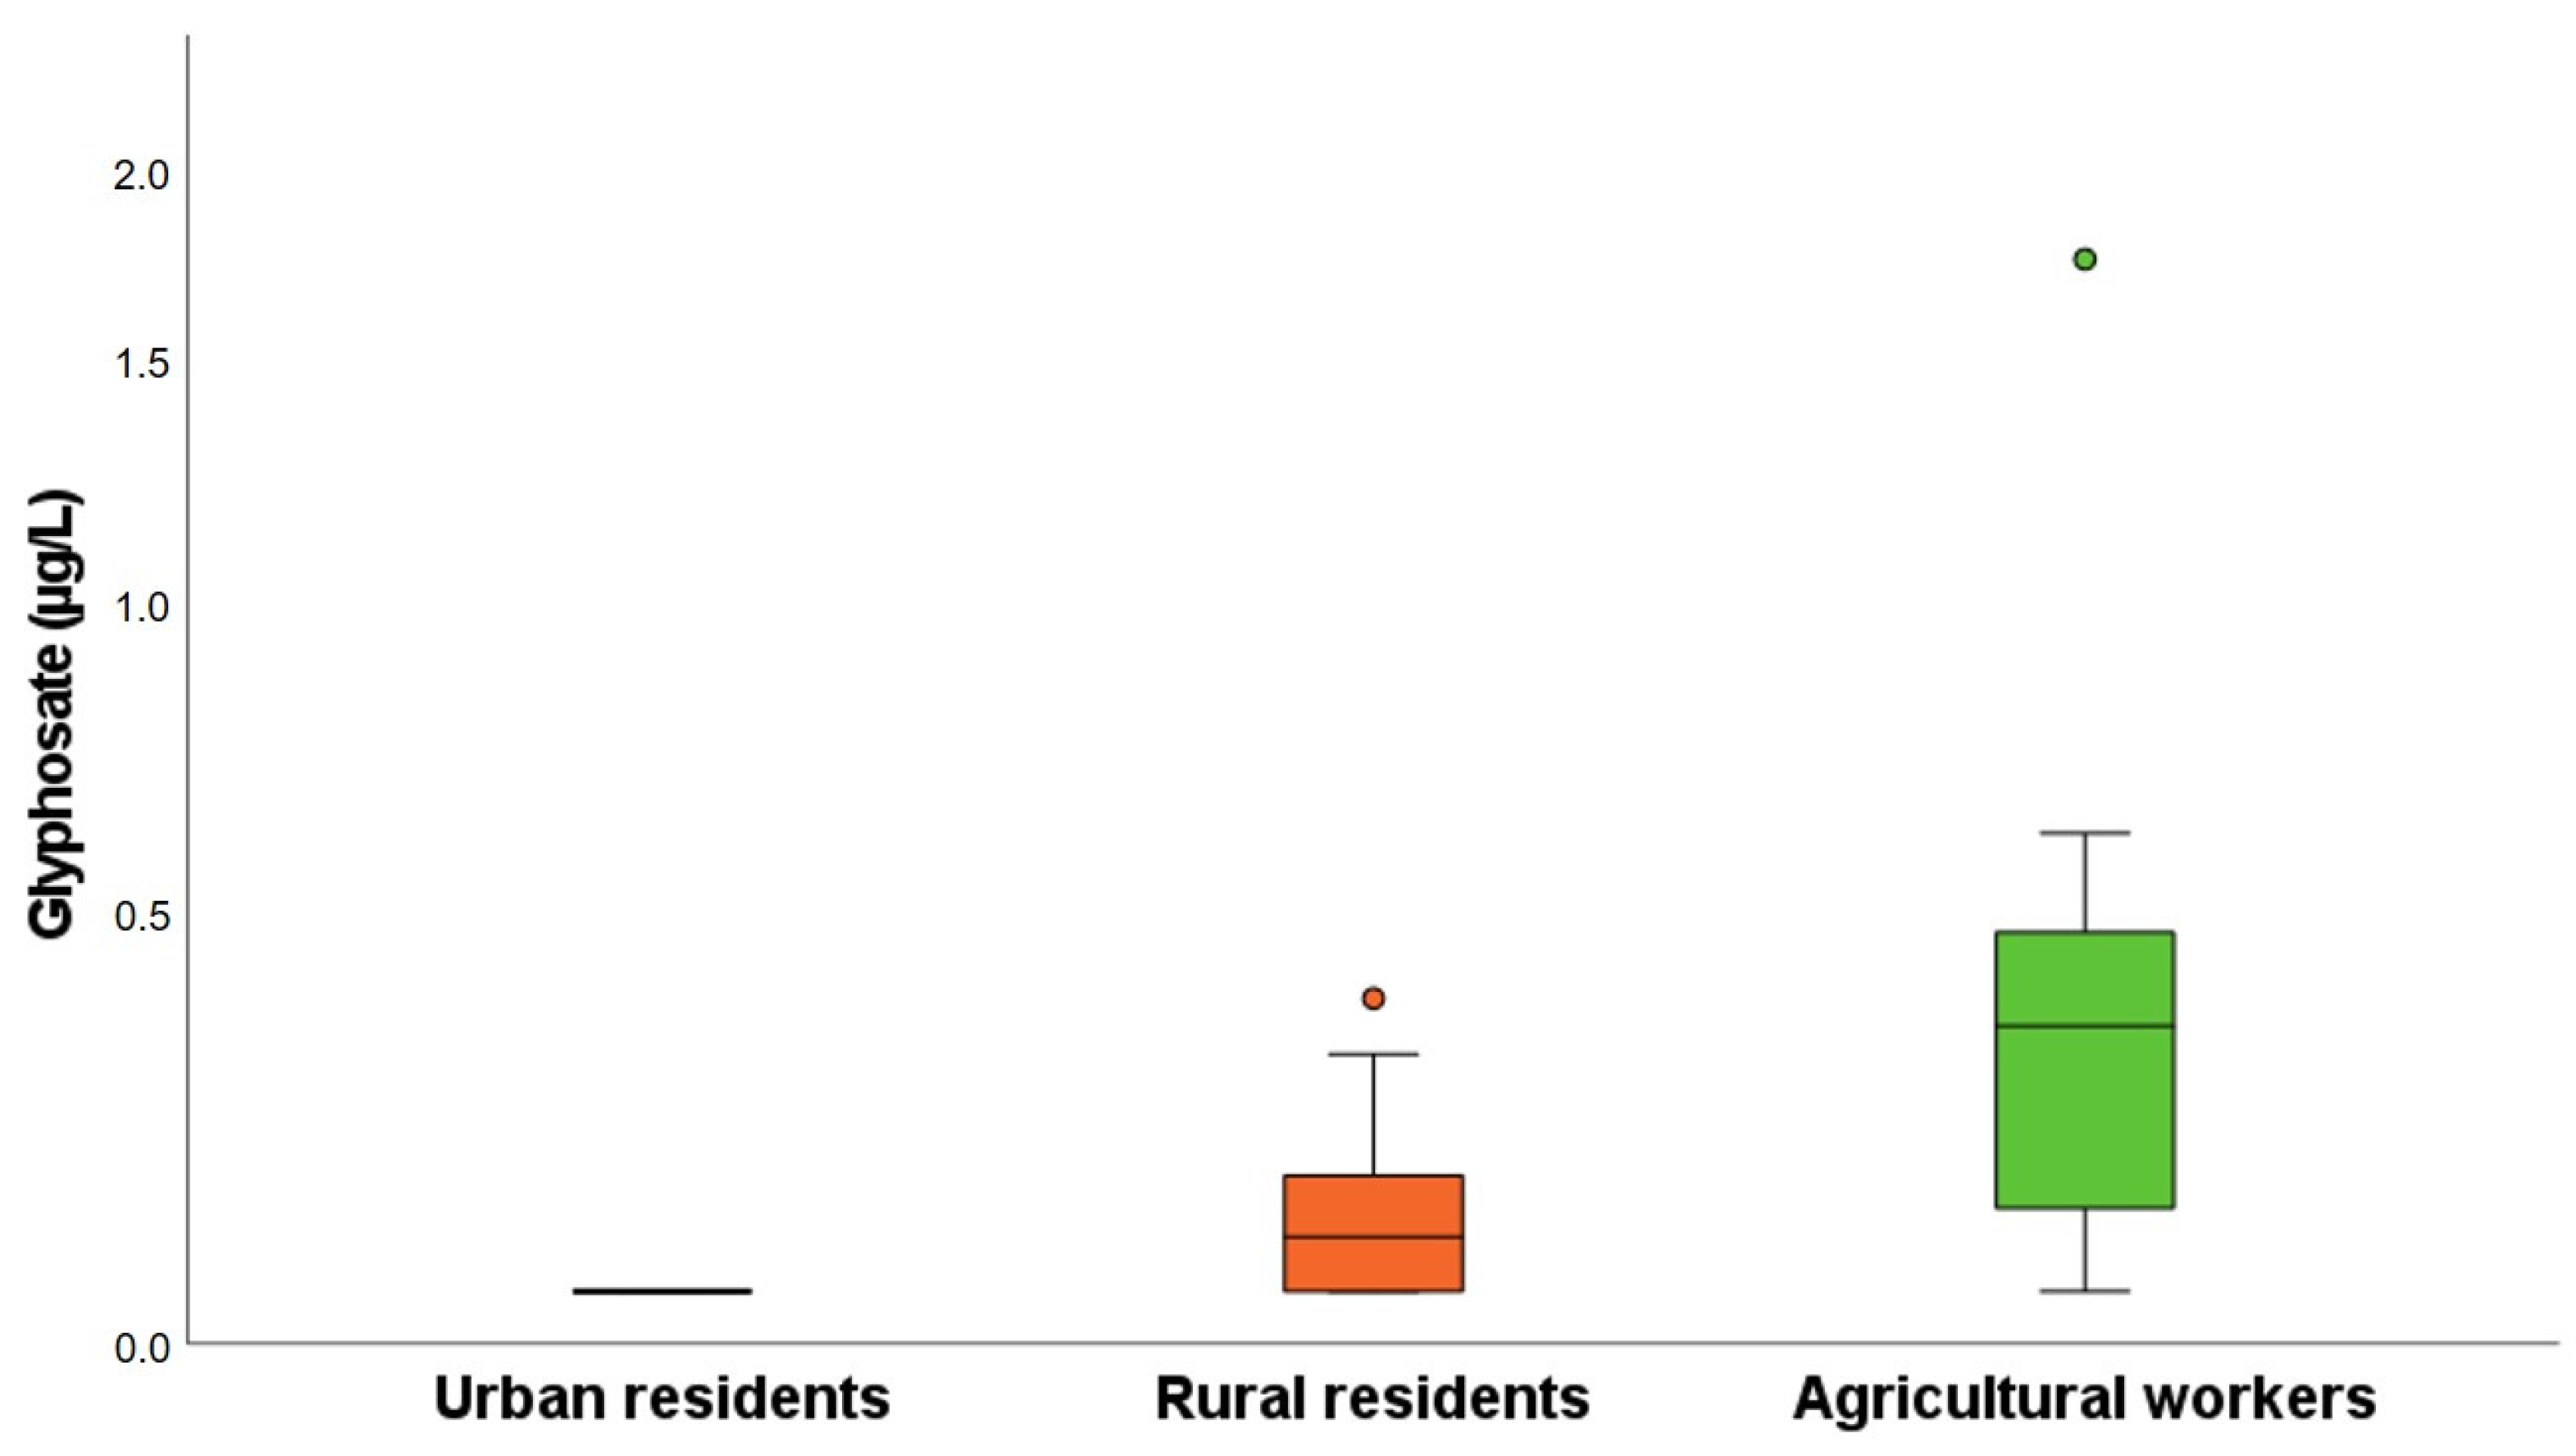
3.3. Method Application
4. Conclusions
Author Contributions
Funding
Institutional Review Board Statement
Informed Consent Statement
Data Availability Statement
Acknowledgments
Conflicts of Interest
References
- Maggi, F.; La Cecilia, D.; Tang, F.H.M.; McBratney, A. The global environmental hazard of glyphosate use. Sci. Total. Environ. 2020, 717, 137167. [Google Scholar] [CrossRef]
- Benbrook, C.M. Trends in glyphosate herbicide use in the United States and globally. Environ. Sci. Eur. 2016, 28, 3. [Google Scholar] [CrossRef] [PubMed]
- International Agency for Research on Cancer (IARC). Some Organophosphate Insecticides and Herbicides-IARC Monographs-Glyphosate; International Agency for Research on Cancer: Lyon, France, 2017; Volume 112, pp. 1–92. [Google Scholar]
- US Environmental Protection Agency (EPA). Glyphosate Issue Paper: Evaluation of Carcinogenic. 2016. Available online: https://www.epa.gov/sites/default/files/2016-09/documents/glyphosate_issue_paper_evaluation_of_carcincogenic_potential.pdf (accessed on 8 September 2023).
- European Chemical Agency (ECHA). Glyphosate Not Classified as a Carcinogen by ECHA. Available online: https://echa.europa.eu/it/-/glyphosate-not-classified-as-a-carcinogen-by-echa (accessed on 8 September 2023).
- European Chemical Agency (ECHA). Hazard Classification & Labelling of Glyphosate. Available online: https://echa.europa.eu/it/substance-information/-/substanceinfo/100.012.726 (accessed on 8 September 2023).
- European Food and Safety Agency (EFSA). Peer Review of the Pesticide Risk Assessment of the Active Substance Glyphosate. Available online: https://www.efsa.europa.eu/en/efsajournal/pub/8164 (accessed on 1 September 2023).
- Kanissery, R.; Gairhe, B.; Kadyampakeni, D.; Batuman, O.; Alferez, F. Glyphosate: Its environmental persistence and impact on crop health and nutrition. Plants 2019, 8, 499. [Google Scholar] [CrossRef] [PubMed]
- Anadón, A.; Martínez-Larrañaga, M.R.; Martínez, M.A.; Castellano, V.J.; Martínez, M.; Martin, M.T.; Nozal, M.J.; Bernal, J.L. Toxicokinetics of glyphosate and its metabolite aminomethyl phosphonic acid in rats. Toxicol. Lett. 2009, 190, 91–95. [Google Scholar] [CrossRef] [PubMed]
- Connolly, A.; Coggins, M.A.; Koch, H.M. Human Biomonitoring of Glyphosate Exposures: State-of-the-Art and Future Research Challenges. Toxics 2020, 8, 60. [Google Scholar] [CrossRef] [PubMed]
- Grau, D.; Grau, N.; Gascuel, Q.; Paroissin, C.; Stratonovitch, C.; Lairon, D.; Devault, D.A.; Di Cristofaro, J. Quantifiable urine glyphosate levels detected in 99% of the French population, with higher values in men, in younger people, and in farmers. Environ. Sci. Pollut. Res. 2022, 29, 32882–32893. [Google Scholar] [CrossRef] [PubMed]
- Rendón-Von Osten, J.; Dzul-Caamal, R. Glyphosate Residues in Groundwater, Drinking Water and Urine of Subsistence Farmers from Intensive Agriculture Localities: A Survey in Hopelchén, Campeche, Mexico. Int. J. Environ. Res. Public Health 2017, 14, 595. [Google Scholar] [CrossRef] [PubMed]
- Conrad, A.; Schröter-Kermani, C.; Hoppe, H.W.; Rüther, M.; Pieper, S.; Kolossa-Gehring, M. Glyphosate in German adults—Time trend (2001 to 2015) of human exposure to a widely used herbicide. Int. J. Hyg. Environ. Health 2017, 220, 8–16. [Google Scholar] [CrossRef] [PubMed]
- Connolly, A.; Koslitz, S.; Bury, D.; Brüning, T.; Conrad, A.; Kolossa-Gehring, M.; Coggins, M.A.; Koch, H.M. Sensitive and selective quantification of glyphosate and aminomethylphosphonic acid (AMPA) in urine of the general population by gas chromatography-tandem mass spectrometry. J. Chromatogr. B Anal. Technol. Biomed. Life Sci. 2020, 1158, 122348. [Google Scholar] [CrossRef] [PubMed]
- Chen, M.X.; Cao, Z.Y.; Jiang, Y.; Zhu, Z.W. Direct determination of glyphosate and its major metabolite, aminomethylphosphonic acid, in fruits and vegetables by mixed-mode hydrophilic interaction/weak anion-exchange liquid chromatography coupled with electrospray tandem mass spectrometry. J. Chromatogr. A 2013, 1272, 90–99. [Google Scholar] [CrossRef]
- Jensen, P.K.; Wujcik, C.E.; McGuire, M.K.; McGuire, M.A. Validation of reliable and selective methods for direct determination of glyphosate and aminomethylphosphonic acid in milk and urine using LC-MS/MS. J. Environ. Sci. Health-Part B Pestic. Food Contam. Agric. Wastes 2016, 51, 254–259. [Google Scholar] [CrossRef]
- Tsao, Y.C.; Lai, Y.C.; Liu, H.C.; Liu, R.H.; Lin, D.L. Simultaneous determination and quantitation of paraquat, diquat, glufosinate and glyphosate in postmortem blood and urine by LC-MS-MS. J. Anal. Toxicol. 2016, 40, 427–436. [Google Scholar] [CrossRef] [PubMed]
- Connolly, A.; Jones, K.; Galea, K.S.; Basinas, I.; Kenny, L.; McGowan, P.; Coggins, M. Exposure assessment using human biomonitoring for glyphosate and fluroxypyr users in amenity horticulture. Int. J. Hyg. Environ. Health 2017, 220, 1064–1073. [Google Scholar] [CrossRef] [PubMed]
- Jaikwang, P.; Junkuy, A.; Sapbamrer, R.; Seesen, M.; Khacha-ananda, S.; Mueangkhiao, P.; Wunnapuk, K. A Dilute-and-Shoot LC–MS/MS Method for Urinary Glyphosate and AMPA. Chromatographia 2020, 83, 467–475. [Google Scholar] [CrossRef]
- Zhang, H.; Liu, X.; Huo, Z.; Sun, H.; Zhang, F.; Zhu, B. An ion chromatography tandem mass spectrometry (IC-MS/MS) method for glyphosate and amino methyl phosphoric acid in serum of occupational workers. Microchem. J. 2021, 170, 106614. [Google Scholar] [CrossRef]
- Bressán, I.G.; Llesuy, S.F.; Rodriguez, C.; Ferloni, A.; Dawidowski, A.R.; Figar, S.B.; Giménez, M.I. Optimization and validation of a liquid chromatography-tandem mass spectrometry method for the determination of glyphosate in human urine after pre-column derivatization with 9-fluorenylmethoxycarbonyl chloride. J. Chromatogr. B Anal. Technol. Biomed. Life Sci. 2021, 1171, 122616. [Google Scholar] [CrossRef]
- Martin-Reina, J.; Dahiri, B.; Carbonero-Aguilar, P.; Soria-Dıaz, M.E.; González, A.G.; Bautista, J.; Moreno, I. Validation of a simple method for the determination of glyphosate and aminomethylphosphonic acid in human urine by UPLC-MS/MS. Microchem. J. 2021, 170, 106760. [Google Scholar] [CrossRef]
- Li, Z.-M.; Kannan, K.A.; Tchounwou, B.; Li, Z.-M.; Kannan, K. A Method for the Analysis of Glyphosate, Aminomethylphosphonic Acid, and Glufosinate in Human Urine Using Liquid Chromatography-Tandem Mass Spectrometry. Int. J. Environ. Res. Public Health 2022, 19, 4966. [Google Scholar] [CrossRef]
- Zhang, H.; Dou, J.; Miao, R.; Hu, J.; Huo, Z.; Zhang, F.; Ji, W. An analytical method for the determination of glyphosate and aminomethylphosphoric acid using an anionic polar pesticide column and the application in urine and serum from glyphosate poisoning patients. Anal. Methods 2023, 15, 1668–1673. [Google Scholar] [CrossRef] [PubMed]
- US Food and Drug Administration (FDA). Bioanalytical Method Validation Guidance for Industry Biopharmaceutics Bioanalytical Method Validation Guidance for Industry Biopharmaceutics Contains Nonbinding Recommendations. 2018. Available online: https://www.fda.gov/files/drugs/published/Bioanalytical-Method-Validation-Guidance-for-Industry.pdf (accessed on 6 September 2023).
- Matuszewski, B.K. Standard line slopes as a measure of a relative matrix effect in quantitative HPLC–MS bioanalysis. J. Chromatogr. B 2006, 830, 293–300. [Google Scholar] [CrossRef]
- German External QUality Assessment Scheme (G-EQUAS). The German External Quality Assessment Scheme for Analyses in Biological Materials. Available online: https://app.g-equas.de/web/ (accessed on 6 September 2023).
- Kroll, M.H.; Chesler, R.; Hagengruber, C.; Blank, D.W.; Kestner, J.; Rawe, M. Automated determination of urinary creatinine without sample dilution: Theory and practice. Clin. Chem. 1986, 32, 446–452. [Google Scholar] [CrossRef]
- Lesseur, C.; Pathak, K.V.; Pirrotte, P.; Martinez, M.N.; Ferguson, K.K.; Barrett, E.S.; Nguyen, R.H.N.; Sathyanarayana, S.; Mandrioli, D.; Swan, S.H.; et al. Urinary glyphosate concentration in pregnant women in relation to length of gestation. Environ. Res. 2022, 203, 111811. [Google Scholar] [CrossRef] [PubMed]
- Ruiz, P.; Dualde, P.; Coscollà, C.; Fernández, S.F.; Carbonell, E.; Yusà, V. Biomonitoring of glyphosate and AMPA in the urine of Spanish lactating mothers. Sci. Total Environ. 2021, 801, 149688. [Google Scholar] [CrossRef] [PubMed]
- Stajnko, A.; Snoj Tratnik, J.; Kosjek, T.; Mazej, D.; Jagodic, M.; Eržen, I.; Horvat, M. Seasonal glyphosate and AMPA levels in urine of children and adolescents living in rural regions of Northeastern Slovenia. Environ. Int. 2020, 143, 105985. [Google Scholar] [CrossRef] [PubMed]


| Analyte | Molecular Structure | Description | Q1 Mass (Da) | Q3 Mass (Da) | CE (V) | Retention Time (min) |
|---|---|---|---|---|---|---|
| Glyphosate |  | Quantifier | 168 | 63 | −20 | 7.24 |
| Qualifier | 168 | 79 | ||||
| Glyphosate-2-13C,15N | 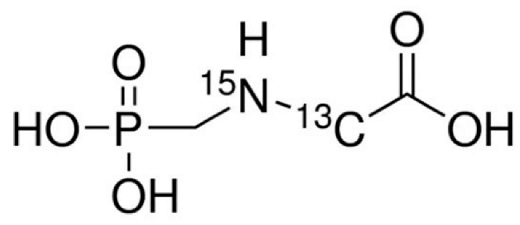 | IS | 170 | 63 | −19 | 7.19 |
| AMPA |  | Quantifier | 110 | 63 | −18 | 1.44 |
| Qualifier | 110 | 79 | ||||
| AMPA-13C,15N,D2 | 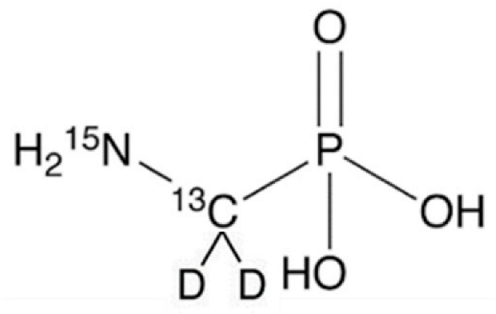 | IS | 114 | 63 | −19 | 1.45 |
| Analyte | Calibration Curve (Concentration Range 0.1–40 µg/L) | QC | ||||||||||||
|---|---|---|---|---|---|---|---|---|---|---|---|---|---|---|
| n = 14 | Matrix Effect | QC Level | Day 1–8 n = 3 | Overall n = 24 | Matrix Effect | |||||||||
| LOD | LOQ | %RSD at LOQ Level | %Theoretical at LOQ Level | %RSDslope | %Rslope without IS | %Rslope with IS | %RSD (Min–Max) | %Theoretical (Min–Max) | %RSD | %Theoretical | %Matrixrelative without IS | %Matrixrelative with IS | ||
| GlyP | 0.05 | 0.1 | 2.3 | 112 | 3.8 | 14.2 | 2.8 | Low | 0.5–7.3 | 93–108 | 4.8 | 105 | 8.2 | 5.6 |
| Medium | 0.1–4.7 | 96–106 | 4.2 | 101 | 6.1 | 5.6 | ||||||||
| High | 0.1–3.2 | 98–101 | 2.2 | 100 | 6.9 | 5.8 | ||||||||
| AMPA | 0.1 | 0.5 | 3.8 | 101 | 5.6 | 29.7 | 3.8 | Low | 0.4–7.2 | 90–108 | 5.7 | 105 | 9.2 | 6.3 |
| Medium | 0.1–6.2 | 97–107 | 4.6 | 104 | 8.2 | 6.8 | ||||||||
| High | 0.1–4.4 | 97–105 | 3.6 | 101 | 7.5 | 4.6 | ||||||||
| Analyte | Urban Residents | Rural Residents | Agricultural Workers | |
|---|---|---|---|---|
| N = 9 | N = 26 | N = 12 | ||
| GlyP (µg/L) | N° samples >LOQ (%) | 0 | 15 (58%) | 11 (92%) |
| Mean | <0.1 | 0.13 | 0.42 | |
| Standard deviation | - | 0.09 | 0.45 | |
| Median | <0.1 | 0.1 | 0.34 | |
| Min–Max | - | <0.1–0.38 | <0.1–1.75 | |
| AMPA (µg/L) | N° samples >LOQ (%) | 0 | 0 | 2 (17%) |
| Mean | <0.5 | <0.5 | < 0.5 | |
| Standard deviation | - | - | 0.15 | |
| Median | <0.5 | <0.5 | < 0.5 | |
| Min–Max | - | - | <0.5–0.72 |
Disclaimer/Publisher’s Note: The statements, opinions and data contained in all publications are solely those of the individual author(s) and contributor(s) and not of MDPI and/or the editor(s). MDPI and/or the editor(s) disclaim responsibility for any injury to people or property resulting from any ideas, methods, instructions or products referred to in the content. |
© 2023 by the authors. Licensee MDPI, Basel, Switzerland. This article is an open access article distributed under the terms and conditions of the Creative Commons Attribution (CC BY) license (https://creativecommons.org/licenses/by/4.0/).
Share and Cite
Polledri, E.; Mercadante, R.; Fustinoni, S. Validation of a Liquid Chromatography Coupled to Mass Spectrometry Method for Glyphosate and Aminomethylphosphonic Acid in Urine for Human Biomonitoring Using Combined Hybrid Anion-Exchange and Hydrophilic Interaction Liquid Chromatography. Separations 2023, 10, 576. https://doi.org/10.3390/separations10110576
Polledri E, Mercadante R, Fustinoni S. Validation of a Liquid Chromatography Coupled to Mass Spectrometry Method for Glyphosate and Aminomethylphosphonic Acid in Urine for Human Biomonitoring Using Combined Hybrid Anion-Exchange and Hydrophilic Interaction Liquid Chromatography. Separations. 2023; 10(11):576. https://doi.org/10.3390/separations10110576
Chicago/Turabian StylePolledri, Elisa, Rosa Mercadante, and Silvia Fustinoni. 2023. "Validation of a Liquid Chromatography Coupled to Mass Spectrometry Method for Glyphosate and Aminomethylphosphonic Acid in Urine for Human Biomonitoring Using Combined Hybrid Anion-Exchange and Hydrophilic Interaction Liquid Chromatography" Separations 10, no. 11: 576. https://doi.org/10.3390/separations10110576
APA StylePolledri, E., Mercadante, R., & Fustinoni, S. (2023). Validation of a Liquid Chromatography Coupled to Mass Spectrometry Method for Glyphosate and Aminomethylphosphonic Acid in Urine for Human Biomonitoring Using Combined Hybrid Anion-Exchange and Hydrophilic Interaction Liquid Chromatography. Separations, 10(11), 576. https://doi.org/10.3390/separations10110576