Abstract
The development of analytical procedures capable of simultaneous determination of two or more drugs is in crucial demand due to the availability of different formulations that are composed of different APIs. The presented study aimed to optimize and validate a simple, accurate, and sensitive UPLC analytical method for the simultaneous determination of thymoquinone (TQ) and Glibenclamide (GB) using response surface methodology, and apply this method in pharmaceutical formulations. A 32 full design of experiment was utilized to study the impacts of the independent parameters (acetonitrile ACN concentration, A; and column temperature, B) on the drugs’ analytical attributes (viz, retention time, peak area, and peak asymmetry, in addition to the resolution between TQ and GB peaks). The results revealed that the independent parameters exhibited highly significant (p < 0.05) antagonistic effects on retention times for TQ and GB peaks, in addition to the agnostic effect on GB peak symmetry (p-value = 0.001). Moreover, antagonistic impacts (p < 0.05) on the resolution between TQ and GB peaks were found for both independent factors (A and B). The statistical software suggested 46.86% of ACN (A) and 38.80 °C for column temperature (B) for optimum analytical responses. The optimized green method was discovered to be acceptable in terms of selectivity, precision, accuracy, robustness, sensitivity, and specificity. Moreover, the optimized simultaneous method was successfully able to determine the contents of TQ and GB in self-nanoemulsifying drug delivery (SNEDD) formulation, in which the results showed that GB and TQ content within the prepared formulations were 1.54 ± 0.023 and 3.62 ± 0.031 mg/gm, respectively. In conclusion, the developed assay was efficient and valid in analyzing TQ and GB simultaneously in bulk and self-nanoemulsifying drug delivery system (SNEDDs) formulations.
Keywords:
UPLC; simultaneous determination; optimization; validation; thymoquinone; Glibenclamide; TQ-GB SNEDD 1. Introduction
Diabetes is one of the most common chronic metabolic disorders that significantly affects the quality of patients’ lives [1]. Therefore, various types of therapeutic molecules have emerged in the clinical setting for the treatment of diagnosed patients. Among them, Glibenclamide (GB) is a hypoglycemic agent that is regularly prescribed by physicians orally for the treatment of type II diabetes [2]. Recently, various types of herbals have been used in adjunctive with oral hypoglycemic agents to enhance therapeutic outcomes [3,4].
Nigella sativa plant contains variable amounts of phytochemicals that produce different beneficial effects on the quality of life [5]. Thymoquinone (TQ) is a well-known active substance that exerts different pharmacological effects including antidiabetic effects. In this regard, sixteen clinical studies revealed that continuous Nigella sativa intake significantly reduced blood glucose (BG) levels [6]. Furthermore, various in vivo studies revealed that TQ protected the animals from common complications of diabetes such as cardiac myopathy [7], chronic kidney diseases [8], liver damage [9], and reproductive dysfunction [10]. This reported beneficial pharmacological action of TQ is attributed to the increment in the total antioxidant capacity [11,12].
Several clinical studies showed the synergistic effects of combining Nigella sativa (plant root of TQ) with other antidiabetic drugs or metformin. In a participant-blind study, the patients were administered 2 gm of Nigella sativa concomitant to their oral antidiabetic drug daily for 1 year. The results showed a significant reduction in the level HbA1c and glutathione and thiobarbituric acid reactive substances (TBARS) as well as a significant rise in the level of antioxidant capacity [13,14]. Moreover, it was also observed that a reduction in LDL-cholesterol and triglycerides occurred [15].
The proposed combination (GB + TQ) has a variable limitation before it can be transferred to clinical practice. GB belongs to class II based on a biopharmaceutical classification system (BSC) with reported low drug bioavailability owing to its restricted drug solubility [13]. Therefore, there is a demand to increase GB solubility utilizing the previously established drug delivery systems. Inter alia, self-nanoemulsifying drug delivery system SNEDDS has been utilized to enhance the dissolution and bioavailability of lipophilic drugs [16]. It is usually composed of oil in addition to a surfactant and cosurfactant mixture to achieve this purpose [17]. From these perspectives, an oil extract from the Nigella sativa plant, called black seed oil (BSO), could be employed not only to fabricate SNEDDS but also to combine GB and TQ in a single formulation [18].
Several analytical methods have been utilized to analyze GB and TQ separately. Haq et al. [19] developed a green analytical method using a mobile phase of ethanol: methanol (50:50) to analyze GB in the SNEDD formulation as well as in a marketed product. Another sensitive and valid green UPLC method was developed by Ibrahim et al. [20].
A valid, simple, and sensitive HPLC method was developed to detect TQ in N. Sativa extract, a marketed product by eqbal et al., 2013 [21]. TQ was eluted after 3.3 min using acetonitrile/phosphate buffer (40:60) as a mobile phase and detected by a fluorescence detector. A UPLC-PAD analytical analysis for the determination of TQ in N. sativa was also developed [22].
One simultaneous analytical method was developed to analyze GB and TQ in rat’s plasma [23]. The system condition is composed of methanol, acetonitrile, and potassium dihydrogen phosphate buffer (50:20:30).
In the present study, design of experiment (DOE) was utilized to develop a validated UPLC method for quantification of GB and TQ in the proposed formulation in terms of retention time (RT), peak area, resolution, and peak symmetry. Moreover, the developed method was utilized to assess its suitability for quantification and separation of both drugs. Finally, GB and TQ concentrations were determined in the prepared SNEDDS formulation.
2. Materials and Methods
2.1. Materials
Thymoquinone (TQ) was purchased from Sigma-Aldrich (St. Louis, MO, USA). Glibenclamide (GB) was obtained from SPIMACO (Qassim, Saudi Arabia). Formic acid ≥ 98% was obtained from SIGMA-ALDRICH (Steinheim, Germany). HPLC-grade methanol was obtained from Riedelde Haën Laboratory Chemicals (Selzer, Germany). Black seed oil (BSO) was purchased from Wadi Al-Nahil Investment Group (Riyadh, Saudi Arabia). Kolliphor EL (K-EL) was acquired from BASF (Ludwigshafen, Germany). Transcutol® P (TC-P) was acquired from Gattefossé (Lyon, France). Span-80 (S-80) was purchased from Merck (Darmstadt, Germany).
2.2. Design of Experiment (DoE)
To optimize and study the impact of the independent analytical parameters on the simultaneous determination of GB and TQ analytical attributes, a 32 full design of the experiment was applied. The effects of the two independent factors were acetonitrile (ACN) concentration in the mobile phase (A) and column temperature (B); the analytical attributes (responses) were retention time, peak area, and peak asymmetry for both APIs, in addition to the resolution between TQ and GB peaks, as shown in Table 1. Data analysis was carried out by using Design Expert® Software.(version 11) Based on statistical design, 9 analytical runs were created based on variation of ACN concentration with column temperature.

Table 1.
Statistical design for analytical procedure of TQ and GB using UPLC.
2.3. UPLC Analytical System and Conditions
The experimental protocols for simultaneous analysis of RQ and GB were employed with a highly sensitive UPLC system (Ultimate 3000® binary solvent manager) that was equipped with an automatic sampler and a Photodiode Array (PDA) detector. The analytical separation of the two compounds was accomplished by reverse-phase isocratic elution by using a mobile phase composed of different ACN concentrations (40, 45 and 50% ACN mixed, respectively with 60, 55 and 50% of water containing 0.1% formic acid) and different column temperatures according to the previously mentioned statistical design. The elution flow rate through an Acquity® UHPLC column HSS C18 (2.1 × 50 mm, 1.7 μm) was 0.3 mL/min. The analytical separation of TQ and GB was carried out at wavelengths of 256 nm and 228 nm, respectively, and the total run time was 10.0 min.
2.4. Optimization of UPLC Conditions for GB Analysis
Based on the statistical analysis of all tested responses (dependent factors), the procedure of optimizing the analytical conditions for the simultaneous separation of the two APIs was established based on the analytical desirability criteria. These criteria included minimum retention time and maximum peak area in the range of peak asymmetry (0.8–1.2) for both TQ and GB. In addition, the resolution between the first TQ peak and the second GB peak was selected as optimum when it is in the range of 2–4, providing a clear separation of the two peaks. The values of those parameters will be compared with the predicted values obtained from the software.
2.5. Preparation of Standard Stock Solution, Calibration and Quality Control Samples
Stock working solution of the two APIs containing 500 ppm of each analyte was made by dissolving 50 mg of TQ and 50 mg of GB in 100 mL of methanol, from which serial dilutions (1–50 ppm) were prepared in methanol. Each analyte concentration was analyzed by triplicate injection of the sample. The measured peak area of each analyte was plotted against the corresponding concentration to acquire the standard calibration curve, and the resembling regression equations were derived. Validation samples have been selected within the range (2–50 ppm) as a low, intermediate and high concentration 2, 20, 50 ppm.
2.6. UPLC Analytical Validation
To demonstrate the suitability of the developed analytical procedure, different validation characteristics, including accuracy, precision, linearity, limit of detection (LOD), limit of quantification (LOQ), and robustness, were tested according to the International Conference of Harmonization (ICH Q2 R1) [24].
2.6.1. Linearity
The linearity was investigated by performing a calibration curve for GB and TQ. The calibration curves were constructed from 0.5 to 50 ppm. A triple run was carried out and the average peak area was plotted against the drug concentration to estimate the line equation [24,25,26].
2.6.2. Accuracy and Precision
Accuracy or trueness describes the closeness between the values in comparison to the standard. The accuracy was detected by calculating the % recovery. The precision of the analytical procedure is considered at two levels, intraday and inter-day. In intraday precision, 3 levels of concentrations for both GB and TQ (low (0.5, and 1 ppm), medium (20 ppm), and high level of 50 ppm were injected in triplicate at 3 different times on the same day. For inter-day precision, the samples were injected at 3 different days. The suitability of the results was determined by calculating the RSD. RSD should be no more than 2% [25].
2.6.3. Limit of Detection (LOD) and Limit of Quantification (LOQ)
LOD and LOQ were specified using the standard deviation and slope method as per the following equation [17].
2.6.4. Robustness
To demonstrate the reliability of the developed analytical assay, the impact of some critical and tiny changes in the analytical condition was made. These changes include changes in the flow rate (0.28 to 0.32 mL/min) and the absorbance wavelength was 254 to 258 for TQ and 226–230 nm for GB. The effect was determined in terms of peak area, and retention time.
2.7. Preparation and Characterization of SNEDDS
Drug-free SNEDDS formulation was prepared using K-EL, S-80, TC-P, and BSO (3:2:2:3). Regarding drug-loaded SNEDDS formulation, an excess amount of GB was mixed with drug-free SNEDDS formulation. After 24 h, the mixture was centrifuged at 10,000 rpm for 5 min and the supernatant was transferred to another microcentrifuge tube. Drug-free as well as drug-loaded SNEDDS formulations were placed in 25 mL plastic containers and then diluted using deionized water (1:1000). To enhance the formation of SNEDDS, they were subjected to mixing using magnetic stirring for 5 min. The obtained dispersion system was evaluated utilizing a Zetasizer (Model ZEN3600, Malvern Instruments Co., Worcestershire, UK) to measure the particle size of SNEDDS formulations.
Determination of Drug Content
Based on a previously reported study, the concentration of GB and TQ within the prepared drug-loaded SNEDDS formulation was determined. The precise weight of formulation was measured within 2 mL Eppendorf, diluted with 1.8 mL acetonitrile, and then subjected to sonication for 15 min. Following that, the solution was diluted properly to measure drug concentration based on the calibration range using the developed UPLC method.
3. Results
3.1. Effect of Independent Factors on Retention Time (RT)
The effect of independent analytical parameters on the analytical responses of TQ and GB is shown in ANOVA Table 2 and the Pareto standardized chart in Figure 1. Concerning retention time, both individual parameters showed highly significant antagonistic effects on the RT of both analytes. The p values of the effect of ACN and column temperature on TQ retention time were <0.0001 and 0.0006, respectively, while these values were <0.0001 and 0.007 on GB, respectively, for ACN and column temperature. Also, the quadratic effect of ACN (A2) and interactive effects of the independent parameters showed significant agonistic actions on the retention time of the TQ peak.

Table 2.
ANOVA data for the effects of independent analytical parameters on the analytical responses of TQ and GB.
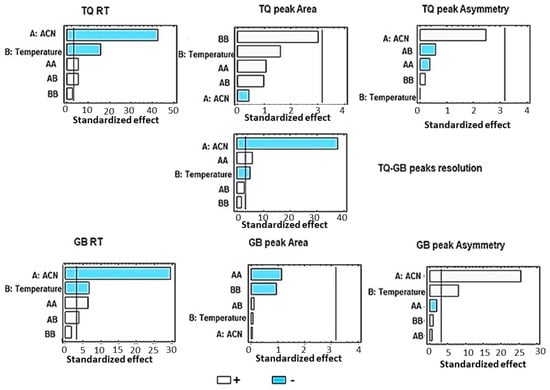
Figure 1.
Pareto charts for the effect of independent factors on TQ and GB analysis.
The equation of the proposed model is TQ retention time = 20.4688 − 0.606367 ACN − 0.134967 Temperature + 0.00491333ACN2 + 0.00172 ACN.Temprature + 0.000613333 Temprature2.
Moreover, quadratic effects (A2 and B2) and interactive effects of the independent parameters showed significant agonistic actions on the GB peak retention time.
The equation of the proposed model is GB retention time = 86.7402 − 3.05267ACN − 0.408567 Temperature + 0.0278667ACN2 + 0.0058ACN.Temperature + 0.00176667 Temperature2.
The contour plots (Figure 2) describe the range of the retention times values for both TQ and GB based on the levels of ACN and column temperature applied. The results indicated that the shortest retention times for TQ and GB (1.45 min and 1.79 min, respectively) were recorded in the case of applying the highest ACN concentration (50%) along with the highest column temperature (40 °C), as shown in Table 3.
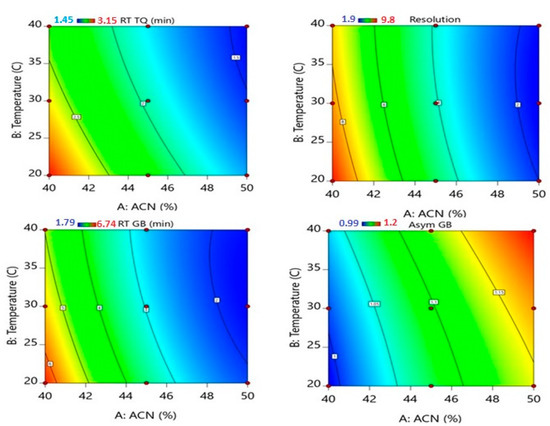
Figure 2.
Contour plot for the effect of the independent factors on TQ and GB analysis.

Table 3.
The analytical responses for simultaneous separation of TQ and GB UPLC.
3.2. Effect of Independent Factors on Peak Area
The statistical data showed that none of the independent analytical parameters (ACN; A, and column temperature; B) exhibited significant actions on the peak area of TQ and GB UPLC chromatograms, as shown in Table 2 and the Pareto standardized chart in Figure 1. However, the quadratic and individual effects of column temperature showed the agonistic but insignificant effect of the TQ chromatogram peak area. The statistical equation of independent parameters effects on TQ peak area is TQ Peak area = 90.3631 − 1.01517 ACN − 0.551417 Temperature + 0.0100667ACN2 + 0.00325 ACN.Temperature + 0.00711667 Temperature2. Moreover, the quadratic effects of ACN and column temperature (A2 and B2) exerted antagonistic but also insignificant effects of the GB chromatogram peak area and the statistical equation of independent parameter effects on GB peak area is GB peak Area = −79.4597 + 4.3385 ACN + 0.660583 Temperature − 0.0476667 ACN2 − 0.00145 ACN.Temperature − 0.00986667 Temperature2.
3.3. Effect of Independent Factors on Peak Symmetry
The impact of independent factors on the peak symmetry of the two APIs is shown in ANOVA Table 2 and the Pareto standardized chart in Figure 1. ANOVA data showed that the independent parameters and their interactive as well as quadratic effects did not exhibit significant action on TQ chromatogram symmetry (p values were higher than 0.05), but ACN concentration showed a slightly insignificant agonistic effect on the drug chromatogram symmetry (p = 0.0895). The statistical equation of independent parameters effects on TQ peak asymmetry is TQ peak Asymmetry = 0.168611 + 0.0338333 ACN + 0.00475 Temperature − 0.000266667ACN2 − 0.00015ACN.Temperature + 0.0000333333 Temperature2.
In contrast, in regard to the GB peak, the individual independent parameters (A and B) showed highly significant agonistic impacts on drug peak symmetry (peak values were 0.0001 and 0.004, respectively). The contour plot in Figure 2 revealed that the high values of peak asymmetry were observed in the case of using high column temperature and high ACN levels, while low peak symmetry values were detected in the case of using the lowest level of independent values. The statistical equation of independent parameters effects on GB peak asymmetry is GB peak Asymmetry = −0.395833 + 0.0505ACN − 0.00275 Temperature − 0.0004.ACN2 + 0.00005 ACN.Temperature +0.00005 Temperature2.
All symmetry values for both TQ and GB peaks were found in the range of 1.08 to 1.2, which are in the acceptable range of peak symmetry, 0.8–1.2 [27].
3.4. Effect of Independent Factors on the Resolution between TQ and GB Peaks
The effects of independent analytical parameters on the resolution between the first TQ peak (around 1.6 min) and the second GB peak (around 2.2 min) are illustrated in ANOVA Table 2 and the Pareto standardized chart in Figure 2. Both individual independent factors (ACN and column temperature showed antagonistic effects on the resolution between the two peaks (p values were <0.0001 and 0.0166, respectively), in addition to the antagonistic quadratic effect of ACN; A2 (p-value = 0.011). The statistical equation of independent parameters effects on the resolution between TQ and GB peaks is Resolution TQ and GB peaks = 116.883 − 4.014 ACN − 0.457 Temperature + 0.0352 ACN2 + 0.006 CAN.Temperature + 0.0024 Temperature2.
The recorded values of peak resolution were found between 1.68 and 9.86, which depends on the analytical independent factors. The lowest resolution (1.68) was observed in the case of applying the highest ACN concentration (50%) along with the highest column temperature (40 °C), while a high peak resolution value was recorded in the case of using the lowest ACN concentration (40%) along with lowest column temperature (20 °C), as shown in the contour plot in Figure 2.
3.5. Optimization of UPLC Conditions for Simultaneous Analysis of TQ and GB
Based on the data of statistical analysis for the impacts of independent analytical parameters (ACN, A, and column temperature; B) on the analytical responses of TQ and GB UPLC chromatograms, the optimized analytical conditions were recommended based on the following desirable criteria: minimum retention time, maximum peak area, in the range peak symmetry (0.8–1.2) and in the range resolution between peaks (2–4). The optimum conditions of the analysis of TQ and GB chromatograms, as well as the predicted and observed analytical values are listed in Table 4 and Figure 3. The obtained values for observed responses were in accordance with the response surface methodology data for the effects of ACN and column temperature on the analytical responses, as mentioned in the statistical analysis of each dependent parameter.

Table 4.
The optimum conditions for the analysis of TQ and GB chromatograms using UPLC comparing the predicted and observed analytical values.
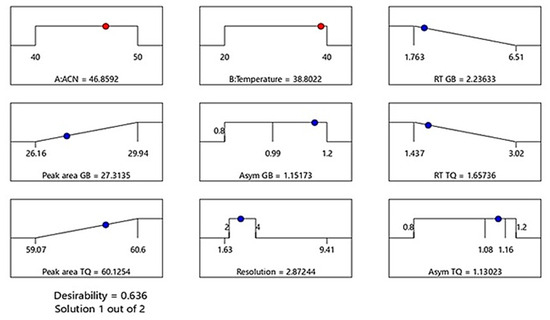
Figure 3.
Suggested optimized conditions with predicted value of TQ and GB peak characterization.
For the optimum analytical responses, the statistical software suggested 46.86% of ACN (A) and 38.80 °C for column temperature (B) (Figure 4). Therefore, the mobile phase of the optimized analytical condition is composed of 46.86% ACN mixed with 53.14% water containing 0.1% formic acid. The results indicated that for the TQ chromatogram, the observed analytical responses were 1.67 ± 0.004 min for retention time, 59.13 ± 0.042 mAU/min for peak area, and 1.13 ± 0.01 for peak symmetry, which are closely near to the predicted values of the measured responses (1.66 min, 60.13 mAU/min and 1.13, respectively). Regarding the GB chromatogram, the detected values for analytical responses were also close to the predicted values, in which 2.33 ± 0.008 min, 26.26 ± 0.0.064 mAU/min, and 1.16 ± 0.006, respectively, were observed for retention time, peak area, and peak symmetry value. Moreover, the observed value for the resolution between TQ and GB chromatograms was 2.92 ± 0.013, which is close to the expected value (2.87). The optimization procedures revealed that analytical conditions based on using high concentrations of ACN along with raised column temperature exhibited short retention times, high peak area values, and in-range asymmetry values for both TQ and GB, in addition to having minimizing effects on the resolution between peaks.
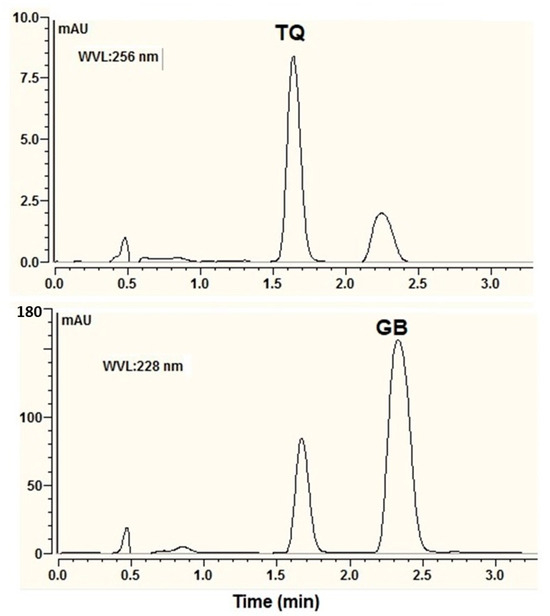
Figure 4.
UPLC chromatograms for TQ and GB eluted with the optimized condition of 46.86% acetonitrile at a column temperature of 38.8 °C.
The obtained chromatogram from the optimized condition is represented in Figure 4. The peaks were sharp with no tailing. TQ was eluted at 1.67 min while GB was eluted at 2.33 min. A peak asymmetry of less than 1.2 is considered acceptable. The calculated and reported peak asymmetry was 1.13 for TQ and 1.16 for GB.
3.6. Validation Method
3.6.1. Linearity
The instrument response to different concentrations of the API was determined by constructing a peak area–drug concentration curve (standard calibration curve). The calibration curve for TQ was linear in the range of 0.5–50 ppm (Figure 5A). Using the regression analysis, the correlation coefficient is equal to 1 and the goodness of fit is described by the following equation: y = 1.1818x − 0.1191. The linearity of data was also determined using the residual plot. The figure shows that the points are scattered randomly around the zero-line, indicating a linear model.
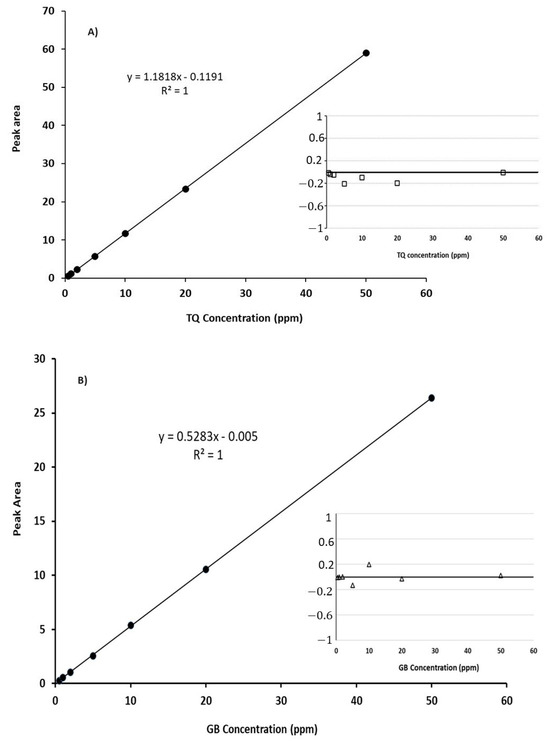
Figure 5.
Calibration curves and residual plots for TQ (A), and GB (B).
For GB, the standard calibration curve was carried out in a range from 0.5 to 50 ppm (Figure 5B). The correlation coefficient (r2) obtained from the regression analysis is equal to one. The slope is equal to 0.5283 (y = 0.5283x − 0.005). The residual plot was also plotted to examine the linearity of the data. The data were located around the zero line randomly, proving the data’s linearity.
3.6.2. Limit of Detection (LOD) and Limit of Quantification (LOQ)
The LOD of the analytical assay was estimated using the slope of the calibration curve. For TQ, the smallest concentration of the analyst that can be detected is equal to 0.1717 ppm, while the quantified limit (LOQ) is equal to 0.052 ppm. The LOD of the developed assay for GB is 0.0627 ppm and the LOQ is 0.1901 ppm.
3.6.3. Accuracy and Precision
The accuracy of the analytical procedure was estimated by calculating the % recovery. The % recovery was calculated for different concentrations: 0.5, 1, 20, and 50 ppm for TQ and GB. The % recovery for TQ was 96.05, 95.86, 98.98, and 99.97% for their relative concentration of 0.5, 1, 20, and 50 ppm. The calculated RSD% was less than 2%, indicating the accuracy of the developed method. For GB, the % recovery ranges from 96.52 to 99.79% with RSD% less than 2% (Table 5).

Table 5.
Percentage recovery of Thymoquinone and Glibenclamide.
The precision of the method was determined using intraday and inter-day precision. Table 6 shows the detailed results of the measured concentration compared with the actual one. The RSD for the measured concentration for both TQ and GB was less than 2%. This small value of the RSD reflects the sensitivity of the developed assay.

Table 6.
Intraday and inter-day precision for the analysis assay of Thymoquinone and Glibenclamide.
3.6.4. Robustness
The ability of the analytical assay to tolerate and resist any tiny change in the process parameters was examined by applying different flow rates and using different UV wavelengths. Table 7 shows the impact of changing the flow rate and the UV wavelength on the peak area and retention time of TQ and GB. For a robust method, and according to the ICH guidelines, the calculated RSD % should be less than 2%. No obvious change was observed in the peak area and retention time analyzed for TQ and GB. The RSD % is less than 2%.

Table 7.
Robustness validation of the developed analytical procedure to analyze Thymoquinone and Glibenclamide, represented as RSD %.
3.7. Characterization of SNEDD Formula Containing TQ and GB
Physicochemical Properties and Drug Content
The physical appearance of dispersed drug-free and drug-loaded SNEDDS formulations was transparent, as shown in Figure 6. Further investigation showed that the dispersed systems were in the nanosize, where it was 46.9 ± 0.27 and 52.3 ± 0.31 nm, respectively. The drug content of TQ and GB in SNEDD formulation was analyzed using the developed UPLC method. The amount of the analytes was 3.62 ± 0.031 and 1.54 ± 0.023 mg/g of SNEDD formulation for TQ and GB, respectively. The chromatogram in Figure 7 shows the applicability of the developed method to analyze and separate the drugs in the SNEDD formulation.
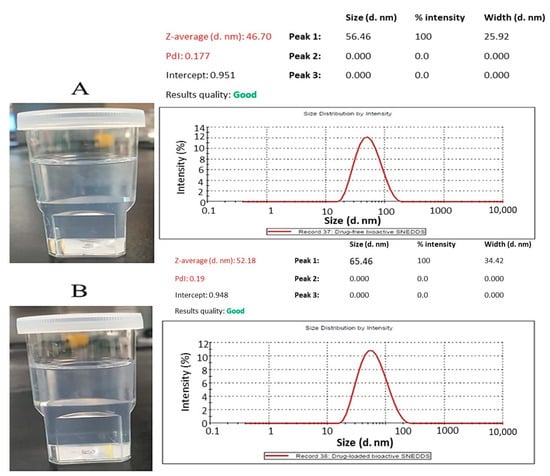
Figure 6.
Physical appearance (left) and particle size distribution (right) of dispersed (A) drug-free and (B) drug-loaded SNEDDS formulation.
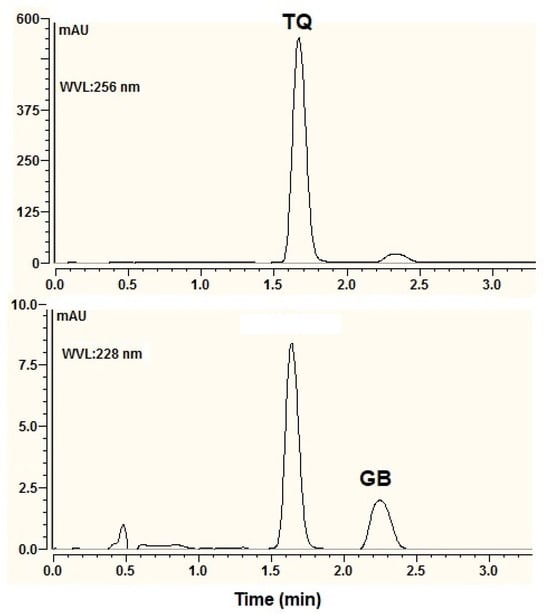
Figure 7.
Representative chromatograms of TQ and GB in SNEDD formulation.
The current study proposed GB and TQ combination as a dual therapy for the treatment of DM (2, 6). SNEDDS formulation was selected as drug delivery to enhance the dissolution of GB along with the incorporation of bioactive oil [18].
4. Discussion
Recently, new formulations composed of two drugs, or more, are available in the market. These formulations have the advantage of decreasing the number of pellets taken by patients, thus improving their compliance. From here, a high demand to develop an analytical procedure to analyze those drugs simply and validly is very important, especially for quality control assessment.
Therefore, this work aimed to develop a simple, sensitive, and valid analytical process for the simultaneous determination of TQ and GB.
The results indicate that increasing the ACN and column temperature shortens the retention time of GB and TQ. This could be attributed to the mobile phase viscosity. Increasing the temperature may decrease the viscosity of the mobile phase. The effect of column temperature on the elution of the analyte in terms of retention time was studied by several researchers. Ibrahim et al. [28] showed that raising the column temperature led to a short retention time for the fusidic acid chromatogram. The viscosity of the mobile phase could be attributed to this short retention time. Increasing the column temperature could decrease the mobile phase viscosity which will reduce the instrument backpressure as a result [29,30].
The symmetry of UPLC is one of the important analytical tools in evaluating noteworthy deviation of the ideal shape of analyte peak shape from the symmetrical peak, which provided relevant acquisition of chromatographic signal data as the retention time and peak areas as well as peak overlapping [31]. The results showed that the peak asymmetry of GB is significantly affected by the ACN concentration as well as the column temperature. GB peak asymmetry improved with increasing the ACN concentration and column temperature. Elevating the column temperature could affect the peak shape as per several studies. It may decrease the peak tailing and enhance the asymmetry [32,33]. In one study, the peak asymmetry for catechol, aniline, and pyridine was improved by increasing the column temperature. Increasing the diffusion and the transfer rate of the analyte between the mobile and stationary phases could be attributed to better peak asymmetry [34]. The composition of the mobile phase also has an impact on the peak asymmetry. It was found that the asymmetry improved with a mobile phase containing ACN rather than methanol. Moreover, Czyrski and Sznura found that the asymmetry improved with increasing ACN concentration [35].
Peak resolution is considered as a crucial factor in chromatographic separation procedures and peak analysis because it estimates the extent of separation of two peaks of different retention times [36,37,38,39]. Higher values of peak resolution designate perfect and precise analyte identification and quantification. In contrast, low values of peak resolution might cause peaks’ co-elution and tailing, which results in poor sensitivity. The resolution of the two peaks was significantly affected by the ACN concentrations. The resolution became worse and peak overlap was observed with a high concentration of ACN. Decreasing the ACN concentrations’ sharp peak with narrow width was observed. The same observation was obtained in the separation of miconazole and mometasone, in which the ACN concentration was affected in an antagonistic way by the resolution [40].
For validation, the developed assay was valid in terms of linearity, accuracy, precision, and robustness as per ICH Q2 R1 guidelines.
It is very important to demonstrate the efficiency of the developed assay. Therefore, it was applied for simultaneous determination of GB that are performed as SNEDDs. The oil component of the SNEDD is flax seed, which is composed of TQ as a constituent. The developed analysis efficiently separates TQ and GB in SNEDD formulation, as seen in Figure 7.
5. Conclusions
The current work proposes a rapid, accurate, precise, and robust UPLC method for simultaneous analysis of TQ and GB in SNEDD formulation. The use of the experimental design assists in the development of an applicable method used to separate two analytes simultaneously. The optimized analytical method was valid in terms of accuracy and precision as per ICH Q2 R with RSD less than 2%. Good peak asymmetry and peak resolution values indicate a good separation of the compounds. The developed method showed high sensitivity and applicability in determining the drug content of TQ and GB in SNEDD formulation.
Author Contributions
M.A.I.: conceptualization, methodology, resource, software, analysis, data curation, writing the first draft, reviewing and editing; A.Y.S.: methodology, analysis, data curation, writing the first draft; D.H.A.: data curation, writing the first draft, reviewing and editing. All authors have read and agreed to the published version of the manuscript.
Funding
This research was funded by Deputyship for Research & Innovation, Ministry of Education in Saudi Arabia for funding this research. (IFKSURC-1-0825).
Data Availability Statement
Data is contained within the article.
Acknowledgments
The authors extend their appreciation to the Deputyship for Research & Innovation, Ministry of Education in Saudi Arabia for funding this research. (IFKSURC-1-0825).
Conflicts of Interest
The authors declare no conflict of interest.
References
- Adibkia, K.; Ghajar, S.; Osouli-Bostanabad, K.; Balaei, N.; Emami, S.; Barzegar-Jalali, M. Novel gliclazide electrosprayed nano-solid dispersions: Physicochemical characterization and dissolution evaluation. Adv. Pharm. Bull. 2019, 9, 231. [Google Scholar] [CrossRef] [PubMed]
- Albertini, B.; Sabatino, M.D.; Melegari, C.; Passerini, N. Formulation of spray congealed microparticles with self-emulsifying ability for enhanced glibenclamide dissolution performance. J. Microencap. 2015, 32, 181–192. [Google Scholar] [CrossRef] [PubMed]
- Tran, N.; Pham, B.; Le, L. Bioactive compounds in anti-diabetic plants: From herbal medicine to modern drug discovery. Biology 2020, 9, 252. [Google Scholar] [CrossRef]
- Sun, J.; Ren, J.; Hu, X.; Hou, Y.; Yang, Y. Therapeutic effects of Chinese herbal medicines and their extracts on diabetes. Biomed. Pharmacother. 2021, 142, 111977. [Google Scholar] [CrossRef] [PubMed]
- Tarasevičienė, Ž.; Laukagalis, V.; Paulauskienė, A.; Baltušnikienė, A.; Meškinytė, E. Quality Changes of Cold-Pressed Black Cumin (Nigella sativa L.), Safflower (Carthamus tinctorius L.), and Milk Thistle (Silybum marianum L.) Seed Oils during Storage. Plants 2023, 12, 1351. [Google Scholar] [CrossRef] [PubMed]
- Mahomoodally, M.F.; Aumeeruddy, M.Z.; Legoabe, L.J.; Montesano, D.; Zengin, G. Nigella sativa L. and its active compound thymoquinone in the clinical management of diabetes: A systematic review. Int. J. Mol. Sci 2022, 23, 12111. [Google Scholar] [CrossRef]
- Atta, M.S.; El-Far, A.H.; Farrag, F.A.; Abdel-Daim, M.M.; Al Jaouni, S.K.; Mousa, S.A. Thymoquinone attenuates cardiomyopathy in streptozotocin-treated diabetic rats. Oxidative Med. Cell. Longev. 2018, 2018, 7845681. [Google Scholar] [CrossRef]
- Aldukhayel, A. Prevalence of diabetic nephropathy among Type 2 diabetic patients in some of the Arab countries. Int. J. Health Sci. 2017, 11, 1. [Google Scholar]
- Pari, L.; Sankaranarayanan, C. Beneficial effects of thymoquinone on hepatic key enzymes in streptozotocin–nicotinamide induced diabetic rats. Life Sci. 2009, 85, 830–834. [Google Scholar] [CrossRef] [PubMed]
- Atta, M.S.; Almadaly, E.A.; El-Far, A.H.; Saleh, R.M.; Assar, D.H.; Al Jaouni, S.K.; Mousa, S.A. Thymoquinone defeats diabetes-induced testicular damage in rats targeting antioxidant, inflammatory and aromatase expression. Int. J. Mol. Sci 2017, 18, 919. [Google Scholar] [CrossRef]
- Faisal, L.M.; Abdel-Moneim, A.-M.H.; Alsharidah, A.S.; Mobark, M.A.; Abdellatif, A.A.; Saleem, I.Y.; Al Rugaie, O.; Mohany, K.M.; Alsharidah, M. Thymoquinone lowers blood glucose and reduces oxidative stress in a rat model of diabetes. Molecules 2021, 26, 2348. [Google Scholar] [CrossRef] [PubMed]
- Abdelrazek, H.; Kilany, O.E.; Muhammad, M.A.; Tag, H.M.; Abdelazim, A.M. Black seed thymoquinone improved insulin secretion, hepatic glycogen storage, and oxidative stress in streptozotocin-induced diabetic male Wistar rats. Oxidative Med. Cell. Longev. 2018, 2018, 8104165. [Google Scholar] [CrossRef] [PubMed]
- Kaatabi, H.; Bamosa, A.O.; Badar, A.; Al-Elq, A.; Abou-Hozaifa, B.; Lebda, F.; Al-Khadra, A.; Al-Almaie, S. Nigella sativa improves glycemic control and ameliorates oxidative stress in patients with type 2 diabe-tes mellitus: Placebo controlled participant blinded clinical trial. PLoS ONE 2015, 10, e0113486. [Google Scholar] [CrossRef] [PubMed]
- Maideen, N.M. Antidiabetic Activity of Nigella Sativa (Black Seeds) and Its Active Constit-uent (Thymoquinone): A Review of Human and Experimental Animal Studies. Chonnam Med. J. 2021, 57, 169–175. [Google Scholar] [CrossRef] [PubMed]
- Heshmati, J.; Namazi, N.; Memarzadeh, M.R.; Taghizadeh, M.; Kolahdooz, F. Nigella sativa oil affects glucose metabolism and lipid concentrations in patients with type 2 diabetes: A randomized, double-blind, placebo-controlled trial. Food Res. Int. 2015, 70, 87–93. [Google Scholar] [CrossRef]
- Haq, N.; Alanazi, F.K.; Alsarra, I.A.; Shakeel, F. Rapid Analysis of Glibenclamide Using an En-vironmentally Benign Stability-Indicating RP-HPLC Method. Iran. J. Pharm. Res. 2014, 13, 863–872. [Google Scholar]
- Ibrahim, M.A.; Alshora, D.H.; Alowayid, M.A.; Alanazi, N.A.; Almutari, R.A. Development and Validation of a Green UPLC Analytical Procedure for Glibenclamide Determination in Pharmaceutical Product Using Response Surface Methodology. Orient. J. Chem. 2022, 38, 865–874. [Google Scholar] [CrossRef]
- Iqbal, M.; Alam, P.; Answer, T. High performance liquid chromatographic method with fluo-rescence detection for the estimation of Thymoquinone in Nigella sativa extracts and mar-keted formulations. Open Access Sci. Rep. 2013, 2, 655–660. [Google Scholar] [CrossRef]
- Ahmad, N.; Ahmed, R.; Amir, M.; Mostafa, A. Ultra-high-performance liquid chromatography-based identification and quantification of thymoquinone in Nigella sa-tiva extract from different geographical regions. Pharmacogn. Mag. 2018, 14, S471–S480. [Google Scholar] [CrossRef]
- Ahmad, A.; Khan, R.M.A.; Alkharfy, K.M. Development and validation of RP-HPLC method for simultaneous estimation of glibenclamide and thymoquinone in rat plasma and its application to pharmacokinetics. Acta Chromatogr. 2015, 27, 435–448. [Google Scholar] [CrossRef]
- Ahmed, N.; Abo-zeid, Y.; Sakran, W. Strategies adopted to improve bioavailability of Glibenclamide: Insights on novel delivery systems. J. Adv. Pharm. Res. 2023, 7, 35–49. [Google Scholar] [CrossRef]
- Bhalani, D.V.; Nutan, B.; Kumar, A.; Singh, A.K. Bioavailability enhancement techniques for poorly aqueous soluble drugs and therapeutics. Biomedicines 2022, 10, 2055. [Google Scholar] [CrossRef] [PubMed]
- Kazi, M.; Shahba, A.A.; Alrashoud, S.; Alwadei, M.; Sherif, A.Y.; Alanazi, F.K. Bioactive self-nanoemulsifying drug delivery systems (Bio-SNEDDS) for combined oral delivery of curcumin and piperine. Molecules 2020, 25, 1703. [Google Scholar] [CrossRef] [PubMed]
- Shahba, A.A.; Sherif, A.Y.; Elzayat, E.M.; Kazi, M. Combined Ramipril and Black Seed Oil Dosage Forms Using Bioactive Self-Nanoemulsifying Drug Delivery Systems (BIO-SNEDDSs). Pharmaceuticals 2022, 15, 1120. [Google Scholar] [CrossRef]
- International Federation of Pharmaceutical Manufactures & Associations I. Validation of analytical procedures: Text and methodology, Methodology Q2 (R1). In Proceedings of the International Conference on Harmonization (ICH ’96), Geneva, Switzerland, 6 November 1996. [Google Scholar]
- Shamim, A.; Ansari, M.J.; Aodah, A.; Iqbal, M.; Aqil, M.; Mirza, M.A.; Iqbal, Z.; Ali, A. QbD-Engineered Development and Validation of a RP-HPLC Method for Simultaneous Estimation of Rutin and Ciprofloxacin HCl in Bilosoma Nanoformulation. ACS Omega 2023, 8, 21618–21627. [Google Scholar] [CrossRef] [PubMed]
- Fouad, M.M. RP-UPLC method development and validation for simultaneous estimation of vildagliptin with metformin hydrochloride and ciprofloxacin hydrochloride with dexamethasone sodium phosphate. World J. Pharm. Sci. 2015, 3, 1755–1762. [Google Scholar]
- Ibrahim, M.A.; Alhabib, N.A.; Alshora, D.; Bekhit, M.M.S.; Taha, E.; Mahdi, W.A.; Harthi, A.M. Application of Quality by Design Approach in the Optimization and Development of the UPLC Analytical Method for Determination of Fusidic Acid in Pharmaceutical Products. Separations 2023, 10, 318. [Google Scholar] [CrossRef]
- Li, J.B.; Waters Corporation; Milford, M.A. Effect of Temperature on Column Pressure, Peak Retention Time and Peak Shape. Available online: chrome-extension://efaidnbmnnnibpcajpcglclefindmkaj/https://www.waters.com/webassets/cms/library/docs/watersamd30.pdf (accessed on 22 June 2022).
- Waterlot, C.; Goulas, A. Temperature Effects on Retention and Separation of PAHs in Reversed-Phase Liquid Chromatography Using Columns Packed with Fully Porous and Core-Shell Particles. J. Chem. 2016, 2016, 7294105. [Google Scholar] [CrossRef]
- Pápai, Z.; Pap, T.L. Analysis of peak asymmetry in chromatography. J. Chromatogr. A 2002, 953, 31–38. [Google Scholar] [CrossRef]
- Gotmar, G.; Fornstedt, T.; Guiochon, G. Peak Tailing and Mass Transfer Kinetics in Linear Chromatography—Dependence on the Column Length and the Linear Velocity of the Mobile Phase. J. Chromatogr. 1999, A831, 17–35. [Google Scholar] [CrossRef]
- Spearman, L.; Smith, R.M.; Dube, S. Monitoring effective column temperature by using shape selectivity and hydrophobicity and the effects of mobile phase temperature. J. Chromatogr. A 2004, 1060, 147–151. [Google Scholar] [CrossRef] [PubMed]
- Li, J.; Hu, Y.; Carr, P.W. Fast Separations at Elevated Temperatures on Polybutadiene-Coated Zirconia Reversed-Phase Material. Anal. Chem. 1997, 69, 3884–3888. [Google Scholar] [CrossRef] [PubMed]
- Czyrski, A.; Sznura, J. The application of Box-Behnken-Design in the optimization of HPLC separation of fluoroquinolones. Sci Rep. 2019, 9, 19458. [Google Scholar] [CrossRef] [PubMed]
- ’Peak resolution’ in IUPAC Compendium of Chemical Terminology, 3rd ed. International Union of Pure and Applied Chemistry; 2006. Online version 3.0.1. 2019. Available online: https://goldbook.iupac.org/terms/view/P04465 (accessed on 22 June 2022). [CrossRef]
- resolution’ in IUPAC Compendium of Chemical Terminology, 3rd ed. International Union of Pure and Applied Chemistry; 2006. Online version 3.0.1. 2019. Available online: https://goldbook.iupac.org/terms/view/R05317 (accessed on 22 June 2022). [CrossRef]
- Maryutina, T.A.; Savonina, E.Y.; Fedotov, P.S.; Smith, R.M.; Siren, H.; Hibbert, D.B. Terminology of separation methods (IUPAC Recommendations 2017. Pure Appl. Chem. 2018, 90, 181–231. [Google Scholar] [CrossRef]
- Ettre, L.S. Nomenclature for chromatography (IUPAC Recommendations 1993. Pure Appl. Chem. 1993, 65, 819–872. [Google Scholar] [CrossRef]
- El-Bagary, R.I.; Elkady, E.F.; Tammam, M.H.; Abo-Elmaaty, A. Simultaneous determination of miconazole and hydrocortisone or mometasone using reversed phase liquid chromatography. Eur. J. Chem. 2012, 3, 421–425. [Google Scholar] [CrossRef]
Disclaimer/Publisher’s Note: The statements, opinions and data contained in all publications are solely those of the individual author(s) and contributor(s) and not of MDPI and/or the editor(s). MDPI and/or the editor(s) disclaim responsibility for any injury to people or property resulting from any ideas, methods, instructions or products referred to in the content. |
© 2023 by the authors. Licensee MDPI, Basel, Switzerland. This article is an open access article distributed under the terms and conditions of the Creative Commons Attribution (CC BY) license (https://creativecommons.org/licenses/by/4.0/).