Article

Evaluation of Empirical Separation Efficiency Theories for Uniflow Cyclones for Different Particle Types and Experimental Verification

1
German Research and Development Center, LSTME Busan, 1276 Jisa-Dong, Gangseo-gu, Busan 46742, Republic of Korea
2
Institute of Fluid Mechanics (LSTM), Faculty of Engineering, Friedrich-Alexander-University Erlangen-Nuremberg (FAU), Cauerstraße 4, 91058 Erlangen, Germany
*
Author to whom correspondence should be addressed.
Separations 2023, 10(10), 522; https://doi.org/10.3390/separations10100522
Submission received: 31 August 2023 / Revised: 20 September 2023 / Accepted: 22 September 2023 / Published: 25 September 2023
(This article belongs to the Section Purification Technology)

Abstract

:
Cyclones serve as essential devices in various industries for the removal of particulate matter from gases and liquids, contributing to improved equipment efficiency and longevity by mitigating the wear and damage caused by dust and small particles. Uniflow cyclones offer improved accessibility due to their predominantly horizontal orientation. This characteristic enhances the ease of maintenance and operation. This study focuses on investigating the collection efficiency of uniflow centrifugal cyclones for oil mist and fine dust particles ranging from 0.5 µ m to 29 µ m in diameter. The investigation is based on the specific vane angles β v of a swirl inducer from 0 to 60 at a flow rate V ˙ of 130 L s 1 . The measured collection efficiencies are compared with theoretical efficiencies calculated using six different empirical approaches. The different results for oil and fine dust particles are discussed. Comparison of the experimental results with the empirical models demonstrated that certain models closely matched the observed separation efficiencies for different aerosols and vane angles β v (respectively, their induced radial velocities V). Through a systematic examination, this research aims to provide more insight into the validity of empirical approaches for different particle types and compositions using a uniflow-cyclonic system.

1. Introduction

Many emerging economies and developed nations are grappling with the issue of fine dust pollution. In South Korea, the winter and spring seasons are marked by excessively high levels of fine and ultra-fine dust [1]. Dust separators play a crucial role in mitigating the environmental impact of industrial activities by preventing the release of dust and other particles into the atmosphere [2,3].
The primary origins of fine and ultra-fine dust within the ambient air are linked to combustion byproducts from fossil fuels [4] and the effects of road traffic, including tire and brake wear and road dust suspension, particularly in dry weather conditions [5]. Natural sources, such as dust storms, also contribute significantly to elevated concentrations of fine dust. To curtail environmental and indoor contamination from fine dust, it is essential to capture and collect these particles before their release into the ambient air. This necessitates the purification of enclosed indoor air to remove dust particles.
Scientific classification of dust is based on particle size. Particles with diameters between 2.5   µ m and 10 µ m are categorized as coarse particulate matter [6]. Fine particulate matter, on the other hand, has a diameter smaller than 2.5   µ m , presenting substantial health risks. The size classification extends to ultra-fine dust, which encompasses particles smaller than 0.1   µ m . Fine and ultra-fine dust are implicated in various health issues, including lung cancer, bronchial asthma, cardiovascular diseases, cerebrovascular diseases, pulmonary mortality, arteriosclerosis, coronary heart disease, and premature death [5,7].
Centrifugal separators, often referred to as cyclones, are instrumental in collecting fine and ultra-fine dust. These separators fall into two main categories: reverse-flow cyclones, which have been extensively researched in the latter half of the previous century, and uniflow cyclones. Pioneering research in cyclone technology was conducted by Lapple and Stairmand in the 1950s [3], laying the groundwork for subsequent studies. Notably, Dirgo [8] and Iozia [9] utilized a Laskin-nozzle setup to generate aerosol particles from mineral oil vapor, resulting in spherical aerosol particles that exhibited ideal characteristics for cyclone efficiency.
While the research from Lapple, Dirgo, Iozia, and many others laid the foundation for cyclone research in general, in the present work, various unique cyclone types are tested under a wide range of different conditions in order to improve the separation efficiency η and the particle cut diameter d p c further. New approaches, such as dual cyclone systems in series, ultra-low flow rate cyclones, tangential inlet angle modification of reverse-flow cyclones, and novel cyclone integration concepts (airplane duct or heating chamber integration), give hope that cyclone technology can be further improved [10]. While, worldwide, every year new patents are protecting advanced inventions concerning cyclone improvements, China and the USA are leading in cyclone research with more than 70% of the total patents [10].
Though oil droplets present advantages in terms of particle cut diameter and cyclone efficiency, they also possess drawbacks, such as clogging sensors and covering optical measurement devices. The solid nature of fine and ultra-fine dust particles, each with unique chemical compositions, allows for easy cleaning with water or ethanol during experimental setups [5].
Efficiency in cyclone systems is closely linked to parameters such as pressure drop and particle cut diameter [11]. The particle cut diameter, representing the size at which 50% of particles are separated while 50% exit the system, serves as a metric for system efficiency. In this study, the separation efficiency η in relation to the particle diameter d p c is examined for two different particle types. First, fine dust particles with a density of ρ p = 2650 k g m 3 are separated using the proposed uniflow cyclone system.
Second, olive oil particles with a particle density of ρ p = 916 k g m 3 are generated using a Laskin-nozzle setup. Since a swirl inducer represents a direct method for bringing a fluid into rotation within a uniflow cyclone, the influence of the vane angle beta β v of the swirl inducers is examined using two different particle types to charge the aerosol. For both aerosol types, the respective separation efficiencies η are measured and compared with the most common empirical separation efficiency models. Finally, the different results are discussed, and conclusions are proposed that satisfy the nature of each aerosol type. With the results of this research, a contribution to a better understanding of the relationship between the particle type, separation efficiency η , and correlation with the empirical approaches has been made.

2. Empirical Cyclone Efficiency Models

Since the first patents were filed for a cyclonic separator in 1939 by Edward W. Samson and Alfred H. Croup [12], who were working at the Hammermill Paper Company, a paper manufacturer in Erie, Pennsylvania, several researchers have made significant efforts to describe the theory of cyclonic separation. Among them was Stairmand (1951), who developed and researched the first high-efficiency cyclone. Lapple [3] (1950) suggested one of the first cyclone theories, while Barth [13] (1956), Leith and Licht [14] (1972), Dietz [15] (1981), Li and Wang [16] (1989), and Iozia and Leith [9] (1990) followed later. Most researchers approximate the separation efficiency curve of cyclones using empirical models based on the geometric parameters of the cyclone (Figure 1) and the physical properties of the particles and the gas carrying them. Over the years, the number of parameters included in the separation efficiency approach increased further.

2.1. Timed Flight Model

Lapple was one of the first to approach the calculation of the efficiency of a cyclone separator. With the timed flight model, Lapple was able to assume the residence time of the particle inside the cyclone by the number of revolutions N e . The model developed by Lapple uses the assumption that the particles are evenly distributed inside the cyclone while entering at a radial distance from the cyclone axis [3]; however, within this early empirical model, several parameters were not considered, such as the cyclone diameter d c .
N e = 1 a h + l c h 2
d p c = 9 μ b 2 π N e v i n ρ p ρ f
η i = 1 1 + d p c / d p i ¯ .
Even though Lapple’s model seems to be a good approximation, in several experiments [17], it is not exact as it overestimates the collection efficiency for particles with a diameter d p smaller than the cut-off particle size d p c and overestimates the collection efficiency for particles with a diameter larger than the cut-off particle size d p c .

2.2. Static Particle Model

The static particle approach was carried out by Barth, which describes the critical particle diameter d p c as a result of balanced drag and centrifugal forces [13]. In the case of a dominating drag force F d over the centrifugal force F c on a particle, the latter is carried out of the cyclone by the fluid. Once the drag force F d is smaller than the centrifugal force, particles are separated from the fluid stream and collected in the cyclone system. With α as a geometrical parameter, Barth introduced the tangential gas velocity W at the wall of the cyclone, the terminal settling velocity for static particle W s * , and the terminal settling velocity for the non-static particle as
W = v i n d o u t 2 d b π 2 a b α + l c S d b λ π
W t s * = V ˙ g 2 π ( l c S ) W
W t s = π l c S W 2 ρ p d p 2 W t s * 9 μ V ˙
η = 1 1 + W t s / W t s * 3.2 .
Compared to Lapple [3], Barth uses the ratio of the settling velocities to determine the fractional efficiencies of a reverse-flow cyclone.

2.3. Fractional Efficiency Model

Unlike earlier developed models, Leith and Licht’s fractional efficiency model considers the turbulence inside the cyclone [14]. The model assumes that the uncollected dust inside the tangential cyclone carried by the fluid flow is uniformly mixed before separation. With the cyclone vortex exponent n, which was introduced in 1949 by Alexander, Leith is establishing the inertial parameter ψ as
ψ = ρ p d p 2 v i n n + 1 18 μ d .
Additionally, a dimensionless geometry parameter C and the natural length of the cyclone l n are introduced as [8]
l n = 2.3 · d o u t d 2 a b 1 / 3
η = 1 exp 2 C ψ 1 2 n + n .

2.4. Three Regions Model

Based on Leith’s approach, Dietz further refined the model, considering the three different regions of a reverse-flow cyclone: the entrance, downflow, and core area. Further, a radial concentration profile for uncollected particles is assumed in each region [15]. Dietz introduces subscripted terms, denoted as K, for each region of the cyclone, which are functions of the fluid and particle properties as well as of the cyclone dimensions.
K 0 / 1 = 1 2 1 ± d o u t d 2 n 1 + 9 μ a b π ρ p d p 2 l n v i n
K 2 = d o u t d 2 n ,
approximating a fractional efficiency of a general reverse-flow cyclone with
η = 1 K 0 K 1 2 + K 2 exp π 2 S a ρ p d p 2 v i n 18 μ a b .
Dietz’s theory allows the exchange of particles between the three introduced regions within the cyclone [15].

2.5. Turbulent Diffusion-Model

Li and Wang considered a bouncing effect of the particle and turbulent diffusion at the cyclone wall [16]. Further, a radial particle velocity profile and a radial concentration profile are assumed. Additionally, the tangential velocity depends on the radial position as follows
W r n = 1 n V ˙ b d 2 1 n d o u t 2 1 n r n = c o n s t a n t .
Moreover, a turbulent diffusion coefficient is proposed as follows
D r = 0.052 d d o u t 2 W λ 8 with λ = 0.02 .
A characteristic value λ is introduced with
λ = 1 α K V w a l l D r d 2 n .
Finally, the efficiency of a reverse-flow cyclone is calculated by
η = 1 exp λ 2 π S + l n a .

2.6. Flow Resistance and Centrifugal Force Balance Model

Iozia and Leith modified Barth’s theory (cp. Equation (7)), redefining the cut-off particle diameter d p c from Lapple and suggesting a slope parameter β with
W m a x = 6.1 v i n a b d 2 0.61 d o u t d 0.74 l c d 0.33
d p c = 9 μ V ˙ π ρ p K W m a x 2
β = 0.62 0.87 ln 100 d p c + 5.21 ln a b d 2 + 1.05 ln a b d 2 2
η i = 1 1 + d p c d p i β .
The separation efficiency approach has been significantly improved from 1950 to the present and closely resembles practically achieved data in most cases. However, the empirical formulas do not explain the mechanisms behind the cyclonic separation, which one would expect depending on dynamic measurement data such as velocities, pressures, particle sizes, and temperature. However, experimental data that resembles within the range of the introduced theoretical approximations, can be considered valid in most cases Figure 2.

3. Materials and Methods

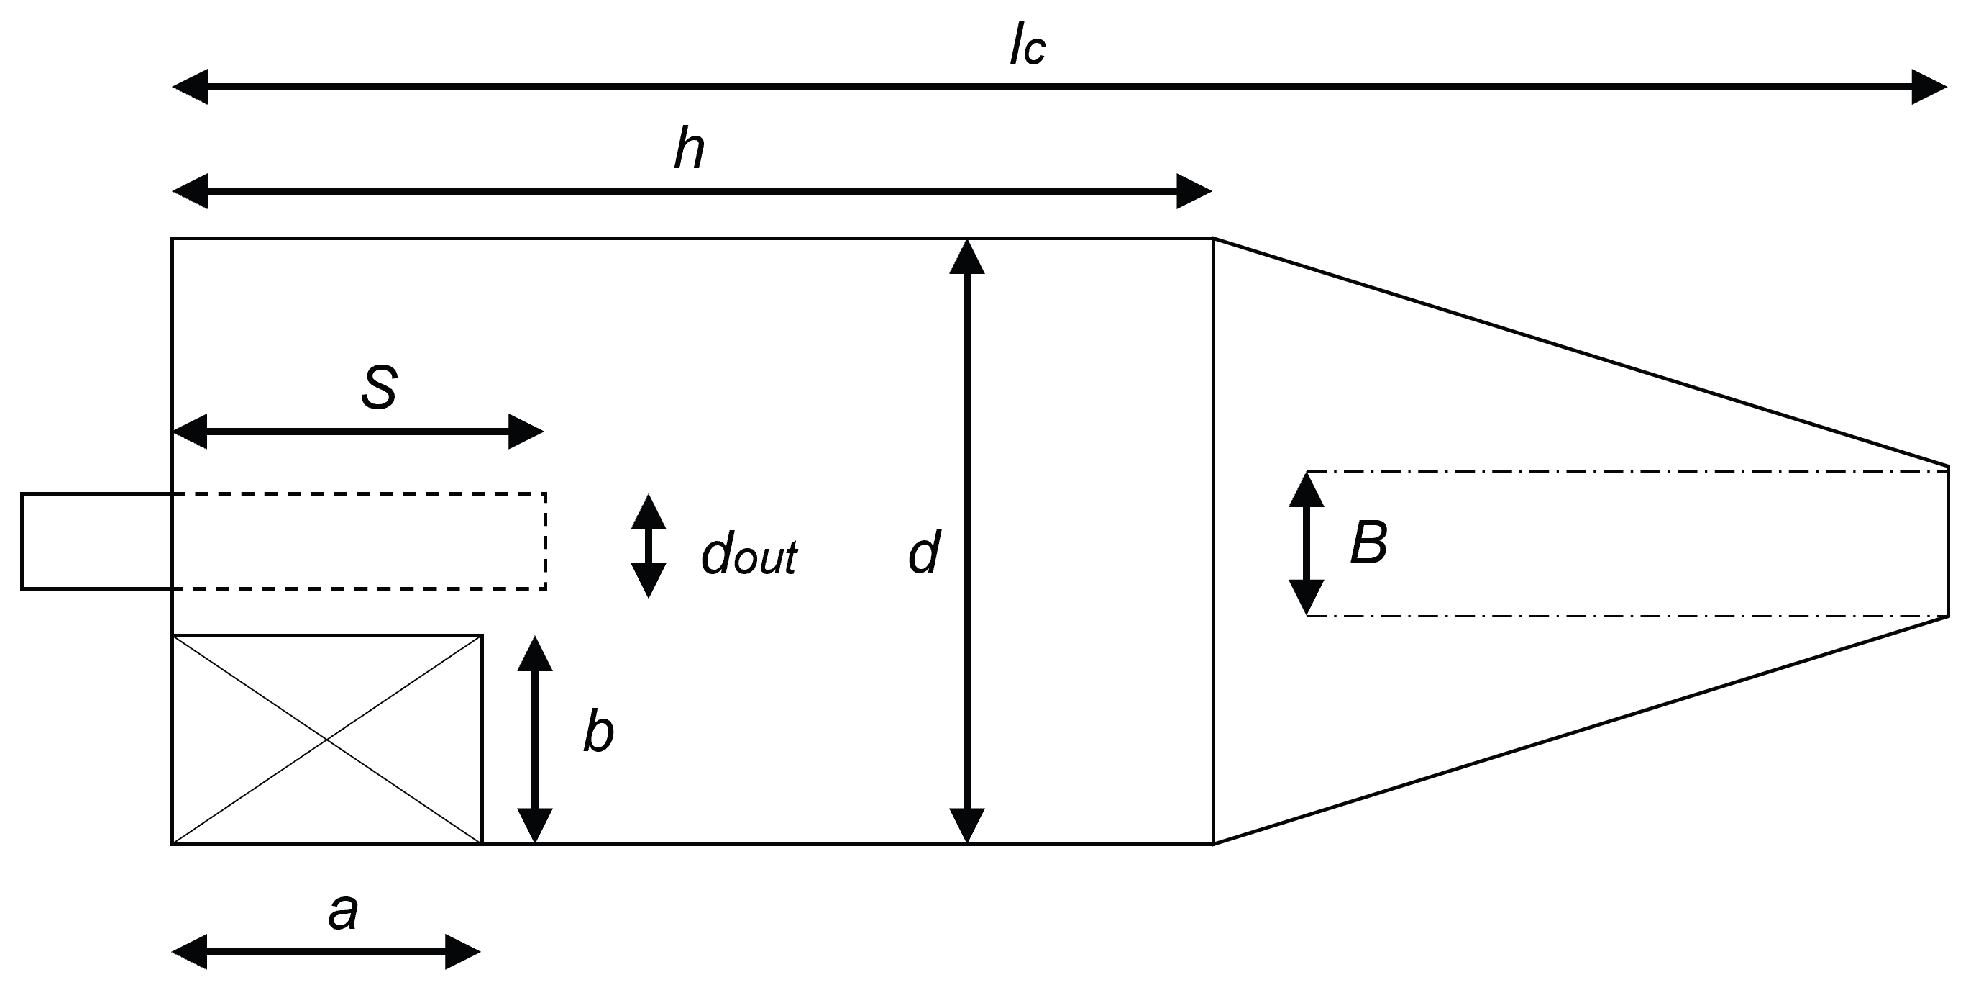
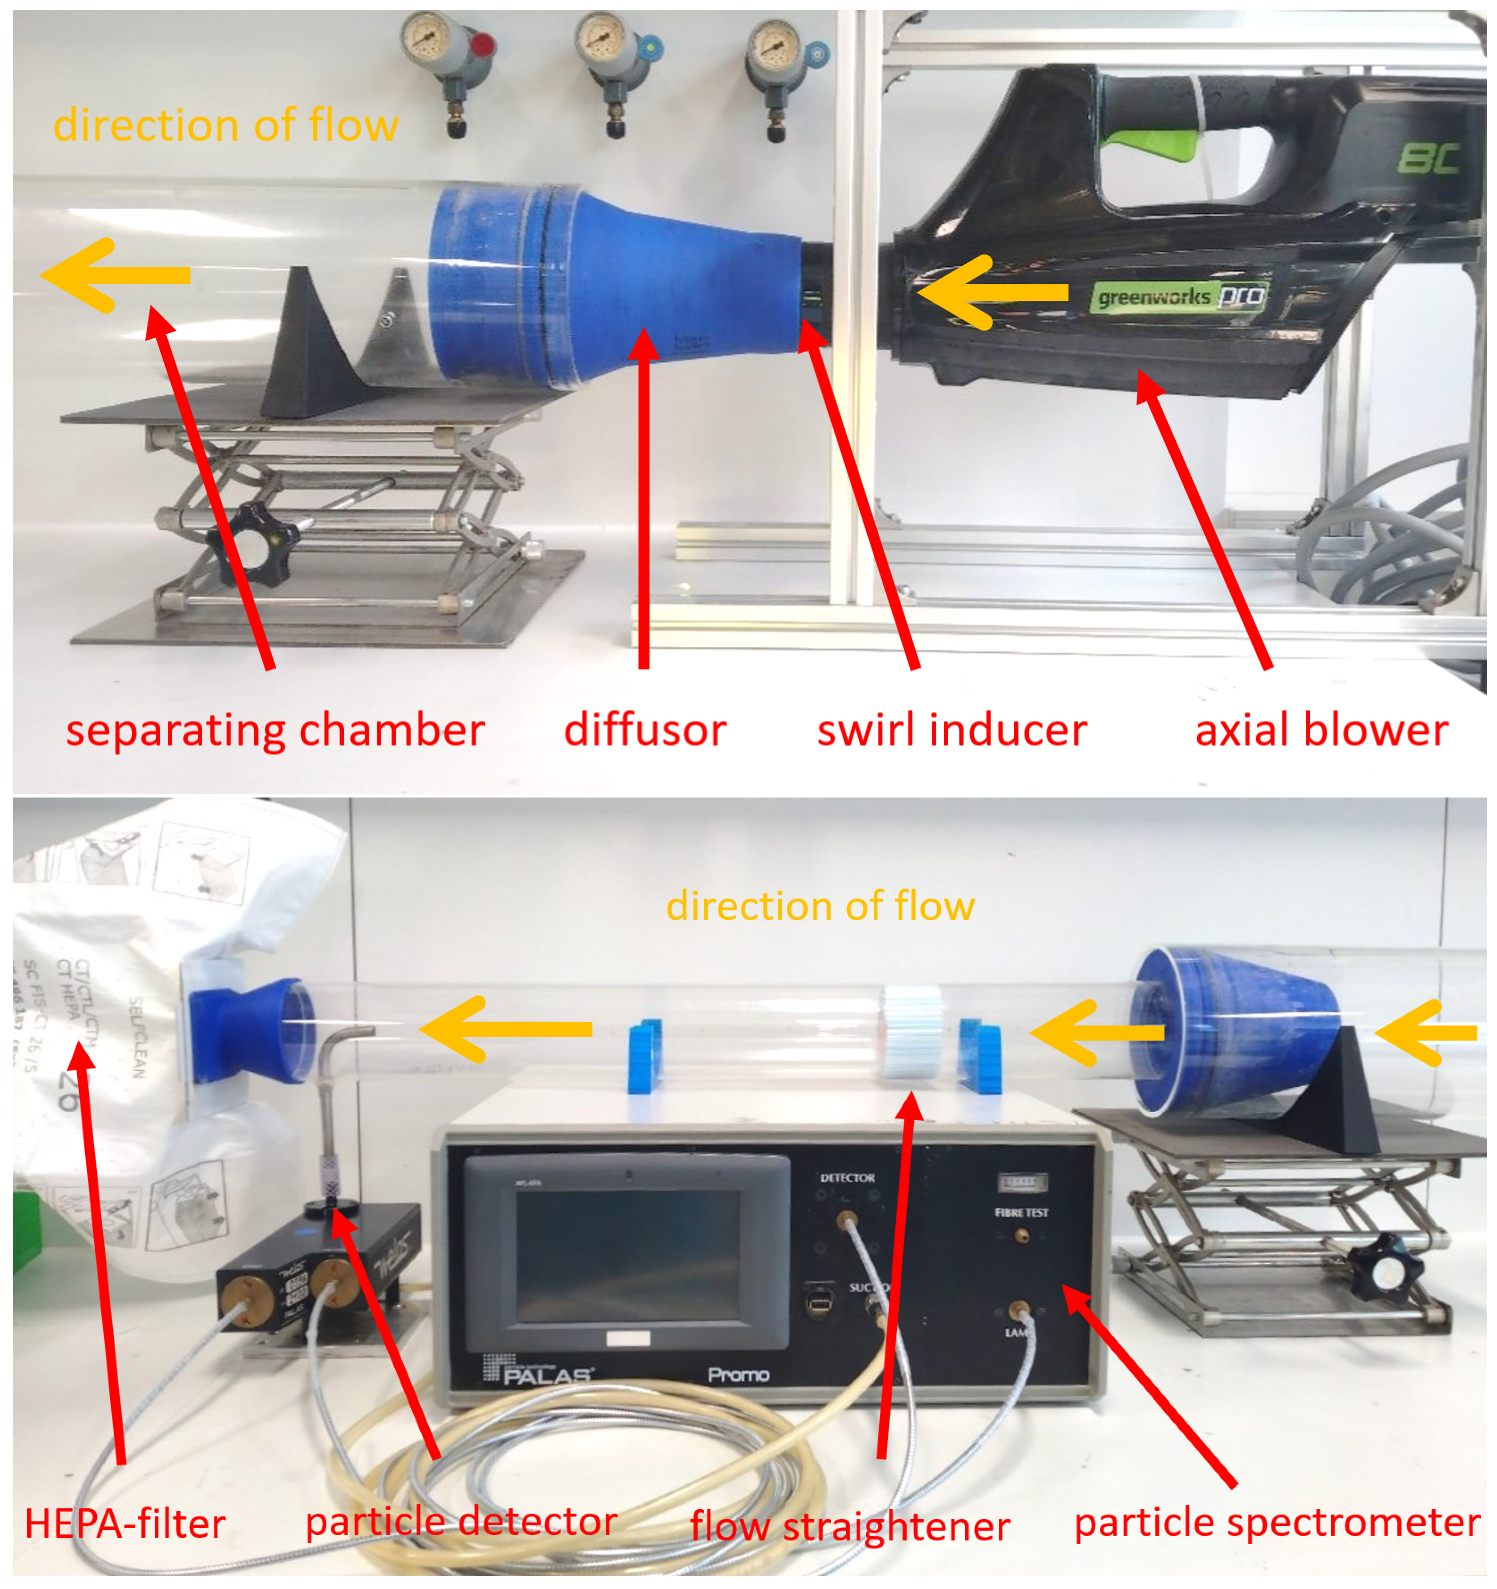
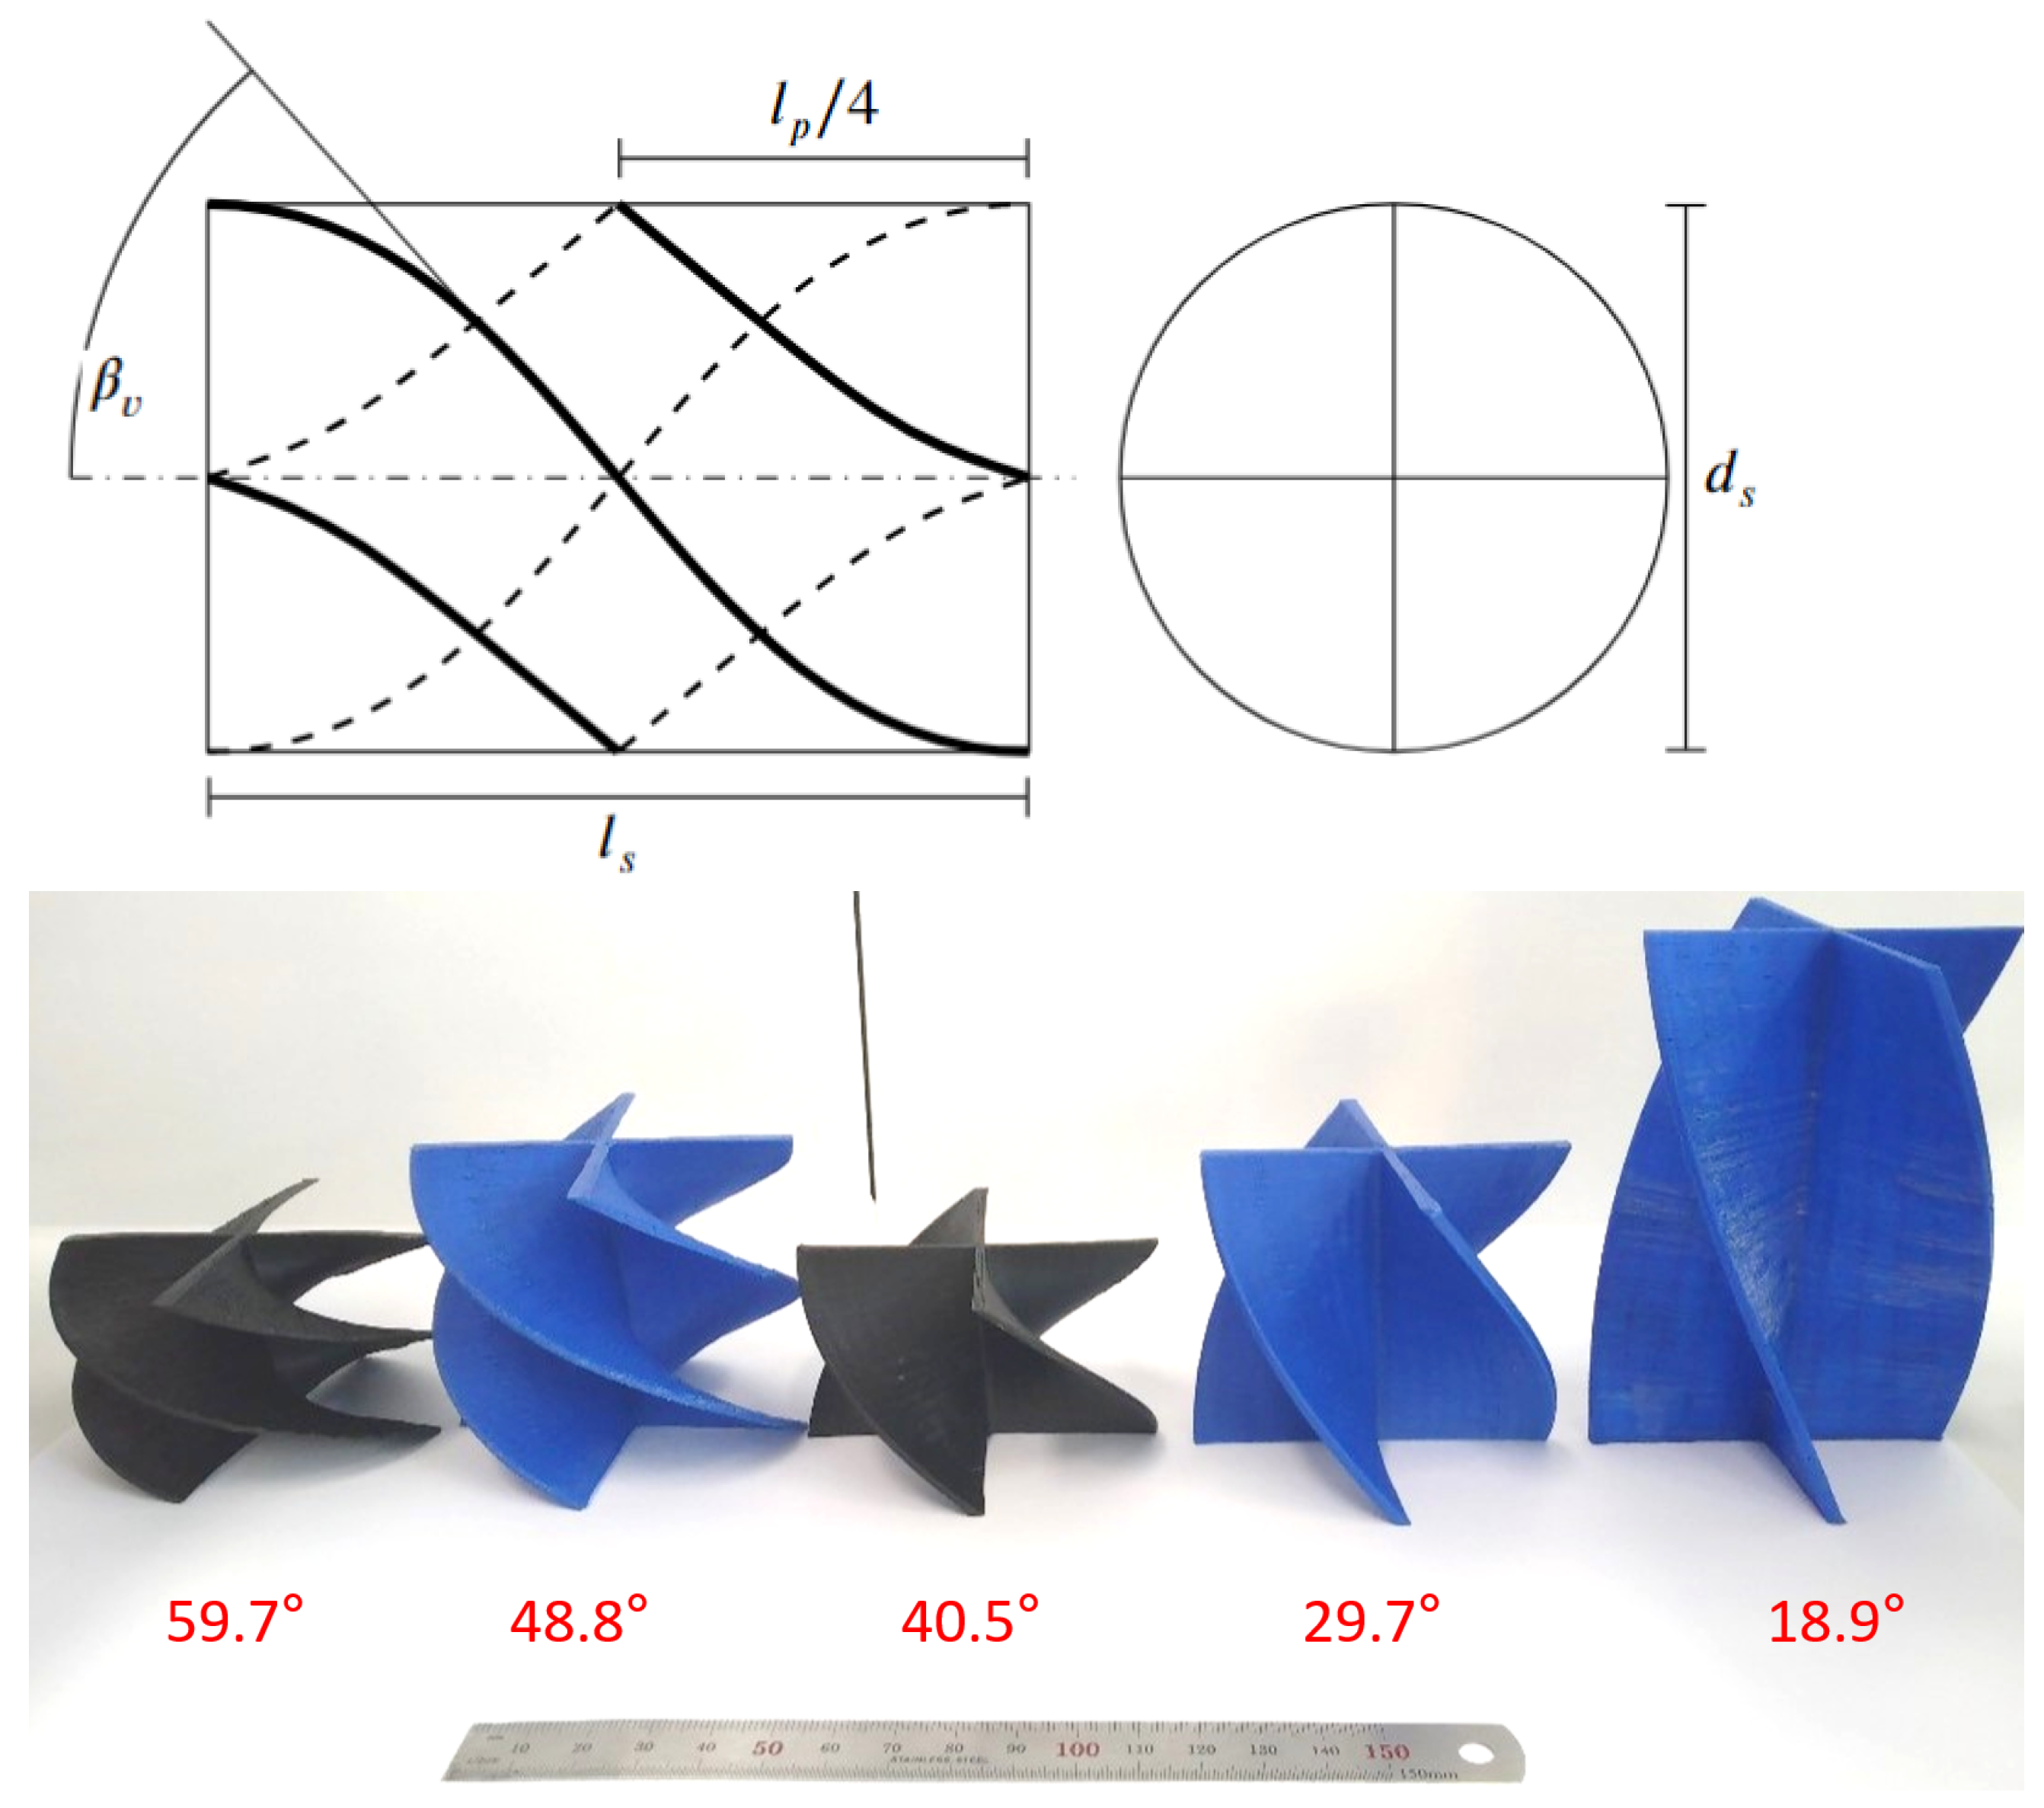
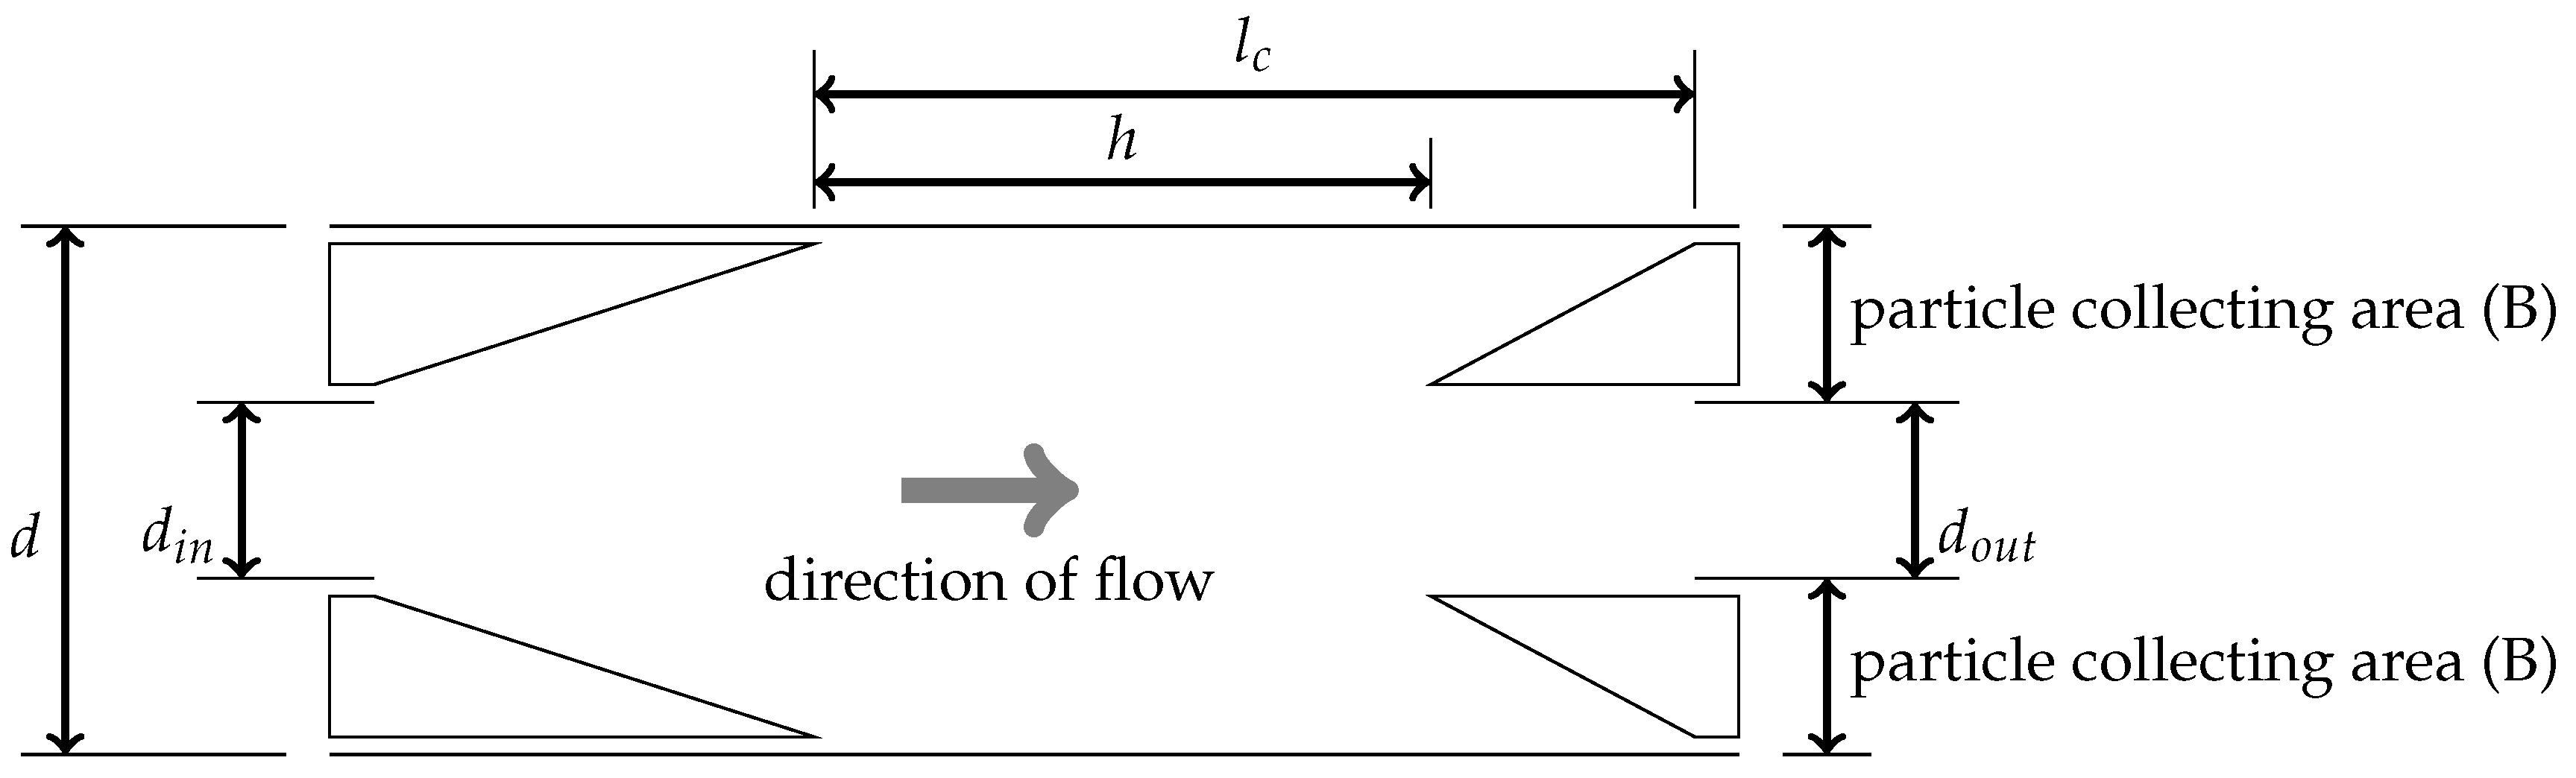
3.1. Experimental Setup and Parameter

A uniflow cyclone system, consisting of an aerosol generator, an axial blower, a separating chamber, and a high-efficiency particulate air (HEPA) filter is set up for the experimental verification (Figure 3 and Figure 4).
For the introduction of fine dust particles into the uniflow cyclone, a particle feeder is used as an aerosol generator. Oil particles are generated using a Laskin nozzle connected to an air compressor. The axial rotating gas behind the blower (GBL80320, Greenworks©, Changzhou, China) [18] is further amplified in its rotating motion by swirl inducers with different vane angles β v [5] (Table 1).
Each of the five swirl inducers is designed with four curved vanes that guide air into the system [5]. The curved vanes of the swirl inducer are represented by three thick lines in Figure 5. The angle between the tangential of the midpoint of the curved vane and the swirl inducer axis represents the vane angle β v . The swirl inducer section point A (Figure 3) is connected through a diffuser to the separation chamber. The separation chamber consists of a poly-acrylic tube (wall thickness = 5 m m , inner diameter = 150 m m , length = 1000 m m ) [5]. The flow is guided through the separation chamber into a hollow conical-shaped outlet duct point B (Figure 3), which consists of an FDM-printed annular cone connected to a poly-acrylic tube (wall thickness = 2 m m , inner diameter = 86 m m , length = 500 m m ) [5].
Inside the outlet tube, a multi-channel structure (length = 50 m m , channel diameter = 5 m m ) is installed as a flow straightener, which reduces the rotation of the flow and conditions the air stream for distribution measurement with a particle spectrometer (Promo 2000, PALAS GmbH, Karlsruhe Germany) [5]. To prevent fine and ultra-fine dust particles from leaving the experimental setup and entering the environment, a HEPA filter (SC-FIS-CT 26, Festool GmbH, Wendlingen, Germany) seals the end of the outlet tube.
Preliminary to the fractional distribution measurements inside the outlet of the uniflow cyclone, the respective axial and radial velocity for each swirl inducer at the entrance of the separation chamber is measured along the diameter of the tube with a hot-wire anemometer (Dantec Dynamic A/S, Skovlunde, Denmark) [5]. The velocity measurements are conducted using an L-shaped probe holder fitted with an X-probe. The X-probe is positioned 250 m m from the swirl inducer and is guided into the separation chamber through a guiding trench in the separating chamber. The volumetric flow rate V ˙ is calculated as 0.130   m 3 s 1 , which is in agreement with the datasheet provided by the manufacturer [18].
The particle size distributions of the ultra-fine test dust (A1-Arizona test dust, Powder Technology Inc.© (PTI), Arden Hills, MN, USA), with a bulk density of ρ b = 500 k g m 3 and a particle density of ρ p = 2650 k g m 3 , and of the olive oil, with a particle density of ρ p = 916 k g m 3 , are initially analyzed with a light-scattering aerosol spectrometer [5]. The analysis of the test dust provided a mean particle size distribution in a particle size range from 0.5   µ m to 40 µ m , which matches the information in the datasheet provided by the supplier. The analysis of the oil mist provided a particle size distribution with a spectrum from 0.5   µ m to 8 µ m , while the mean particle size is d m e a n = 0.132   µ m (Figure 6).

3.2. Measurements Using Fine Dust Particles and Oil Droplets

An aerosol generator usually introduces the particles into the cyclone system before particle separation. In the case of fine dust, a rotating brush distributes the fine particles into the air stream. The brush transports the particulate matter from the reservoir of the aerosol generator into a pre-loaded air stream before it is released into the inlet of the turbo machine [5]. For the generation of the liquid oil particles, the olive oil is stored in a Laskin-nozzle reservoir and vaporized with the use of compressed air. The Laskin nozzle injects the fine oil droplets into the air stream of the uniflow cyclone. Next, the gas, laden with particles, experiences controlled expansion through a diffuser, leading to a notable decrease in its velocity. The rotational motion induced by the swirl inducer gives rise to centrifugal forces on both the gas and the particles within it. As a result, fine particles are compelled towards the cyclone wall, creating a trajectory. In terms of particle theory, these particles possess a Stokes number of S t k > > 1 [19]. To ensure a straightforward design and a steady rotating flow, the isolated particles are amassed in the annular region between the cyclone and the conical outlet. This is feasible due to the low particle concentration. Fine dust particles with a Stokes number of S t k < < 1 remain within the gas flow and exit the separation chamber, ultimately gathering within the HEPA filter. Before conducting particle distribution measurements at the exit of the uniflow cyclone, preliminary tests were carried out to coat the cyclone walls with either fine dust particles or oil droplets. This preparation aimed to minimize any electrostatic interactions between the cyclone wall and the fine particles during the actual measurements. To calculate the separation efficiency and the particle cut diameter d p c for each particulate material, three measurements are performed. Before and after each measurement, the weight of the test dust in the aerosol generator or the weight of the oil in the Laskin-nozzle reservoir, along with the weight of the HEPA filter, is gauged. These data are then utilized to calculate the total weight of the incoming fine particles m i n entering the system, as well as the total weight of the particles m f departing from the system during the experiment and remaining within the HEPA filter [5]. The introduction of fine dust powder into the cyclone inlet, achieved using an aerosol generator, occurred at an average concentration of c i =   16.2   m g m 3 . In contrast, the injection of fine oil mist was performed with an average concentration of c i =   6.6   m g m 3 . During each trial, the particle spectrometer examines the size distribution of particles within the airflow entering the filter media for a duration of 120 s . Leveraging the known particle size distributions f i n of the fine dust (as shown in Figure 6), the particle size distributions f i n of the oil mist, and the distribution of particles departing the uniflow cyclone f o u t , the fractional separation efficiency for a given particle size range is computed using Equation (22), as presented by Faulkner [20]
η i = m i n · f i n , i m f · f o u t , i m i n · f i n , i .
The calculated fractional separation efficiencies are displayed as a fractional separation efficiency curve, where the particle cut diameter d p c is calculated using an approximated logistic function proposed by Iozia and Leith [9]. The approximation of the logistic curve and the visualization of the data were conducted using Python [5].

3.3. Parameter for Uniflow Cyclone Systems

Since past empirical approaches were based on geometrical and physical parameters rather than fluid dynamical principles, these empirical formulas are not exclusively valid for reverse-flow cyclones. Furthermore, the parametrical relationships examined through experimental research can be used for other types of cyclones as well. The physical, geometrical, empirical, particle and process parameters are listed in Table 2. In the case of uniflow cyclone systems, most geometrical parameters can be directly used as for reverse-flow cyclones (Figure 7), such as cyclone length l c , vortex core length h, cyclone diameter d, inlet diameter d i n , and oulet diameter d o u t . Since the particle collecting zone has an annular shape for uniflow cyclones, compared to the circular shape that is present in reverse-flow cyclones, the dust collector diameter is calculated as
B = π D 2 π D o u t 2 π
a = b = 2 π d i n 2 4
S = l c h

4. Results and Discussion

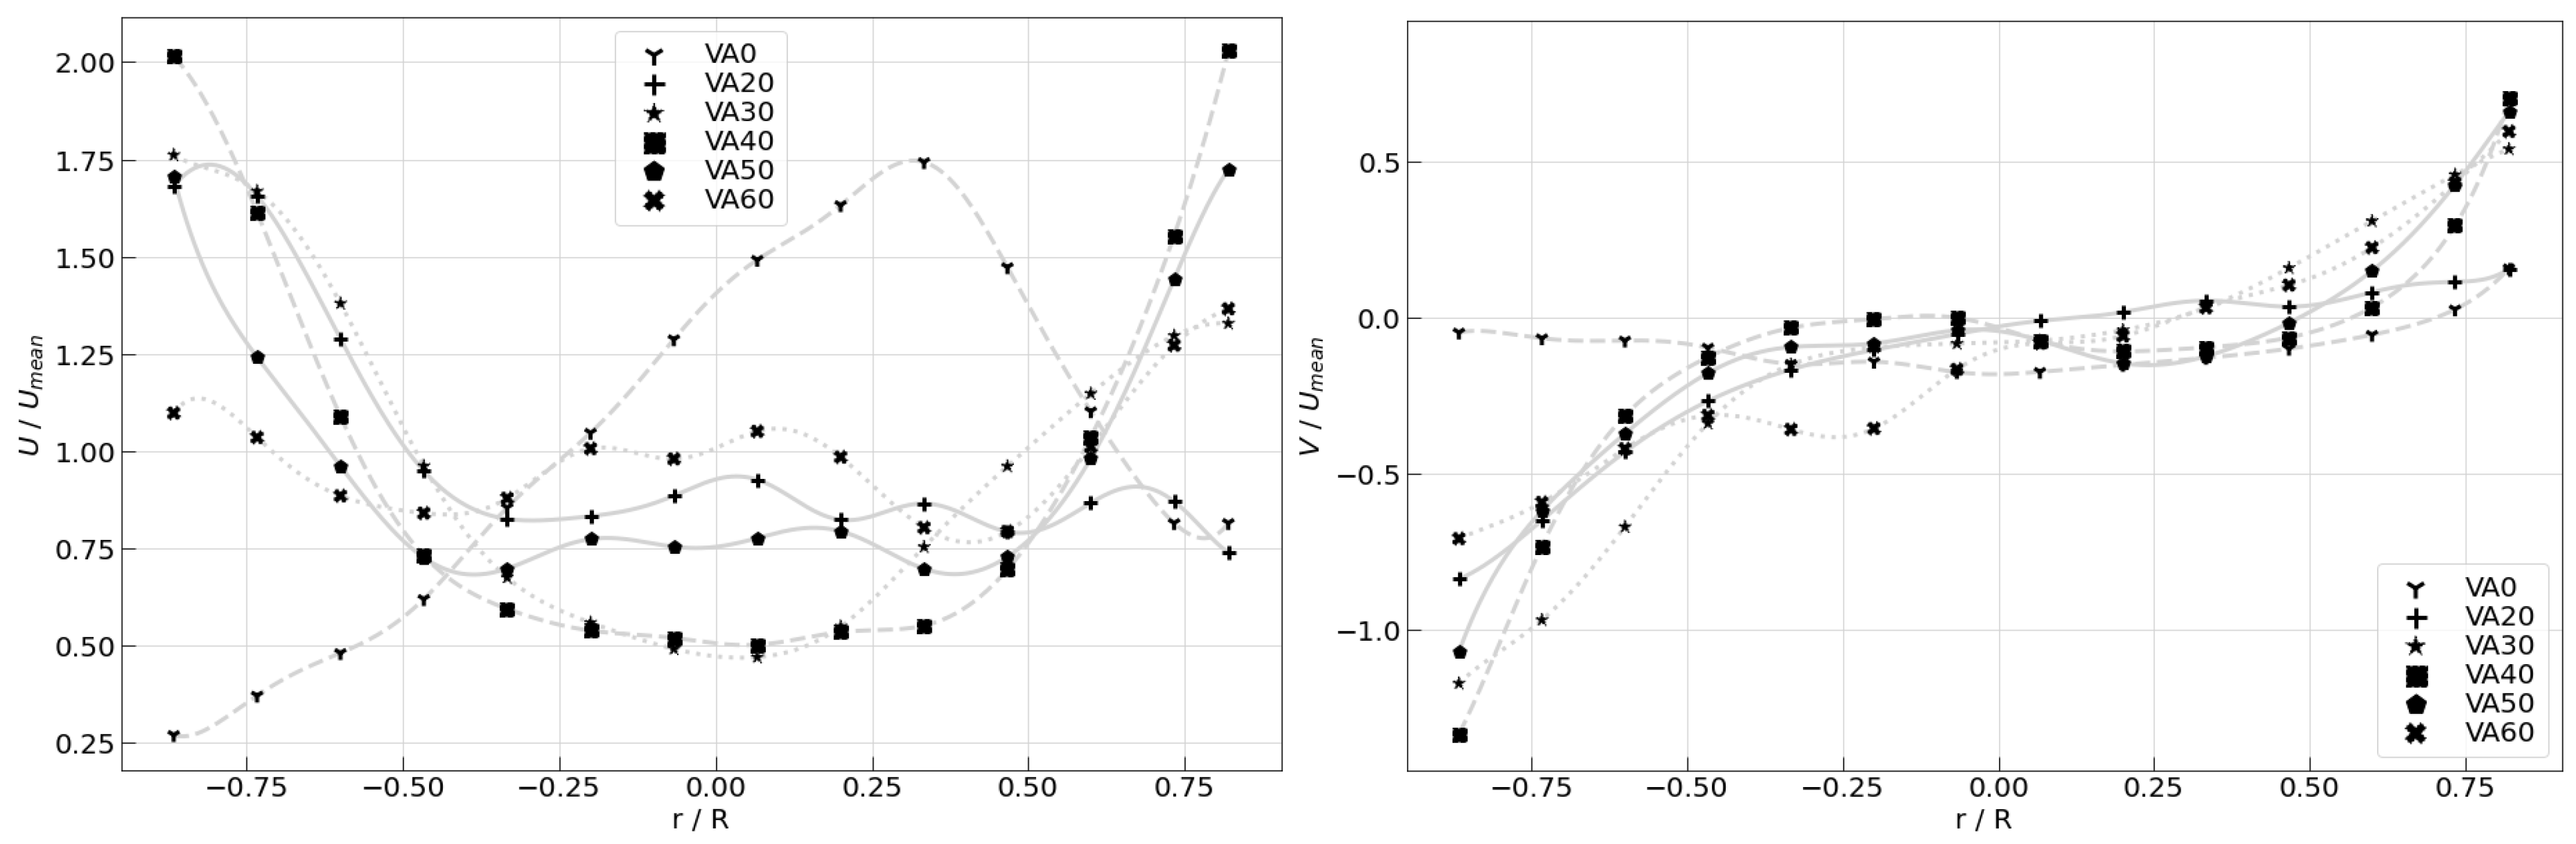
4.1. Axial and Radial Velocities

For the comparison of six empirical models with the actual experimental results, the velocity data and separation efficiencies for each swirl-inducer configuration had to be acquired. The results of the experimental measurements are presented in the following. In Figure 8, the normalized axial velocity component U and the normalized radial velocity V can be seen for the specific Reynolds number R c = 13.9 × 10 4 [5].
The radial velocity V, used for the calculation of the separation efficiency with the empirical formulas, is computed using the mean values of the absolute radial velocities measured with a hot-wire anemometer. The inlet velocity is estimated with the volumetric flow rate V ˙ given in the specification of the blower [18].

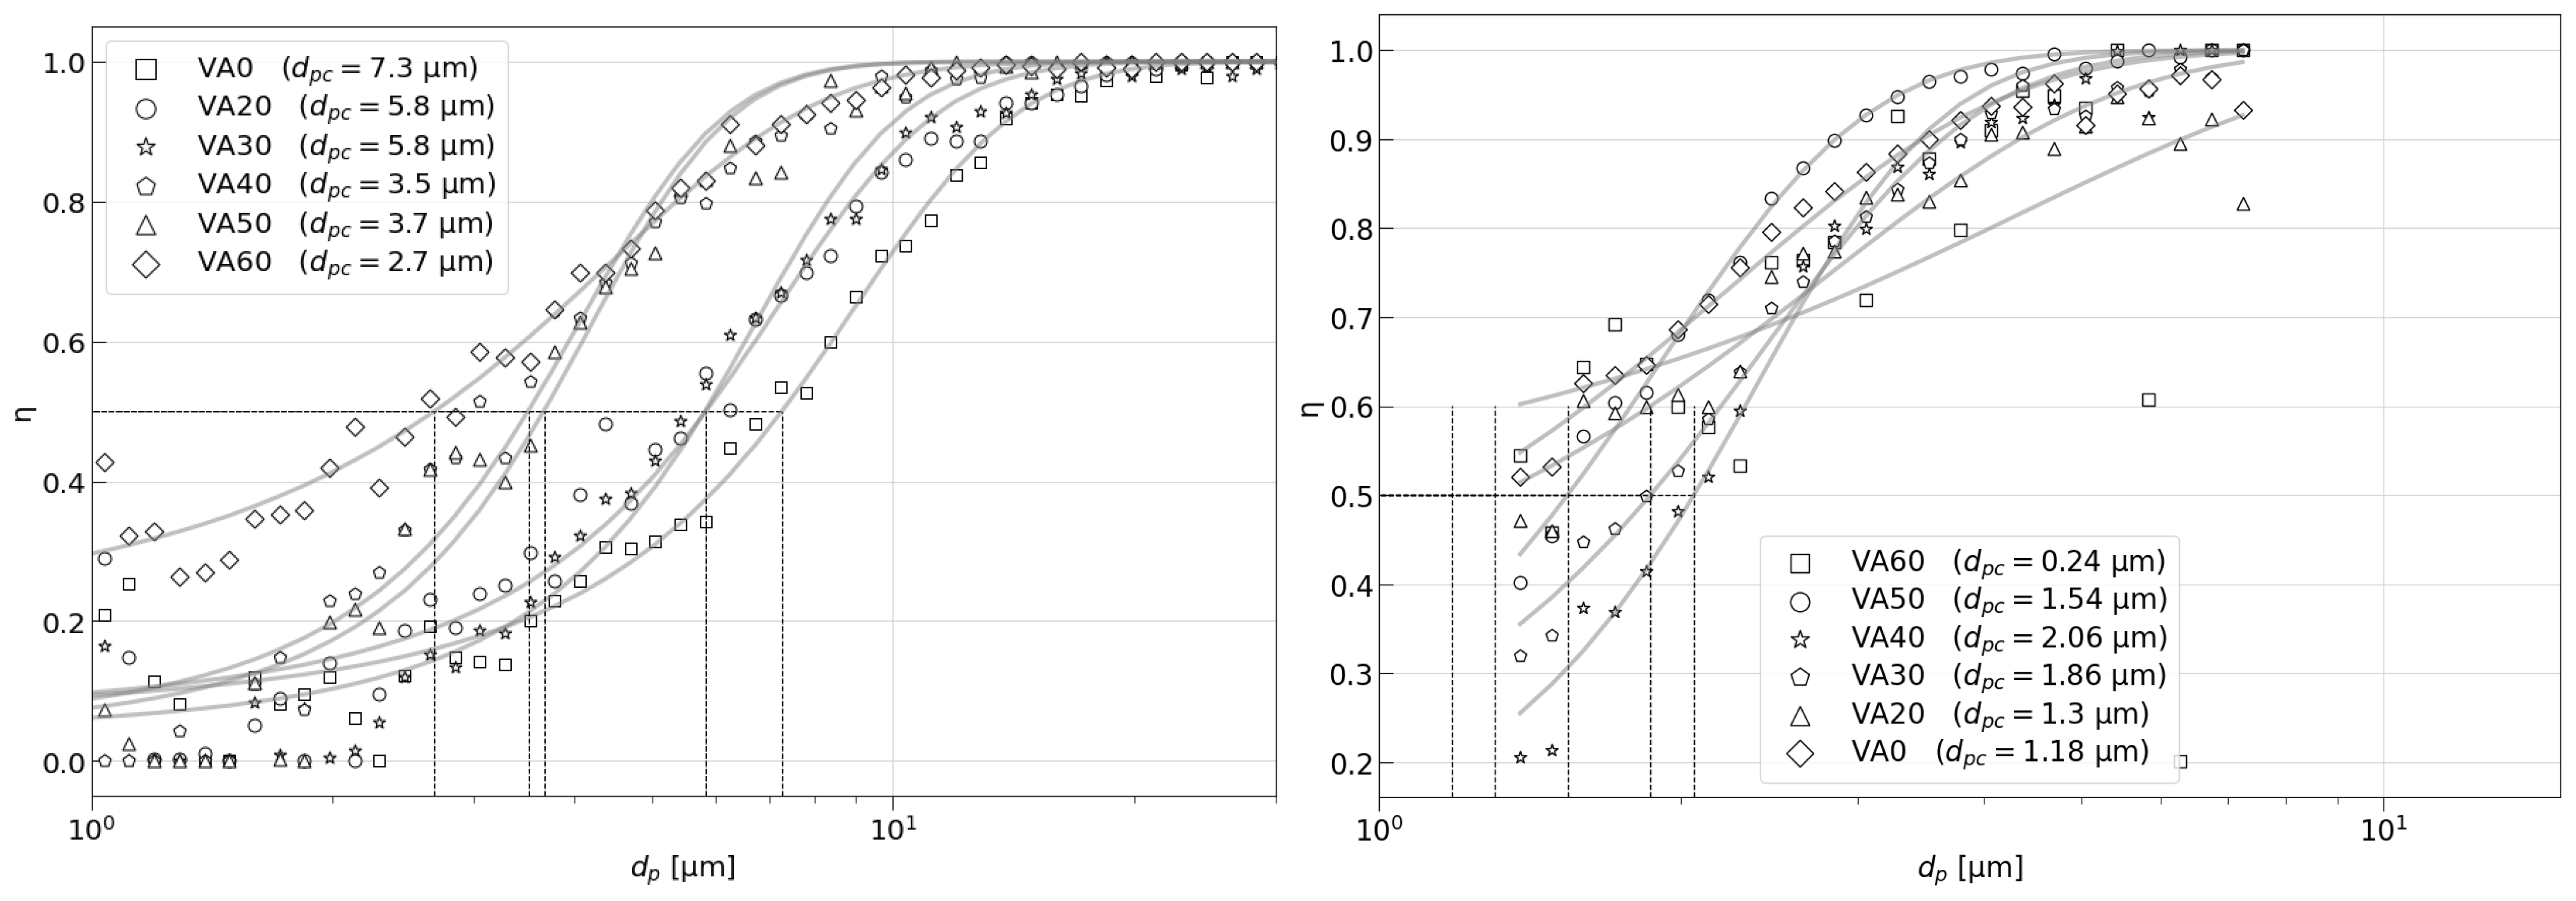
4.2. Fractional Particle Separation Efficiency and Particle Cut Diameter for Different Aerosols

The fractional efficiency curve for the vane angle β v from 0 to 59.7 of the swirl inducer is calculated using Equation (22). As suggested by Iozia [9], the data points of the fractional efficiency curve are approximated with a logistic curve
f d p = 1 1 + e β d p d p c .
While the midpoint of the logistic curve at a fractional efficiency of 50% represents the particle cut diameter d p c , the slope parameter β describes the steepness of the midpoint [5]. To assess the particle separation capabilities of the uniflow cyclone concerning both fine dust particles and oil droplets, the fractional particle separation efficiencies within a particle diameter range d p , spanning from 1 µ m to 29 µ m , are gauged using a particle spectrometer. The particle cut diameter d p c serves as a quantification of the overall separation efficiency within this particular particle diameter spectrum, considering the experimental configuration. The charted data in Figure 9 illustrate the fractional particle separation efficiencies for varying swirl inducer vane angles β v , all performed at a Reynolds number of R c = 13.9 × 10 4 .
The fractional particle separation efficiency curve of the uniflow cyclone exhibits a different particle cut diameter d p c for solid and liquid particles with the same vane angle β v (cp. Figure 9). For fine dust particles, a larger particle cut diameter d p c is achieved compared to that of oil particles. In the case of the oil droplets, the particle cut diameter d p c below 2 µ m is estimated from the measurement data. Next to the differently distributed particle size spectrum for fine dust and oil particles that are generated before particle separation (cp. Figure 6), physical mechanisms between the solid particles on one side and the liquid droplets on the other side need to be considered. While the solid fine dust particles are most likely broken into smaller particles during particle–particle interactions, the fine dust particles are less prone to adhesion at the cyclone wall compared to liquid droplets. This behavior leads to a shift in the total fine dust particle spectrum towards smaller particle diameter sizes d p and could explain the larger particle cut diameter d p c experienced during the measurement.
The oil droplets, due to the nature of their chemical composition, behave unlike fine dust particles. During oil particle collision, inter-molecular forces, such as the London dispersion force and the Van-de-Waals force, are the main contribution to the merging of oil droplets to form a droplet with a larger particle cut diameter size d p c . Furthermore, oil droplets are more likely to stick to the cyclone wall during wall collision due to interfacial tensions. This could lead to better results for the particle separation efficiency measurement.

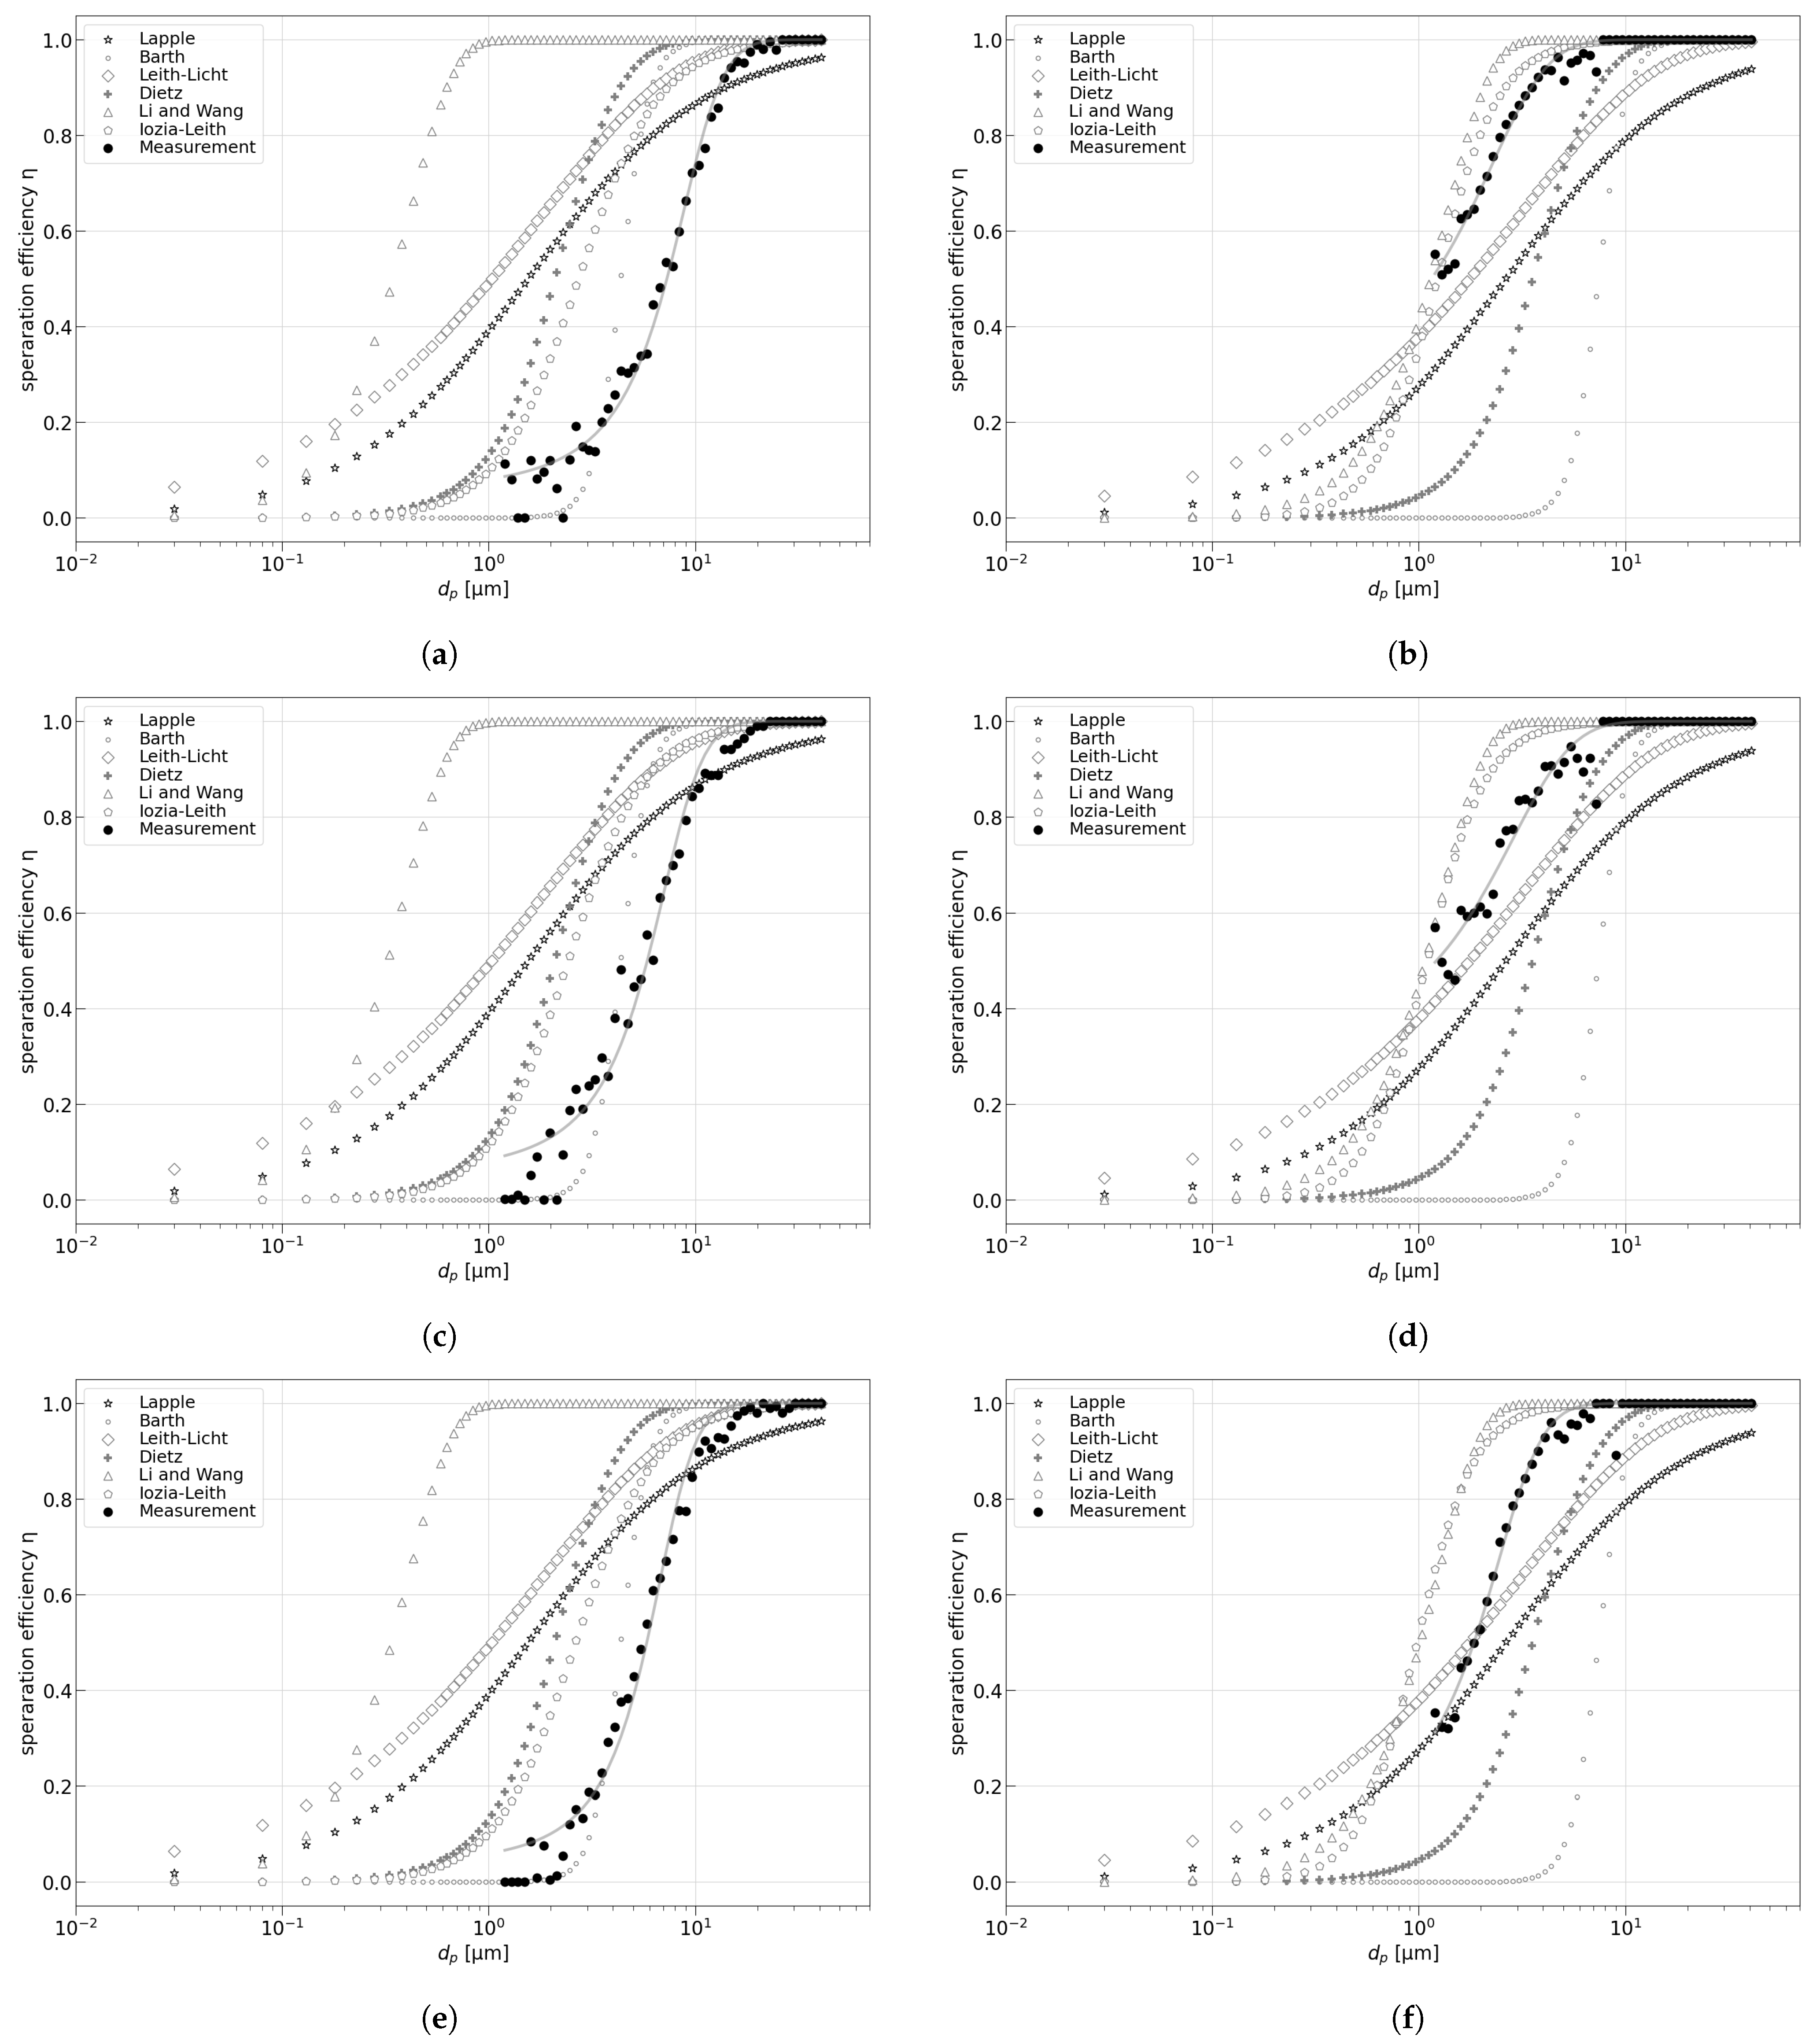
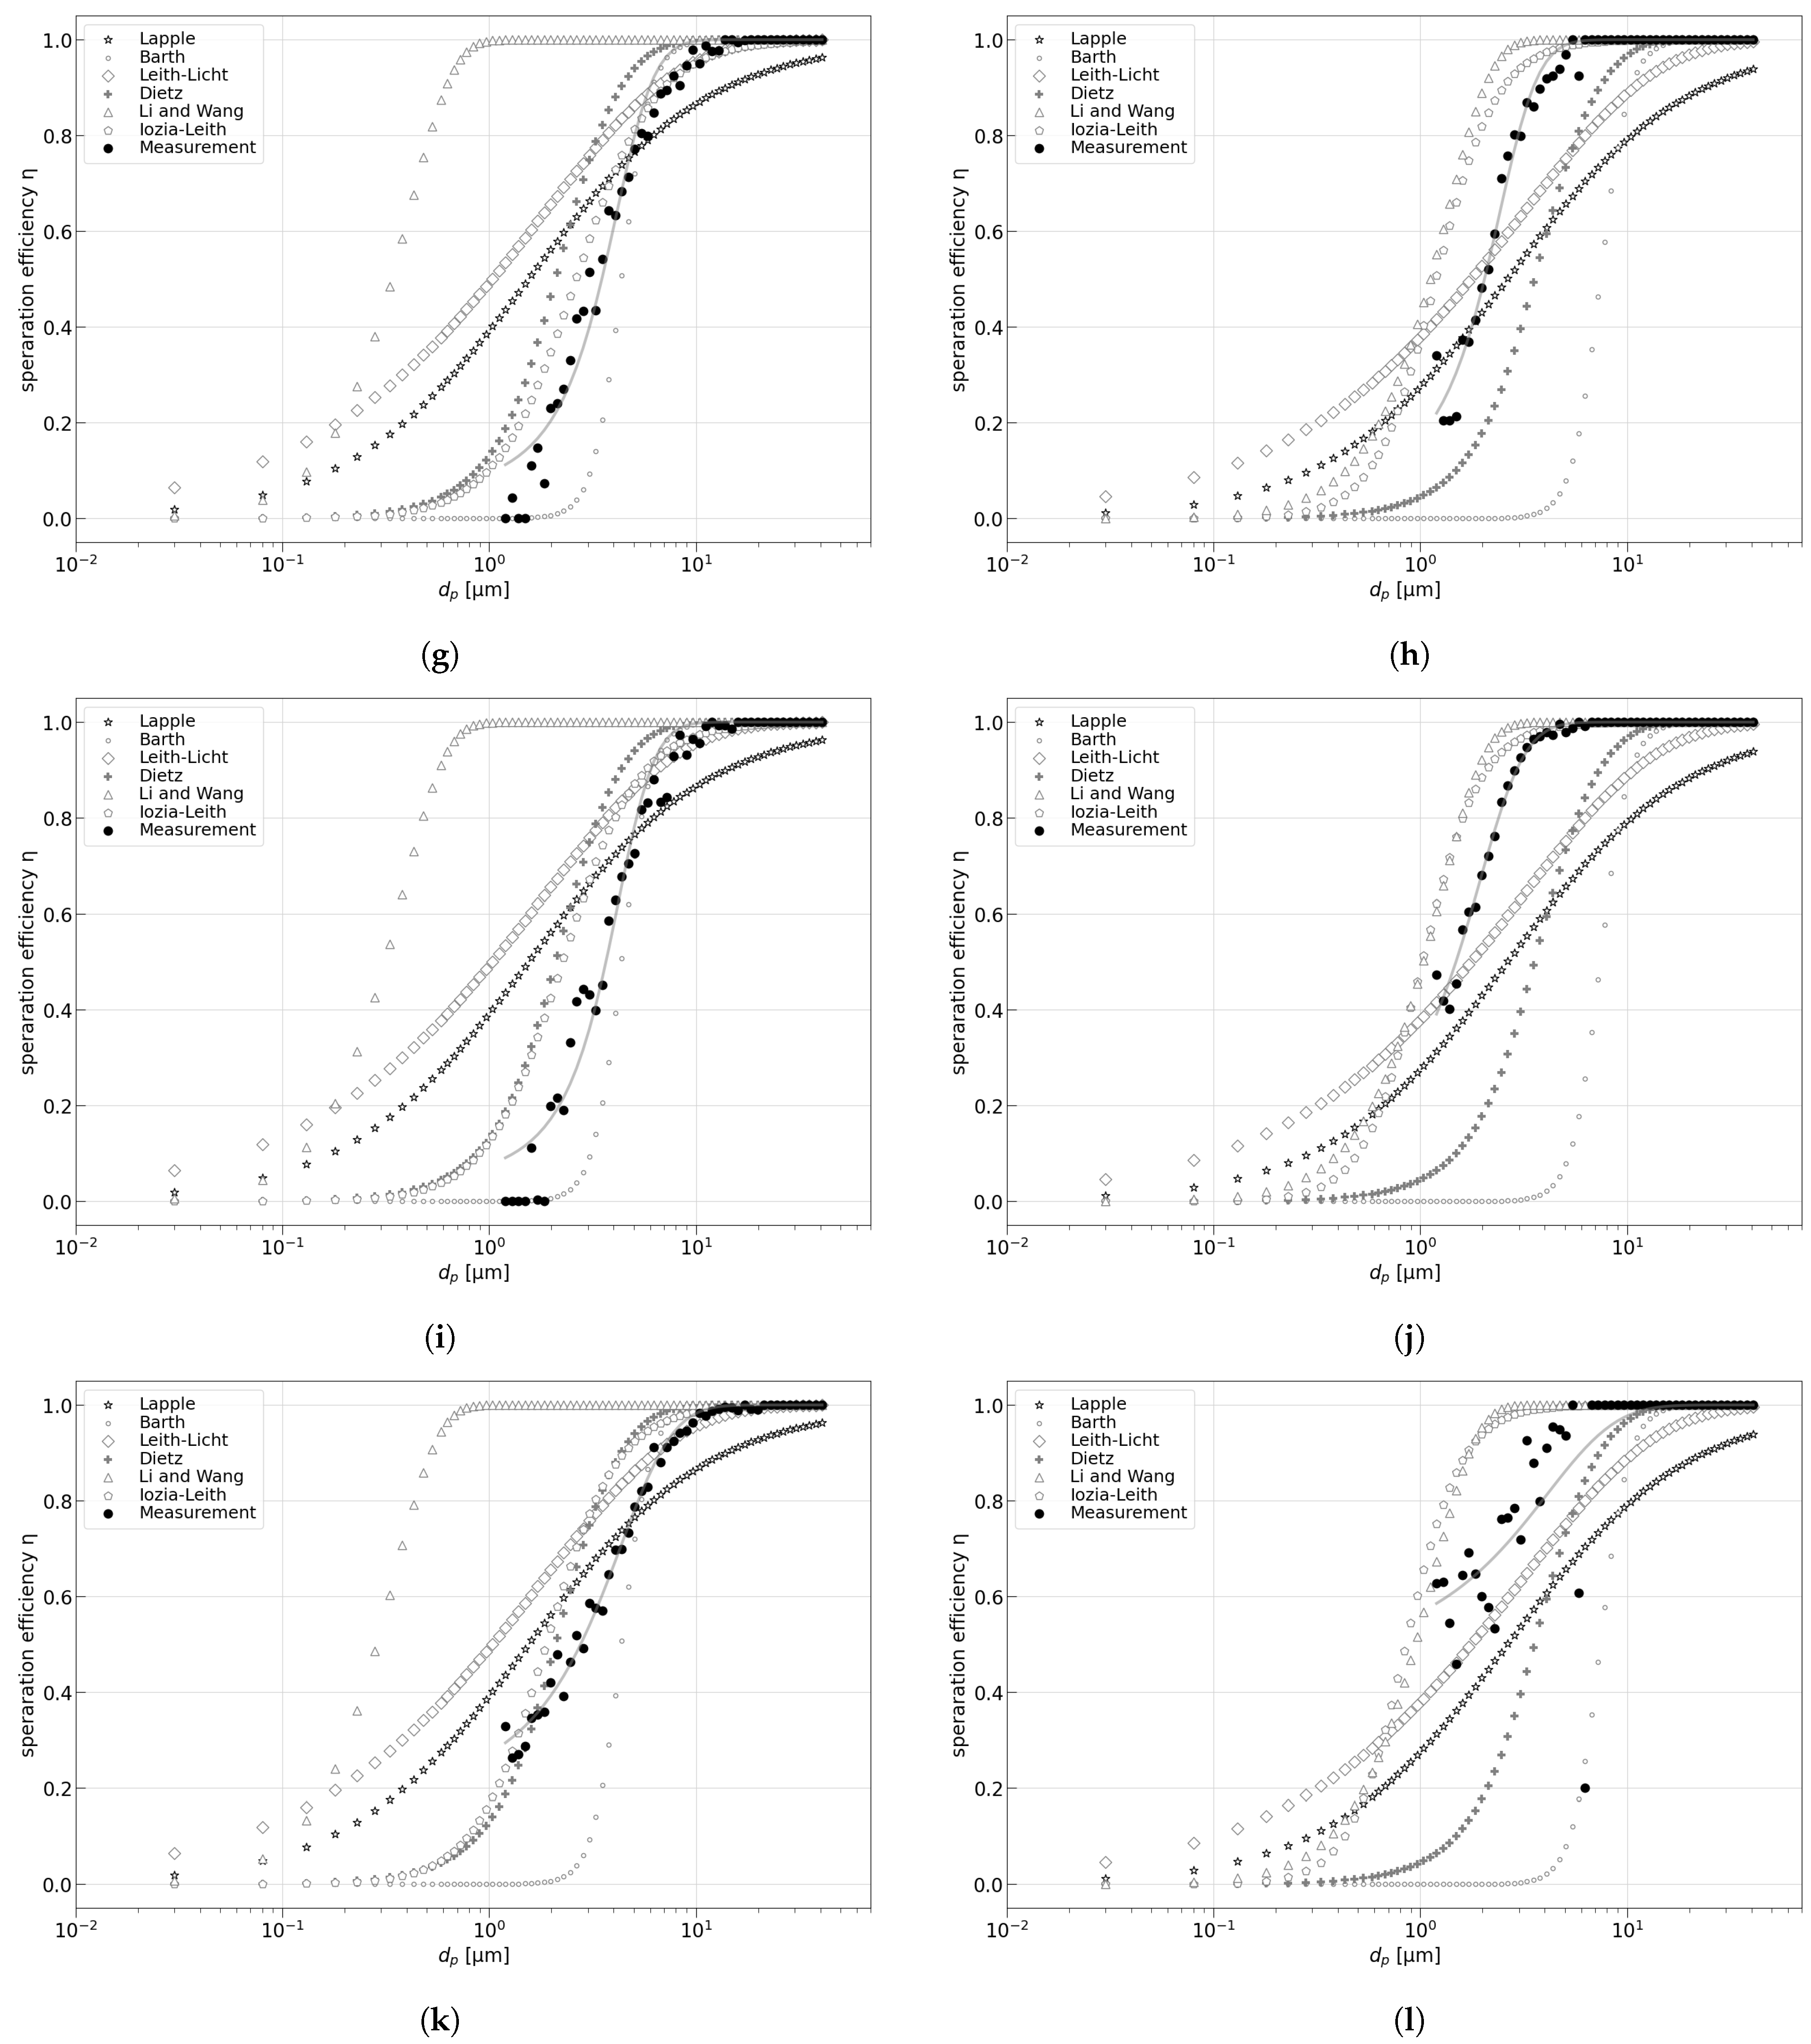
4.3. Comparison of Empirical Approaches with the Measurement Data

In Section 2, six empirical models are briefly introduced and visualized. Among these empirical approaches are the “Time Flight Model” from Lapple, the “Static Particle Model” developed by Barth, the “Fractional Efficiency Model” introduced by Leith and Licht, the “Three Regions Model” invented by Dietz, the “Turbulent Diffusion Model” envisioned by Li and Wang, and the “Flow Resistance and Centrifugal Force Balance Model” showcased by Iozia and Leith. As these models are used for dimensioning and designing cyclone systems, the particle separation efficiencies η are calculated for the respective particle sizes d p in the spectrum of the used aerosols (Figure 6). The six models are compared with the results from the particle separation efficiency measurement in Figure 10a–l. For the calculation, the models are implemented in Python, and the results, together with the measurement data, are visualized.
It can be seen that the separation efficiency curve of the measurement for the fine dust particles (Figure 10a,c,e,g,i,k) coincides with the theoretical curve extracted from Barth’s “Static Particle Model” and is shifted towards Dietz’s and Iozia and Leith’s approaches as the vane angle β v increases. Li and Wang’s “Turbulent Diffusion Model” seems to fit the least to the respective measurement data, while Leith and Licht’s theory and Lapple’s approach seem to lack the steepness experienced in the curve of the measured separation efficiency. Possible negative recordings of the particle separation efficiency can be a result of particle–particle interactions. During the collision of large particles, fine particles are formed and lead to an increase in the total number of fine particles within the cyclone. As an effect, a higher amount of fine particles than the amount that entered the cyclone are exiting the cyclone, leading to a negative particle separation efficiency for particles in the lower particle size range.
For the olive oil droplets, representing liquid aerosol particles (Figure 10b,d,f,h,j,l), the measured separation efficiency seems to fit best with Li and Wang’s theory as well as with Iozia and Leith’s approach. However, for increasing the vane angle β v , and therefore increasing the radial velocity V, the measurement data can also be represented by Dietz’s “Three Regions Model”. Overall Dietz’s and Iozia and Leith’s approaches give the best results when comparing solid and liquid aerosol particles separated in a uniflow cyclone. Other theories need to be considered with caution since the sole implementation of the particle density and the mean particle size of the particle spectrum do not appear to be sufficient to match the actual particle separation efficiency. This leaves room for new empirical approaches that consider particle–particle and particle–wall interactions based on the physical and chemical properties of the particles separated within the cyclone.

5. Conclusions

Before the fractional distribution measurements inside the outlet of the uniflow cyclone, the axial and radial velocities are measured for each swirl-inducer configuration using a hot-wire anemometer. These measurements are crucial for comparing the empirical models with actual experimental results. The particle size distribution analysis is conducted for ultra-fine test dust and olive oil using a light-scattering aerosol spectrometer. The analysis provides insights into particle size distributions and mean sizes, essential for subsequent measurements and calculations. Next to the particle size distribution analysis, measurements are performed using fine dust particles and oil droplets. An aerosol generator introduces the particles into the cyclone system. Fine dust particles are introduced using a rotating brush, while olive oil droplets are vaporized through a Laskin nozzle using compressed air. Controlled expansion through a diffuser reduces the velocity of the gas laden with particles, and the induced rotational motion compels fine dust particles toward the cyclone wall, leading to their collection. Fine dust particles with a low Stokes number remain within the gas flow and are collected in the HEPA filter. Preliminary tests ensure minimized electrostatic interactions between the cyclone wall and the particles during measurements. To determine the separation efficiency and particle cut diameter for different particulate materials, three measurements are performed for each substance and vane angle configuration. The weights of the particles and filters are measured before and after each trial, enabling the calculation of total weights and particle efficiency. The obtained data are utilized to create fractional separation efficiency curves and calculate particle cut diameters. The comparison of empirical models with the measurement data reveals that specific models align closely with the observed particle separation efficiency for different aerosols and vane angles. In summary, this study provides valuable insights into the behavior of fine dust particles and oil droplets within a uniflow cyclone, shedding light on separation efficiencies and particle cut diameters. The experimental results offer critical information for designing and optimizing cyclone systems for effective particle separation and the suitability of different empirical approaches for different particulate materials.

6. Patents

During this research, a resulting patent was registered. The patent, entitled “Method for removing particles by centrifugation based on rotating systems and centrifugal forces” was registered at the Korean Intellectual Property Office under patent no. 10-2490691.

Author Contributions

Conceptualization, V.K. and A.D.; methodology, V.K. and A.D.; software, V.K.; validation, V.K., G.L. and A.D.; formal analysis, V.K. and S.L.; investigation, V.K.; resources, V.K. and A.D.; writing—original draft preparation, V.K.; writing—review and editing, V.K., S.L. and G.L.; visualization, V.K.; supervision, V.K., G.L. and A.D.; project administration, V.K. All authors have read and agreed to the published version of the manuscript.

Funding

This research received no external funding.

Data Availability Statement

Any extra data needed can be provided by authors upon request.

Conflicts of Interest

The authors declare no conflict of interest.

Abbreviations

The following abbreviations are used in this manuscript:
FDMfuse-deposition modeling
HEPAhigh-efficiency particulate air [filter]
HWAhot-wire anemometer
MNMinnesota
VAvane angle

References

  1. Herald, K. Artificial Rain Test Failed to Ease Fine Dust Level. 2019. Available online: www.koreaherald.com/view.php?ud=20190227000638 (accessed on 28 September 2022).
  2. Staudt, J.E. Control Technologies to Reduce Conventional and Hazardous Air Pollutants from Coal-Fired Power Plants; Northeast States for Coordinated Air Use Management (NESCAUM): Boston, MA, USA, 2011; Available online: https://www.nescaum.org/documents/coal-control-technology-nescaum-report-20110330.pdf (accessed on 11 December 2022).
  3. Lapple, C.E. Gravity and Centrifugal Separation. Am. Ind. Hyg. Assoc. Q. 1950, 11, 40–48. [Google Scholar] [CrossRef]
  4. Wadenpohl, C.; Löffler, F. Electrostatic agglomeration and centrifugal separation of diesel soot particles. Chem. Eng. Process. Process. Intensif. 1994, 33, 371–377. [Google Scholar] [CrossRef]
  5. Klapper, V.; Luzi, G.; Prah, B.; Delgado, A. Particle Cut Diameter Prediction of Uniflow Cyclone Systems with Fuzzy System Analysis. Separations 2023, 10, 345. [Google Scholar] [CrossRef]
  6. ISO 7708:1995; Air Quality—Particle Size Fraction Definitions for Health-Related Sampling. International Organisation for Standardization: Geneva, Switzerland, 1995.
  7. Nel, A.; Xia, T. Toxic Potential of Materials at the Nanolevel. Science 2006, 311, 7. [Google Scholar] [CrossRef] [PubMed]
  8. Dirgo, J.; Leith, D. Cyclone Collection Efficiency: Comparison of Experimental Results with Theoretical Predictions. Aerosol Sci. Technol. 1985, 4, 401–415. [Google Scholar] [CrossRef]
  9. Iozia, D.L.; Leith, D. The Logistic Function and Cyclone Fractional Efficiency. Aerosol Sci. Technol. 1990, 12, 598–606. [Google Scholar] [CrossRef]
  10. Rivera-García, M.O.; Reyna, M.A.; Camarillo-Ramos, M.A.; Reyna-Vargas, M.A.; Avitia, R.L.; Cuevas-González, D.; Osornio Vargas, A.R. Cyclone Separator for Air Particulate Matter Personal Monitoring: A Patent Review. Atmosphere 2023, 14, 624. [Google Scholar] [CrossRef]
  11. Pillei, M. Optimierung von Gleichstromzyklonen Bei Geringer Feststoffbeladung. Ph.D. Thesis, Friedrich-Alexander-University Erlangen-Nuremberg (FAU), Erlangen, Germany, 2020. [Google Scholar]
  12. Samson, E.W.; Croup, A.H. Method of and Means for Separating Solid Particles in Pulp Suspensions and the Like. 1939. Available online: https://patents.google.com/patent/US2377524A/en (accessed on 3 March 2023).
  13. Barth, W. Berechnung und Auslegung von Zyklonabscheidern aufgrund neuerer Untersuchungen. J. Brennst. Warme Kraft 1956, 8, 1–9. [Google Scholar]
  14. Leith, D.; Licht, W. The Collection Efficiency of Cyclone Type Particle Collectors—A New Theoretical Approach. Atmos. Environ. 1972, 68, 196–206. [Google Scholar]
  15. Dietz, P.W. Collection efficiency of cyclone separators. AIChE J. 1981, 27, 888–892. [Google Scholar] [CrossRef]
  16. Enliang, L.; Yingmin, W. A new collection theory of cyclone separators. AIChE J. 1989, 35, 666–669. [Google Scholar] [CrossRef]
  17. Gimbun, J.; Choong, T.S.Y.; Fakhru’l–Razi, A.; Chuah, T.G. Prediction of the Effect of Dimension, Particle Density, Temperature, and Inlet Velocity on Cyclone Collection Efficiency. J. Teknol. 2012, 40, 37–50. [Google Scholar] [CrossRef]
  18. Greenworks. 80 V Cordless Brushless Blower GBL80320—Owner’s Manual. 2014. Available online: https://manualzz.com/doc/o/6dsq8/80v-cordless-brushless-blower-2400102-gbl80300-symboles (accessed on 25 August 2022).
  19. White, F. Fluid Mechanics; McGraw-Hill Series in Mechanical Engineering; McGraw Hill: New York, NY, USA, 2011. [Google Scholar]
  20. Faulkner, W.B.; Shaw, B.W. Efficiency and pressure drop of cyclones across a range vocieties. Appl. Eng. Agric. 2006, 22, 155–161. [Google Scholar] [CrossRef]
Figure 1. Dimensions of a reverse-flow cyclone.
Separations 10 00522 g001
Figure 2. Experimental and theoretical efficiency for a Stairmand high-efficiency cyclone [5,8].
Separations 10 00522 g002
Figure 3. Schematic diagram of the experimental setup [5].
Separations 10 00522 g003
Figure 4. Experimental uniflow cyclone setup with axial blower, diffusor, and separating chamber (top) and an outlet tube with flow straightener, particle spectrometer, and HEPA filter (bottom).
Separations 10 00522 g004
Figure 5. Swirl inducer dimensions [5] (top) and used swirl inducers with respective vane angle β v (bottom).
Separations 10 00522 g005
Figure 6. Differential and cumulative particle size distribution of the used fine test dust (left) [5] and of the oil particles (right).
Separations 10 00522 g006
Figure 7. Transformation of reverse-flow cyclone parameters to the uniflow cyclone system.
Separations 10 00522 g007
Figure 8. Normalized axial velocity U (left) and radial velocity V (right) at the entrance of the separation chamber for different vane angles β v at Reynolds number R c = 13.9 × 10 4 [5].
Separations 10 00522 g008
Figure 9. Fractional particle separation efficiencies η and particle cut diameter d p c of the used swirl inducers for fine dust with Reynolds number R c = 13.9 × 10 4 (left [5]) and oil mist (right).
Separations 10 00522 g009
Figure 10. Calculated and measured separation efficiencies for fine dust particle (left) and oil droplets (right) with different vane angle configuration. (a) Fine dust particles and swirl inducer vane angle β v = 0 , (b) oil mist particles and swirl inducer vane angle β v = 0 , (c) fine dust particles and swirl inducer vane angle β v = 18.9 , (d) oil mist particles and swirl inducer vane angle β v = 18.9 , (e) fine dust particles and swirl inducer vane angle β v = 29.7 , (f) oil mist particles and swirl inducer vane angle β v = 29.7 , (g) fine dust particles and swirl inducer vane angle β v = 40.5 , (h) oil mist particles and swirl inducer vane angle β v = 40.5 , (i) fine dust particles and swirl inducer vane angle β v = 48.8 , (j) oil mist particles and swirl inducer vane angle β v = 48.8 , (k) fine dust particles and swirl inducer vane angle β v = 59.7 , and (l) oil mist particles and swirl inducer vane angle β v = 59.7 .
Separations 10 00522 g010aSeparations 10 00522 g010b
Table 1. Dimension of the used swirl inducer [5].
SymbolUnitVA0VA20VA30VA40VA50VA60
length l s mm0112.567.54567.545
diameter d s mm07777777777
vane angle β v 018.929.740.548.859.7
Table 2. Overview of the parameter for calculations using known empirical approaches.
DescriptionSymbolValueUnit
physical parameter
dynamic viscosity of air μ g a s 1.825 × 10 5 k g m 1 s 1
density of air ρ g a s 1.2041 k g m 3
temperatureT293 K
gravityg9.81 m s 2
geometrical parameter
cyclone length l c 0.8 m
cyclone diameterd0.15 m
inlet diameter d i n 0.078 m
outlet diameter d o u t 0.086 m
equivalent edge length of inlet a , b 0.07 m
outlet overlapS0.15 m
dust collector diameterB0.12 m
empirical parameter
friction factor [8] λ 0.02-
core diameter [13] d c 0.05 m
number of revolutions [3]N10.49-
vortex core lengthh0.65 m
vortex exponent [14]n0.51-
natural cyclone length [15]l0.33 m
particle parameter
particle density fine dust ρ p 2650 k g m 3
weighted mean particle size fine dust d m e a n 2.91 × 10 6 m
particle density oil ρ p 916 k g m 3
weighted mean particle size oil mist d m e a n 1.32 × 10 6 m
process parameter
volume flow rate V ˙ 0.13 m 3 s 1
mean inlet velocity v i n 27.21 m s 1
mean outlet velocity v o u t 10.00 m s 1
mean absolute radial velocityV1.77/1.34/1.23/1.07/0.91/0.85 m s 1
Disclaimer/Publisher’s Note: The statements, opinions and data contained in all publications are solely those of the individual author(s) and contributor(s) and not of MDPI and/or the editor(s). MDPI and/or the editor(s) disclaim responsibility for any injury to people or property resulting from any ideas, methods, instructions or products referred to in the content.

