Abstract
This article presents a comparative study of selected deproteinization-, liquid–liquid-extraction- (LLE), and solid-phase-extraction (SPE)-based procedures for the isolation of doxorubicin (DOX) and daunorubicin (DAU) as an internal standard (IS) from rat tissue samples. During the experiments, all samples were analyzed via liquid chromatography coupled with fluorescence detection (LC-FL), with analytes being monitored at excitation and emission wavelengths of 487 and 555 nm, respectively. The absolute recoveries of the sample-preparation procedure were then calculated and compared, and the advantages and disadvantages of each approach were considered in depth. Ultimately, SPE with hydrophilic–lipophilic balanced (HLB) sorbents was selected as the most effective extraction procedure as it enabled the absolute recovery of DOX from tissue samples at a level of 91.6 ± 5.1%. Next, the selected HLB-SPE protocol was coupled with LC-FL separation and the resultant method was validated according to FDA and ICH requirements. The validation data confirmed that the developed procedure met all required criteria for bioanalytical methods, with a limit of detection (LOD) and limit of quantification (LOQ) of 0.005 µg/g and 0.01 µg/g, respectively. Finally, the developed protocol was successfully tested on various rat tissues enriched with DOX, confirming its potential as an interesting alternative to previously reported protocols for pharmacokinetic studies and clinical investigations aimed at analysis of the level and biodistribution of DOX in tissue samples after systemic administration of this drug.
1. Introduction
The anthracycline antibiotics are a category of anticancer drugs that include doxorubicin (DOX), a compound isolated from strains of Streptomyces peucetiusvar var. caesius. DOX is a first-generation anthracycline that possesses a tetracyclic ring with an acidic hydroquinone system (Figure 1A) [1]. DOX’s mechanism of action is highly complex and is strongly associated with the cell cycle. This cytotoxic agent destroys cancer cells through various means, including the intercalation of DNA and free radicals, as well as the inhibition of topoisomerase II [2], and it is commonly used in the treatment of breast, ovary, thyroid, stomach, small cell and non-small cell lung cancers, Hodgkin’s lymphoma, and soft tissue sarcoma [3,4]. Pharmacokinetic and pharmacodynamic data show that DOX displays a biphasic deposition in plasma after intravenous injection in rats and humans. For example, in humans, free DOX has a distributive half-life of approximately 5 min and a terminal half-life of 20 to 48 h. This indicates rapid uptake of DOX by the tissue matrix but slow elimination thereafter [5,6].
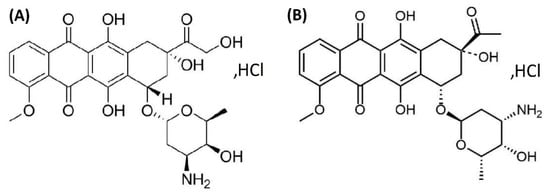
Figure 1.
Chemical structure of doxorubicin (DOX) (A) and daunorubicin (DAY) in the form of hydrochloric acid salts (B).
Due to the many side effects of DOX, such as cardiotoxicity or myelosuppression, it is important to monitor the concentration and distribution of this drug during pharmacotherapy [7,8,9,10]. To increase the effectiveness of DOX treatment while also decreasing toxicity, it is recommended to administer this drug via liposomal forms, as such structures exhibit a greater affinity for the neoplastic tumor than for healthy tissues. This may be attributed to the longevity of liposomes in the circulation and also to extravasation of liposomes through the abnormally permeable microvasculature of systemic tumors. This phenomenon is explained by the enhanced permeability and retention (EPR) effect related to the differences between the vascular system of the tumor and healthy tissues. Additionally, the size of the liposomes allows for easier diffusion from leaky blood vessels into the tumor tissues [11,12]. However, the introduction of new drugs requires extensive clinical trials, including tests on laboratory animals, to evaluate the biodistribution of the cytostatic drug to the tissues [13,14,15]. Furthermore, the isolation of DOX from tissue samples is challenging due to the need for drug determination over a wide concentration range and the complexity of biological matrices [16,17,18,19]. Therefore, it is necessary to explore and evaluate different extraction methods in an attempt to develop new, alternative solutions for identifying and determining DOX in tissue samples in pharmaceutical and clinical studies.
To date, the use of various analytical methods for the extraction and quantification of DOX in animal and human tissue has been reported in the literature with the most studies performed on rat [14,15,20], mouse [21,22,23,24,25,26], and rabbit tissue samples [27]. Notably, studies have also focused on monitoring the level of DOX in pig lung [28,29]. In these investigations, liquid chromatography (LC) is the method most commonly applied, alongside a sample preparation based on deproteinization [14,20,21,22,25,26,29] and liquid–liquid extraction (LLE) [15,23,24]. Unfortunately, despite their simplicity, these techniques involve the use of harmful chemical reagents and require the additional purification and concentration of the samples. Moreover, these procedures are often time-consuming [21,22,27,29] or characterized by low efficiency [14,15,21,26]. Solid-phase extraction (SPE) is an interesting alternative to LLE and deproteinization for the analysis of highly complex matrices such as animal tissues, as it enables the concurrent purification and concentration of the samples. However, to the best of our knowledge, the literature contains only one study wherein an SPE technique using a C18 column was applied to extract DOX from rabbit ocular samples [27]. Another interesting approach documented in the literature consisted of solid-phase microextraction (SPME) followed by LC coupled to tandem mass spectrometry (MS/MS) for the quantification of DOX in pig lung tissue samples [28]. This method ultimately provided short LC-MS/MS analysis times (10 min) and enabled analyte determination in the range of 2.5–50 µg/g.
The present study compares various procedures for extracting DOX from various animal tissues, including liver, kidney, stomach, lung, heart, and spleen, that could be useful in clinical studies to directly monitor the level and distribution of this drug in the organism. The most optimal sample-preparation protocol was coupled with liquid chromatography based on fluorescence detection (LC-FL) for the separation and quantification of DOX in rat tissue samples. The developed method was next validated on liver tissue samples and again tested on various rat’s tissues to demonstrate its potential usefulness in pharmacokinetic studies and clinical investigations aimed at quantifying DOX in tissue samples.
2. Materials and Methods
2.1. Reagents
Doxorubicin hydrochloride (DOX) (>98% purity) and daunorubicin hydrochloride (DAU) (>98% purity), which was used as an internal standard (IS) (Figure 1B), were purchased from Tocris Bioscience (Bristol, United Kingdom). Analytical-grade hydrochloric acid (36%) was obtained from Merck (Darmstadt, Germany), while HPLC-grade acetonitrile (ACN) and methanol (MeOH) were acquired from J.T. Baker (Phillipsburg, NJ, USA). Formic acid was purchased from Sigma-Aldrich (St. Louis, MO, USA), and ethyl acetate and trichloroacetic acid (TCA) were obtained from POCH (Gliwice, Poland). Chloroform, dichloromethane (DCHM) was provided by Merck (Darmstadt, Germany), and physiological salt was purchased from Chempur (Piekary Śląskie, Poland). The purified water used in the experiments was obtained using a Milli-Q system (Molsheim, France). A J.T. Baker Spe-12G column processor (J.T. Baker, Greischeim, Germany) was used for SPE extraction. The Supel Select hydrophilic–lipophilic balanced (HLB) SPE cartridges (30 mg, 1 mL) were purchased from Supelco (Bellefonte, PA, USA), The SOLA HRP (hydrophilic styrene divinylbenzene) cartridges (10 mg, 1 mL) were acquired from Thermo Fisher Scientific (Waltham, MA, USA), and the Lichrolut RP18 SPE cartridges (40 mg, 1 mL) were supplied by Merck (Darmstadt, Germany). Tissue samples were homogenized using an IKA T10 basic ULTRA-TURRAX® disperser (Staufen, Germany). Tissue harvesting from Wistar Han rats (liver, kidney, stomach, lung, heart, spleen) was conducted at the Tri-City Academic Laboratory Animal Centre at the Medical University of Gdańsk.
2.2. Chromatographic Conditions
HPLC separation was conducted on an ACME 9000 system (Younglin Instrument Corporation, Anyang, The Republic of Korea) equipped with an autosampler, (SP 930D) pump, (CTS30) thermostat, and fluorescence detector RF-551 (Shimadzu, Kyoto, Japan) with excitation set at 487 nm and emission set at 555 nm. Monitoring and data acquisition were performed using AutoChro-3000 software, with separation being carried out on a Discovery HS C18 column (150 × 4.6 mm, 5 µm) (Supelco, Bellefonte, PA, USA) operated at 30 °C. The mobile phase consisted of a mixture of ACN and 0.1% formic acid in water (28:72, v/v) with a constant flow rate of 1 mL/min. An injection volume of 15 µL was used for the samples obtained via deproteinization, LLE, and SPE that contained DOX at a concentration of 5 and 10 µg/g, respectively. In the validation study, calibration samples (CSs) containing DOX at a concentration of <1 µg/g were injected to the LC-FL at the volume of 30 µL; in contrast, an injection volume of 5 µL was used for CSs with DOX levels ranging from 1–30 µg/g and quality control samples (QCs) containing DOX at levels of 5 µg/g (low QC, LQC), 10 µg/g (middle QC, MQC), and 15 µg/g (high QC, HQC).
2.3. Standard Solutions
Stock standard solutions of DOX and the IS (1 mg/mL) were prepared separately by dissolving 10 mg of the compound of interest in 10 mL of MeOH. Each day, the stock standard solutions of DOX were diluted with MeOH to obtain working standard solutions at concentrations of 100, 10, 1 µg/mL, and 100 ng/mL. Similarly, an IS working standard solution containing 100 µg/mL of DAU was prepared by diluting the stock solution of DAU (1 mg/mL) in MeOH. All stock solutions were stored at −20 °C and the working standard solutions were stored at 4 °C. Both the stock and working standard solutions were protected from exposure to light during storage.
2.4. Preparation of Tissue Standards
The CSs and QCs were prepared by spiking 200 mg of blank rat tissue sample (liver) with the appropriate volume of working standard solution of DOX to attain CSs at 0.1, 0.5, 1, 2, 5, 7.5, 10, 15, 20, 30 µg/g, as well as with the IS solution to obtain a concentration of 10 µg/g. The low (LQC), medium (MQC), and high (HQC) QCs were obtained by adding an appropriate amount of the DOX and IS working standard solutions to blank rat tissue samples until final concentrations of 5, 10, and 15 µg/g of DOX and 10 µg/g of IS were achieved.
2.5. Sample Preparation
2.5.1. Deproteinizing and LLE Procedures
First, 0.5 mL of physiological salt was added to 200 mg of rat tissue (liver, kidney, stomach, lung, heart, spleen), followed by mechanical homogenization for 2 min. Next, an appropriate volume of the DOX solution was added to the sample to achieve concentrations of 5 and 10 µg/g, and IS solution was added until a level of 10 µg/g was obtained. After the addition of the DOX and IS solutions, the sample was thoroughly mixed in a vortexer for 30 s. After mixing, an extracting/deproteinizing solvent (1.5 mL) was added and the sample was vortexed for an additional 30 s. Next, the sample was shaken mechanically for 10 min, followed by ultrasonication for 10 min at 30 °C and centrifugation at 10,000 rpm/min for 7 min. After the centrifugation step, the supernatant was collected and transferred to a clean tube, where the organic solvent was completely evaporated at 45 °C under vacuum conditions. The resultant residue was then reconstituted in 200 µL ACN:water (1:1, v/v), stirred for 30 s, and transferred to an Eppendorf tube and centrifuged for 7 min at 10,000 rpm. The solution was subsequently transferred to the insert placed in dark vials and analyzed under the chromatographic conditions described in Section 2.2.
2.5.2. SPE Procedure
The first step of the SPE procedure involved adding 0.5 mL of homogenizing agent to 200 mg of rat tissue (liver, kidney, stomach, lung, heart, spleen), followed by mechanical homogenization for 2 min. Next, an appropriate volume of DOX solution was added to the sample to obtain concentrations of 5 and 10 µg/g and IS solution was added to achieve a concentration of 10 µg/g. Once these concentrations were achieved, the sample was thoroughly mixed in a vortexer for 30 s. After mixing, 1.5 mL of a matrix-modification solvent (0.1 M HCl or other solvent; please see Table 1) was added to the sample, followed by mechanical shaking for 10 min and ultrasonication for 10 min at 30 °C. After centrifugation (10,000 rpm/min for 7 min), the sample was loaded onto an SPE cartridge that was conditioned with 2 mL of MeOH and 2 mL of water. Next, the sample was washed with a washing agent (1 mL) and dried in a vacuum for 5 min. Finally, the investigated analytes were eluted into clean glass tubes with 2 mL of an eluting agent. In the next step, the elution solvent was completely evaporated at 45 °C under vacuum conditions, with the residue subsequently being reconstituted in 200 µL of ACN:water (1:1, v/v). The sample was then stirred for 30 s, transferred to an Eppendorf tube, and centrifuged for 7 min at 10,000 rpm. Afterwards, the solution was transferred to the insert placed in dark vials and analyzed via LC-FL under the chromatographic conditions described in Section 2.2.

Table 1.
Absolute extraction efficiencies of DOX isolated from rat liver tissue using different sample-preparation methods (n = 3).
2.6. Validation of Analytical Methods
The SPE-LC-FL method for quantifying DOX in rat tissue (liver) was validated in accordance with the international guidelines set forth by the Food and Drug Administration (FDA) and the International Conference of Harmonization of Technical Requirements for the Registration of Pharmaceuticals for Human Use (ICH) [30,31]. The method was validated for selectivity, linearity, accuracy and precision, extraction recovery, and stability.
2.7. Application of Method in Rat Tissue Samples
To determine the usefulness of the developed protocol, it was applied in the analysis of various rat tissue samples (liver, kidney, stomach, lung, heart, spleen) enriched with DOX at concentrations of 2, 10, and 20 µg/g and DAU at a concentration of 10 µg/g. Additionally, blank samples were also prepared and analyzed. Three replicates were performed for each type of tested tissue sample, with the acceptance of the results being based on recovery and precision. In the case of recovery, the results were accepted in the range of ±20% of the value of the added concentration, while in the case of precision, the results were accepted if they were ≤10% of the added concentration.
3. Results and Discussion
3.1. Optimization of Sample Preparation
According to the literature data, prior efforts to extract DOX from animal tissue have largely relied on deproteinization using MeOH [14], a mixture of mobile phase components [20], and ACN [26], a mixture of acetone with zinc sulfate [21,29], or 35% perchloric acid [22]. However, LLE was also applied with the use of various solvents, such as a mixture of chloroform and MeOH (9:1 v/v [15] or 4:1, v/v) [24] or chloroform and isopropanol (1:1 v/v) [23].
The literature also contains reports detailing the use of SPE with C18 (100 mg) columns to extract DOX from animal tissue. This procedure enabled the extraction of DOX from rabbit eye tissue with an efficiency range of 83.5 to 96.3%, as well as analyte separation within the total analysis time of 14 min and UV detection at 234 nm wavelength [27]. Moreover, SPME was also applied for the determination of DOX in lung tissue samples with extraction being carried out with a standard phosphate-buffered saline (PBS) solution and surrogate lamb lung tissue samples for 20 min. The extracted analytes were then desorbed in a mixture of ACN/water (80:20, v/v) with 0.1% formic acid for 60 min [28].
Unfortunately many previously reported methods for quantifying DOX in tissue samples are hampered by limitations, including high limits of detection (LODs) (>0.01 µg/g) [21,24,29] or unreported LOD data [14,15,25] and high limits of quantification (LOQ) (>0.02 µg/g) [14,15,21,24,25,28,29]. Moreover, these methods also tend to suffer from long chromatographic separation times (more than 10 min) [21,22,25,27,29] and low extraction efficiencies [14,15,23] (or do not report these data [22,29]). Some of them were developed for determination of DOX in specific tissue samples such as rat arthritic ankle joints [14], rabbit ocular tissues [27], or pig lung tissue [28,29]. Hence, it is critical to optimize any new method for quantifying DOX in various types of animal tissues that can be used to monitor the biodistribution of this drug during the development of targeted anticancer therapies.
Therefore, in this study, we tested three different extraction procedures—namely, deproteinization, LLE, and SPE—for their ability to extract DOX from various type of rat tissue samples (liver, kidney, stomach, lung, heart, spleen) while using DAU as the IS. Prior to the extraction via deproteinization and LLE, all samples were mechanically homogenized for 2 min with 0.5 mL of physiological salt. Next, selected deproteinizing/eluting agents that were previously used to isolate DOX from plasma and urine [32] were tested to evaluate how the matrix’s physicochemical characteristics influence analyte extraction efficiency. The tested procedures were then evaluated with respect to their absolute extraction rates, which were calculated by comparing the area of the DOX peak at 5 and 10 µg/g, as well as the IS at 10 µg/g, obtained for extractions from 200 mg of animal tissue against those calculated for the samples not undergoing extraction at the same analyte concentration level. Therefore, four deproteinizing agents, i.e., pure ACN, pure MeOH, a mixture of ACN and MeOH (1:1, v/v), and 3% trichloroacetic acid (TCA) in ACN were used for the extraction of DOX and DAU from rat tissue samples. In each sample preparation protocol the extraction absolute results were comparable independent from the type of rat tissue sample tested. The representative data obtained for rat liver tissue samples are shown in Table 1. As it can be seen, 3% TCA in ACN was the least effective solvent (10.6 ± 1.9% for DOX and 14.5 ± 2.2% for DAU), while improved efficiency for both analytes was observed with the use of MeOH (42.4 ± 4.4 and 61.5 ± 4.4% for DOX and DAU, respectively). The use of a mixture of ACN and MeOH at a ratio of 1:1 (v/v) improved the recoveries of both analytes (48.6 ± 3.8% and 64.6 ± 4.0% for DOX and DAU, respectively). However, the best efficiency was achieved with pure ACN, which yielded absolute recoveries of 52.8 ± 4.2 and 71.7 ± 3.9% for DOX and DAU, respectively. It should be noted that these data are consistent with those that reported concerning DOX extraction from plasma and urine samples [32], although the parameters in this study were lower than those previously calculated for plasma (approximately 5–8%) and urine (approximately 15–18%). Next, LLE procedures using ethyl acetate, dichloromethane (DCHM), and a mixture of chloroform and MeOH (4:1, v/v) were tested. As shown in Table 1, DCHM was the least effective extraction agent (2.8 ± 1.0 and 10.5 ± 1.5% for DOX and DAU, respectively). This result was somewhat surprising, as DCHM was previously found to be an effective solvent for the isolation of DOX from plasma and urine samples (approximately 17 and 20× times higher extraction efficiency was calculated for DOX from plasma and urine after using DCHM than tissue samples, respectively) [32]. Ethyl acetate offered better results, but the mixture of chloroform and MeOH provided the greatest recoveries (49.3 ± 12.0 and 64.6 ± 13.6% for DOX and DAU, respectively). These values were comparable to those reported for plasma [17,32], though they were slightly lower than the levels previously reported for urine [32]. However, the most significant disadvantage of the LLE protocol utilizing chloroform was the high volatility of this organic solvent that significantly affected the analyte extraction results. This analytical problem was also noted in our previous study [32]. In summary, a comparison of the data revealed that among the tested deproteinization and LLE procedures, the use of ACN as the deproteinizing agent was the most optimal, in addition this procedure was simple and fast. Nonetheless, the ACN-based deproteinization provided efficiency only at the levels of 52.8 ± 4.2 and 71.7 ± 3.9% for DOX and the IS, respectively, as well as low sample purification. Thus, this procedure may be inadequate for pharmaceutical and clinical applications that require the determination of target analytes at low concentrations in complex biological matrices, such as tissue. As such, further experiments were conducted to assess the ability of SPE to extract DOX from rat tissue samples. It is worth noting that the literature only contains reports of SPE with the use of a C18 column [27]. In this study, we tested three types of SPE columns, i.e., HLB (30 mg), SOLA HRP (10 mg), and C18 (40 mg), to analyze the extraction efficiency of DOX in each approach. All three columns were tested under the experimental conditions described in Section 2.5.2. Briefly, physiological salt was used for tissue homogenization and matrix modification prior to SPE, with water and MeOH being used as the washing and eluting solvents, respectively. The best results were obtained when using the HLB sorbents (25.3 ± 1.5 and 40.6 ± 2.3% for DOX and DAU, respectively) (Table 1). These values were slightly higher than those obtained with the C18 stationary phase, while the poorest results were observed with the HPR SOLO column (18.7 ± 1.5 and 30.4 ± 2.9% for DOX and DAU, respectively). Therefore, the HLB column was selected for use in subsequent experiments. However, it should be noted that these results were significantly lower than those obtained with ACN as the deproteinizing agent and also those reported for DOX extraction from the plasma [17,32] and urine samples [32]. Therefore, we decided to investigate whether other matrix-modification measures prior to SPE—aside from the use of physiological salt—could improve the efficiency of analyte extraction. In particular, we conducted matrix-modification tests using a mixture of 0.9% NaCl and ACN (9:1, v/v), a mixture of 0.1 M HCl and ACN (9:1, v/v), 0.1 M HCl, 0.05 M HCl, and 0.1 M H3PO4 prior to SPE-HLB. The obtained results confirmed that adding ACN to 0.9% NaCl increased the recovery to 38.4 ± 3.3% for DOX and 62.2 ± 5.5% for DAU. The best absolute recoveries were obtained when the rat tissue samples were acidified with 0.1 M HCl (91.6 ± 5.1% for DOX and 95.4 ± 5.5% for DAU). These values were consistent, although slightly lower than those previously reported for DOX extraction from plasma and urine (approximately 6 and 4% for DOX and DAU, respectively) [32]. It was also observed that the addition of ACN to 0.1 M HCl did not improve SPE’s extraction efficiency for DOX and DAU from rat tissue (70.2 ± 5.9% for DOX and 76.5 ± 5.8% for DAU). Next, we explored whether the use of various washing agents—namely, ACN in water (1:9, v/v), MeOH in water (1:9, v/v), ACN and MeOH in water (0.5:0.5:9, v/v/v), and 0.01 M HCl—could improve sample purification without resulting in analyte loss during the SPE procedure. The data indicated that comparable purification and extraction efficiencies were obtained with the MeOH:water and ACN:water mixtures, as well as with the MeOH:ACN:water solution.
The least effective washing agent was 0.01 M HCl (69.6 ± 6.8 and 85.4 ± 5.5% for DOX and DAU, respectively). Ultimately, water was selected as the best solvent for the purification of tissue samples prior to SPE utilizing HLB sorbents.
Furthermore, various eluting solvents, including pure ACN, an ACN:MeOH mixture (1:1, v/v), and all of the above-mentioned solvents acidified to pH 3.5, were tested for the extraction of DOX from tissue samples, with 0.1 M HCl and water being used as the sample matrix modifier and washing agent, respectively. As shown in Table 1, the absolute recoveries ranged from 67.4 ± 4.9 to 77.9 ± 7.9% for DOX and 81.4 ± 5.5–86.7 ± 5.8% for DAU. Thus, the acidification of MeOH and ACN did not improve analyte recovery. In the end, pure MeOH was selected as the best analyte elution reagent for SPE utilizing HLB columns. These data are consistent with previously published data for the extraction of DOX from plasma and urine samples [32].
To summarize, HLB-based SPE with sample acidification using 0.1 M HCl, washing with 1 mL of water, and 2 mL of MeOH as the eluting agent guaranteed the highest absolute extraction results for DOX from rat tissue samples. It is worth noting here that to the best of our knowledge, the above-described DOX extraction procedure has not been documented in the literature to date. Indeed, the developed procedure is highly novel, as HLB-based SPE cartridges have hitherto only been applied for plasma and urine samples [32]. The extraction recoveries for both analytes using the developed SPE-HLB procedure were 91.6 ± 5.1% for DOX and 95.4 ± 5.5% for DAU for rat liver samples. For other tissue samples, these parameters ranged from 89.2 ± 6.2% (spleen) to 92.8 ± 4.3% (kidney) for DOX and from 93.9 ± 5.9% (spleen) to 97.1 ± 4.4% (kidney) for DAU, respectively. Overall, the SPE-based sample preparation protocol along with LC separation provided comparable extraction efficiency for all analyzed rat tissue samples (liver, kidney, stomach, lung, heart, spleen).
As mentioned in the Introduction, most LC-based methods applied for the determination of DOX in tissue samples were coupled to an FL detector with an excitation wavelength range of 470–490 nm and an emission range of 550–590 nm [14,15,21,22,25,29]. Moreover, MS/MS detectors [20,23,26,28] and an UV detectors [24,27] were also used. In the present study, we quantified DOX in rat tissue samples using an LC-FL method adopted (with some modifications) from previous studies focused on the analysis of DOX in plasma [17,32] and urine samples [32]. FL detection is commonly applied to monitor DOX in biological matrices due to the natural fluorescence of this drug, which enables significantly lower limits of detection (LOD) and limits of quantification (LOQ) compared to UV detection. Furthermore, FL detectors can provide LODs and LOQs for DOX that are comparable to those obtained by MS or MS/MS. It is also important to note that in contrast to MS and MS/MS, FL detectors are affordable, easy to use, and are basic equipment found in many laboratories. Therefore, the LC separation of DOX in rat tissue samples was performed using the chromatographic conditions described in Section 2.2 after sample-preparation with the SPE protocol reported in Section 2.5.2. Next, the developed SPE-LC-FL protocol was validated on liver tissue samples in accordance with FDA and ICH requirements [30,31] based on the calculated calibration curve, linearity, LOD, LOQ, selectivity, precision, accuracy, and stability.
3.2. Validation of SPE-LC-FL Method
Validation of the developed SPE-LC-FL method was based on internal standard (IS), and for this proposal, epirubicin, idarubicin, and DAU (Figure 1B), each in the form of hydrochloric acid, were tested as potential IS. These substances belong to the group of anthracycline drugs and have similar physicochemical properties to DOX; however, those compounds are never used concomitantly during cancer pharmacotherapy to avoid the occurrence of serious side effects. Ultimately, DAU was selected as IS because of the higher analyte signal and a retention time of this compound that was different from DOX retention time, which allowed us to shorten the overall analysis time to 8 min. The experimental data obtained in this study are consistent with previously published data, where DAU was used as the IS for DOX determination in animal tissue samples [14,20,21,22,23,27,29].
3.2.1. Selectivity
The SPE-LC-FL protocol’s selectivity was defined by analyzing blank tissue samples and samples spiked with DOX and the IS to verify for interfering peaks (n = 6).
The acquired chromatograms, shown in Figure 2A,B, showed that the signal peaks from endogenous compounds in the tissues were not interferences between the peaks from DOX and the IS. This confirms that the developed SPE-LC-FL protocol is selective.
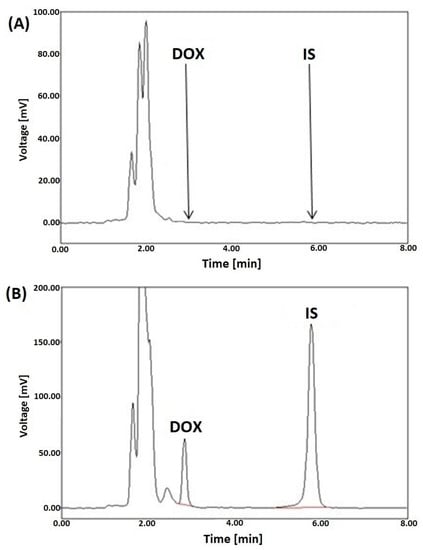
Figure 2.
Representative LC-FL chromatograms of blank rat liver plasma extracts (A), a liver sample spiked with DOX (5 µg/g) and DAU (IS) at a concentration of 10 µg/g (B), after SPE utilizing HLB columns.
3.2.2. Linearity
To evaluate the method’s linearity, liver tissue samples were spiked with working standard solutions of DOX to obtain end concentrations of 0.1, 0.5, 1, 2, 5, 7.5, 10, 15, 20, 25, and 30 µg/g, and with the IS to achieve a level of 10 µg/g. Next, extractions were performed on each sample according to the method described in Section 2.5., and the concentrations were calculated based on the corresponding calibration curve. The obtained data are presented in Table 2. The developed SPE-LC-FL method’s linearity was confirmed in the range 0.1–30 µg/g, with a correlation coefficient better than 0.9996.
Table 2.
Summary of validation data for the extraction of DOX from rat tissue samples by SPE-LC-FL method (n = 6).
3.2.3. Limit of Detection (LOD) and Limit of Quantification (LOQ)
The LOD was defined as the sample concentration at which the sample signal was three times higher than the background noise level. In this investigation, the LOD was found to be 0.005 µg/g (n = 6) (Table 2).
The lower limit of quantification (LLOQ) was defined as the lowest concentration at which the signal’s magnitude was 10 times that of the background noise, the precision was <15%, and the accuracy was between 80–120%. In this investigation, the LLOQ was found to be 0.01 µg/g (n = 6).
3.2.4. Precision and Accuracy
To calculate the precision and accuracy of the SPE-LC-FL protocol, six replicates of LLOQ and QC samples at low (LOQ), medium (MOQ), and high (HOQ) concentrations of DOX (5, 10 and 15 µg/g) and IS at 10 µg/g were analyzed on the same day (intra-day assay) and different days over a 2-month period (inter-day assay) (n = 6). Precision was calculated as percentage of the standard deviation (RSD%), while accuracy was expressed as the percentage difference between the concentrations determined for the calibration samples and the nominal concentrations. The obtained data are shown in Table 3.
Table 3.
Intra-day and inter-day precision and accuracy for the quantification of DOX in rat liver tissue samples via the developed SPE-LC-FL method (n = 6).
3.2.5. Stability Study
The method’s stability was tested by applying it in triplicate to analyze DOX in liver tissue samples at low, medium, and high QC concentrations. The method’s stability was also evaluated under different conditions: short-term stability after storage at room temperature for 8 h; long-term stability after being frozen at −80 °C for 3 months; freeze/thaw stability after three cycles from −80 °C to room temperature; and after post-preparative storage at 4 °C for 24 h. The data indicated that DOX and the IS remained stable in the tissues samples under each of the tested storage conditions (Table 4).
Table 4.
Stability of DOX in rat liver tissue samples under various conditions (mean ± SD, n = 3).
3.3. Application of the Developed Method in Rat Tissue Samples
The developed SPE-LC-FL method was tested using different rat tissue samples (liver, kidney, stomach, lung, heart, spleen) that were spiked with DOX to final tissue concentrations of 2, 10, and 20 µg/g. Three replicates were performed for each tested type of tissue sample. For comparison, blank samples were also prepared and analyzed.
Representative LC-FL chromatograms of the selected rat tissue samples (spleen, kidney and heart) spiked with DOX at the concentration of 2, 10, and 20 µg/g, respectively, and DAU (IS) added to each of the samples at a level of 10 µg/g are shown in Figure 3.
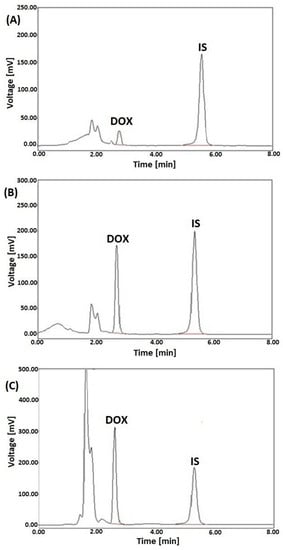
Figure 3.
Representative LC-FL chromatograms of rat extracts of spleen (A), kidney (B), and heart (C) spiked with DOX at the 2, 10, and 20 µg/g, respectively, and DAU (IS) at a concentration of 10 µg/g, after SPE with HLB columns.
The results, summarized in Table 5, confirm that no signals at the retention time of DOX and IS were observed for the blank rat tissue samples. All results obtained for the samples spiked with DOX met the adopted criteria for recovery (i.e., within the range of 80–120%) and precision (i.e., <±10% of RSD).
Table 5.
Measurement of DOX in different rat tissue samples (n = 3 for each tested tissue sample).
Overall, these results confirmed the LC-FL method’s usefulness and its viability as an interesting alternative to pre-existing protocols for pharmacokinetic studies and clinical investigations aimed at quantifying DOX in tissue samples.
4. Conclusions
In this work, various configurations of the three most commonly applied extraction techniques (deproteinization, LLE, and SPE) were tested and compared for their ability to extract DOX and the internal standard, DAU, from six different rat tissues. In doing so, we considered the advantages and disadvantages of each tested protocol and their potential applications in clinical practice. Protein precipitation with acetonitrile was found to be the most effective extraction method among the tested deproteinization and LLE protocols. Although this procedure proved to be simple and fast, it offered lower analyte extraction compared to SPE using HLB columns and matrix modification with 0.1 M HCl. Therefore, HLB-SPE was selected as the most effective sample-preparation approach for extraction of DOX from various rat tissue samples. The main limitation of the present SPE procedures was lack of other, commercially available SPE columns that could be tested in this study. Ultimately, the HLB-SPE protocol was coupled with LC-FL separation and detection, and the resultant method was validated in accordance with FDA and ICH requirements. The validation results confirmed that the developed procedure met all required criteria for bioanalytical methods. The developed SPE-LC-FL protocol is fast, accurate, and precise and can be considered an interesting alternative to pre-existing studies for pharmacokinetic studies and clinical investigations aimed at the quantification of DOX and its distribution in different tissues. Overall, the selected procedure not only facilitates precise analysis of the concentration of DOX after its systemic administration to the organism but also provides a tool to monitor the biodistribution of this drug in various types of tissues, which may be helpful in targeted anticancer therapy. Next, the proposed SPE-LC-FL methodology will be implemented in the analysis of real rat tissue samples after the systemic administration of liposomal forms of DOX in order to prove the future usefulness of the developed method in routine clinical practice.
Author Contributions
Conceptualization, A.P. and O.M.; methodology, O.M., A.P. and N.T.; software, A.P., O.M. and P.K.; validation, O.M., A.P. and A.R.; formal analysis, A.P., O.M. and I.O.; investigation, A.P., O.M. and A.R.; resources, A.P. and O.M.; data curation, A.P.; writing—original draft preparation, O.M., A.P. and N.T.; writing—review and editing, O.M., A.P., I.O., P.K. and A.R.; visualization, A.P. and O.M.; supervision, A.P.; project administration, A.P. and T.B.; funding acquisition, A.P. and T.B. All authors have read and agreed to the published version of the manuscript.
Funding
Publication of this article was supported by the project, POWR.03.05.00-00-z082/18, co-financed by the European Union through the European Social Fund under the Operational Programme Knowledge Education Development 2014–2020.
Data Availability Statement
Not applicable.
Conflicts of Interest
The authors declare no conflict of interest.
References
- Cortés-Funes, H.; Coronado, C. Role of anthracyclines in the era of targeted therapy. Cardiovasc. Toxicol. 2007, 7, 56–60. [Google Scholar] [CrossRef]
- Carvalho, C.; Santos, R.X.; Cardoso, S.; Correia, S.; Oliveira, P.J.; Santos, M.S.; Moreira, P.I. Doxorubicin: The Good, the Bad and the Ugly Effect. Curr. Med. Chem. 2009, 16, 3267–3285. [Google Scholar] [CrossRef]
- Pedrycz, A.; Kramkowska, A. Adriamycin—efficacy and possible adverse effects. Curr. Probl. Psychiatry 2016, 17, 38–46. [Google Scholar] [CrossRef]
- Minotti, G.; Menna, P.; Salvatorelli, E.; Cairo, G.; Gianni, L. Anthracyclines: Molecular Advances and Pharmacologic Developments in Antitumor Activity and Cardiotoxicity. Pharmacol. Rev. 2004, 56, 185–229. [Google Scholar] [CrossRef]
- Staples, B.J.; Pitt, W.G.; Roeder, B.L.; Husseini, G.A.; Rajeev, D.; Schaalje, G.B. Distribution of Doxorubicin in Rats Undergoing Ultrasonic Drug Delivery. J. Pharm. Sci. 2010, 99, 3122–3131. [Google Scholar] [CrossRef]
- Schaupp, C.M.; White, C.C.; Merrill, G.F.; Kavanagh, T.J. Metabolism of doxorubicin to the cardiotoxic metabolite doxorubicinol is increased in a mouse model of chronic glutathione deficiency: A potential role for carbonyl reductase 3. Chem. Interactions 2014, 234, 154–161. [Google Scholar] [CrossRef]
- Reis-Mendes, A.F.; Sousa, E.; de Lourdes Bastos, M.; Costa, V.M. The Role of the Metabolism of Anticancer Drugs in Their Induced-Cardiotoxicity. Curr. Drug Metab. 2015, 17, 75–90. [Google Scholar] [CrossRef]
- Al-Malky, H.S.; Al Harthi, S.E.; Osman, A.-M.M. Major obstacles to doxorubicin therapy: Cardiotoxicity and drug resistance. J. Oncol. Pharm. Pract. 2020, 26, 434–444. [Google Scholar] [CrossRef]
- Renu, K.; Abilash, V.G.; Tirupathi Pichiah, P.B.; Arunachalam, S. Molecular mechanism of doxorubicin-induced cardiomyopathy–An update. Eur. J. Pharmacol. 2018, 818, 241–253. [Google Scholar] [CrossRef]
- Pugazhendhi, A.; Edison, T.N.J.I.; Velmurugan, B.K.; Jacob, J.A.; Karuppusamy, I. Toxicity of Doxorubicin (Dox) to different experimental organ systems. Life Sci. 2018, 200, 26–30. [Google Scholar] [CrossRef]
- Anders, C.K.; Adamo, B.; Karginova, O.; Deal, A.M.; Rawal, S.; Darr, D.; Schorzman, A.; Santos, C.; Bash, R.; Kafri, T.; et al. Pharmacokinetics and Efficacy of PEGylated Liposomal Doxorubicin in an Intracranial Model of Breast Cancer. PLoS ONE 2013, 8, e61359. [Google Scholar] [CrossRef]
- Massing, U.; Fuxius, S. Liposomal formulations of anticancer drugs: Selectivity and effectiveness. Drug Resist. Updat. 2000, 3, 171–177. [Google Scholar] [CrossRef]
- Zorić, L.; Drinković, N.; Micek, V.; Frkanec, L.; Türeli, A.E.; Günday-Türeli, N.; Vrček, I.V.; Frkanec, R. High-Throughput Method for the Simultaneous Determination of Doxorubicin Metabolites in Rat Urine after Treatment with Different Drug Nanoformulations. Molecules 2022, 27, 1177. [Google Scholar] [CrossRef]
- Niu, H.; Xu, M.; Li, S.; Chen, J.; Luo, J.; Zhao, X.; Gao, C.; Li, X. High-Performance Liquid Chromatography (HPLC) Quantification of Liposome-Delivered Doxorubicin in Arthritic Joints of Collagen-Induced Arthritis Rats. Med Sci. Monit. Basic Res. 2017, 23, 150–158. [Google Scholar] [CrossRef]
- Alhareth, K.; Vauthier, C.; Gueutin, C.; Ponchel, G.; Moussa, F. HPLC quantification of doxorubicin in plasma and tissues of rats treated with doxorubicin loaded poly(alkylcyanoacrylate) nanoparticles. J. Chromatogr. B 2012, 887–888, 128–132. [Google Scholar] [CrossRef]
- Ma, W.; Wang, J.; Guo, Q.; Tu, P. Simultaneous determination of doxorubicin and curcumin in rat plasma by LC–MS/MS and its application to pharmacokinetic study. J. Pharm. Biomed. Anal. 2015, 111, 215–221. [Google Scholar] [CrossRef]
- Daeihamed, M.; Haeri, A.; Dadashzadeh, S. A Simple and Sensitive HPLC Method for Fluorescence Quantitation of Doxorubicin in Micro-volume Plasma: Applications to Pharmacokinetic Studies in Rats. Iran. J. Pharm. Res. 2015, 14, 33–42. [Google Scholar] [CrossRef]
- Huq, M.; Tascon, M.; Nazdrajic, E.; Roszkowska, A.; Pawliszyn, J. Measurement of Free Drug Concentration from Biological Tissue by Solid-Phase Microextraction: In Silico and Experimental Study. Anal. Chem. 2019, 91, 7719–7728. [Google Scholar] [CrossRef]
- Sikora, T.; Morawska, K.; Lisowski, W.; Rytel, P.; Dylong, A. Application of Optical Methods for Determination of Concentration of Doxorubicin in Blood and Plasma. Pharmaceuticals 2022, 15, 112. [Google Scholar] [CrossRef]
- Al-Abd, A.; Kim, N.H.; Song, S.-C.; Lee, S.J.; Kuh, H.-J. A simple HPLC method for doxorubicin in plasma and tissues of nude mice. Arch. Pharmacal Res. 2009, 32, 605–611. [Google Scholar] [CrossRef]
- Urva, S.R.; Shin, B.S.; Yang, V.C.; Balthasar, J.P. Sensitive high performance liquid chromatographic assay for assessment of doxorubicin pharmacokinetics in mouse plasma and tissues. J. Chromatogr. B 2009, 877, 837–841. [Google Scholar] [CrossRef]
- Arnold, R.D.; Slack, J.E.; Straubinger, R.M. Quantification of Doxorubicin and metabolites in rat plasma and small volume tissue samples by liquid chromatography/electrospray tandem mass spectroscopy. J. Chromatogr. B 2004, 808, 141–152. [Google Scholar] [CrossRef]
- Mazzucchelli, S.; Ravelli, A.; Gigli, F.; Minoli, M.; Corsi, F.; Ciuffreda, P.; Ottria, R. LC-MS/MS method development for quantification of doxorubicin and its metabolite 13-hydroxy doxorubicin in mice biological matrices: Application to a pharmaco-delivery study. Biomed. Chromatogr. 2017, 31, e3863. [Google Scholar] [CrossRef]
- Zhang, C.; Wu, Y.; Dong, Y.; Xu, H.; Zhao, L. Quantification of DOX bioavailability in biological samples of mice by sensitive and precise HPLC assay. Pharm. Biol. 2016, 54, 55–61. [Google Scholar] [CrossRef] [PubMed]
- Zhang, R.X.; Chen, K.; Cheng, J.; Lai, P.; Rauth, A.M.; Pang, K.S.; Wu, X.Y. Sample Extraction and Simultaneous Chromatographic Quantitation of Doxorubicin and Mitomycin C Following Drug Combination Delivery in Nanoparticles to Tumor-bearing Mice. J. Vis. Exp. 2017, 128, e56159. [Google Scholar] [CrossRef]
- Ibsen, S.; Su, Y.; Norton, J.; Zahavy, E.; Hayashi, T.; Adams, S.; Wrasidlo, W.; Esener, S. Extraction protocol and mass spectrometry method for quantification of doxorubicin released locally from prodrugs in tumor tissue. Biol. Mass Spectrom. 2013, 48, 768–773. [Google Scholar] [CrossRef]
- Hu, T.; Le, Q.; Wu, Z.; Wu, W. Determination of doxorubicin in rabbit ocular tissues and pharmacokinetics after intravitreal injection of a single dose of doxorubicin-loaded poly-β-hydroxybutyrate microspheres. J. Pharm. Biomed. Anal. 2007, 43, 263–269. [Google Scholar] [CrossRef]
- Roszkowska, A.; Tascon, M.; Bojko, B.; Goryński, K.; dos Santos, P.R.; Cypel, M.; Pawliszyn, J. Equilibrium ex vivo calibration of homogenized tissue for in vivo SPME quantitation of doxorubicin in lung tissue. Talanta 2018, 183, 304–310. [Google Scholar] [CrossRef]
- Kümmerle, A.; Krueger, T.; Dusmet, M.; Vallet, C.; Pan, Y.; Ris, H.; A Decosterd, L. A validated assay for measuring doxorubicin in biological fluids and tissues in an isolated lung perfusion model: Matrix effect and heparin interference strongly influence doxorubicin measurements. J. Pharm. Biomed. Anal. 2003, 33, 475–494. [Google Scholar] [CrossRef]
- Guy, R. International Conference on Harmonisation. Encycl. Toxicol. Third Ed. 2014, 2, 1070–1072. [Google Scholar] [CrossRef]
- U.S. Department of Health and Human Services Food and Drug Administration. Bioanalytical Method Validation Guidance for Industry. US Dep. Health Hum. Serv. Food Drug Adm. 2018, 1–41. Available online: https://www.fda.gov/files/drugs/published/Bioanalytical-Method-Validation-Guidance-for-Industry.pdf (accessed on 25 January 2020).
- Maliszewska, O.; Plenis, A.; Olędzka, I.; Kowalski, P.; Miękus, N.; Bień, E.; Krawczyk, M.A.; Adamkiewicz-Drożynska, E.; Bączek, T. Optimization of LC method for the quantification of doxorubicin in plasma and urine samples in view of pharmacokinetic, biomedical and drug monitoring therapy studies. J. Pharm. Biomed. Anal. 2018, 158, 376–385. [Google Scholar] [CrossRef] [PubMed]


Disclaimer/Publisher’s Note: The statements, opinions and data contained in all publications are solely those of the individual author(s) and contributor(s) and not of MDPI and/or the editor(s). MDPI and/or the editor(s) disclaim responsibility for any injury to people or property resulting from any ideas, methods, instructions or products referred to in the content. |
© 2022 by the authors. Licensee MDPI, Basel, Switzerland. This article is an open access article distributed under the terms and conditions of the Creative Commons Attribution (CC BY) license (https://creativecommons.org/licenses/by/4.0/).