Abstract
Apigenin (API) has many biological activities, but its poor solubility limits its clinical application. In this research, API nanoparticles were prepared by the liquid antisolvent precipitation (LAP) technique, which effectively improved the solubility and bioavailability of API. Through the design of a single-factor test, the effects of the type and dosage of surfactants, API concentration, the antisolvent to solvent volume ratio, the speed and time of stirring, the temperature of precipitation, and the dropping speed on the MPS (mean particle size) of API nanosuspension were carried out. The optimum technological conditions were determined as follows: 5 mg/mL of tween 80 as a surfactant, 20 mg/mL of API, an antisolvent/solvent volume ratio of 10, a 1200 r/min stirring speed for 5 min, a 45 °C precipitation temperature, and a 1 mL/min dropping speed. Under the optimum conditions, we obtained API nanosuspension with 170.5 nm MPS and then it was freeze-dried to obtain the API nanoparticles. Moreover, we characterized the API nanoparticles by SEM, FTIR, XRD, DSC, and TG. Results showed that although API nanoparticles transformed into an amorphous form, their internal chemical structure had not been changed and had a higher solubility. Finally, API nanoparticles’ anti-inflammatory activities were evaluated by observing the effect of API on nitric oxide (NO) production and IL-10 production toward RAW264.7 cells induced by lipopolysaccharide (LPS). Moreover, the anti-tumor effect of API was determined by testing cell viability and apoptosis. The results suggested that API nanoparticles exhibited much better anti-inflammatory and anti-tumor activities compared to raw API.
1. Introduction
The compound 4′,5,7-trihydroxyflavone, commonly referred to API (apigenin), is one of the most studied and abundant flavonoids, with molecular structure C15H10O5 and molecular mass 270.24 g mol−1 (Figure 1) [1]. Researchers found that in a variety of fruits and vegetables, the amount of API is very large; for example, celery, oranges, chamomile, parsley, onions, honey, thyme, and spices, as well as tea, beer, wine, and beverages derived from plants [2,3]. Customarily in traditional medicine and herbal supplements, API has various pharmacological effects, including anti-inflammatory activities [4], free radical scavenging activities [5], Alzheimer’s disease (AD) inhibition activities [6], and anti-cancer activities, including pancreas [7], lung [8], colon [9], prostate [10], breast [11], skin [12], and Cholangiocarcinoma [13]. Unfortunately, because of API’s low lipid (0.001–1.63 mg/mL in nonpolar solvents) and water (2.16 μg/mL in water) [14] solubility, the oral bioavailability of API is relatively low. API is soluble in DMSO (dimethyl sulfoxide) or DMF (N,N-dimethylformamide), slightly soluble in hot ethanol, and insoluble in water, which limits its clinical development severely. To improve apigenin’s bioavailability, it is necessary to develop new formulations or technologies [15].
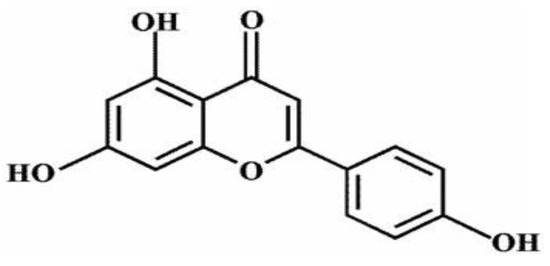
Figure 1.
Apigenin’s chemical structure.
Recent studies show that micronization or size reduction is one of the effective formulation strategies to enhance the dissolution rate and solubility of poorly water-soluble drugs [16,17,18]. More and more extensive attention has been paid to the preparation of nanoparticles to improve the solubility of API, such as mesoporous silica nanoparticles [19], supercritical antisolvent technology [20,21], liposomes [22], polymeric micelles [23], solid dispersion [24], API-loaded sodium hyaluronate nano-assemblies [25], and so on. Because of the need for a large number of carrier materials, or large instruments and equipment, these nano-preparation strategies usually had many problems, including wasted energy, lower productivity, and higher production cost. In this experiment, the liquid antisolvent precipitation (LAP) method was adopted and this technology has many advantages, such as simple process equipment, convenient operation, easy control, low cost, high yield, and so on. LAP is a promising technique to change the crystal forms of drugs or produce ultra-fine particles by controlling the nucleation and crystal growth of these drugs [26]. Therefore, the crystal form of the drug was changed by using the LAP method so that the solubility of the drug was improved and the nanoparticles’ size was reduced.
In this paper, in order to improve API’s solubility, API nanoparticles were prepared by the LAP technique. In addition, this study evaluated the anti-inflammatory and anti-cancer activities of API and provided data support for its further application in the development of pharmaceutical products.
2. Materials and Methods
2.1. Materials and Reagents
Apigenin (≥98%) for the preparation of nanoparticles was obtained from Nanjing Chunqiu Bioengineering Co., Ltd. (Nanjing, China). Tween 80, DMSO (dimethyl sulfoxide), 2-hydroxy HP-β-CD (hydroxy propyl-β-cyclodextrin), MTT (3-[4,5-dimethylthiazole-2-yl]-2,5-diphenyltrtrazolium bromide), and LPS (lipopolysaccharide) were purchased from Sigma-Aldrich (St. Louis, MO, USA). DMEM (Dulbecoo’s modified Eagle’s medium) was obtained from Beijing Solarbio Science and Technology Co., Ltd. (Beijing, China). DXM (Dexamethasone) was bought from Guangzhou Huao Chemical Co., Ltd. (Guangdong, China). FBS (fetal bovine serum) was purchased from Gemini Ltd. (New York, NY, USA). A NO (nitric oxide) assay kit was gained from Beyotime Biotechnology Co., Ltd. (Jiangsu, China). ELISA kits of IL-10 and Annexin-V-FITC apoptosis detection kits were bought from BOSTER Biological Technology Co., Ltd. (Wuhan, China). Deionized water was prepared by Hitech-K Flow Water Purification System (Hitech Instruments Co., Ltd., Shanghai, China).
2.2. API Nanoparticles Preparation
The methods in Section 2.2, Section 2.3, Section 2.4, Section 2.4.1, Section 2.4.2, Section 2.4.3, Section 2.4.4, Section 2.5, Section 2.5.1, Section 2.5.2 and Section 2.5.3 were mostly applied according to Wu et al. [27]. The LAP technology was used to prepare API nanoparticles, DMSO was used as a solvent and deionized water as an antisolvent, and the particles were freeze-dried. The specific operations began by accurately weighing a certain amount of API and dissolving it in DMSO at room temperature. To precipitate nanoparticles, we injected the API solution into the aqueous solution containing tween 80 under magnetic stirring at a constant temperature for a period of time, then centrifuged the nanosuspension obtained at 12,500 rpm for 10 min and washed them twice with a small amount of deionized water containing tween 80 to remove the DMSO completely. Then, the freshly formed nanoparticles were re-dispersed with a certain amount of HP-β-CD as cryoprotectants in deionized water. At last, we used the lyophilizer at −50 °C for 64 h to obtain the API nanoparticles. The experimental process was illustrated in Figure 2.
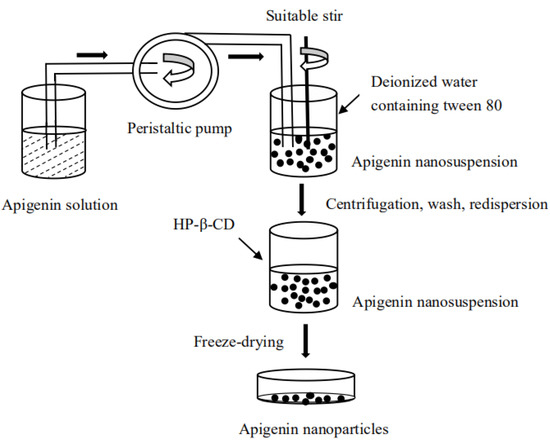
Figure 2.
Diagram of apigenin nanoparticles’ preparation process.
2.3. Optimization of API Nanoparticles’ Preparation Process
The API nanoparticles’ MPS in the LAP procedure can be affected by several experimental variables, such as API concentration, surfactant type and adding amount, the volume ratio of antisolvent/solvent, stirring speed and time, precipitation temperature, and dropping speed. To obtain the optimal operating conditions, the single-factor experiment was used to study the effects of various factors on the API nanoparticles’ MPS. Through previous experiments, we selected tween 80, PEG-400, and poloxamer 188 as a surfactant at 1–5 mg/mL, and the API concentration was at 5–40 mg/mL. We investigated the volume ratio of antisolvent/solvent at 3–20, which had a stirring speed of 400–2000 r/min and a stirring time of 5–60 min, a precipitation temperature of 15–55 °C, and a dropping speed of 1–6 mL/min, respectively. Finally, according to the smallest MPS, we obtained the optimal conditions of each factor. We measured the MPS by Zeta PALS through the dynamic laser light scattering technique (Brookhaven, NY, USA). Then, we repeated each experiment at least three times. Table S1 summarized the factors and their levels investigated.
In addition, when the API nanosuspension was obtained under the preliminary conditions, the type of cryoprotectant and adding amount were selected. The optimal conditions were determined by HPLC. Section 2.5.1 described the analysis conditions. Each sample was analyzed in triplicate.
2.4. API Nanoparticles’ Characterization
2.4.1. SEM Observation
Morphological structures of raw API and API nanoparticles were obtained using an SEM (scanning electron microscope, JSM-7500F, JEOL, Tokyo, Japan). Firstly, we mounted the samples on the SEM stubs using double-sided adhesive tape and coated a thin layer of gold and then observed the morphology.
2.4.2. FTIR
FTIR spectroscopy (Shimadzu Corporation, Kyoto, Japan) was used to investigate the molecular structures of the samples. The wavenumber ranged from 400 to 4000 cm−1 with a 2 cm−1 resolution. Then, diluted all samples were with a 1% KBr mixing powder and were pressed into transparent slices for analysis.
2.4.3. XRD
An X-ray diffractometer (X’Pert Pro, PANalytical, Almelo, The Netherlands) was used to obtain the X-ray diffraction patterns. Raw API, API nanoparticles, physical mixtures of API with HP-β-CD, and excipients were placed in a glass sample holder. The electricity and voltage using Cu Ka radiation were 40 mA and 35 kV, respectively, with a scan rate of 4 °/min and a step size of 0.02°; we scanned the samples with an angular range from 5° to 60°.
2.4.4. TG and DSC
A thermogravimetric analyzer (TGA, Diamond TG/DTA PerkinElmer, Wellesley, MA, USA) was used to analyze TGA by heating 2–10 mg samples at a temperature ranging from 40 to 600 °C and then performed the experiments with a heating rate of 10 °C/min under a nitrogen atmosphere.
For analysis of the DSC, we heated the samples from 40 to 600 °C at a heating rate of 10 °C/min by using DSC (TA instruments, model, DSC 204, Phoenix, Selb, Germany).
2.5. Study of Saturation Solubility and Dissolution
2.5.1. HPLC Method
The high-performance liquid chromatography (HPLC) of WATERS (Waters Corporation, Milford, MA, USA) with a Diamonsil C18 column (250 mm × 4.6 mm inner diameter, 5 μm, DiKMA Biotechnology Co., Ltd., Guangzhou, China) was used to analyze the API concentration. The mobile phase consisted of 50% water (solvent A), 50% acetonitrile (solvent B), 0.2% phosphoric acid (H3PO4) in an aqueous solution with a flow rate of 1.0 mL/min, and the column temperature was 30 °C. The detection wavelength was set at 270 nm and the injection volume was 10 μL. The experiment was conducted in triplicate.
2.5.2. Saturated Solubility Text
The HPLC method was performed to analyze the saturated solubility of raw API, the physical mixture of API with HP-β-CD, and API nanoparticles. The content of API in each sample was excessive and identical, and was accurately weighed and then dispersed in dialysis bags (MWCO 3500; Sigma, St. Louis, MO, USA) containing dissolution medium (5 mL), respectively. We selected artificial intestinal juice (pH 6.8) and artificial gastric juice (pH 1.2) containing 0.4% tween 80 as the dissolution medium. Then, we immersed dialysis bags in 1000 mL beakers containing 900 mL of dissolution medium in a temperature-controlled shaking water bath (SHZ-B; Shanghai Boxun, Shanghai, China) of 37.0 ± 0.5 °C for 100 r/min. After 48 h, the suspension from the dialysis bag was centrifuged at 12,500 r/min for 10 min. Then, we diluted the supernatant obtained properly and used the HPLC system for further detection. We repeated the experiments three times.
2.5.3. Dissolution Study
The release curves of raw API, the physical mixture of API with HP-β-CD, and API nanoparticles in vitro were detected by the HPLC method. There were two kinds of dissolution mediators in this study, namely, artificial intestinal juice (pH 6.8) and artificial gastric juice (pH 1.2) containing 0.4% tween 80. We dispersed 6.8 mg of raw API, 54.4 mg of a physical mixture of API with HP-β-CD (equivalent to 6.8 mg API), and 54.4 mg of API nanoparticles (equivalent to 6.8 mg API) in a dissolution medium (10 mL) and placed it in a dialysis bag, respectively. Then, we immersed the dialysis bags in 1000 mL beakers containing a 900 mL dissolution medium. We set the solution temperature and paddle speed at 37.0 ± 0.5 °C and 100 r/min, respectively. At 0.05, 0.15, 0.25, 0.5, 1, 1.5, 2, 4, 6, 8, 12, and 24 h, we withdrew 1 mL of the dissolution medium and supplemented it with a dissolution medium at the same volume, then centrifuged the sample obtained at 12,500 r/min for 10 min. Thereafter, we diluted the supernatant obtained and detected the API concentration by the HPLC system. The experiments were conducted in triplicate.
2.6. Anti-Inflammatory Activity Detection
2.6.1. Cell Culture
The RAW264.7 cells (primary the mouse macrophage cell line) were purchased from the Type Culture Collection of the Chinese Academy of Sciences (Shanghai, China) and were cultured in DMEM with 10% FBS, and were placed under a humidified incubator at 37 °C with 5% CO2.
2.6.2. Cell Viability Determined by MTT
The cytotoxicity of the sample in RAW264.7 cells was evaluated through the MTT assay [28]. Briefly, we incubated the RAW264.7 cells (1 × 10⁵ cells/well in 96-well plates) in a 5% CO2 incubator at 37 °C overnight. After 24 h, we discarded the culture medium, and subsequently treated the cells with 100 μL (7.82–125 μg/mL, dissolved by cell-culture medium) of raw API and API nanoparticles for 24 h. Then, we added 20 μL MTT (5 mg/mL in PBS) to each well and they were cultured for 4 h. Finally, we discarded the old medium, put 150 μL DMSO into each well, and oscillated the plates for 10 min. By using an enzyme-labeled instrument, we measured the optical density of each well at a wavelength of 490 nm. This experiment was performed in triplicate and concentrations were tested for six wells of each sample.
2.6.3. NO Production Determination
Firstly, we incubated the RAW264.7 cell in a 96-well plate (1 × 10⁵ cells/well, 200 μL/well) for 24 h. Then, we added LPS (1 μg/mL, 100 μL/well) for 24 h to stimulate the RAW264.7 cells to induce inflammation, and then we discarded the culture medium. Subsequently, we treated the cells with different concentrations of raw API and API nanoparticles, cultured them in a 5% CO2 incubator at 37 °C for 24 h, and used 20 μg/mL dexamethasone (DXM) as a positive control. The content of NO2− in the culture medium was determined by the Griess method. Then, we added 50 μL of the culture medium with the same volume as the Griess reagent and incubated the 96-well plate for 10 min at room temperature. Subsequently, we measured the absorbance at 540 nm on a microboard reader. Finally, we calculated the quantity of nitrite by the standard curve of sodium sulfite.
2.6.4. ELISA Assay for IL-10
According to the manufacturer’s instructions, we measured the production of IL-10 in the culture supernatant by using the quantitative ELISA kit.
2.7. Anti-Tumor Activity Detection
2.7.1. Cell Culture
The HepG2 human hepatoma cells obtained from Harbin Medical University (Harbin, China) were cultured in DMEM (Dulbecco’s modified eagle’s medium) containing 10% FBS (fetal bovine serum), 100 mg/mL streptomycin, and 100 mg/mL of penicillin (Beyotime Institute of Biotechnology, Beijing, China) in a 5% CO2 incubator at 37 °C.
2.7.2. The Effect of API Nanoparticles on the Viability of the HepG2 Cells
We applied an MTT assay to determine the viability of HepG2 cells treated with API and API nanoparticles. Briefly, HepG2 cells with a 1 × 10⁵ cells/mL density were cultured in a 96-well plate and treated with 7.82–125 μg/mL API and API nanoparticles for 24 h. Then, we added 5 mg/mL of the MTT to every well (20 μL/well) and removed the supernatant liquid after culture for 4 h. Finally, we added 150 µL/well DMSO and measured the absorbances at 570 nm with a microplate reader (Bio-Teck, Winooski, VT, USA).
2.7.3. Determination of the Apoptosis Rate of HepG2 Cells by API Nanoparticles
HepG2 cells were cultivated in culture flasks. After 24 h, HepG2 cells were exposed to API and API nanoparticles (the concentrations were 15.63 μg/mL and 62.5 μg/mL, respectively) for 48 h. Then, we determined the apoptosis by an Annexin V-FITC/PI apoptosis kit in terms of the manufacturer’s protocol. Cells were analyzed with a flow cytometer. Each experiment was performed three times and at least 10,000 cells were analyzed in each sample.
3. Results and Discussion
3.1. Optimization Results
Single-factor experiments were carried out to study various factors’ effects on the MPS of API nanoparticles during the LAP process. The specific factors were as follows: the type of surfactant, tween 80 concentration, API concentration, the volume ratio of antisolvent/solvent, stirring speed, stirring time, precipitation temperature, dropping speed, the type of cryoprotectant, and the HP-β-CD amount. In the end, the optimum technological conditions were determined by analysis.
3.1.1. Type and Concentration of Surfactant
For the LAP method, the selection of surfactants is a very important factor for API nanoparticle preparation. Suitable surfactants can effectively reduce the particle size of the nanoparticles and prevent agglomeration [29,30]. The effects of tween 80, PEG-400, and Poloxamer 188 on API nanoparticles were compared in pre-experiments, and tween 80 was finally determined as the surfactant in this experiment. When other factors were fixed, 1, 2, 3, 4, and 5 mg/mL of tween 80 were studied. Figure 3a,b show the effects of surfactants’ kinds and concentrations on the MPS of API nanoparticles, respectively. The MPS of API nanoparticles of tween 80, PEG-400, and Poloxamer 188 as surfactants were 152.7 nm, 312.6 nm, and 224.5 nm, respectively. When the concentration of tween 80 was 5 mg/mL, we obtained the smallest MPS of 220.0 nm. Therefore, we selected tween 80 (5 mg/mL) for the next study.
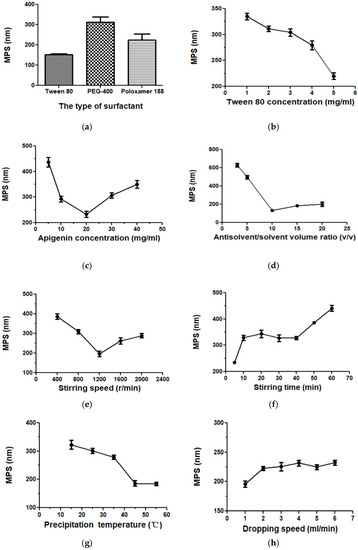
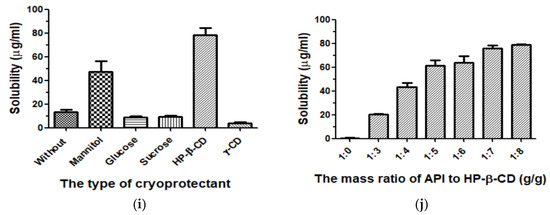
Figure 3.
The effects of each factor on API nanoparticles. (a) Type of surfactant, (b) tween 80 concentration, (c) API concentration, (d) the volume ratio of antisolvent/solvent, (e) stirring speed, (f) stirring time, (g) precipitation temperature, (h) dropping speed, (i) type of cryoprotectant, and (j) the mass ratio of API/HP-β-CD.
3.1.2. API Concentration
Figure 3c showed the MPS of API nanoparticles when the API concentrations were 5, 10, 20, 30, and 40 mg/mL. The effect of API concentration on MPS was very obvious. The maximum MPS value was 436.9 nm when the API concentration was 5 mg/mL. With the increase in API concentration, we obtained a minimum MPS value of 233.7 nm at 20 mg/mL. However, when the concentration continued to increase, the MPS value increased again; meanwhile, agglomeration and precipitation of API appeared in the nanosuspension. It might be because higher drug concentrations led to greater supersaturation, resulting in faster nucleation and smaller particles. However, if the supersaturation was too high, the agglomeration would accelerate and the particle diameter would increase slightly correspondingly. At the high drug concentration, agglomeration took precedence over nucleation [31]. Thus, 20 mg/mL was determined to be the optimum API concentration.
3.1.3. Volume Ratio of Antisolvent/Solvent
Figure 3d showed the influences of the 3, 5, 10, 15, and 20 antisolvent/solvent volume ratio on the MPS of API. When the antisolvent/solvent volume ratio increased from 3 to 10, the change in MPS was particularly obvious; it decreased from 627.9 nm to 133.0 nm. However, as the proportion continues to increase, the particle size increases slightly. This may be due to the increase in antisolvent content leading to an increase in saturation in nanosuspensions and resulting in smaller particles formation [31]. However, when the proportion continued to increase, the supersaturation was almost unchanged, so the change in particle size was small. To sum up, the most suitable antisolvent/solvent volume ratio is 10:1.
3.1.4. Speed and Time of Stirring
Figure 3e and f showed the effects of different stirring speed and time on the API’s MPS. It can be seen in the figure that when the stirring speed increased from 400 r/min to 1200 r/min, the MPS reduced from 386.3 nm to 196.7 nm. However, when the speed exceeded 1200 r/min, the MPS increased with the increase in speed. In addition, the effect of stirring time on the MPS of API was also very significant. At 5 min of stirring, we obtained a minimum MPS of 234.8 nm. This illustrates that stirring speed and time could effectively affect the particle size; but considering the energy conservation, greater stirring speed and longer stirring time might waste too much energy and destroy the system’s relative balance easily, which will result in the agglomeration and growth of particles [32]. Finally, we selected the optimum stirring speed and stirring time at 1200 r/min and 5 min, respectively.
3.1.5. Precipitation Temperature
In the LAP process, an important factor is the precipitation temperature. We investigated 15, 25, 35, 45, and 55 °C on the MPS of API. As shown in Figure 3g, as the temperature rose to 45 °C, the MPS of API induced from 332.8 nm to 186.5 nm. When the temperature continued to rise, the change in MPS was not obvious. This might be due to the viscosity change caused by the change of thermodynamic properties of tween 80 in the system. When the temperature increases, the thermal movement of liquid molecules accelerates and the attraction between molecules weakens, which led to a decrease in viscosity [33]. When the precipitation temperature was at a low temperature, the supersaturation of the system increased, leading to the production of many drug particles; moreover, in the LAP process, the viscosity decreases significantly with the increase in temperature, thereby making the API particles form a paste. However, with the increase in temperature the dynamic viscosity of tween 80 decreased; this could effectively limit the agglomeration of particles and was beneficial to produce small drug particles. However, when the precipitation temperature increased further, the viscosity of the system had little effect on the API’s particle size, and consequently, the change in particle size was not obvious [32]. Therefore, we selected 45 °C as the optimum precipitation temperature.
3.1.6. Speed of Dropping
The effect of the dropping speed on the MPS of the API nanoparticles was investigated, as shown in Figure 3h. The change in the dropping speed had no significant effect on API’s MPS with other conditions fixed. When the dropping speed was set to 1–6 mL/min, the MPS was 196.2 nm, 222.6 nm, 225.6 nm, 231.5 nm, 224.8 nm, and 232.4 nm, respectively. When the solvent was dropped at a constant speed, nanoparticles of smaller MPS can be produced. In addition, the slower the dropping speed, the more favorable the particle was completely dispersed, and the collision and agglomeration of the particles can be reduced. Accordingly, we selected the most suitable dropping speed at 1 mL/min.
3.1.7. Type of Cryoprotectant
In drug delivery preparations, to improve nanosuspension’s long-term physical stability, an effective method is freeze-drying. The process of freeze-drying could effectively prevent nanoparticles’ aggregation and improve API‘s solubility, thus it could produce drug particles with smaller MPS [34,35,36]. In our present study, freeze-drying with different cryoprotectants had a significant effect on the solubility of API. Therefore, the API nanoparticles of mannitol, glucose, sucrose, HP-β-CD, γ-CD, and those without a cryoprotectant were prepared (API: cryoprotectant, 1:5, g/g), and we detected their solubility by using the HPLC method. Experimental results were shown in Figure 3i. By comparing their solubility, we selected HP-β-CD as a freeze-dried protectant for this study.
3.1.8. HP-β-CD Amount
HP-β-CD, as the cryoprotectant, was selected in this study. We prepared 1:0, 1:3, 1:4, 1:5, 1:6, 1:7, and 1:8 g/g API-HP-β-CDs nanoparticles, and then analyzed their solubility by HPLC. As shown in Figure 3j, when other conditions were fixed, with the HP-β-CD amount increasing, the nanoparticles’ corresponding solubility increased. When the API/HP-β-CD’s mass ratio was 1:7, the solubility was about 75.98 μg/mL. However, when HP-β-CD’s amount increased further, the nanoparticles’ corresponding solubility had no obvious change. Finally, the mass ratio of 1:7 of API to HP-β-CD was selected as the optimal condition.
From the above data obtained, the optimal conditions were tween 80 as a surfactant of 5 mg/mL, an API concentration of 20 mg/mL, a volume ratio of antisolvent/solvent of 10, a stirring speed and a stirring time of 1200 rpm and 5 min, respectively, a precipitation temperature of 45 °C, and a dropping speed of 1 mL/min. Under the optimum conditions, we obtained MPS of API nanosuspension at 150.5 nm. Moreover, we selected HP-β-CD as a cryoprotectant and 1:7 as the optimum API/HP-β-CD ratio. Finally, we obtained API nanoparticles through lyophilization and used them for the following studies.
3.2. API Nanoparticles’ Characterization
3.2.1. SEM Observation
Figure 4a–c showed the morphological features of raw API, the processed API nanoparticles, and the freeze-drying of API nanoparticles. Figure 4a showed that the crystal form of raw API was irregular flake and block, and the particle size varied from 0.815 μm to 3.077 μm. The SEM images revealed that the freeze-dried API nanoparticles (Figure 4b) were loose mesh structures and it was difficult to observe the morphology of API nanoparticles from the figure, probably because the surface of API nanoparticles was wrapped with HP-β-CD. Consequently, to remove the HP-β-CD, we washed freeze-dried API nanoparticles with deionized water three times for further morphological observation of API nanoparticles. The crystal form of the processed API nanoparticles was mainly small, well-proportioned, in a near-spherical shape (Figure 4c), and its particle size roughly ranged from 162.9 nm to 630.4 nm, which was obviously different from the raw API. In addition, the MPS of API nanosuspension’s normal distribution curves was shown in Figure 4d. The particle size was in the range of 74.8 nm to 262.3 nm, its MPS was 170.1 nm, and the PDI (polydispersity index) was 0.176. The experimental results showed that API nanoparticles were kept in small particle sizes and had good morphology owing to HP-β-CD’s existence during the freeze-drying process.
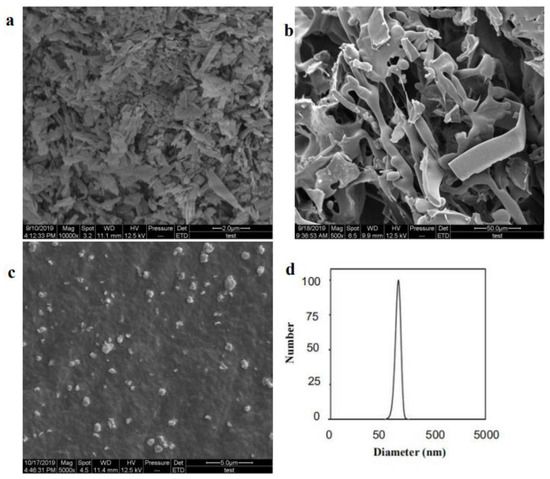
Figure 4.
Images of samples detected by SEM. (a) Raw API, (b) freeze-dried API nanoparticles, (c) processed API nanoparticles, and (d) normal distribution curves of MPS of API nanosuspension.
3.2.2. FTIR Analysis
Figure 5 showed that the infrared spectra of wave numbers were from 400 to 4000 cm−1 of raw API, API nanoparticles, and the physical mixture of API with HP-β-CD and HP-β-CD. The characteristic peaks of the infrared spectra of the raw API at 3271 cm−1 (O–H groups vibration) and 1652 cm−1 (C–O stretching) were shown in Figure 5a. Figure 5d showed that, in HP-β-CD’s infrared spectrogram, there were characteristic peaks at 3384 (O–H groups vibration), 2929 (O–CH3 groups vibration), and 1026 cm−1 (C–O groups vibration). In addition, Figure 5b,c show the infrared spectra of the API nanoparticles and the physical mixture of API with HP-β-CD, respectively. However, the API and HP-β-CD spectra did not show any changes in peak position (Figure 5b,c); only the spectrum of the API nanoparticles covered some peaks of the API, which is probably because the surface of the API was coated with HP-β-CD.
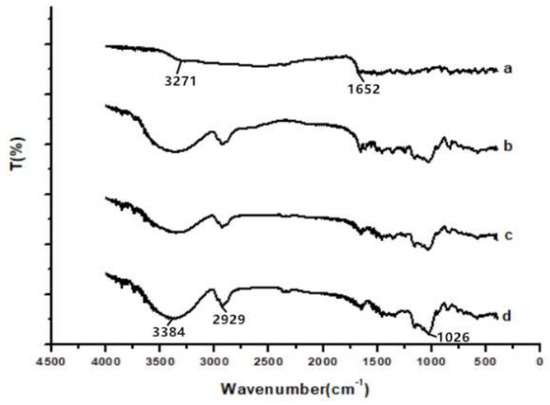
Figure 5.
FTIR results of samples. (a) Raw API, (b) API nanoparticles, (c) API and HP-β-CD mixture, and (d) HP-β-CD.
3.2.3. XRD Analysis
The XRD patterns of raw API, API nanoparticles, and the physical mixture of API with HP-β-CD and HP-β-CD were shown in Figure 6. Raw API had a very obvious characteristic peak, which was shown in Figure 6a. Figure 6c showed the diffractogram of API with HP-β-CD, which has a lower intensity in the peaks. Although the diffractogram is composed mostly of the HP-β-CD characters, it remained in some of the API’s characteristics. However, API nanoparticles’ diffraction peak position was different from that of raw API, and the characteristic peak of API nanoparticles (Figure 6b) was smaller than that of raw API (Figure 6a) and the physical mixture of API with HP-β-CD (Figure 6c), which must be due to the existence of HP-β-CD in the system. The results presented that the crystallization of API nanoparticles had obviously decreased. Compared with the untreated samples, the amorphous degree of API nanoparticles was higher; therefore, the API nanoparticles have better dissolution.
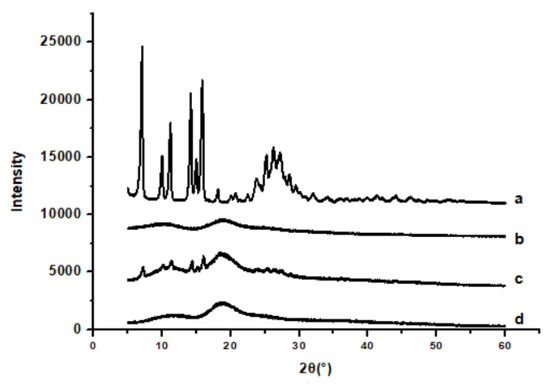
Figure 6.
XRD results of samples. (a) Raw API, (b) API nanoparticles, (c) API and HP-β-CD mixture, and (d) HP-β-CD.
3.2.4. DSC Analysis and TG Analysis
Figure 7 showed the results of DSC of raw API, API nanoparticles, and the physical mixture of API with HP-β-CD and HP-β-CD. Results showed that the melting point of raw API (Figure 7a) was about 365 °C, revealing that API was present in crystalline form. Furthermore, the DSC curve of HP-β-CD (Figure 7d) indicated a broad endothermic peak at 72.5 °C. Figure 7b showed that the melting points of API nanoparticles were lower than the raw API, which was about 325 °C. The physical mixture of API with HP-β-CD’s DSC curve (Figure 7c) showed no endothermic peak because when the temperature was higher than API’s melting point, the chemical structure of API changed from a crystal form to a molecular state, and the physical mixture of API with HP-β-CD may form an inclusion complex at a high temperature. Therefore, the results of DSC were in agreement with those of XRD, indicating that when API was in the form of nanoparticles, the melting point of the solid could be changed, the degree of amorphous could be increased, the solubility of API could be improved, and the particle size could become smaller.
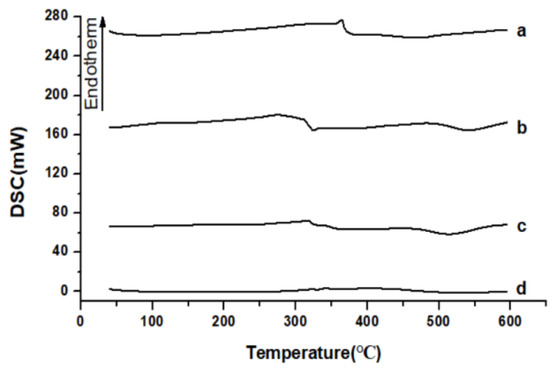
Figure 7.
DSC results of samples. (a) Raw API, (b) API nanoparticles, (c) API and HP-β-CD mixture, and (d) HP-β-CD.
Figure 8 showed the results of the TG analysis, raw API (Figure 8a), and HP-β-CD (Figure 8d), which quickly lost weight from about 362.5 °C to 312.5 °C, respectively. However, the TG results of API nanoparticles (Figure 8b) and the physical mixture of API with HP-β-CD (Figure 8c) showed that they began to lose weight rapidly from approximately 305 °C and 302.5 °C, respectively. This may be due to the fact that compared with raw API, API nanoparticles had lower crystallinity and smaller particle size, resulting in a larger specific surface area and easier dehydration and decomposition.
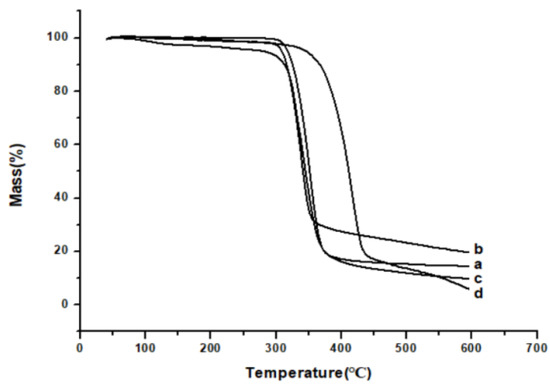
Figure 8.
TG results of samples. (a) Raw API, (b) API nanoparticles, (c) API and HP-β-CD mixture, and (d) HP-β-CD.
3.3. Saturation Solubility and Dissolution Study
The saturation solubility of raw API, API nanoparticles, and API with HP-β-CD in the artificial gastric juice was 0.91 μg/mL, 20.84 μg/mL, and 8.51 μg/mL, respectively, and it was 0.85 μg/mL, 63.64 μg/mL, and 17.51 μg/mL in the artificial intestinal juice, respectively. Therefore, the solubility of the API nanoparticles in the artificial gastric juice and the artificial intestinal juice was 22.9 times and 74.87 times that of the raw API, respectively. The saturated solubility of API with HP-β-CD was higher than that of the raw API, which may be due to that HP-β-CD contributed to improving API’s solubility, but API nanoparticles’ saturated solubility was significantly higher than the others, which indicated that the most important factor to increase API’s saturated solubility was the decrease in particle size.
Figure 9 illustrated the drug release characters of raw API, API nanoparticles, and the physical mixture of API with HP-β-CD in vitro. Results showed that within 24 h, 12.13% and 13.46% of raw API were dissolved in the artificial intestinal juice and the artificial gastric juice, respectively. However, under the same conditions, the physical mixtures of API with HP-β-CD were 38.43% and 45.81%, and the API nanoparticles were 67.48% and 82.24%. In the artificial intestinal juice, the API nanoparticles’ dissolution rate was 5.56 times higher than the raw API, whereas in artificial gastric juice it was 6.11 times higher than the raw API. To sum up, compared with neither the raw API nor API with HP-β-CD, the API nanoparticles showed both a much higher dissolution rate and the cumulative amount of dissolved API in the two-dissolution media. Meanwhile, the dissolution rate of API with the HP-β-CD physical mixture was a little bit higher than the raw API, which indicated that the excipients were beneficial to improving the solubility of API, but it was not the most important factor to improving the dissolution and solubility rate of API.
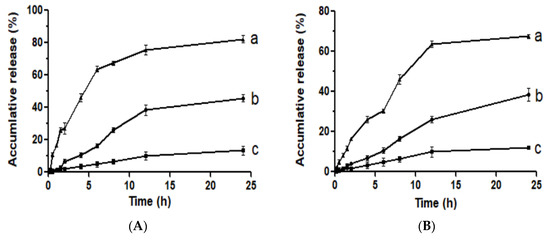
Figure 9.
Dissolution profiles in the artificial gastric juice (A) and the artificial intestinal juice (B). (a) API nanoparticles, (b) API and HP-β-CD mixture, and (c) Raw API.
3.4. In Vitro Anti-Inflammatory Activities
3.4.1. Cell Viability Determination
To compare the cytotoxic effects of different types of drugs (raw API and API nanoparticles), MTT assays were carried out. As can be seen in Figure 10, in the range of 7.82–125 μg/mL, raw API and API nanoparticles had little effect on cell viability. After treatment with a high concentration (125 μg/mL) for 24 h, the cell viability of raw API and API nanoparticles was 98.85% and 98.05%, respectively. Therefore, the above five API concentrations had not shown cytotoxicity toward RAW264.7 cells and could be used in the following experiments.
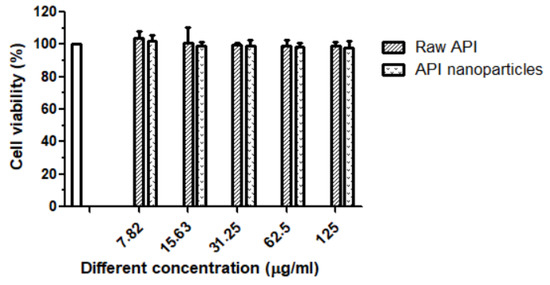
Figure 10.
Cell proliferation percent inhibition of raw API and API nanoparticles on RAW264.7 cells.
3.4.2. Effects of Raw API and API Nanoparticles on LPS-Induced NO Production
Lipopolysaccharide (LPS) is a potent inducer of the differentiation of monocytes to the M1-like classically activated macrophages, which produce the pro-inflammatory mediators (NO, PGE2, and ROS), cytokines (TNF-α, IL-1β, and IL-6), and chemokines (CCL2, CCL3, and CCL4) [37,38]. In inflammation, macrophages are thought to play important roles. When activated by endotoxins, macrophages will produce inflammatory cytokines, which in turn activate other nearby cells and macrophages to promote more cytokines, for example, iNOs (inducible nitric oxide synthase) gene expression [39]. In LPS-induced RAW264.7 cells, we investigated the potential anti-inflammatory properties of raw API and API nanoparticles. The amount of produced NO was determined by the measurement of nitrite, a stable metabolite of NO [40]. As the results show in Figure 11, during the incubation time of 24 h, the concentration of NO detected in the blank group was very low, only 1.65 μmol/L, while NO production dramatically increased to 17.65 μmol/L after stimulation with LPS (1 μg/mL). Compared with the LPS group, the content of NO treated with API in the culture medium of RAW264.7 cells decreased significantly, and with the increase in API concentration, NO’s concentration decreased gradually, which showed a good dose-dependent relationship. Moreover, nano-API inhibited NO generation much better than raw API. This phenomenon can be explained by the fact that nanoparticles had smaller particle sizes and they would enter the cells more efficiently. Therefore, they can work better. At a concentration of 62.5 μg/mL, the NO inhibitory effects of raw API and API nanoparticles were better than at 20 μg/mL DXM (the positive control group). The results presented that API and its preparation had anti-inflammatory effects.
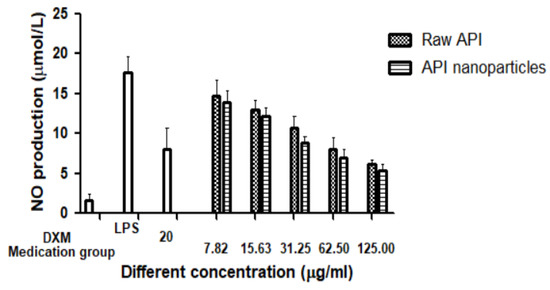
Figure 11.
Effects of raw API and API nanoparticles on the NO production of RAW264.7 cells induced by LPS.
3.4.3. Effects of Apigenin Nanoparticles on IL-10 Secretion of RAW264.7 Cells by LPS Induction
IL-10 is an important cytokine in immunity, which reduces inflammation in several disease models and is necessary for macrophages’ functioning and proliferation. The IL-10 concentration in the supernatant of RAW264.7 cells was determined by the ELISA method, and then the effects of API and API nanoparticles on IL-10 secretion by LPS-induced inflammatory RAW264.7 cells were determined. It can be seen in Figure 12 that the IL-10 content in the cell supernatant of the blank control group was 3.65 μmol/L, whereas the IL-10 content of the model group induced by LPS was significantly increased to 30.31 μmol/L. Compared with the model group induced by LPS, after the addition of API, API nanoparticles, and positive control DXM, the IL-10 content in the cell supernatant decreased gradually with an increase in concentration. When the concentration of the drug reached 125.0 μg/mL, the inhibitory effect on the secretion of IL-10 was better than that of DXM (20 μg/mL). These results showed that the inhibitory effect on IL-10 secretion increased with the concentration. A comprehensive analysis showed that both API and API nanoparticles could inhibit the secretion of IL-10 in the concentration range of 7.82–125 μg/mL and both of them had anti-inflammatory activity, and the inhibitory effect of API nanoparticles on IL-10 secretion was stronger than that of API.
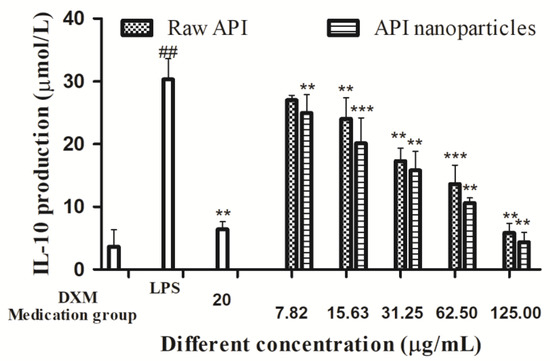
Figure 12.
Effects of API nanoparticles on the IL-10 production of LPS-induced RAW264.7 cells (## p < 0.05 vs. the control group and ** p < 0.05, *** p < 0.01 vs. the LPS group).
3.5. In Vitro Anti-Tumor Activity
3.5.1. Cell Viability Determination
Different concentrations of API (7.82, 15.63, 31.25, 62.5, and 125 µg/mL) were used to treat HepG2 cells for 24 h and 48 h, respectively. Figure 13 showed the effect of different acting times on the viability of HepG2 cells determined by MTT. Compared with the blank control group, the survival rate of HepG2 cells treated with API decreased continuously with the increase in time in the concentration range of 7.82–125 μg/mL, which indicated that API inhibited the proliferation of HepG2 cells in a time-dependent manner. When the time was 48 h, the IC50 value was 55.99 μg/mL. The effects of API and API nanoparticles on the viability of HepG2 cells were determined by the MTT method. The results were shown in Figure 14. Compared with the blank control group, in the concentration range of 7.82–125 μg/mL, the survival rate of cells treated with API and API nanoparticles decreased continuously with the increase in API concentration in a dose-dependent manner. When the drug concentration was 62.5 µg/mL, the survival rates of cells treated with API and API nanoparticles were 48.4% and 45.5%, respectively. In order to avoid the side effects caused by excessive concentration, a drug concentration of 15.63 µg/mL and 62.5 µg/mL was selected as a low concentration and a high concentration to continue the later experimental operation for a 48 h treatment.
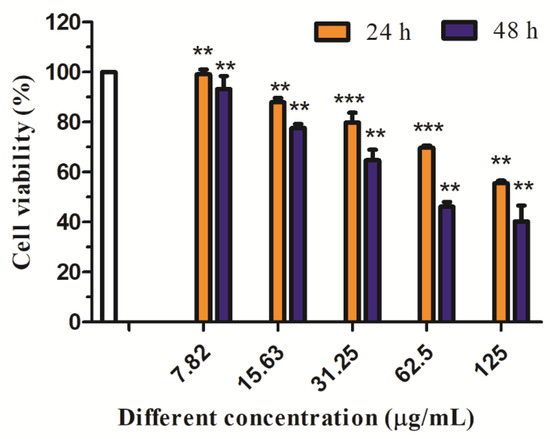
Figure 13.
Effects of different treatment times with API nanoparticles on HepG2 cells’ viability (** p < 0.05; *** p < 0.01).
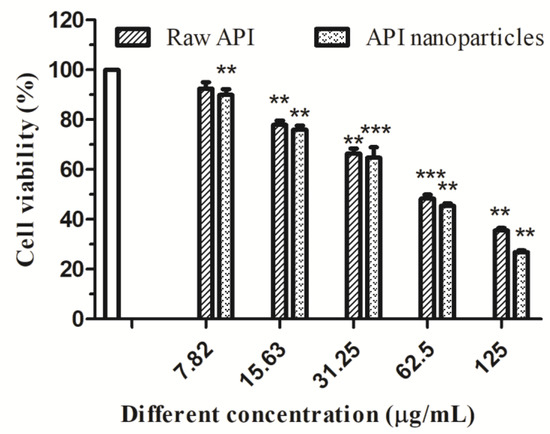
Figure 14.
Effects of raw API and API nanoparticles on HepG2 cells’ viability (** p < 0.05; *** p < 0.01).
3.5.2. Determination of the Apoptosis Rate of HepG2 Cells by API Nanoparticles
Annexin V-FITC/PI double staining is a common method to detect apoptosis. Annexin V-FITC staining can identify apoptotic and necrotic cells. The calcium-dependent lecithin binding protein (Annexin V) has a high affinity with phosphatidyl serine (PS). It can be used to distinguish apoptotic cells in different stages by exposing PS to early apoptotic cells. Annexin V combined with propidium iodide (PI) and other DNA staining solutions can distinguish apoptotic cells in different stages [41]. Annexin V was labeled with FITC fluorescent dye and apoptosis was detected by flow cytometry. As shown in Figure 15, the normal cells were in the Q1-LL region, the early apoptotic cells were in the Q1-LR region, and the late apoptotic and necrotic cells were in the Q1-UR region. Compared with the blank control group, the apoptosis rate of API and API nanoparticles increased significantly.
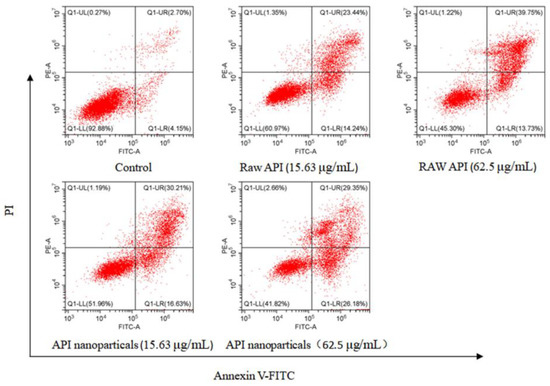
Figure 15.
Analysis of API nanoparticle-induced HepG2 cell apoptosis by Annexin V-FITC/PI double staining method.
4. Conclusions
In this paper, the LAP technique was used to prepare water-soluble API nanoparticles. The best process conditions were determined by using a single-factor test method Under the optimum conditions, we obtained an API nanosuspension with a 170.5 nm MPS. In addition, the physical and chemical properties of API nanoparticles were investigated and the experimental data indicated that although API nanoparticles were transformed into an amorphous form and had a higher solubility, the internal chemical structure of API had not changed. Additionally, the solubility of the API nanoparticles in the artificial intestinal juice and the artificial gastric juice was 74.87 times and 22.9 times the raw API, respectively, and the dissolution rate of the API nanoparticles in the artificial intestinal juice and the artificial gastric juice was 5.56 times and 6.11 times of the raw API, respectively. Furthermore, the anti-inflammatory activities of raw API and API nanoparticles were proved in RAW264.7 cells induced by LPS. API nanoparticles inhibited the generation of NO and IL-10 much better than raw API. In addition, the HepG2 cells’ survival rate treated with API nanoparticles was lower than the HepG2 cells treated with API, and the increase in apoptosis rate was proportional to the concentration of API. In a word, this study indicates that the LAP method has important application value in improving the oral bioavailability and water solubility of API, and API nanoparticles have great potential development in clinical applications as anti-inflammatory and anti-tumor medicines.
Supplementary Materials
The following supporting information can be downloaded at: https://www.mdpi.com/article/10.3390/separations10010016/s1, Table S1: The factors and levels of the single factor design.
Author Contributions
Supervision and validation, W.W.; curation, formal analysis, and writing-original draft, Y.L.; funding acquisition, H.W.; writing-review and editing, X.Z. All authors have read and agreed to the published version of the manuscript.
Funding
This work was supported by the National Key R&D Program of China (2022YFD2200604), the Scientific Research Funds of Huaqiao University, and the Heilongjiang Touyan Innovation Team Program (Tree Genetics and Breeding Innovation Team).
Data Availability Statement
All Data is contained within the article.
Conflicts of Interest
The authors confirm that this article’s content has no conflict of interest.
References
- Madunić, J.; Madunić, I.V.; Gajski, G.; Popić, J.; Garaj Vrhovac, V. Apigenin: A dietary flavonoid with diverse anticancer properties. Cancer Lett. 2018, 413, 11–22. [Google Scholar] [CrossRef]
- Bak, M.J.; Das Gupta, S.; Wahler, J.; Suh, N. Role of dietary bioactive natural products in estrogen receptor-positive breast cancer. Semin. Cancer Biol. 2016, 40–41, 170–191. [Google Scholar] [CrossRef]
- Zhou, Y.; Zheng, J.; Li, Y.; Xu, D.P.; Li, S.; Chen, Y.M.; Li, H.B. Natural polyphenols for prevention and treatment of cancer. Nutrients 2016, 8, 515. [Google Scholar] [CrossRef]
- Kumar, K.S.; Sabu, V.; Sindhu, G.; Rauf, A.A.; Helen, A. Isolation, identification and characterization of apigenin from Justicia gendarussa, and its anti-inflammatory activity. Int. Immunopharmacol. 2018, 59, 157–167. [Google Scholar] [CrossRef]
- Kim, M.; Jung, J.; Jeong, N.Y.; Chung, H.J. The natural plant flavonoid apigenin is a strong antioxidant that effectively delays peripheral neurodegenerative processes. Anat. Sci. Int. 2019, 94, 285–294. [Google Scholar] [CrossRef]
- Siddique, Y.H.; Rahul; Ara, G.; Afzal, M.; Varshney, H.; Gaur, K.; Subhan, I.; Mantasha, I.; Shahid, M. Beneficial effects of apigenin on the transgenic Drosophila model of Alzheimer’s disease. Chem. Biol. Interact. 2022, 366, 110120. [Google Scholar] [CrossRef]
- He, J.; Ning, C.W.; Wang, Y.; Ma, T.F.; Huang, H.; Ge, Y.B.; Liu, J.B.; Jiang, Y.Q. Natural plant flavonoid apigenin directly disrupts Hsp90/Cdc37 complex and inhibits pancreatic cancer cell growth and migration. J. Funct. Foods 2015, 18, 10–21. [Google Scholar] [CrossRef]
- Jin, X.; Yang, Q.; Zhang, Y.W. Synergistic apoptotic effects of apigenin tpgs liposomes and tyroservatide: Implications for effective treatment of lung cancer. Int. J. Nanomed. 2017, 12, 5109–5118. [Google Scholar] [CrossRef]
- Shan, S.H.; Shi, J.Y.; Yang, P.; Jia, B.; Wu, H.L.; Zhang, X.L.; Li, Z.Y. Apigenin restrains colon cancer cell proliferation via targeted blocking of pyruvate kinase M2-dependent glycolysis. J. Agric. Food Chem. 2017, 65, 8136–8144. [Google Scholar] [CrossRef]
- Erdogan, S.; Turkekul, K.; Serttas, R.; Erdogan, Z. The natural flavonoid apigenin sensitizes human CD44+, prostate cancer stem cells to cisplatin therapy. Biomed. Pharm. 2017, 88, 210–217. [Google Scholar] [CrossRef]
- Teeranai, I.; Songchan, P.; Tanapat, P.; Sittiruk, R.; Chanpen, C. α-Mangostin and apigenin induced the necrotic death of BT474 breast cancer cells with autophagy and inflammation. Asian Pac. J. Trop. Biomed. 2018, 8, 5–12. [Google Scholar] [CrossRef]
- Jangdey, M.S.; Kaur, C.D.; Saraf, S. Efficacy of concanavalin—A conjugated nanotransfersomal gel of apigenin for enhanced targeted delivery of UV induced skin malignant melanoma. Artif. Cell Blood Substit. 2019, 47, 904–916. [Google Scholar] [CrossRef] [PubMed]
- Ngernyuang, N.; Wongwattanakul, M.; Charusirisawad, W.; Shao, R.; Limpaiboon, T. Green synthesized apigenin conjugated gold nanoparticles inhibit cholangiocarcinoma cell activity and endothelial cell angiogenesis in vitro. Heliyon 2022, 8, e12028. [Google Scholar] [CrossRef] [PubMed]
- Zhang, J.J.; Liu, D.P.; Huang, Y.T.; Gao, Y.; Qian, S. Biopharmaceutics classification and intestinal absorption study of apigenin. Int. J. Pharm. 2012, 436, 311–317. [Google Scholar] [CrossRef] [PubMed]
- Ding, S.M.; Zhang, Z.H.; Song, J.; Cheng, X.D.; Jiang, J.; Jia, X.B. Enhanced bioavailability of apigenin via preparation of a carbon nanopowder solid dispersion. Int. J. Nanomed. 2014, 9, 2327–2333. [Google Scholar] [CrossRef]
- Hassan, U.A.; Hussein, M.Z.; Alitheen, N.B.; Ariff, S.A.Y.; Masarudin, M.J. In vitro cellular localization and efficient accumulation of fluorescently tagged biomaterials from monodispersed chitosan nanoparticles for elucidation of controlled release pathways for drug delivery systems. Int. J. Nanomed. 2018, 13, 5075–5095. [Google Scholar] [CrossRef]
- Patel, P.J.; Gajera, B.Y.; Dave, R.H. A quality-by-design study to develop nifedipine nanosuspension: Examining the relative impact of formulation variables, wet media milling process parameters, and excipient variability on drug product quality attributes. Drug Dev. Ind. Pharm. 2018, 44, 1942–1952. [Google Scholar] [CrossRef] [PubMed]
- Sathe, P.; Saka, R.; Kommineni, N.; Khan, W. Dithranol-loaded nanostructured lipid carrier-based gel ameliorate psoriasis in imiquimod-induced mice psoriatic plaque model. Drug Dev. Ind. Pharm. 2019, 45, 826–838. [Google Scholar] [CrossRef]
- Huang, Y.N.; Zhao, X.H.; Zu, Y.G.; Wang, L.; Deng, Y.P.; Wu, M.F.; Wang, H.M. Enhanced solubility and bioavailability of apigenin via preparation of solid dispersions of mesoporous silica nanoparticles. Iran. J. Pharm. Res. 2019, 18, 168–182. Available online: https://www.x-mol.com/paper/1213023888921006088?adv (accessed on 6 June 2022).
- Zhang, J.J.; Huang, Y.T.; Liu, D.P.; Gao, Y.; Qian, S. Preparation of apigenin nanocrystals using supercritical antisolvent process for dissolution and bioavailability enhancement. Eur. J. Pharm. Sci. 2013, 48, 740–747. [Google Scholar] [CrossRef]
- Huang, Y.N.; Zu, Y.G.; Zhao, X.H.; Wu, M.F.; Feng, Z.Q.; Deng, Y.P.; Zu, C.; Wang, L.L. Preparation of inclusion complex of apigenin-hydroxypropyl-β-cyclodextrin by using supercritical antisolvent process for dissolution and bioavailability enhancement. Int. J. Pharm. 2016, 511, 921–930. [Google Scholar] [CrossRef] [PubMed]
- Banerjee, K.; Banerjee, S.; Mandal, M. Enhanced chemotherapeutic efficacy of apigenin liposomes in colorectal cancer based on flavone-membrane interactions. J. Colloid Interf. Sci. 2017, 491, 98–110. [Google Scholar] [CrossRef] [PubMed]
- Zhai, Y.J.; Guo, S.S.; Liu, C.H.; Yang, C.F.; Dou, J.F.; Li, L.B.; Zhai, G.X. Preparation and in vitro evaluation of apigenin-loaded polymeric micelles. Colloids Surface A 2013, 429, 24–30. [Google Scholar] [CrossRef]
- Alshehri, S.M.; Shakeel, F.; Ibrahim, M.A.; Elzayat, E.M.; Altamimi, M.; Mohsin, K.; Almeanazel, O.T.; Alkholief, M.; Alshetaili, A.; Alsulays, B.; et al. Dissolution and bioavailability improvement of bioactive apigenin using solid dispersions prepared by different techniques. Saudi Pharm. J. 2019, 27, 264–273. [Google Scholar] [CrossRef] [PubMed]
- Zhao, T.; Yue, H.; Chen, H.L.; Bai, Y.; Hu, W.J.; Zhang, L.K. Novel apigenin-loaded sodium hyaluronate nano-assemblies for targeting tumor cells. Carbohyd. Polym. 2017, 177, 415–423. [Google Scholar] [CrossRef] [PubMed]
- Mccomiskey, K.P.M.; Mugheirbi, N.A.; Stapleton, J.; Tajber, L. In situ monitoring of nanoparticle formation: Antisolvent precipitation of azole anti-fungal drugs. Int. J. Pharm. 2018, 543, 201–203. [Google Scholar] [CrossRef]
- Wu, W.W.; Zu, Y.G.; Wang, L.; Wang, L.L.; Wang, H.M.; Li, Y.Y.; Wu, M.F.; Zhao, X.H.; Fu, Y.J. Preparation, characterization and antitumor activity evaluation of apigenin nanoparticles by the liquid antisolvent precipitation technique. Drug Deliv. 2017, 24, 1713–1720. [Google Scholar] [CrossRef]
- Kim, B.; Lee, J.H.; Seo, M.J.; Eom, S.H.; Kim, W. Linarin down-regulates phagocytosis, pro-inflammatory cytokine production, and activation marker expression in RAW 264.7 macrophages. Food Sci. Biotechnol. 2016, 25, 1437–1442. [Google Scholar] [CrossRef]
- Anita, S.; Wahyu, U.; Ratna, Y.; Da’i, M.; Nafarin, A. Effect of tween 80 on nanoparticle preparation of modified chitosan for targeted delivery of combination doxorubicin and curcumin analogue. IOP Conf. Ser. Mater. Sci. Eng. 2018, 311, 12–24. [Google Scholar] [CrossRef]
- Tubtimsri, S.; Limmatvapirat, C.; Limsirichaikul, S.; Akkaramongkolporn, P.; Inoue, Y.; Limmatvapirat, S. Fabrication and characterization of spearmint oil loaded nanoemulsions as cytotoxic agents against oral cancer cell. Asian J. Pharm. Sci. 2018, 13, 33–45. [Google Scholar] [CrossRef]
- Kakran, M.; Sahoo, N.G.; Tan, I.L.; Li, L. Preparation of nanoparticles of poorly water-soluble antioxidant curcumin by antisolvent precipitation methods. J. Nanopart. Res. 2012, 14, 757. [Google Scholar] [CrossRef]
- Wu, W.W.; Zu, Y.G.; Wang, L.L.; Wang, L.; Li, Y.Y.; Liu, Y.J.; Wu, M.F.; Zhao, X.H.; Zhang, X.X. Preparation, characterization and antitumor activity evaluation of silibinin nanoparticles for oral delivery through liquid antisolvent precipitation. RSC Adv. 2017, 7, 54379–54390. [Google Scholar] [CrossRef]
- Szymczyk, K.; Taraba, A. Aggregation behavior of triton x-114 and tween 80 at various temperatures and concentrations studied by density and viscosity measurements. J. Therm. Anal. Calorim. 2016, 126, 315–326. [Google Scholar] [CrossRef]
- Wang, L.L.; Ma, Y.Y.; Gu, Y.; Liu, Y.Y.; Zhao, J.; Yan, B.B.; Wang, Y.C. Cryoprotectant choice and analyze of freeze-drying drug suspension of nanoparticles with functional stabilizers. J. Microencapsul. 2018, 35, 241–248. [Google Scholar] [CrossRef] [PubMed]
- Lin, L.; Zhu, Y.L.; Thangaraj, B.; Abdel Samie, M.A.S.; Cui, H.Y. Improving the stability of thyme essential oil solid liposome by using β-cyclodextrin as a cryoprotectant. Carbohydr. Polym. 2018, 188, 243–251. [Google Scholar] [CrossRef] [PubMed]
- Liao, Y.H.; Zhang, X.F.; Li, C.L.; Huang, Y.J.; Lei, M.; Yan, M.N.; Zhou, Y.F.; Zhao, C.S. Inclusion complexes of HP-β-cyclodextrin with agomelatine: Preparation, characterization, mechanism study and in vivo evaluation. Carbohydr. Polym. 2016, 147, 415–425. [Google Scholar] [CrossRef]
- McNelis, J.; Olefsky, J. Macrophages, immunity, and metabolic disease. Immunity 2014, 41, 36–48. [Google Scholar] [CrossRef]
- Odegaard, J.I.; Chawla, A. Alternative macrophage activation and metabolism. Annu. Rev. Patholo. Mech. 2011, 6, 275–297. [Google Scholar] [CrossRef]
- Nathan, C. Nitric oxide as a secretory product of mammalian cells. FASEB J. 1992, 6, 3051–3064. [Google Scholar] [CrossRef]
- Wang, W.; Luo, M.; Fu, Y.J.; Wang, S.; Efferth, T.; Zu, Y.G. Glycyrrhizic acid nanoparticles inhibit lps-induced inflammatory mediators in 264.7 mouse macrophages compared with unprocessed glycyrrhizic acid. Int. J. Nanomed. 2013, 8, 1377–1383. [Google Scholar] [CrossRef]
- Yu, L.; Zhang, S.D.; Zhao, X.L.; Ni, H.Y.; Song, X.R.; Wang, W.; Yao, L.P.; Zhao, X.H.; Fu, Y.J. Cyanidin-3-glucoside protects liver from oxidative damage through AMPK/Nrf2 mediated signaling pathway in vivo and in vitro. J. Funct. Foods 2020, 73, 104148. [Google Scholar] [CrossRef]
Disclaimer/Publisher’s Note: The statements, opinions and data contained in all publications are solely those of the individual author(s) and contributor(s) and not of MDPI and/or the editor(s). MDPI and/or the editor(s) disclaim responsibility for any injury to people or property resulting from any ideas, methods, instructions or products referred to in the content. |
© 2022 by the authors. Licensee MDPI, Basel, Switzerland. This article is an open access article distributed under the terms and conditions of the Creative Commons Attribution (CC BY) license (https://creativecommons.org/licenses/by/4.0/).