
Evaluation of Self-Perceived Body Image in Adolescents with Mild Idiopathic Scoliosis


Abstract
1. Introduction
2. Materials and Methods
2.1. Design and Participants
2.2. Measurement Instruments
2.2.1. Scoliosis Research Society Patient Questionnaire (SRS-22)
2.2.2. Trunk Appearance Perception Scale (TAPS)
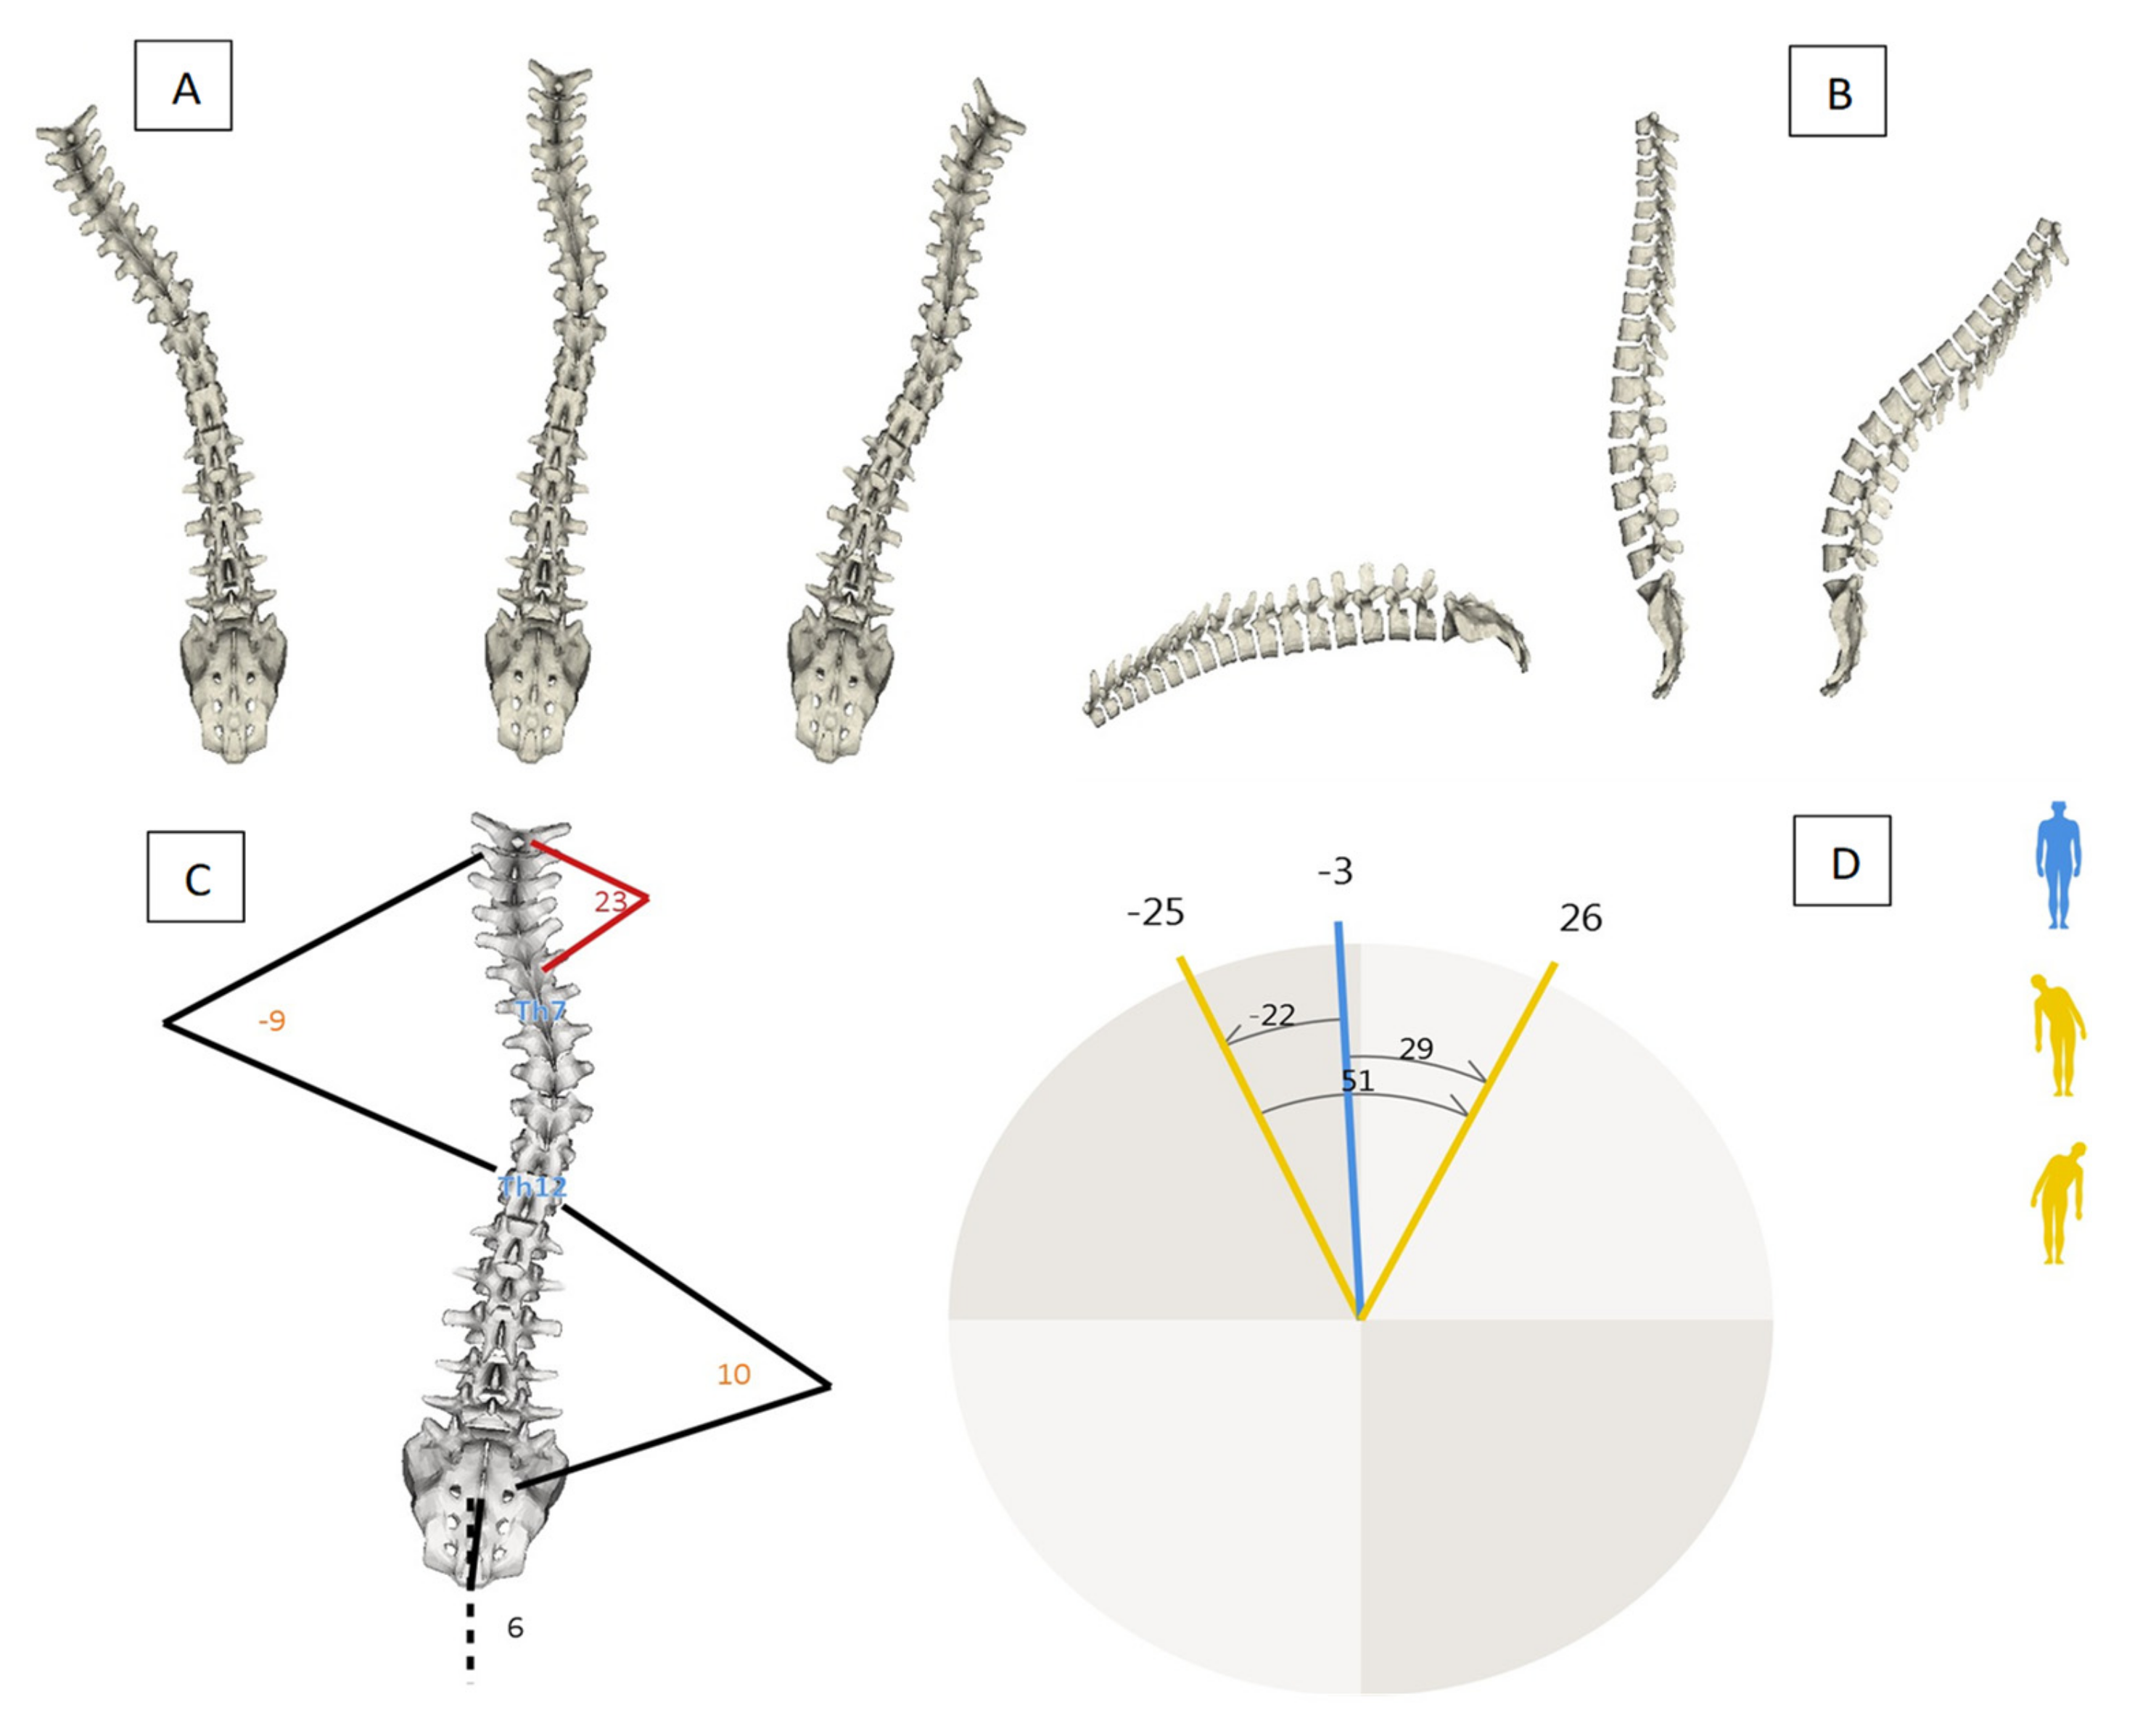
2.2.3. Spine Analysis
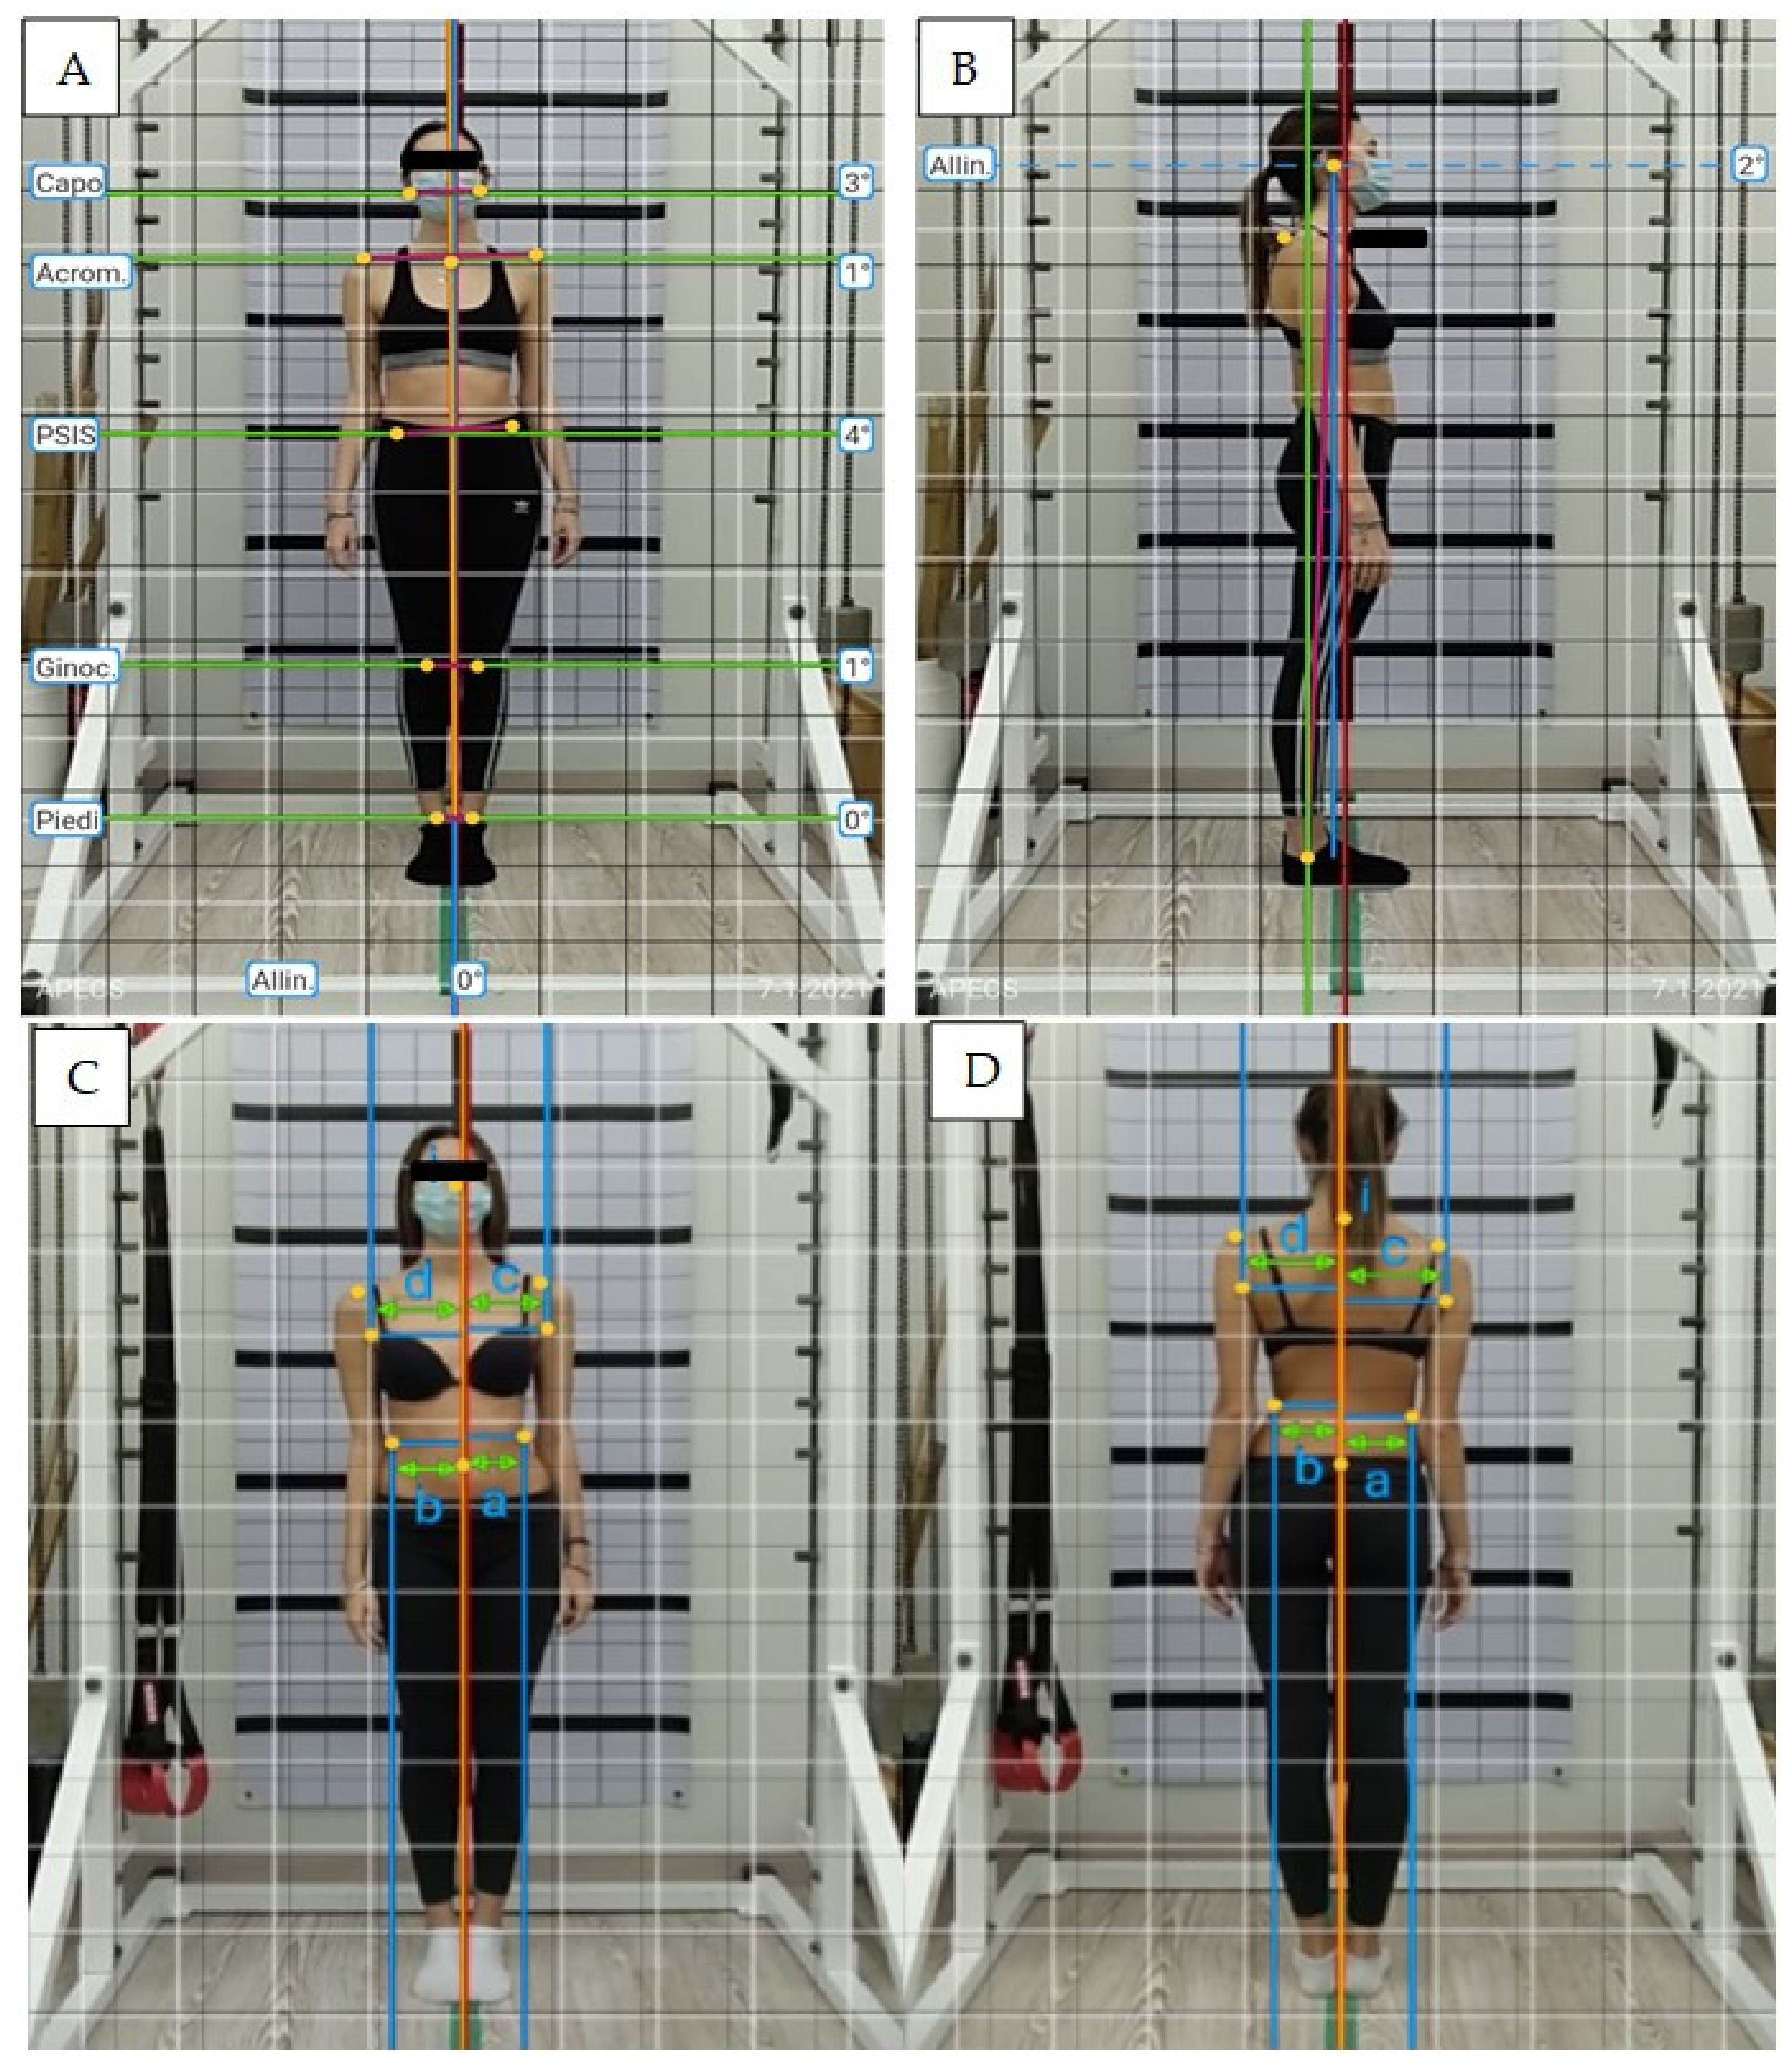
2.2.4. Photogrammetric Postural Analysis
2.3. Statistical Analysis
3. Results
4. Discussion
5. Conclusions
Author Contributions
Funding
Institutional Review Board Statement
Informed Consent Statement
Data Availability Statement
Conflicts of Interest
References
- Negrini, S.; Donzelli, S.; Aulisa, A.G.; Czaprowski, D.; Schreiber, S.; De Mauroy, J.C.; Diers, H.; Grivas, T.B.; Knott, P.; Kotwicki, T.; et al. 2016 SOSORT guidelines: Orthopaedic and rehabilitation treatment of idiopathic scoliosis during growth. Scoliosis Spinal Disord. 2018, 13, 3. [Google Scholar] [CrossRef] [PubMed]
- De Baat, P. Scoliose: Overzicht van typen, oorzaken, diagnostiek en behandeling 1. [Scoliosis: Review of types, aetiology, diagnostics, and treatment 1]. Ned. Tijdschr. Voor Tandheelkd. 2012, 119, 474–478. [Google Scholar] [CrossRef] [PubMed]
- De Baat, P.; van Biezen, F.C.; de Baat, C. Scoliose: Overzicht van typen, oorzaken, diagnostiek en behandeling 2. [Scoliosis: Review of types, aetiology, diagnostics, and treatment 2]. Ned. Tijdschr. Voor Tandheelkd. 2012, 119, 531–535. [Google Scholar] [CrossRef] [PubMed][Green Version]
- Ueno, M.; Takaso, M.; Nakazawa, T.; Imura, T.; Saito, W.; Shintani, R.; Uchida, K.; Fukuda, M.; Takahashi, K.; Ohtori, S.; et al. A 5-year epidemiological study on the prevalence rate of idiopathic scoliosis in Tokyo: School screening of more than 250,000 children. J. Orthop. Sci. 2011, 16, 1–6. [Google Scholar] [CrossRef] [PubMed]
- Weinstein, S.L.; Dolan, L.; Cheng, J.; Danielsson, A.; Morcuende, J.A. Adolescent idiopathic scoliosis. Lancet 2008, 371, 1527–1537. [Google Scholar] [CrossRef]
- Patias, P.; Grivas, T.B.; Kaspiris, A.; Aggouris, C.; Drakoutos, E. A review of the trunk surface metrics used as Scoliosis and other deformities evaluation indices. Scoliosis 2010, 5, 12. [Google Scholar] [CrossRef]
- Stolinski, L.; Kozinoga, M.; Czaprowski, D.; Tyrakowski, M.; Cerny, P.; Suzuki, N.; Kotwicki, T. Two-dimensional digital photography for child body posture evaluation: Standardized technique, reliable parameters and normative data for age 7–10 years. Scoliosis Spinal Disord. 2017, 12, 12–38. [Google Scholar] [CrossRef]
- Livanelioglu, A.; Kaya, F.; Nabiyev, V.; Demirkıran, G.; Firat, T.; Demirkiran, G.; Fırat, T. The validity and reliability of “Spinal Mouse” assessment of spinal curvatures in the frontal plane in pediatric adolescent idiopathic thoraco-lumbar curves. Eur. Spine J. 2015, 25, 476–482. [Google Scholar] [CrossRef]
- Leal, J.S.; Aroeira, R.M.C.; Gressler, V.; Greco, M.; Pertence, A.E.M.; Lamounier, J.A. Accuracy of photogrammetry for detecting adolescent idiopathic scoliosis progression. Spine J. 2019, 19, 321–329. [Google Scholar] [CrossRef]
- Bettany-Saltikov, J.; Weiss, H.-R.; Chockalingam, N.; Taranu, R.; Srinivas, S.; Hogg, J.; Whittaker, V.; Kalyan, R.V.; Arnell, T. Surgical versus non-surgical interventions in people with adolescent idiopathic scoliosis. Cochrane Database Syst. Rev. 2015, 4, CD010663. [Google Scholar] [CrossRef]
- Weiss, H.-R.; Goodall, D. The treatment of adolescent idiopathic scoliosis (AIS) according to present evidence. A systematic review. Eur. J. Phys. Rehabil. Med. 2008, 44, 177–193. [Google Scholar] [PubMed]
- Ascani, E.; Bartolozzi, P.; Logroscino, C.A.; Marchetti, P.G.; Ponte, A.; Savini, R.; Travaglini, F.; Binazzi, R.; DI Silvestre, M. Natural History of Untreated Idiopathic Scoliosis After Skeletal Maturity. Spine 1986, 11, 784–789. [Google Scholar] [CrossRef]
- Schwieger, T.; Campo, S.; Weinstein, S.L.; Dolan, L.A.; Ashida, S.; Steuber, K.R. Body Image and Quality-of-Life in Untreated Versus Brace-Treated Females with Adolescent Idiopathic Scoliosis. Spine 2016, 41, 311–319. [Google Scholar] [CrossRef] [PubMed]
- Essex, R.; Bruce, G.; Dibley, M.; Newton, P.; Thompson, T.; Swaine, I.; Dibley, L. A systematic scoping review and textual narrative synthesis of the qualitative evidence related to adolescent idiopathic scoliosis. Int. J. Orthop. Trauma Nurs. 2022, 45, 100921. [Google Scholar] [CrossRef] [PubMed]
- Gallant, J.-N.; Morgan, C.D.; Stoklosa, J.B.; Gannon, S.R.; Shannon, C.N.; Bonfield, C.M. Psychosocial Difficulties in Adolescent Idiopathic Scoliosis: Body Image, Eating Behaviors, and Mood Disorders. World Neurosurg. 2018, 116, 421–432.e1. [Google Scholar] [CrossRef]
- Monticone, M.; Carabalona, R.; Negrini, S. Reliability of the Scoliosis Research Society-22 Patient questionnaire (Italian Version) in mild adolescent vertebral deformities. Eur. Med. Phys. 2004, 40, 191–197. [Google Scholar]
- Matamalas, A.; D’Agata, E.; Sanchez-Raya, J.; Bago, J. Trunk appearance perception scale for physicians (TAPS-Phy)-A valid and reliable tool to rate trunk deformity in idiopathic scoliosis. Scoliosis Spinal Disord. 2016, 11, 24. [Google Scholar] [CrossRef] [PubMed]
- Asher, M.; Lai, S.M.; Burton, D.; Manna, B. Spine Deformity Correlates Better Than Trunk Deformity with Idiopathic Scoliosis Patients’ Quality of Life Questionnaire Responses. Stud. Health Technol. Inform. 2002, 91, 462–464. [Google Scholar] [PubMed]
- Parent, E.C.; Hill, D.; Mahood, J.; Moreau, M.; Raso, J.; Lou, E. Discriminative and predictive validity of the scoliosis research society-22 questionnaire in management and curve-severity subgroups of adolescents with Idiopathic Scoliosis. Spine 2009, 34, 2450–2457. [Google Scholar] [CrossRef]
- Wang, L.; Wang, Y.; Yu, B.; Zhang, J.; Shen, J.; Qiu, G.; Li, Y. Relation between self-image score of SRS-22 with deformity measures in female adolescent idiopathic scoliosis patients. Orthop. Traumatol. Surg. Res. 2014, 100, 797–801. [Google Scholar] [CrossRef]
- Caronni, A.; Donzelli, S.; Zaina, F.; Negrini, S. The Italian Spine Youth Quality of Life questionnaire measures health-related quality of life of adolescents with spinal deformities better than the reference standard, the Scoliosis Research Society 22 questionnaire. Clin. Rehabil. 2019, 33, 1404–1415. [Google Scholar] [CrossRef] [PubMed]
- Matamalas, A.; Bagó, J.; D’Agata, E.; Pellisé, F. Body image in idiopathic scoliosis: A comparison study of psychometric properties between four patient-reported outcome instruments. Health Qual. Life Outcomes 2014, 12, 81. [Google Scholar] [CrossRef] [PubMed]
- Savvides, P.; Gerdhem, P.; Grauers, A.; Danielsson, A.; Diarbakerli, E. Self-Experienced Trunk Appearance in Individuals with and Without Idiopathic Scoliosis. Spine 2020, 45, 522–527. [Google Scholar] [CrossRef] [PubMed]
- Asher, M.; Lai, S.M.; Burton, D.; Manna, B. The Reliability and Concurrent Validity of the Scoliosis Research Society-22 Patient Questionnaire for Idiopathic Scoliosis. Spine 2003, 28, 63–69. [Google Scholar] [CrossRef] [PubMed]
- Bago, J.; Sánchez-Raya, J.; Perez-Grueso, F.J.S.; Climent, J.M. The Trunk Appearance Perception Scale (TAPS): A new tool to evaluate subjective impression of trunk deformity in patients with idiopathic scoliosis. Scoliosis 2010, 5, 6. [Google Scholar] [CrossRef]
- Mannion, A.F.; Knecht, K.; Balaban, G.; Dvorak, J.; Grob, D. A new skin-surface device for measuring the curvature and global and segmental ranges of motion of the spine: Reliability of measurements and comparison with data reviewed from the literature. Eur. Spine J. 2004, 13, 122–136. [Google Scholar] [CrossRef]
- Post, R.B.; Leferink, V.J.M. Spinal mobility: Sagittal range of motion measured with the SpinalMouse, a new non-invasive device. Arch. Orthop. Trauma. Surg. 2004, 124, 187–192. [Google Scholar] [CrossRef]
- Ruggeri, S.K.; Siqueira, C.A.; Ribeiro, A.P.; Amado João, S.M. Reliability of photogrammetry in the evaluation the postural aspects of individuals with structural scoliosis. J. Bodyw. Mov. Ther. 2012, 16, 210–216. [Google Scholar]
- Penha, P.J.; Penha, N.L.J.; De Carvalho, B.K.G.; Andrade, R.M.; Schmitt, A.C.B.; João, S.M.A. Posture Alignment of Adolescent Idiopathic Scoliosis: Photogrammetry in Scoliosis School Screening. J. Manip. Physiol. Ther. 2017, 40, 441–451. [Google Scholar] [CrossRef]
- Porto, A.B.; Okazaki, V.U.A. Procedures of assessment on the quantification of thoracic kyphosis and lumbar lordosis by radiography and photogrammetry: A literature Review. J. Bodyw. Mov. Ther. 2017, 21, 986–994. [Google Scholar] [CrossRef]
- Russo, L. Biomeccanica: Principi di Biomeccanica e applicazioni della video analisi al movimento umano. ATS Giacomo Catalani Ed. 2019, 1, 584. [Google Scholar]
- Asher, M.; Lai, S.M.; Burton, D.; Manna, B. Discrimination Validity of the Scoliosis Research Society-22 Patient Questionnaire. Spine 2003, 28, 74–77. [Google Scholar] [CrossRef]
- Berliner, J.L.; Verma, K.; Lonner, B.S.; Penn, P.U.; Bharucha, N.J. Discriminative validity of the Scoliosis Research Society 22 questionnaire among five curve-severity subgroups of adolescents with idiopathic scoliosis. Spine 2013, 13, 127–133. [Google Scholar] [CrossRef] [PubMed]
- Cheshire, J.; Gardner, A.; Berryman, F.; Pynsent, P. Do the SRS-22 self-image and mental health domain scores reflect the degree of asymmetry of the back in adolescent idiopathic scoliosis? Scoliosis Spinal Disord. 2017, 12, 37. [Google Scholar] [CrossRef] [PubMed]
- Verma, K.; Nathan, S.T.; Comer, C.D.; Lonner, B.; Shah, S.A. A Normative Baseline for the Srs-22 From Over 1000 Healthy Adolescents in India: Which Demographic Factors Affect Outcome? Spine 2017, 42, 1011–1016. [Google Scholar] [CrossRef]
- Daubs, M.D.; Hung, M.; Neese, A.; Hon, S.D.; Lawrence, B.D.; Patel, A.A.; Annis, P.; Smith, J.; Brodke, D.S. Scoliosis Research Society-22 Results in 3052 Healthy Adolescents Aged 10 to 19 Years. Spine 2014, 39, 826–832. [Google Scholar] [CrossRef]
- Makino, T.; Kaito, T.; Kashii, M.; Iwasaki, M.; Yoshikawa, H. Low back pain and patient-reported QOL outcomes in patients with adolescent idiopathic scoliosis without corrective surgery. Springerplus 2015, 4, 397. [Google Scholar] [CrossRef] [PubMed]
- Auerbach, J.D.; Lonner, B.S.; Crerand, C.E.; Shah, S.A.; Flynn, J.M.; Bastrom, T.; Penn, P.; Ahn, J.; Toombs, C.; Bharucha, N.; et al. Body image in patients with adolescent idiopathic scoliosis: Validation of the Body Image Disturbance Questionnaire--Scoliosis Version. J. Bone Joint Surg. Am. 2014, 96, e61. [Google Scholar] [CrossRef]
- Bauer, J.M. The body image disturbance questionnaire-scoliosis better correlates to quality of life measurements than the spinal assessment questionnaire in pediatric idiopathic scoliosis. Spine Deform. 2021, 9, 1509–1517. [Google Scholar] [CrossRef]
- Payne, W.K. III.; Ogilvie, J.W.; Resnick, M.D.; Kane, R.L.; Transfeldt, E.E.; Blum, R.W. Does scoliosis have a psychological impact and does gender make a difference? Spine 1997, 22, 1380–1384. [Google Scholar] [CrossRef]
- Kinel, E.; Korbel, K.; Kozinoga, M.; Czaprowski, D.; Stępniak, Ł.; Kotwicki, T. The Measurement of Health-Related Quality of Life of Girls with Mild to Moderate Idiopathic Scoliosis—Comparison of ISYQOL versus SRS-22 Questionnaire. J. Clin. Med. 2021, 10, 4806. [Google Scholar] [CrossRef] [PubMed]
- Aebi, M. The adult scoliosis. Eur. Spine J. 2005, 14, 925–948. [Google Scholar] [CrossRef] [PubMed]
- Kuznia, A.L.; Hernandez, A.K.; Lee, L.U. Adolescent Idiopathic Scoliosis: Common Questions and Answers. Am. Fam. Physician 2020, 101, 19–23. [Google Scholar] [PubMed]
- Mayo, N.E.; Goldberg, M.S.; Poitras, B.; Scott, S.; Hanley, J. The Ste-Justine Adolescent Idiopathic Scoliosis Cohort Study. Spine 1994, 19, 1573–1581. [Google Scholar] [CrossRef]
- Sato, T.; Hirano, T.; Ito, T.; Morita, O.; Kikuchi, R.; Endo, N.; Tanabe, N. Back pain in adolescents with idiopathic scoliosis: Epidemiological study for 43,630 pupils in Niigata City, Japan. Eur. Spine J. 2010, 20, 274–279. [Google Scholar] [CrossRef]
- Brewer, P.; Berryman, F.; Baker, D.; Pynsent, P.B.; Gardner, A. Influence of Cobb Angle and ISIS2 Surface Topography Volumetric Asymmetry on Scoliosis Research Society-22 Outcome Scores in Scoliosis. Spine Deform. 2013, 1, 452–457. [Google Scholar] [CrossRef]
- Matamalas, A.; Bagó, J.; D’agata, E.; Pellisé, F. Validity and reliability of photographic measures to evaluate waistline asymmetry in idiopathic scoliosis. Eur. Spine J. 2016, 25, 3170–3179. [Google Scholar] [CrossRef]


| Subject | Age | Gender | Scoliosis |
|---|---|---|---|
| 1 | 15 | female | dorso-lumbar left |
| 2 | 14 | female | dorso-lumbar right |
| 3 | 13 | female | dorso-lumbar left |
| 4 | 12 | female | dorsal left |
| 5 | 13 | male | dorsal right |
| 6 | 22 | female | dorso-lumbar right |
| 7 | 15 | male | dorso-lumbar left |
| 8 | 13 | female | lumbar left |
| 9 | 12 | female | dorso-lumbar left |
| 10 | 13 | male | dorso-lumbar right |
| 11 | 12 | male | lumbar left |
| 12 | 18 | female | dorso-lumbar right |
| 13 | 16 | male | dorsal right |
| 14 | 12 | female | dorsal right |
| 15 | 17 | female | lumbar left |
| average = 14.47 (±2.82) | male = 31% | dorso-lumbar left = 26.66% | |
| female = 69% | dorso-lumbar right = 26.66% | ||
| lumbar left = 20% | |||
| dorsal right = 20% | |||
| dorsal left = 6.7% |
| Variable | Total (n = 15) | Female (n = 10) | Male (n = 5) | Δ | ||
|---|---|---|---|---|---|---|
| Mean (±SD) | Mean (±SD) | Mean (±SD) | Mean [95% C. I.] | t(13) | p | |
| Age | 14.47 (±2.82) | 14.8 (±3.29) | 13.8 (±1.64) | 1 [−2.42, 4.42] | 0.63 | 0.54 |
| SM antero/posterior | 0.8 (±3.53) | −0.3 (±3.83) | 3 (±1.22) | −3.3 [−7.16, 0.56] | −1.85 | 0.08 |
| SM lateral | −0.6 (±2.2) | −0.1 (±2.13) | −1.6 (±2.2) | 1.5 [−1.04, 4.04] | 1.27 | 0.22 |
| SM curvature | 8.2 (±5.3) | 8.7 (±5.81) | 7.2 (±4.44) | 1.5 [−4.92, 7.92] | 0.5 | 0.62 |
| ATSI | 16.73 (±10.7) | 21.3 (±10.1) | 7.6 (±3.65) | 13.7 [3.47, 23.93] | 2.9 | 0.01 * |
| POTSI | 18.8 (±6.65) | 16.9 (±4.77) | 22.6 (±8.73) | −5.7 [−13.11, 1.71] | −1.66 | 0.12 |
| TAPS | 3.6 (±0.40) | 3.63 (±0.46) | 3.53 (±0.3) | 0.1 [−0.39, 0.59] | 0.44 | 0.67 |
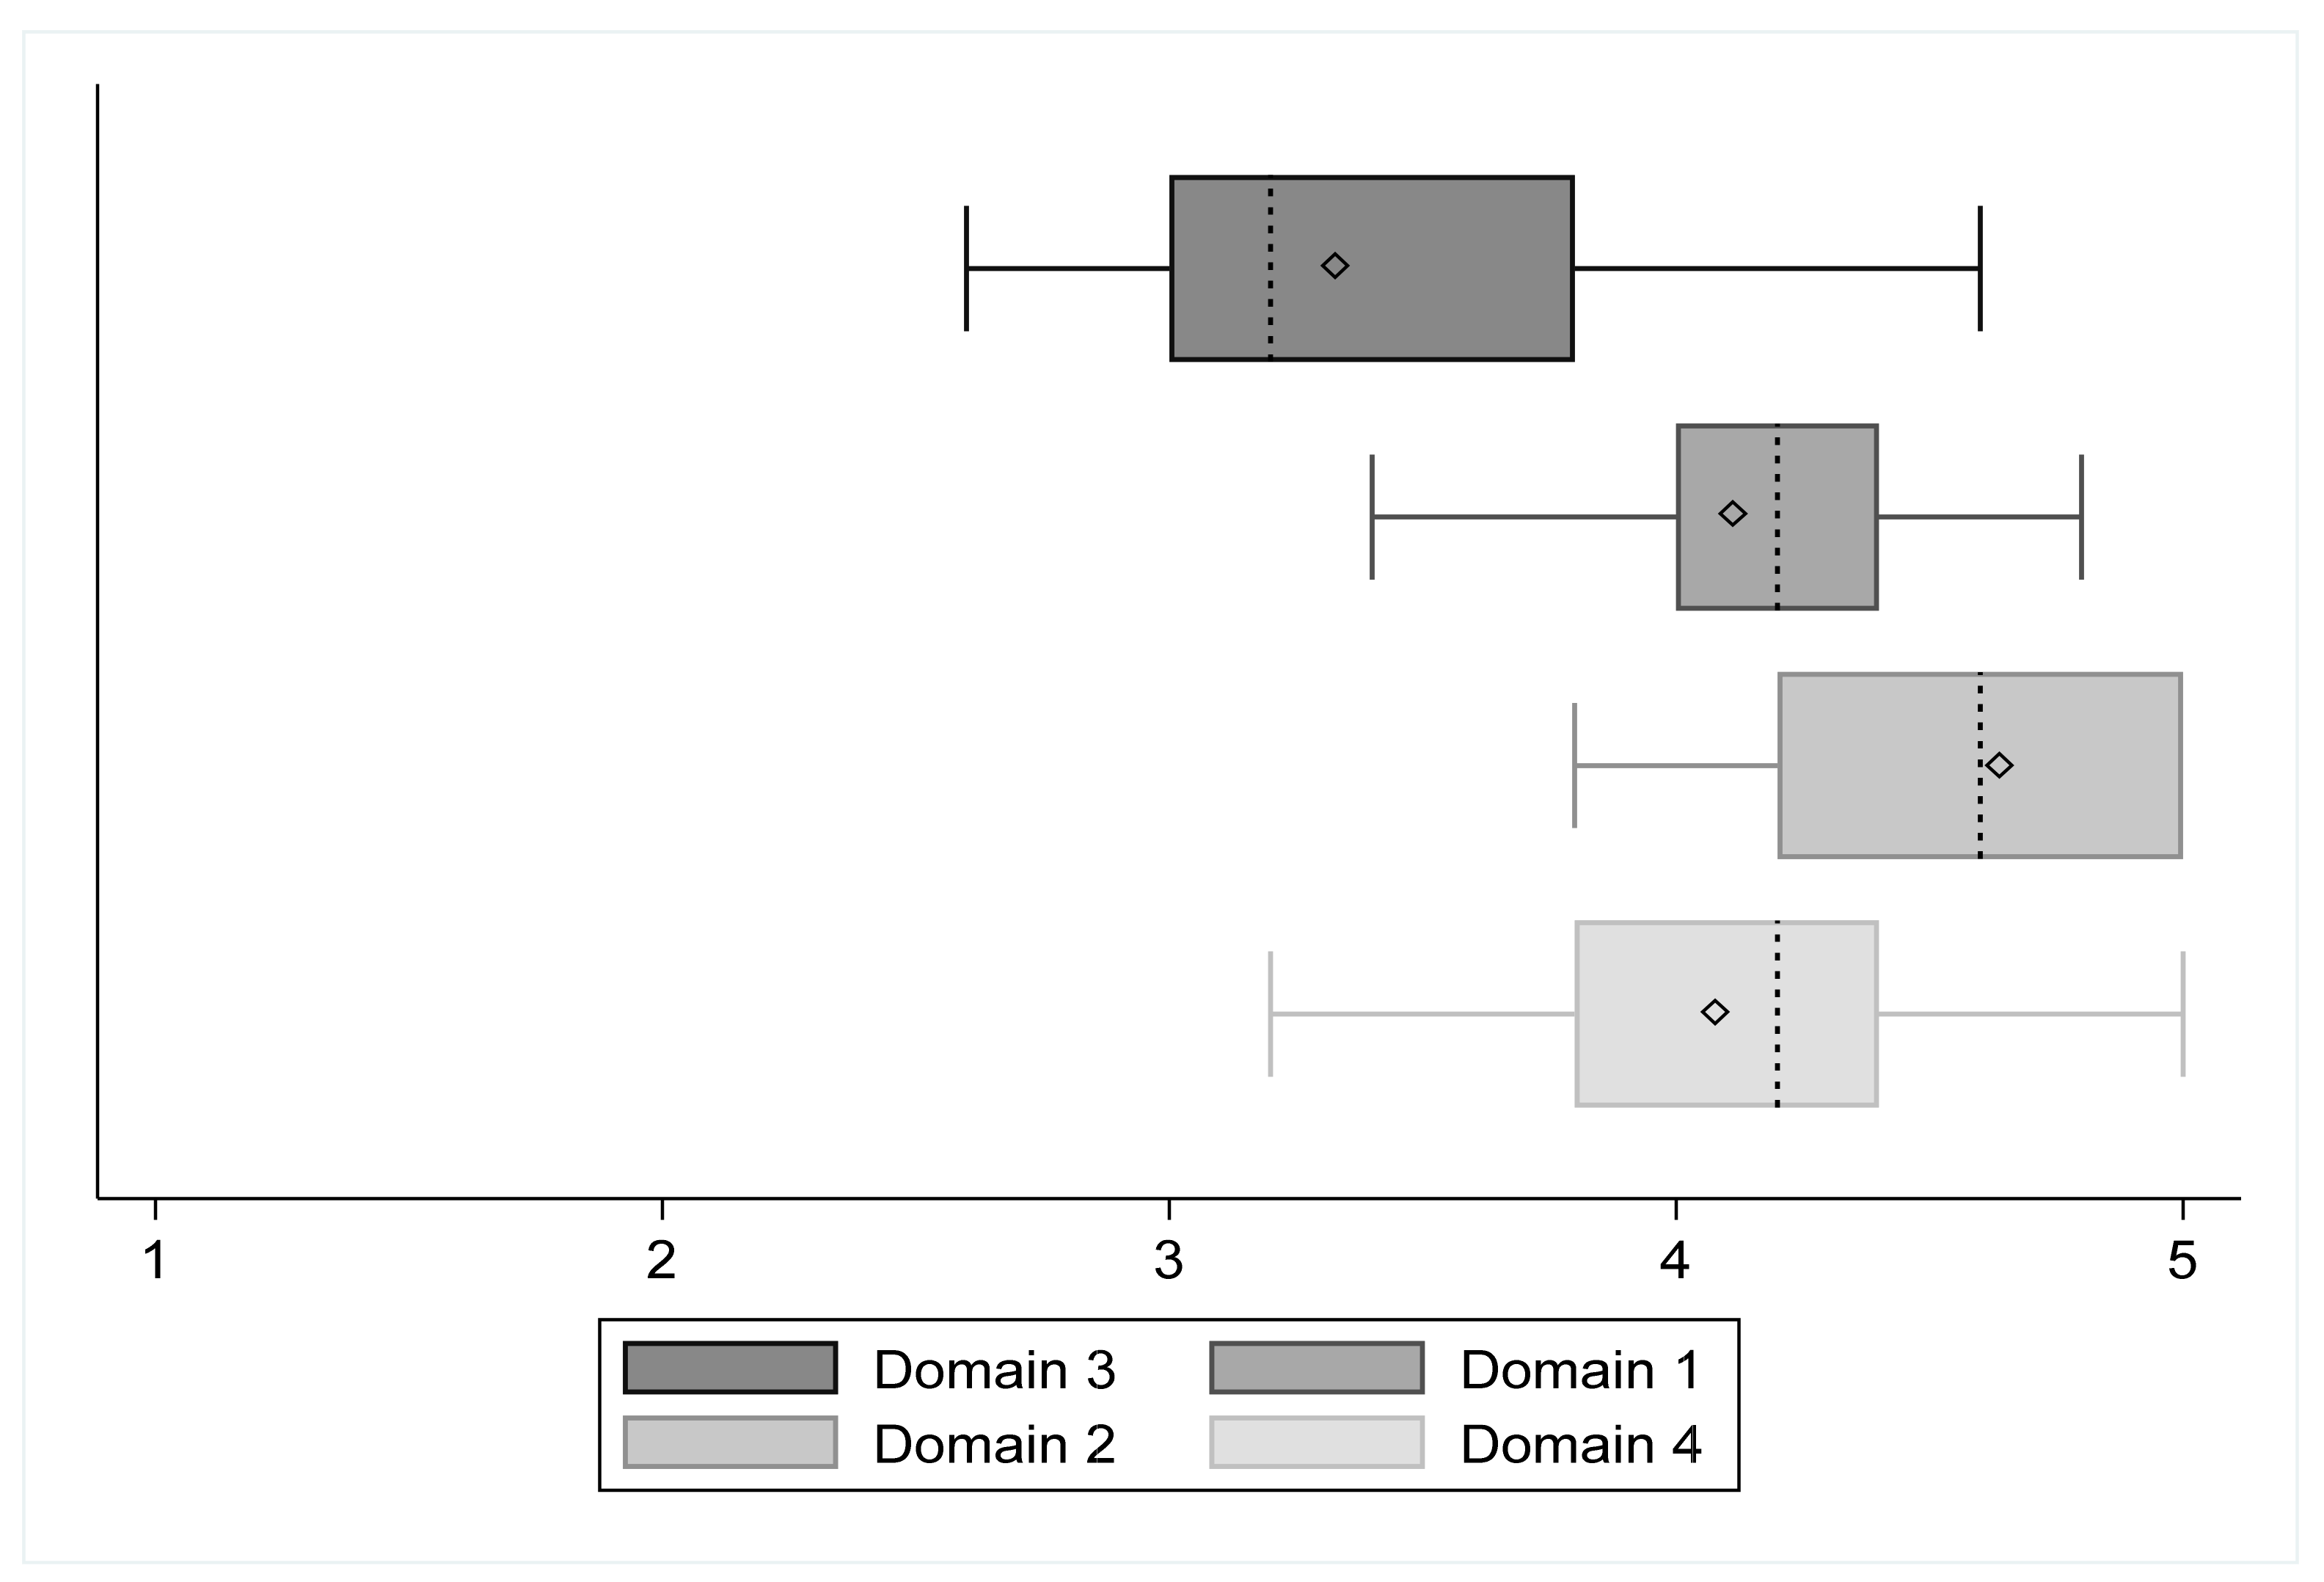
| SRS domain 1 | 4.15 (±0.37) | 4.14 (±0.42) | 4.16 (±0.26) | −0.02 [−0.47, 0.43] | −0.1 | 0.92 |
| SRS domain 2 | 4.57 (±0.41) | 4.62 (±0.43) | 4.48 (±0.41) | 0.14 [−0.36, 0.64] | 0.6 | 0.56 |
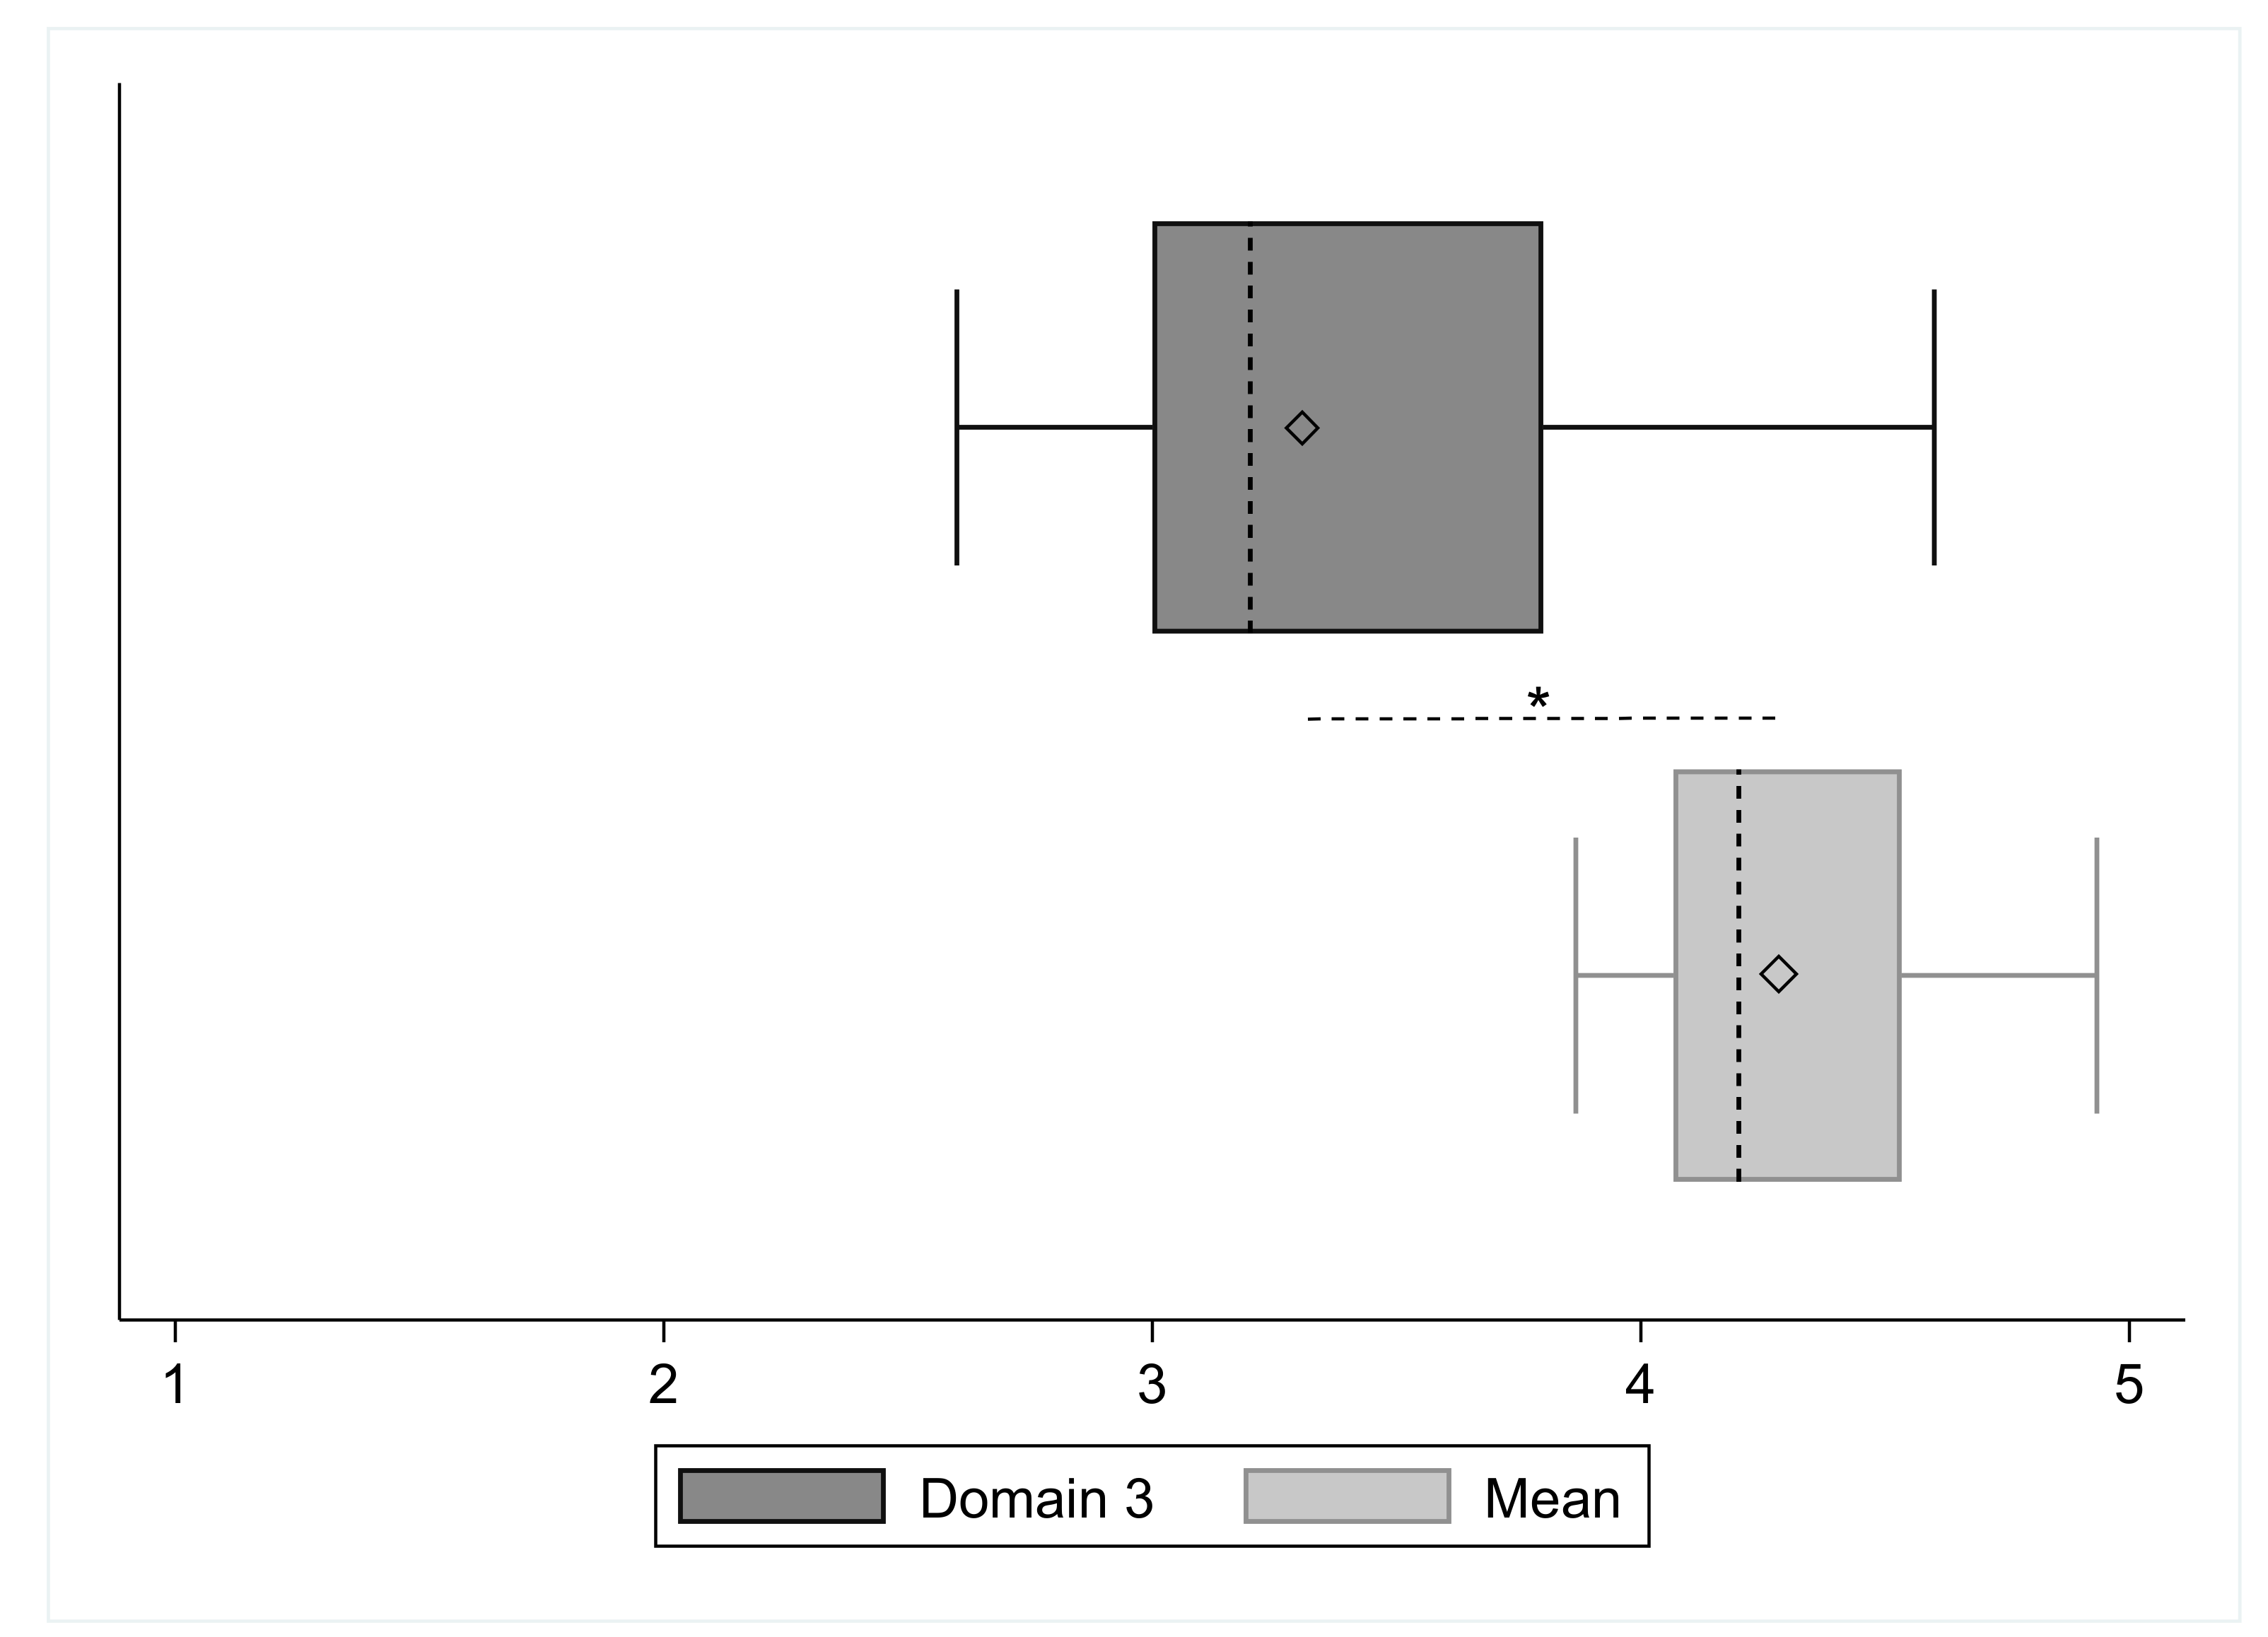
| SRS domain 3 | 3.30 (±0.56) | 3.26 (±0.57) | 3.4 (±0.58) | −0.14 [−0.82, 0.54] | −0.44 | 0.66 |
| SRS domain 4 | 4.12 (±0.44) | 4.12 (±0.51) | 4.12 (±0.30) | 0 [−0.54, 0.54] | 0 | 0.99 |
| SRS total mean | 4.28 (±0.28) | 4.29 (±0.33) | 4.25 (±0.20) | 0.04 [−0.31, 0.39] | 0.25 | 0.81 |
| Domains | Mean Diff | 95% C.I. | t | p | |
|---|---|---|---|---|---|
| D3-D1 | −0.84 | −1.07 | −0.61 | −7.70 | <0.001 * |
| D3-D2 | −1.26 | −1.63 | −0.90 | −7.46 | <0.001 * |
| D3-D4 | −0.81 | −1.14 | −0.49 | −5.36 | <0.001 * |
| D2-D1 | 0.42 | 0.14 | 0.71 | 3.26 | 0.005 * |
| D2-D4 | 0.45 | 0.21 | 0.70 | 4.01 | 0.001 * |
| D4-D1 | −0.02 | −0.34 | 0.28 | −0.18 | 0.85 |
| SpinM A/P | SpinM L | SpinM C | ATSI | POTSI | TAPS M | D1 | D2 | D3 | D4 | SRSMean | |
|---|---|---|---|---|---|---|---|---|---|---|---|
| SpinM A/P | 1 | ||||||||||
| SpinM L | −0.08 | 1 | |||||||||
| SpinM C | −0.34 | −0.39 | 1 | ||||||||
| ATSI | −0.76 | 0.52 | 0.08 | 1 | |||||||
| POTSI | 0.21 | −0.46 | −0.07 | −0.34 | 1 | ||||||
| TAPS M | 0.34 | 0.09 | −0.23 | −0.20 | 0.30 | 1 | |||||
| D1 | 0.29 | −0.15 | −0.40 | −0.24 | 0.23 | 0.13 | 1 | ||||
| D2 | −0.01 | 0.11 | 0.12 | 0.05 | 0.02 | −0.33 | 0.16 | 1 | |||
| D3 | 0.07 | −0.16 | −0.33 | −0.25 | 0.37 | 0.35 | 0.66 | 0.11 | 1 | ||
| D4 | 0.27 | 0.23 | −0.11 | −0.2 | 0.07 | 0.18 | 0.04 | 0.47 | 0.33 | 1 | |
| SRSMean | 0.26 | 0.10 | −0.17 | −0.18 | 0.15 | −0.01 | 0.5 | 0.79 | 0.50 | 0.76 | 1 |
| Source | SS | df | MS | |||
|---|---|---|---|---|---|---|
| Model | 1.66 | 1 | 0.83 | obs | 15 | |
| Residual | 2.73 | 13 | 0.23 | F(1,13) | 3.65 | |
| Total | 4.39 | 14 | 0.31 | Prob > F | 0.05 | |
| R2 | 0.38 | |||||
| Adj R2 | 0.27 | |||||
| Root MSE | 0.48 | |||||
| D3 | Β | S.E. | t | p | 95% C.I. | |
| Intercept | −2.71 | 2.23 | −1.21 | 0.25 | −7.58 | 2.16 |
| TAPSM | 0.49 | 0.32 | 1.55 | 0.15 | −0.2 | 1.18 |
| SRSmean | 0.99 | 0.45 | 2.22 | 0.05 | 0.02 | 1.96 |
| Source | SS | df | MS | |||
|---|---|---|---|---|---|---|
| Model | 2.39 | 3 | 0.8 | obs | 15 | |
| Residual | 2 | 11 | 0.11 | F(4,10) | 4.39 | |
| Total | 4.39 | 14 | 0.31 | Prob > F | 0.03 | |
| R2 | 0.54 | |||||
| Adj R2 | 0.42 | |||||
| Root MSE | 0.43 | |||||
| D3 | Β | S.E. | t | p | 95% C.I. | |
| Intercept | −1.85 | 1.77 | −1.04 | 0.32 | −5.75 | 2.06 |
| D1 | 1.02 | 0.32 | 3.24 | 0.01 | 0.33 | 1.72 |
| D2 | −0.24 | 0.32 | −0.76 | 0.47 | −0.94 | 0.46 |
| D4 | 0.49 | 0.29 | 1.66 | 0.13 | −0.16 | 1.14 |
| TAPS | obs | 15 | ||||
| Source | SS | df | MS | F(4,10) | 1.82 | |
| Model | 0.54 | 1 | 0.54 | Prob > F | 0.2 | |
| Residual | 3.85 | 13 | 0.3 | R2 | 0.12 | |
| Total | 4.39 | 14 | 0.31 | AdjR2 | 0.05 | |
| Root MSE | 0.54 | |||||
| D3 | Β | S.E. | t | p | 95% C.I. | |
| Intercept | 1.55 | 1.31 | 1.18 | 0.26 | −1.28 | 4.38 |
| TAPSM | 0.49 | 0.36 | 1.35 | 0.2 | −0.29 | 1.27 |
| SpinalMouse | obs | 15 | ||||
| Source | SS | df | MS | F(4,10) | 1.09 | |
| Model | 1.00 | 3 | 0.33 | Prob > F | 0.39 | |
| Residual | 3.39 | 11 | 0.31 | R2 | 0.23 | |
| Total | 4.39 | 14 | 0.31 | AdjR2 | 0.02 | |
| Root MSE | 0.55 | |||||
| D3 | Β | S.E. | t | p | 95% C.I. | |
| Intercept | 3.73 | 0.31 | 12.08 | <0.001 | 3.05 | 4.40 |
| SpinM A/P | −0.02 | 0.05 | −0.49 | 0.63 | −0.12 | 0.08 |
| SpinM L | −0.1 | 0.07 | −1.29 | 0.22 | −0.26 | 0.07 |
| SpinM C | −0.06 | 0.03 | −1.68 | 0.12 | −0.13 | 0.02 |
| Photogrammetry | obs | 15 | ||||
| Source | SS | df | MS | F(4,10) | 1.09 | |
| Model | 0.67 | 2 | 0.34 | Prob > F | 0.37 | |
| Residual | 3.72 | 12 | 0.31 | R2 | 0.15 | |
| Total | 4.39 | 4 | 0.31 | Adj R2 | 0.01 | |
| Root MSE | 0.56 | |||||
| D3 | β | S.E. | t | p | 95% C.I. | |
| Intercept | 2.93 | 0.6 | 4.9 | <0.001 | 1.63 | 4.23 |
| ATSI | −0.01 | 0.01 | −0.51 | 0.62 | −0.04 | 0.02 |
| POTSI | 0.03 | 0.02 | 1.13 | 0.28 | −0.02 | 0.09 |
Publisher’s Note: MDPI stays neutral with regard to jurisdictional claims in published maps and institutional affiliations. |
© 2022 by the authors. Licensee MDPI, Basel, Switzerland. This article is an open access article distributed under the terms and conditions of the Creative Commons Attribution (CC BY) license (https://creativecommons.org/licenses/by/4.0/).
Share and Cite
Belli, G.; Toselli, S.; Latessa, P.M.; Mauro, M. Evaluation of Self-Perceived Body Image in Adolescents with Mild Idiopathic Scoliosis. Eur. J. Investig. Health Psychol. Educ. 2022, 12, 319-333. https://doi.org/10.3390/ejihpe12030023
Belli G, Toselli S, Latessa PM, Mauro M. Evaluation of Self-Perceived Body Image in Adolescents with Mild Idiopathic Scoliosis. European Journal of Investigation in Health, Psychology and Education. 2022; 12(3):319-333. https://doi.org/10.3390/ejihpe12030023
Chicago/Turabian StyleBelli, Guido, Stefania Toselli, Pasqualino Maietta Latessa, and Mario Mauro. 2022. "Evaluation of Self-Perceived Body Image in Adolescents with Mild Idiopathic Scoliosis" European Journal of Investigation in Health, Psychology and Education 12, no. 3: 319-333. https://doi.org/10.3390/ejihpe12030023
APA StyleBelli, G., Toselli, S., Latessa, P. M., & Mauro, M. (2022). Evaluation of Self-Perceived Body Image in Adolescents with Mild Idiopathic Scoliosis. European Journal of Investigation in Health, Psychology and Education, 12(3), 319-333. https://doi.org/10.3390/ejihpe12030023