Article

Influence of Cellulose Characteristics on Pyrolysis Suitability

by
María E. Eugenio
1,
Mercedes Ruiz-Montoya
2,
Raquel Martín-Sampedro
1,
David Ibarra
1,* and
Manuel J. Díaz
2,*
1
Forest Research Center (INIA, CSIC), Ctra. de la Coruña Km 7.5, 28040 Madrid, Spain
2
Research Center in Technology of Products and Chemical Processes, Pro2TecS-Chemical Engineering Department, Campus El Carmen, University of Huelva, 21071 Huelva, Spain
*
Authors to whom correspondence should be addressed.
Processes 2021, 9(9), 1584; https://doi.org/10.3390/pr9091584
Submission received: 29 July 2021 / Revised: 27 August 2021 / Accepted: 1 September 2021 / Published: 4 September 2021
(This article belongs to the Special Issue Thermochemical Conversion and Revalue of Biomass)

Abstract

:
Cellulose is the most abundant component of biomass and the one that requires the most activation energy (Ea) for pyrolysis. In this study, the dependence of Ea on the intrinsic cellulose characteristics, such as the degree of polymerization (DP), crystallinity, and crystal size, was studied in different cellulose samples, including samples from Eucalyptus globulus, Ulmus minor, Linun usitatissimum, Olea europaea, Robinia pseudoacacia, and Populus alba. Then, to describe the pyrolytic degradation of cellulose, the Ozawa–Flynn–Wall kinetic method was the most appropriate among the isoconversional models studied. An acceptable quadratic relationship of R2 > 0.9 between the Ea values of the different cellulose samples with their corresponding DP, crystallinity index, and crystal size values was found. Therefore, low crystallinity and low-to-medium crystal size values are desired to obtain lower Ea values for cellulose pyrolysis. On the other hand, DP did not present a clear effect on Ea in the studied DP range.

1. Introduction

One of the most important goals of today’s society is the transition from a fossil fuel-based economy to a sustainable bioeconomy with the aim of mitigating global greenhouse gas (GHG) emissions, the alarming increase in global energy demand, and the exhaustion of fossil fuel reserves [1]. In this context, biomass is a renewable source with constant global availability that can be used for the manufacture of a wide variety of bio-products, including chemicals, materials, food, and feed [2]. Moreover, it can be converted into liquid, solid, or gaseous fuels without contributing to the net increase in the level of CO2 in the atmosphere [3,4,5], especially when residual biomass is used [6]. Among the most promising technologies for the transformation and valorization of biomass are thermochemical processes such as liquefaction, gasification, pyrolysis, and combustion [7].
The three main components of lignocellulosic biomass are cellulose, hemicelluloses, and lignin, varying in contents and characteristics depending on the type of biomass. The kind of thermochemical process to be used for biomass recovery is greatly influenced by its physico-chemical characteristics. However, according to Chen et al. [8], most of the published studies in this field have focused on the type of biomass but not on its components and characteristics. Therefore, the influence of the characteristics of biomass components on the kind of recovery process to be used should be extensively studied.
Among the thermochemical processes, pyrolysis is one of the recovery processes with the best industrial prospects as it can be optimized to maximize the yields of the final product, i.e., liquid, gas, or biochar [9]. As a positive side effect, H2 is also obtained through pyrolysis as a by-product [10]. As biomass, as it was mentioned before, is basically composed of cellulose, hemicelluloses, and lignin, the reaction rate and, therefore, the residence time and temperature depend on both the operating variables and the kinetic constants of the pyrolysis process. It is important to investigate the influence of the parameters related to these components on the kinetic constants, as well as to find the best model, among those usually used, to explain the data found. The most important operating parameters may include the temperature at which pyrolysis is performed, as well as the activation energy (Ea) as a function of the parameters of the biomass components. As already confirmed by the studies of Carrier et al., Larrain et al., and Várhegyi [11,12,13], the evolution of Ea as a function of the degree of advancement shows a dependence of the cellulose rupture mechanism on the process temperature. Thus, it has been suggested that weak bond scission represents the rate-limiting radical generation step in the pyrolysis process. For natural polymers such as cellulose, the global activation energy represents the scission of a much broader variety of bonds of varying strengths.
The thermal degradation of cellulose by pyrolysis has been previously described as a function of first-order reactions [14], although several authors have described it as a function of other reaction orders that implies the existence of parallel reactions between the main components of biomass i.e., cellulose, hemicelluloses, and lignin [15]. Although fitting to a first-order reaction has been shown to provide higher values than true A and Ea values [16], it can be used in a comparative study among celluloses with different characteristics. In this sense, Antal et al. [17] found an Ea value of 228 kJ mol−1 and Wu et al. [18] reported values between 214.5 and 275.1 kJ mol−1 both for commercial ash-free celluloses. Amutio et al. [19] described an Ea value of 206 kJ mol−1 for pine wood sawdust cellulose, whereas Cai et al. [20] found values between 204.2 and 212.5 kJ mol−1 for several celluloses extracted from different raw materials, such as corn stover, cotton stalk, palm oil husk, pine wood, red oak, sugarcane bagasse, switchgrass, and wheat straw. Radojević et al. [21] found values between 180 and 240 kJ mol−1 in celluloses from corn brakes, wheat straw, hazelnut shell, and sawdust as raw material. Moreover, Adenson et al. [22] reported an Ea value of 199 ± 2.0 kJ mol−1 for microcrystalline cellulose. Therefore, the variations in kinetic values calculated by different authors could be due to both the effect of the physical form and the distinctive chemical characteristics of the cellulose.
Although it is known that reaction conditions, such as different heating rate, residence time, and particle size, for each type of pyrolysis reactor are different, the knowledge of the factors related to cellulose that can affect the kinetics can help to improve the designs for large-scale equipment. In this sense, different studies about the influence of several parameters related to the cellulose pyrolysis process have been reported [23,24,25,26]. However, in these studies, only parameters such as process temperature, particle size, residence time, and pressure have been evaluated. Few studies on the influence of the susceptibility of the intrinsic characteristics of cellulose to the pyrolysis process have been conducted. For that reason, this study aimed to calculate the relationship between cellulose characteristics, including the degree of polymerization, crystallinity index and crystal size, and kinetic constants, serving as a reference to optimize the biomass pyrolysis process.

2. Materials and Methods

2.1. Raw Materials

Black locust and poplar woods, from the Robinia pseudoacacia L. genotype Nyirsegi and Populus alba L. clone PO-10-10-20, respectively, were provided by the Silviculture and Forest Management Department of INIA, CSIC (Madrid, Spain), whereas olive tree, Olea europaea, pruning was supplied by Universidad de Jaén (Jaén, Spain).
Elm wood, from Ulmus minor clone Ademuz, registering in Spain as tolerant to Dutch elm disease, was provided by the Spanish elm breeding program between the Polytechnical University of Madrid and the Spanish Environmental Administration. Eucalyptus (Eucalyptus globulus) and flax (Linun usitatissimum) bleached commercial pulps were kindly supplied by La Montañesa pulp mill (Lecta Group, Zaragoza, Spain) and Celesa (Tortosa, Tarragona, Spain), respectively.
All used chemicals were reagent-grade and obtained from Sigma-Aldrich (Madrid, Spain) or Merck (Barcelona, Spain).

2.2. Cellulose Production and Chemical Composition

All cellulose samples were obtained from R. pseudoacacia, P. alba, U. minor, and O. europaea using the kraft pulping process followed by a bleaching sequence. Kraft pulping was carried out using a 15 L batch cylindrical reactor, which was equipped with a rotating shaft to ensure proper agitation. The conditions of the kraft pulping, the type of bleaching sequence, and the conditions of the bleaching stages were set for each raw material in order to obtain cellulose samples with the lowest lignin content, taking into account previous works [27,28,29,30].
Pulping conditions for P. alba were: 20% sulfidity, 17% active alkali, 170 °C, 120 min, and a liquid/solid ratio of 7:1 [27]. Then, the resulting unbleached sample was submitted to a standard industrial totally chlorine-free (TCF) bleaching sequence consisting of OOQPoP, where O is a twice delignification stage of oxygen (held twice), Q is a chelating stage, and P and Po are hydrogen peroxide bleaching stages without or with oxygen. The conditions used in each bleaching stage were those described by Ibarra et al. [28]. In brief, oxygen delignification stages were: 6 MPa of oxygen pressure, 60 min, 98 °C, 0.5% MgSO4 o.d.p. (oven dry pulp), 1.5% NaOH o.d.p., and 20% (w/v) of consistency. The chelating step was performed using 0.3% diethylenetriaminepentaacetic acid (DTPA) at 85 °C for 60 min and at pH 5–6. Finally, the bleaching conditions in the first step were: 2% NaOH, 0.5% Na2Si2O3, 0.1% MgSO4, and 3% H2O2 for 140 min at 105 °C pressurized with oxygen at 6 kg cm−2, while the second step was carried out using the same chemical reagents but for 180 min at 98 °C without pressure. Cellulose pulps were washed after each stage using deionized water and stored at 4 °C.
Pulping conditions for R. pseudoacacia and U. minor wood were: 21% sulfidity, 16% active alkali, a liquor-to-wood ratio of 6:1 liquid/solid, and 90 min at maximum temperature (165 °C). After pulping, an oxygen delignification step was carried out at 98 °C, 60 min, 0.6 MPa of oxygen pressure, 1.5% NaOH o.d.p., 0.5% MgSO4 o.d.p., and 10% (w/v) consistency. Then, the bleaching sequence used for both materials was QPP, consisting of a chelation step at 85 °C, 60 min, pH 5–6, and 0.3% DTPA, followed by two steps of hydrogen peroxide. The first hydrogen peroxide step conditions were: 3% H2O2 o.d.p., 2% NaOH o.d.p., 0.1% MgSO4 o.d.p., 10% (w/v) of consistency, and 105 °C for 140 min; and the second step conditions were the same as the first step except for temperature and time: 98 °C for 180 min [29]. Cellulose pulps were washed after each stage using deionized water and stored at 4 °C.
Pulping conditions for O. europaea were: 175 °C, 90 min, 20% active alkali, 25% sulfidity, and 5:1 liquid/solid ratio [30]. After kraft pulping, the resulting unbleached pulp was subjected to an oxygen delignification (O) stage followed by three consecutive peroxide bleaching (P) stages, resulting in the OPPP bleaching sequence [30]. The conditions of the O stage were 100 °C, 50 min, 6 MPa of oxygen pressure, 2.5% NaOH o.d.p., 0.5% MgSO4 o.d.p., 0.1% DTPA o.d.p., and 10% (w/v) of consistency, using the same reactor described above for the pulping process. Then, P stages were performed under the following conditions: 90 °C, 90 min, 1.5% NaOH o.d.p., 0.2% MgSO4 o.d.p., 1% DTPA o.d.p. and 3% H2O2 o.d.p., and 6% (w/v) of consistency in a plastic bag submerged in a thermostatic bath. Cellulose pulps were washed after each stage using deionized water and stored at 4 °C.
The chemical composition of the resulting cellulose pulps, as well as the commercial pulps, was determined according to NREL/TP-510-42618: Laboratory Analytical Procedures for determination of carbohydrates and lignin in biomass [31]. After acid hydrolysis, the carbohydrate concentration was determined by high-performance liquid chromatography (HPLC) in an Agilent Technologies 1260 HPLC fitted with a refractive index detector (Agilent, Waldbronn, Germany) and equipped with an Agilent Hi-PlexH column at 65 °C using 5 mM of sulfuric acid as mobile phase at 0.6 mL min−1.
All cellulose pulps were soaked in diluted HCl solution (pH 2, 10% (w/v) consistency), mechanically stirred for 20 min, and intensively washed with water to remove heavy metals, if present.

2.3. Degree of Polymerization

The degree of polymerization of the different bleached cellulose pulps was calculated as the viscosity-average molecular weight. First, the intrinsic viscosity in the cupri-ethylenediamine (CED) solution was determined according to the ISO 5351 standard for each cellulose sample. Then, the degree of polymerization (DPv) was calculated according to the Mark–Houwink–Sakurada equation (Equation (1)), as other authors have referenced [30,32,33]:
[ μ ] = K p D P v a  
where [µ] is the intrinsic viscosity in g mL−1, DPv is the degree of polymerization, and Kp and a are empirical parameters. The values of these empirical parameters for cellulose have been determined by several authors using different solvents. Thus, for cellulose pulp dissolved in CED, Kp and a values can be considered as 1.70 mL g−1 and 0.80, respectively [32].

2.4. Crystallinity

Bleached cellulose pulps were analyzed by X-ray powder diffraction to determine their crystallinity. Cellulose pulps were pressed as pellets before being analyzed. A Bruker D8 Advance instrument (Bruker, Billerica, MA, USA) equipped with a Cu anode (CuKα radiation) and Ni filter was used. The voltage was set at 40 kV and the current sources at 30 mA. Diffraction patterns were recorded between 8° and 40° (2θ diffraction angle) using a step size of 0.04 and a goniometer speed of 1 s per step. Then, the Segal method was used to determine the crystallinity index (CI) according to Equation (2):
C I = I 002 I A M I 002 · 100
where I002 is the height of the crystalline (002) peak and IAM is the height of the amorphous intensity.
The average size of the nanocrystallites (t) was also estimated for the different cellulose pulps, based on the Scherrer equation (Equation (3)) using the (002) reflection:
t = k · λ β · c o s Θ
where k is the correction factor (0.9), λ is the radiation wavelength (0.15418 nm), β is the width of the peak at half of the maximum height (in radians), and Θ is the diffraction angle of the peak.

2.5. Thermogravimetric Analysis

The thermal decomposition behavior of the cellulose pulps was evaluated by thermogravimetric equipment (TGA) (Mettler Toledo TGA/DSC1 STARe System, Mettler-Toledo, S.A.E., L’Hospitalet de Llobregat, Barcelona, Spain). The studies were carried out by heating samples, quantities between 50 and 100 mg, from room temperature to 800 °C. Four heating rates, including 5, 10, 15, and 20 °C min−1, with a nitrogen flow of 20 cm3 min−1, were used in each of the samples. The resulting data were analyzed in order to determine the Arrhenius activation energy (E) and the pre-exponential constant (A) by using different isoconversional methods. Netzsch Kinetics Neo (v2.1.2.1) software (NETZSCH-Gerätebau GmbH, Selb, Germany) was employed for the determination of the parameters.

2.6. Kinetic Modeling

The kinetics of thermal degradation of organic materials, such as cellulose, has been commonly studied by thermogravimetric techniques under both isothermal and nonisothermal conditions. In general, model-free kinetic methods based on the Arrhenius equation are among the most widely used. Therefore, the common modeling methods used have been evaluated [34,35]. In this sense, ASTME-2070, Friedman, Ozawa–Flynn–Wall, and Kissinger–Akahira–Sunose methods were selected [34,36,37]. These models allow us to determine the main kinetic constants such as the activation energy (Ea) and the pre-exponential factor (A) without having to assume a certain kinetic model for the studied reactions [38]. However, under these kinetic methods, it is not possible to determine either the number of reaction steps or their contribution to the total effect.
This type of analysis is used in several American Society of Testing Materials (ATM) methods such as ATME-698, ATME-2890, ATME-1641, and ASTME-2070. These equations are also the scientific basis for other commonly used methods such as those of Friedman, Ozawa–Flynn–Wall (OFW), or Kissinger–Akahira–Sunose (KAS).

2.6.1. Ozawa–Flynn–Wall and ASTME-2070 Methods

The Ozawa–Flynn–Wall method [39,40] could be deduced as the most suitable to explain thermal degradation by the pyrolysis of cellulose, regardless of the degree of polymerization and crystallinity. This is an isoconversional method, suitable for single-step reactions, in which the Ea must be constant in the weight loss region [40]. The Ea values were determined according to Equation (4).
ln ( β ) = ln ( A   E a R   g ( α ) ) 2.315 0.4567 ( E a R T )
where β is the heating rate, A is the pre-exponential factor, g(α) is a function of the conversion, Ea is the activation energy, and R is the gas constant.
Therefore, for a given degree of conversion (α) and under the different heating rates (β) studied, a linear relationship of the maximums of the thermogravimetric curves recorded, plotted by the natural logarithm of heating speeds (ln β), as opposed to (1/T), can be calculated. From the slope (−0.4567 (Ea/RT)) of the calculated straight line, the Ea can be obtained.
A significant advantage of this method is that it can be used for the calculation of Ea without the need to know the reaction mechanism beforehand [41]. However, on the other hand, it has the disadvantage that the tests must be with similar samples and process conditions, as fluctuations usually cause measurement errors [42]; therefore, in the present study, four replicas of each sample were used.
In this sense, the standard ASTME-2070 method, aimed to evaluate the kinetic behavior at reaction initiation, is also based on this equation, although only the 5% conversion rate data were used.

2.6.2. Friedman Method

The differential isoconversional method of Friedman is also based on the Arrhenius equation:
d α d t = ln ( f ( α ) ) A ( E a R T )
According to this equation, under different heating rates, a constant value for f(α) A must be obtained at the same conversion degree. Therefore, as a function between temperature T and reaction rate (/dt) at a fixed conversion degree and under different heating rates, the activation energy can be deduced from the slope of ln(/dt) versus 1/T. Furthermore, A can be calculated from the intercept with the axes.

2.6.3. Kissinger–Akahira–Sunose (KAS) Method

The KAS integral method is also derived from the Arrhenius equation. In this case, this equation can be integrated from the initial condition of α = 0 for T = T0, obtaining the expression shown in Equation (6).
ln ( β T 2 ) = ln ( A   R E a ) ( E a R T )
The activation energy can be deduced from the slope of ln(β/T2) versus 1/T. Furthermore, A can also be calculated from the intercept with the axes.

3. Results and Discussion

3.1. Composition of Cellulose Pulps

Cellulose pulps showed cellulose, hemicellulose, and lignin contents of 69.2–88.7%, 5.2–20.6%, and 0.2–2.5%, respectively, as it can be observed in Table 1.
The O. europaea sample presented the highest total lignin content and the L. usitatissimum sample the lowest compared with the rest of the cellulose pulps. Regarding the carbohydrates content, glucan was the most abundant carbohydrate in all samples, followed by xylan, which is a normal composition after alkaline pulping processes such as kraft or soda. In concordance with lignin content results, O. europaea showed the lowest value in glucan content and L. usitatissimum the highest. These results could be explained not only by the different conditions used during the pulping and bleaching processes for each raw material, which were optimized to obtain samples as rich in cellulose as possible, but also by the initial raw material to be processed. Thus, the compositions obtained for O. europaea and E. globulus were very similar to that found by Fillat et al. [30], who used the same cellulose samples production procedure as that in the present study.
Francis et al. [43] achieved lignin content values of 0.4% for black locust kraft bleached pulp under similar pulping conditions than those used in this work but using an elementary chlorine-free (ECF) bleaching sequence. Regarding flax, Barba et al. [44] and Ye and Farriol [45] presented a similar composition than that found in this study.

3.2. Degree of Polymerization, Crystallinity and Crystal Size of Cellulose Pulps

3.2.1. Degree of Polymerization

As it is known, the degree of polymerization (DP) is the average number of monomers that form the polymer molecules. In the case of cellulose pulps, the DP is calculated through their viscosity, as explained in Section 2.3. The DP values for the different cellulose samples tested were within the range of 1939–2744 (Table 2). The highest values were described for E. globulus and U. minor samples and the lowest for P. alba and R. pseudoacacia samples, while the other samples showed intermediate values. These values are in concordance with those reported by other authors. Thus, Fillat et al. [30] found very similar DP values for olive tree pruning and eucalypt bleached cellulose pulps. Ibarra et al. [28] reported different viscosity values for different nonwood soda pulps, with the abaca cellulose sample being the one presenting the highest viscosity, around 1200 mL g−1, while the flax cellulose sample showed a viscosity of 800 mL g−1, corresponding to a DP very similar to that found in this work for the same pulp. Different DP values were found by Kim et al. [46] for Funacel, cotton, and halocynthia cellulose samples with values of 520, 4300, and 19,000, respectively, which were isolated using a different process than the one used in this work. Przybysz et al. [47] showed a DP of around of 1500 for different hybrids and clones of poplar cellulose pulps without bleaching. Therefore, a higher value was obtained in our case for bleached P. alba cellulose pulp, taking into account that the bleaching process normally decreases the DP.
Therefore, as expected, not only the source of cellulose but also the processes used for isolating it have influence on the degree of polymerization of the resulting samples.

3.2.2. Crystallinity and Crystal Size

Cellulose molecules have a strong tendency to form intra- and inter-molecular hydrogen bonds, which may give rise to several ordered crystalline arrangements and packaging [48], whereas the surface of these cellulose packages can only be regarded as an amorphous region, in the same way that hemicelluloses and lignin [49]. The degree of crystallinity of cellulose is one of the most significant crystalline structure parameters, with X-ray diffraction being one of the methods generally used to evaluate it, either in different vegetable materials or cellulose samples [50]. The cellulose crystallinity index of cellulose samples depends, among other factors, on the biomass source [51]. In this study, the crystallinity index (CI) values of the different cellulose samples were calculated from their different X-ray diffractograms according to the Segal methods (Equation (2)) (Table 2). The highest percentage of crystallinity was displayed for the L. usitatissimum sample, with a value of 95.5%, while the lowest value was presented for O. europaea, with a value of 86.8%, with intermediate values for P. alba (93.8%), E. globulus (91.2%), R. pseudoacacia (89.9%), and U. minor (89.0%) cellulose pulps. In this sense, Agarwal et al. [50] showed a higher crystallinity index of flax biomass compared to other hardwoods and softwoods, in accordance with data showed herein. Moreover, the type of pulping process, i.e., chemical reagents, temperature, pressure, etc., also influences the cellulose crystallinity [50,52]. Thus, either the removal degree of hemicellulose, lignin, extractives, etc., or the grade of attack, i.e., peeling and chain scissions, on the amorphous domains of cellulose is a factor that affects the crystallinity of cellulose samples. In this way, Gümüskaya et al. [53] showed a major crystallinity of linter cotton submitted to soda pulping compared to kraft pulping.
The crystal size values of the different cellulose samples, based on the Scherrer equation (Equation (3)) using the (002) reflection are also shown in Table 2. Generally, crystal size values increase with crystallinity index values. Thus, the highest crystal size was displayed for the E. globulus sample, with a value of 10.9, while the lowest value was presented for the O. europaea sample (8.1), with intermediate values for P. alba (9.4), L. usitatissimum (9.1), R. pseudoacacia (8.9), and U. minor (8.6) samples.

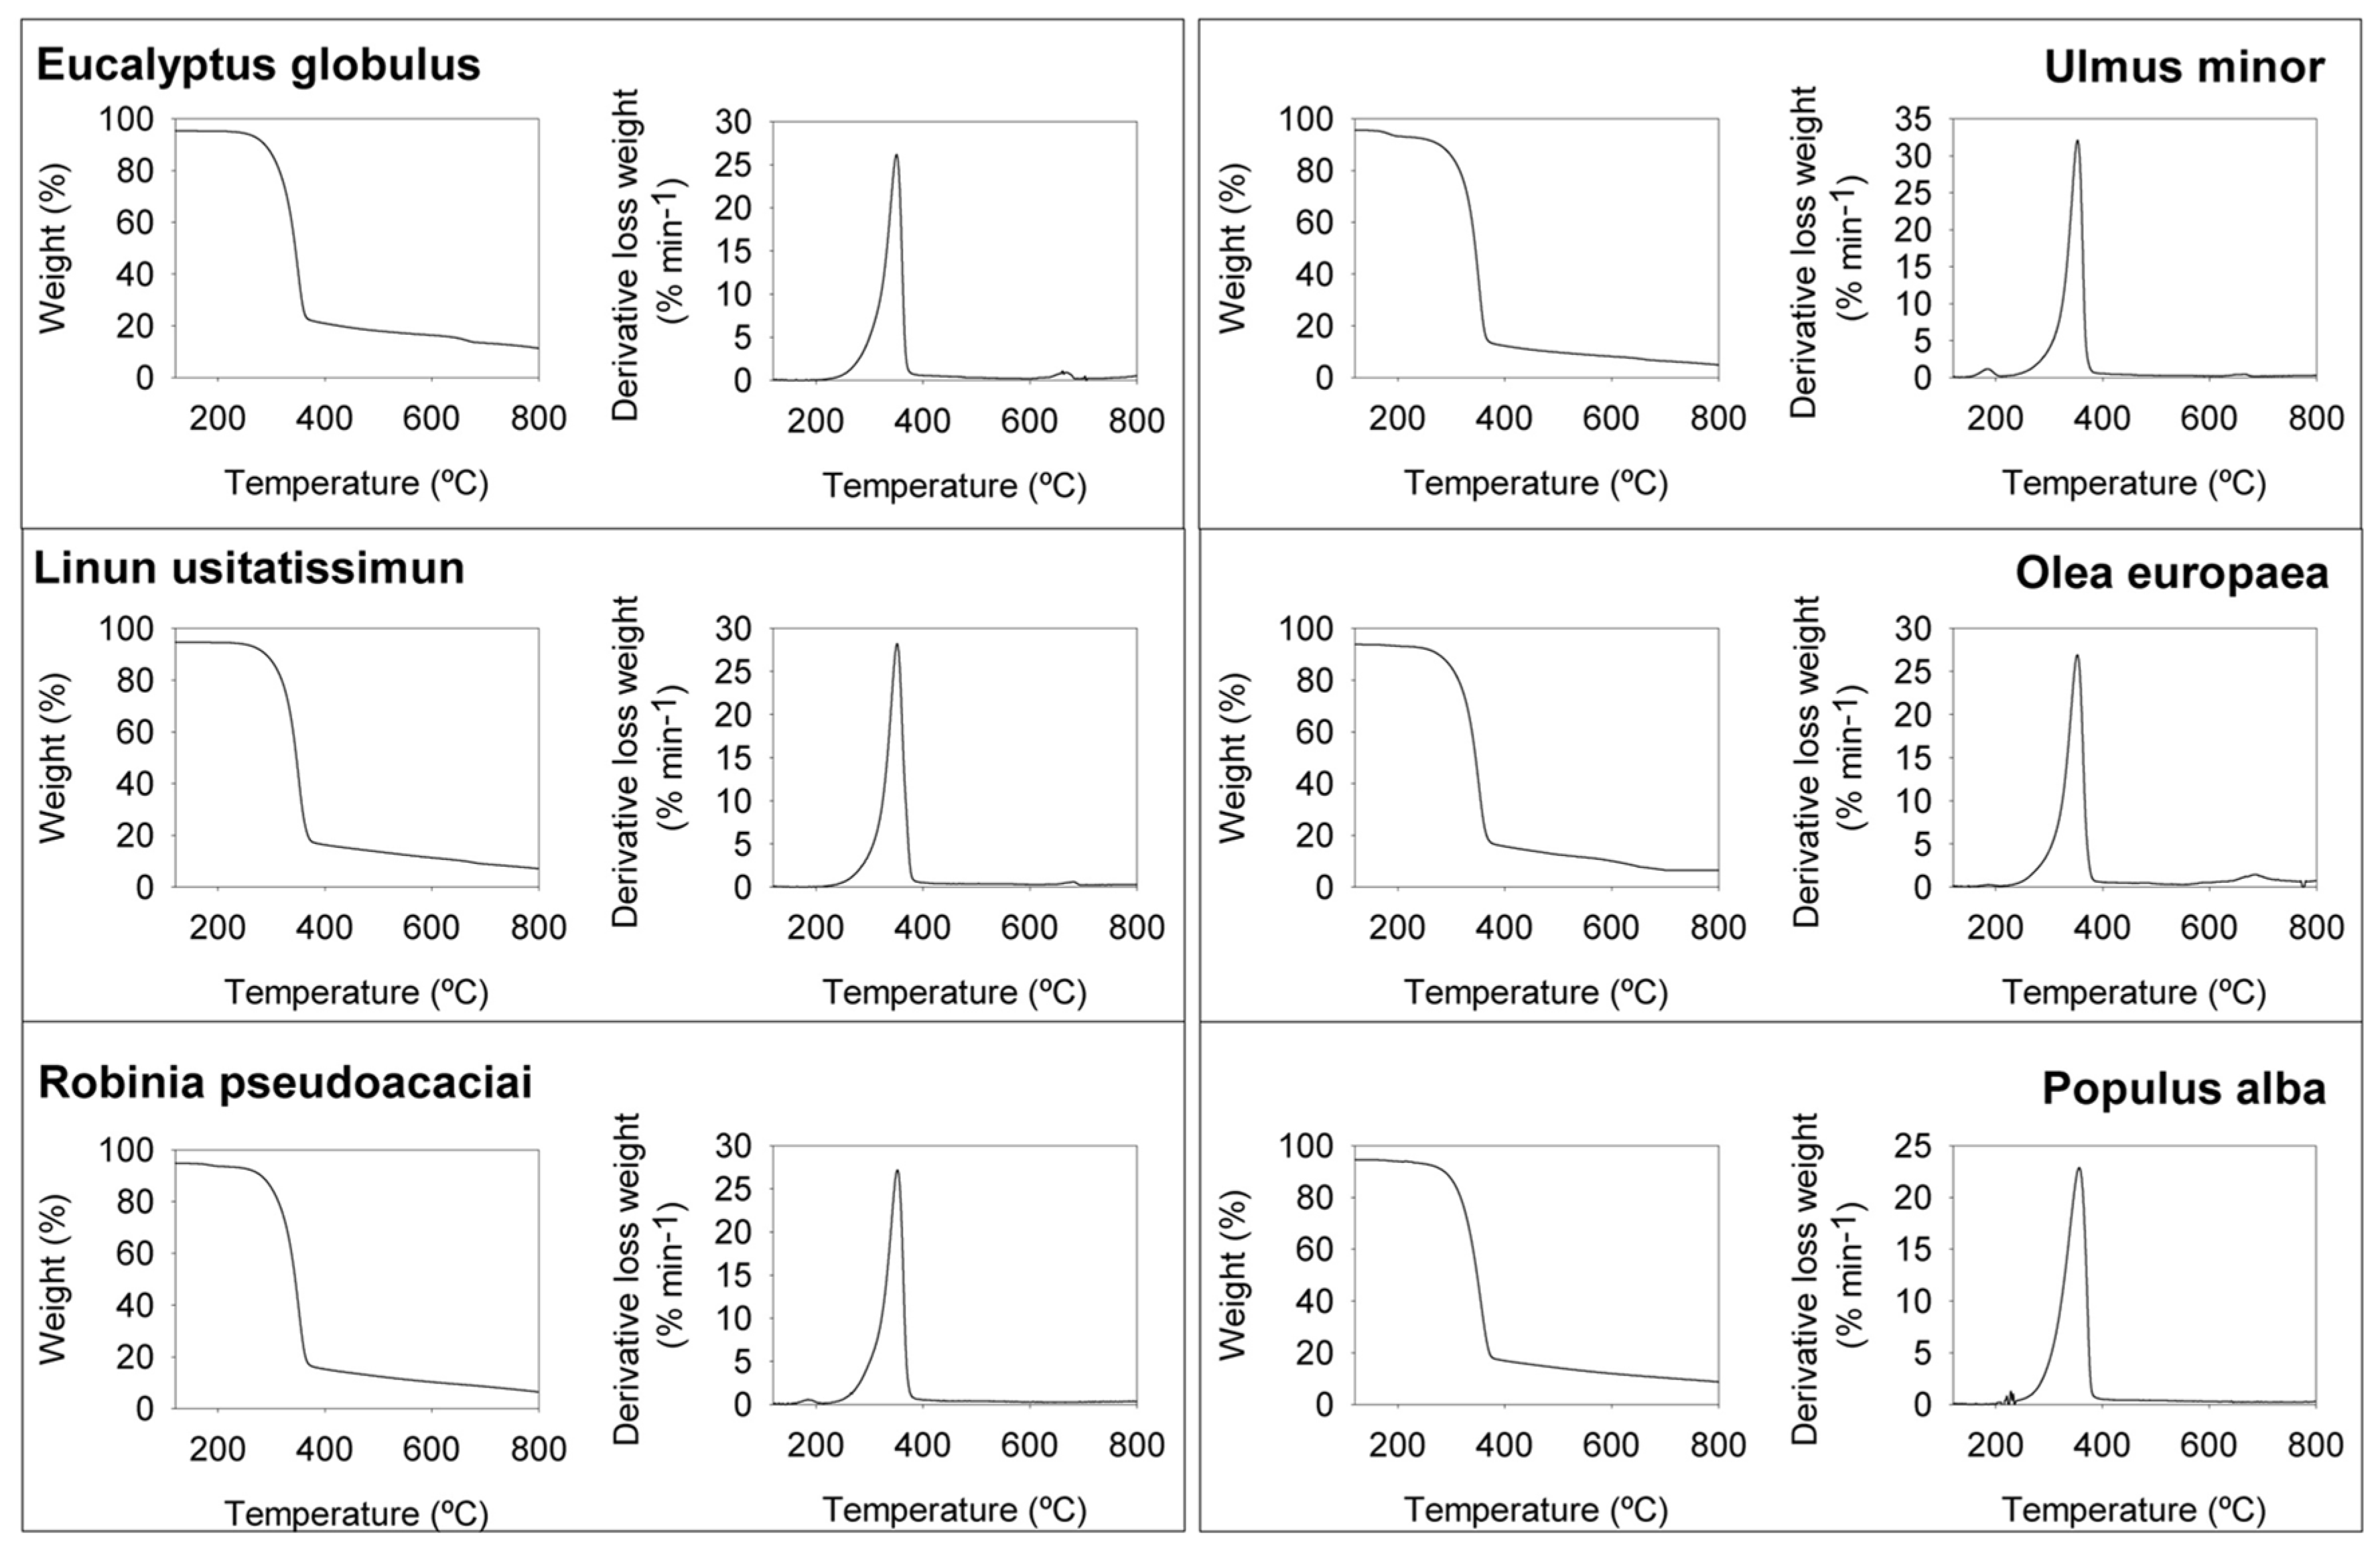
3.3. TGA and DTG Study of Cellulose Pulps

Figure 1 shows the thermogravimetric (TG) and derived thermogravimetric (DTG) profiles of the samples studied obtained at heating rates of 15 °C min−1. TG and DTG curves at the different heating rates studied (5, 10, 15, and 20 °C min−1) are included as Supplementary Materials for each cellulose sample (Figures S1–S6). For 15 °C min−1 curves, maxima of degradation speed (DTG peaks) at temperatures of 355 °C for E. globulus and U. minor and 357 °C for L. usitatissimum, O. europaea, R. pseudoacacia, and P. alba cellulose samples were found. Therefore, under these studied cellulose samples, other factors such as pH of the substrate, hemicellulose content, and oxidized functionalities content slightly affected the maximum speed of degradation reached.
In general, both the total number and the location of these peaks vary depending on the cellulose sample and the reaction conditions. The graphs are shown from 200 °C to avoid deviation due to moisture loss. The pyrolysis of cellulose in these samples is postulated to occur through three main regimes based on the TG profile: (i) devolatilization of hemicelluloses, between 230 and 250 °C; (ii) devolatilization of cellulose, between 140 and 420 °C, as the decomposition of cellulose occurs at a higher temperature than the decomposition of hemicelluloses; (iii) slow devolatilization of lignin >380 °C [54]. In this regard, in the figures concerning L. usitatissimum and R. pseudoacacia, a slight shoulder at 250 °C that may be due to the degradation of carbohydrates can be observed. This shoulder in the rest of the figures was not found. In addition, with respect to the devolatilization of lignin, in the figures corresponding to E. globulus, L. usitatissimum, and O. europaea, a slight decrease in the corresponding TGA and an increase in the degradation rate in its corresponding DTG can be observed. This third degradation may be due to the residual lignin that would remain in the samples.

3.4. Cellulose Pulps Kinetics

Table 3 shows the statistical results obtained, including R2 and Snedecor F-Test, after the application of the different models most used to calculate the kinetic constants for biomass [41]. It can be seen that, for all the cellulose samples studied, the Ozawa–Flynn–Wall (OFW) kinetic model is the one under which the best statistical data were found. Therefore, it is the best method to describe the kinetics of thermal degradation under pyrolysis, regardless of the cellulose characteristics. On the other hand, with the exception of the ASTME-2070 method, the other methods studied showed a high R2 and good F-test data, and are, for some of the samples studied, statistically similar to those obtained by the OFW method.
The Ea and the pre-exponential factor (A) of all the cellulose samples were calculated by the OFW method. These kinetic parameters and the conversion value of the maximum DTG (α) were calculated according to Equation (4). The estimated data were obtained as an average of three experimental determinations, with the standard deviations, for each sample, being less than 5% with respect to the presented average in all cases. The results obtained are shown in Table 4. In this sense, the Ea was not similar for all the samples, which indicates the existence of a relationship between the characteristics of the celluloses found and their physico–chemical characteristics.
As it can be observed in Table 4, the Ea for the studied celluloses ranged from 180.07 kJ mol−1 to 285.30 kJ mol−1 and its pre-exponential factor natural logarithms ranged from 21.86 log (1/s) to 13.04 log (1/s). These values are within the range of values found by other authors [17,18,19,20,21,22]. On the contrary, Jin et al. [55] found values of 381 kJ mol−1 for cellulose activation energy under isothermal heating conditions.

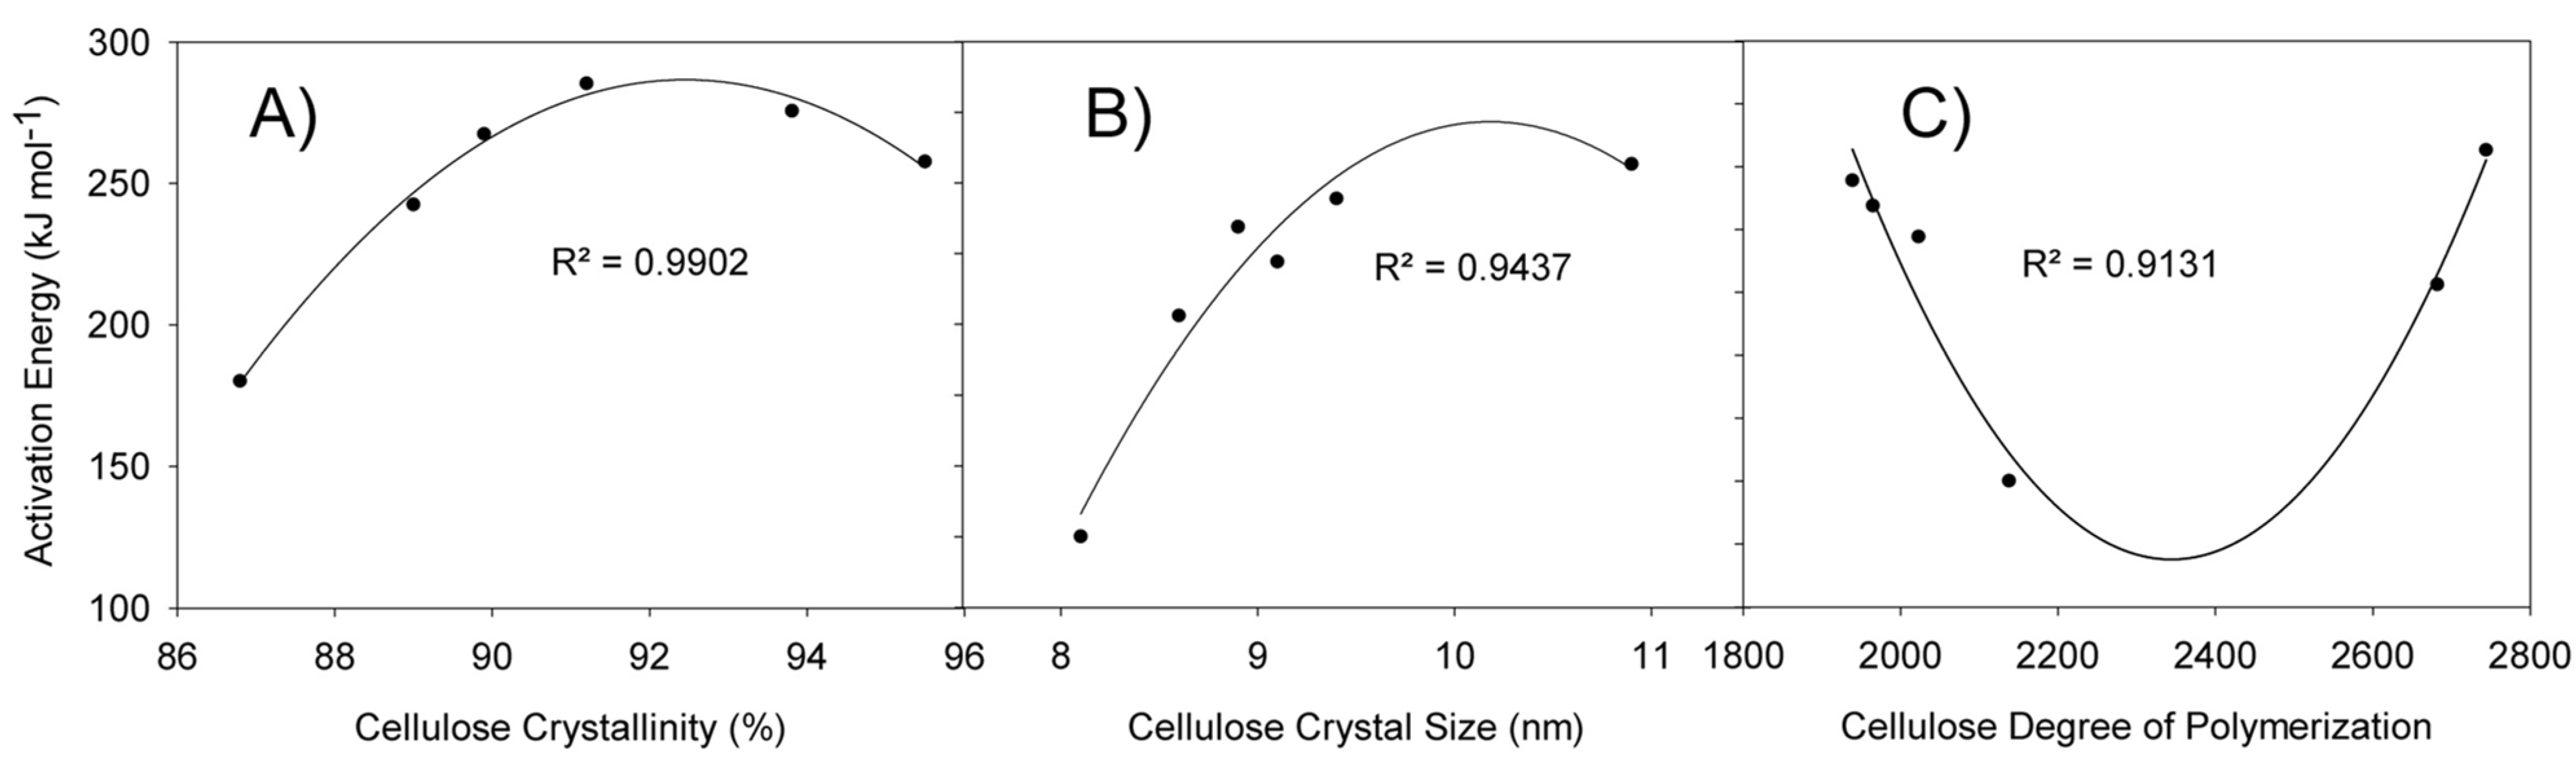
3.5. Kinetic Constants Dependence on Cellulose Characteristics

The influence of some cellulose characteristics, i.e., degree of polymerization, crystallinity index, and crystal size, on the thermal degradation behavior of the different cellulose pulps was evaluated. Then, a relationship between Ea values (Table 4) of the different cellulose samples with their corresponding DP, crystallinity index, and crystal size values was established, resulting in second-order equations to yield suitable results (R2 > 0.9) among Ea and DP, with R2 = 0.91, among Ea and cellulose crystallinity, with R2 = 0.99, and among Ea and cellulose crystal size, with R2 = 0.94, (Figure 2A–C, respectively). However, by establishing a linear relationship among the evaluated parameters, a low statistical relationship was found (R2 < 0.9). This may be due to unevaluated parameters such as hemicellulose content, pH, or the content of oxidized functionalities [56]. However, certain significant trends may be noted. In this sense, in Figure 3A–C, we can observe Ea for the selected cellulose samples as a function of crystallinity versus DP (Figure 3A), crystal size versus DP (Figure 3B), and crystal size versus crystallinity (Figure 3C). In Figure 3A, both the DP and the crystallinity have negative influences on the Ea, i.e., higher Ea with the increase in these parameters, as can be observed. In addition, in the plane where the studied points are connected, the DP slope is lower than that found for crystallinity. Therefore, the DP has a lower influence on the evolution of the Ea than crystallinity. In Figure 3B, a similar trend can be observed, finding that the slope corresponding to crystal size is higher than that found for DP, so crystal size has a higher influence than DP on Ea. Finally, in Figure 3C, a lower influence of crystallinity on Ea compared to crystal size was found. Accordingly, the relative influence of the variables can be proposed as: crystal size > crystallinity > DP. Therefore, low crystallinity and low-to-medium crystal size values are desired to obtain lower Ea values. This behavior could be due to the fact that high crystallinity makes degradation more difficult because it constitutes a steric barrier and hinders the dehydration reactions, contributing to decrease the Ea values and to increase the cellulose thermal stability and, consequently, slowing down the thermal degradation process [57]. Conversely, low cellulose crystallinity makes it more accessible and more susceptible to degradation [58,59]. Therefore, E. globulus and P. alba cellulose samples with a high crystallinity index and crystal size values lead to a slower thermal degradation compared to those cellulose samples with the lowest crystallinity index and crystal size, i.e., O. europaea sample. In this sense, Zickler et al. [60] evaluated the thermal degradation of cellulose in spruce wood at several temperatures by in situ synchrotron X-ray diffraction. These authors suggested that the thermal degradation of cellulose takes place mostly via a thermally activated decrease in the diameter of the cellulose fibril. In addition, Hidaka et al. [61] evaluated the thermal expansion behavior of cellulose crystals in tension wood of Japanese poplar by synchrotron X-ray fiber diffraction, proposing that intramolecular hydrogen bonds stabilize the cellulose molecules and may inhibit thermal expansion along this direction, improving the wood thermal stability. Poletto et al. [62] studied the influence of the cellulose crystallinity and crystal size on the thermal degradation behavior of different wood species. Their X-ray diffractometry results showed that Dipteryx odorata and Mezilaurus itauba contained many more cellulose chains in highly organized form in the interior of the crystallite, which led to a higher crystallinity and crystal size, shifting the thermal decomposition to higher temperatures. Finally, Poletto et al. [62] reported that higher crystallinity and higher crystallite size values from cellulose pulp from Pinus taeda increased its thermal stability compared to Eucalyptus grandis, with lower crystallinity characteristics.
On the other hand, Kim et al. [46] demonstrated that DP may be an important factor for the transfer of heat in the decomposition of cellulose and in the temperature of the thermal degradation of cellulose, i.e., higher DP and higher temperature. Similarly, Bílková [63] and Špérová et al. [64] found a nonlinear relationship between DP and thermal degradation parameters that indicated that the higher DP contributed to a higher thermal stability (higher Tpeak) [63], lower mass loss (%), and lower degradation rate (% min °C−1) [64]. However, this trend was not clearly observed in our data, probably because the DP range of our samples, between 1939 and 2744, was much lower than those studied by Kim et al. [46] with values between 520 and 19000, by Bílková [63] with values between 150 and 2000, and by Špérová et al. [64] with values between 352 and 2450. Therefore, the change in DP in our case is not enough to see a clear effect of DP on thermal degradation. Nevertheless, according to Mattonai et al. [65], the DP has little impact on the energy required for the pyrolysis of cellulose, with the decrease in crystallinity being the main cause of the decrease in Ea. Thus, Sanchez-Jiménez et al. [66] reported that the main step of cellulose degradation by pyrolysis is the random-chain scission, which is related to the crystalline lattice [66].

4. Conclusions

The Ozawa–Flynn–Wall kinetic method, among the isoconversion models studied, seemed to be the most suitable to describe the pyrolytic degradation of the cellulose samples studied, i.e., E. globulus, U. minor, L. usitatissimum, O. europaea, R. pseudoacacia, and P. alba. High relationships (R2 > 0.9) between Ea values of the different cellulose samples with their corresponding DP, crystallinity index, and crystal size values were found. During pyrolysis, the lowest Ea values (180.1–242.4 KJ mol−1) were found for cellulose samples with low values of crystallinity (86.8–89.0%) and low-to-medium values of crystal size (8.1–8.6 nm). On the other hand, the highest Ea values (275.6–285.3 KJ mol−1) were found in cellulose samples with high crystallinity (91.2–93.8%) and high crystal size (9.4–10.9 nm). However, DP did not show a clear effect on Ea values.

Supplementary Materials

The following are available online at https://www.mdpi.com/article/10.3390/pr9091584/s1, Figure S1: TGA and DTG for Eucalyptus globulus cellulose sample at different heating ratio. Figure S2: TGA and DTG for Ulmus minor cellulose sample at different heating ratio. Figure S3: TGA and DTG for Linun usitatissimun cellulose sample at different heating ratio. Figure S4: TGA and DTG for Olea europaea cellulose sample at different heating ratio. Figure S5: TGA and DTG for Robinia pseudoacacia cellulose sample at different heating ratio. Figure S6: TGA and DTG for Populus alba cellulose sample at different heating ratio.

Author Contributions

Conceptualization, M.E.E. and M.J.D.; methodology, M.E.E., M.R.-M., R.M.-S., D.I. and M.J.D.; software, M.R.-M. and M.J.D.; validation, M.E.E., M.R.-M., R.M.-S., D.I. and M.J.D.; formal analysis, M.E.E., M.R.-M., R.M.-S., D.I. and M.J.D.; investigation, M.E.E., M.R.-M., R.M.-S., D.I. and M.J.D.; resources, M.E.E., M.R.-M., R.M.-S., D.I. and M.J.D.; data curation, M.E.E., M.R.-M., R.M.-S., D.I. and M.J.D.; writing—original draft preparation, M.E.E., M.R.-M., R.M.-S., D.I. and M.J.D.; writing—review and editing, M.E.E., M.R.-M., R.M.-S., D.I. and M.J.D.; visualization, M.E.E., M.R.-M., R.M.-S., D.I. and M.J.D.; supervision, M.E.E. and M.J.D.; project administration, M.E.E., D.I. and M.J.D.; funding acquisition, M.E.E., D.I. and M.J.D. All authors have read and agreed to the published version of the manuscript.

Funding

This research was funded by Comunidad de Madrid and MCIU/AEI/FEDER, EU via Projects SUSTEC-CM S2018/EMT-4348 and RTI2018-096080-B-C22, respectively, and the Regional Ministry of Innovation, Science and Enterprise, Government of the Junta de Andalucía (Operational Programme FEDER Andalusia 2014-2020. Project UHU-1255540), Spain.

Institutional Review Board Statement

Not applicable.

Informed Consent Statement

Not applicable.

Data Availability Statement

Not applicable.

Acknowledgments

Universidad de Jaén is acknowledged for Olea europaea material. Silviculture and Forest Management Department (Forest Research Center, INIA, CSIC) is acknowledged for Robinia pseudoacacia and Populus alba materials. We thank the personnel at Puerta de Hierro Forest Breeding Centre (Ministerio para la Transición Ecológica y el Reto Demográfico) and the Spanish Elm Breeding Program for providing the Ulmus minor material. Finally, La Montañesa pulp mill (Lecta Group, Spain) and Celesa (Spain) are acknowledged for Eucalyptus globulus and Linun usitatissimum materials, respectively.

Conflicts of Interest

The authors declare no conflict of interest.

References

  1. Vooradi, R.; Anne, S.B.; Tula, A.K.; Eden, M.R.; Gani, R. Energy and CO2 management for chemical and related industries: Issues, opportunities and challenges. BMC Chem. Eng. 2019, 1, 7. [Google Scholar] [CrossRef]
  2. De Jong, E.; Higson, A.; Walsh, P.; Wellisch, M.B. Bio-Based Chemicals Value Added Products from Biorefineries. 2012. Available online: https://www.ieabioenergy.com/wp-content/uploads/2013/10/Task-42-Biobased-Chemicals-value-added-products-from-biorefineries.pdf (accessed on 22 August 2021).
  3. Codina Gironès, V.; Moret, S.; Peduzzi, E.; Nasato, M.; Maréchal, F. Optimal use of biomass in large-scale energy systems: Insights for energy policy. Energy 2017, 137, 789–797. [Google Scholar] [CrossRef]
  4. Jenkins, B.M.; Baxter, L.L.; Koppejan, J. Biomass Combustion. In Thermochemical Processing of Biomass; John Wiley & Sons, Ltd.: Chichester, UK, 2019; pp. 49–83. [Google Scholar]
  5. Susmozas, A.; Martín-Sampedro, R.; Ibarra, D.; Eugenio, M.E.; Iglesias, R.; Manzanares, P.; Moreno, A.D. Process Strategies for the Transition of 1G to Advanced Bioethanol Production. Processes 2020, 8, 1310. [Google Scholar] [CrossRef]
  6. Giuntoli, J.; Agostini, A.; Caserini, S.; Lugato, E.; Baxter, D.; Marelli, L. Climate change impacts of power generation from residual biomass. Biomass Bioenergy 2016, 89, 146–158. [Google Scholar] [CrossRef]
  7. Islas, J.; Manzini, F.; Masera, O.; Vargas, V. Solid Biomass to Heat and Power. In The Role of Bioenergy in the Bioeconomy; Lago, C., Caldés, N., Lechón, Y., Eds.; Academic Press: Cambridge, MA, USA, 2019; pp. 145–177. [Google Scholar]
  8. Chen, D.; Gao, A.; Cen, K.; Zhang, J.; Cao, X.; Ma, Z. Investigation of biomass torrefaction based on three major components: Hemicellulose, cellulose, and lignin. Energy Convers. Manag. 2018, 169, 228–237. [Google Scholar] [CrossRef]
  9. Hameed, S.; Sharma, A.; Pareek, V.; Wu, H.; Yu, Y. A review on biomass pyrolysis models: Kinetic, network and mechanistic models. Biomass Bioenergy 2019, 123, 104–122. [Google Scholar] [CrossRef]
  10. Soria, M.A.; Barros, D.; Madeira, L.M. Hydrogen production through steam reforming of bio-oils derived from biomass pyrolysis: Thermodynamic analysis including in situ CO2 and/or H2 separation. Fuel 2019, 244, 184–195. [Google Scholar] [CrossRef]
  11. Carrier, M.; Auret, L.; Bridgwater, A.; Knoetze, J.H. Using Apparent Activation Energy as a Reactivity Criterion for Biomass Pyrolysis. Energy Fuels 2016, 30, 7834–7841. [Google Scholar] [CrossRef] [Green Version]
  12. Larraín, T.; Carrier, M.; Radovic, L.R. Structure-reactivity relationship in pyrolysis of plastics: A comparison with natural polymers. J. Anal. Appl. Pyrolysis 2017, 126, 346–356. [Google Scholar] [CrossRef] [Green Version]
  13. Várhegyi, G. Empirical Models with Constant and Variable Activation Energy for Biomass Pyrolysis. Energy Fuels 2019, 33, 2348–2358. [Google Scholar] [CrossRef]
  14. Vyazovkin, S. Modification of the integral isoconversional method to account for variation in the activation energy. J. Comput. Chem. 2001, 22, 178–183. [Google Scholar] [CrossRef]
  15. Capart, R.; Khezami, L.; Burnham, A.K. Assessment of various kinetic models for the pyrolysis of a microgranular cellulose. Thermochim. Acta 2004, 417, 79–89. [Google Scholar] [CrossRef] [Green Version]
  16. Burnham, A.K.; Zhou, X.; Broadbelt, L.J. Critical Review of the Global Chemical Kinetics of Cellulose Thermal Decomposition. Energy Fuels 2015, 29, 2906–2918. [Google Scholar] [CrossRef] [Green Version]
  17. Antal, M.J.; Várhegyi, G.; Jakab, E. Cellulose Pyrolysis Kinetics: Revisited. Ind. Eng. Chem. Res. 1998, 37, 1267–1275. [Google Scholar] [CrossRef] [Green Version]
  18. Wu, M.; Várhegyi, G.; Zha, Q. Kinetics of cellulose pyrolysis after a pressurized heat treatment. Thermochim. Acta 2009, 496, 59–65. [Google Scholar] [CrossRef] [Green Version]
  19. Amutio, M.; Lopez, G.; Aguado, R.; Artetxe, M.; Bilbao, J.; Olazar, M. Kinetic study of lignocellulosic biomass oxidative pyrolysis. Fuel 2012, 95, 305–311. [Google Scholar] [CrossRef]
  20. Cai, J.; Wu, W.; Liu, R.; Huber, G.W. A distributed activation energy model for the pyrolysis of lignocellulosic biomass. Green Chem. 2013, 15, 1331. [Google Scholar] [CrossRef]
  21. Radojević, M.; Janković, B.; Jovanović, V.; Stojiljković, D.; Manić, N. Comparative pyrolysis kinetics of various biomasses based on model-free and DAEM approaches improved with numerical optimization procedure. PLoS ONE 2018, 13, e0206657. [Google Scholar] [CrossRef] [PubMed]
  22. Adenson, M.O.; Kelley, M.D.; Elkelany, O.O.; Biernacki, J.J.; Liu, Y. Kinetics of cellulose pyrolysis: Ensuring optimal outcomes. Can. J. Chem. Eng. 2018, 96, 926–935. [Google Scholar] [CrossRef]
  23. Milosavljevic, I.; Oja, V.; Suuberg, E.M. Thermal Effects in Cellulose Pyrolysis: Relationship to Char Formation Processes. Ind. Eng. Chem. Res. 1996, 35, 653–662. [Google Scholar] [CrossRef]
  24. Grønli, M.; Antal, M.J.; Várhegyi, G. A Round-Robin Study of Cellulose Pyrolysis Kinetics by Thermogravimetry. Ind. Eng. Chem. Res. 1999, 38, 2238–2244. [Google Scholar] [CrossRef] [Green Version]
  25. Kaur, R.; Gera, P.; Jha, M.K. Study on Effects of Different Operating Parameters on the Pyrolysis of Biomass: A Review. J. Biofuels Bioenergy 2015, 1, 135. [Google Scholar] [CrossRef]
  26. Czajka, K.M. The impact of the thermal lag on the interpretation of cellulose pyrolysis. Energy 2021, 236, 121497. [Google Scholar] [CrossRef]
  27. Kang, K.Y.; Jo, B.M.; Oh, J.S.; Mansfield, S.D. The effects of biopulping on chemical and energy consumptionduring Kraft pulping of hybrid poplar. Wood Fiber Sci. 2003, 35, 594–600. [Google Scholar]
  28. Ibarra, D.; Camarero, S.; Romero, J.; Martínez, M.J.; Martínez, A.T. Integrating laccase–mediator treatment into an industrial-type sequence for totally chlorine-free bleaching of eucalypt kraft pulp. J. Chem. Technol. Biotechnol. 2006, 81, 1159–1165. [Google Scholar] [CrossRef]
  29. Jiménez-López, L.; Eugenio, M.E.; Ibarra, D.; Darder, M.; Martín, J.A.; Martín-Sampedro, R. Cellulose nanofibers from a dutch elm disease-resistant ulmus minor clone. Polymers 2020, 12, 2450. [Google Scholar] [CrossRef] [PubMed]
  30. Fillat, Ú.; Wicklein, B.; Martín-Sampedro, R.; Ibarra, D.; Ruiz-Hitzky, E.; Valencia, C.; Sarrión, A.; Castro, E.; Eugenio, M.E. Assessing cellulose nanofiber production from olive tree pruning residue. Carbohydr. Polym. 2018, 179. [Google Scholar] [CrossRef] [PubMed]
  31. NRLE TP-510-42618—Determination of structural carbohydrates and lignin in biomass. In Laboratory Analytical Procedure; National Renewable Energy Laboratory: Golden, CO, USA, 2011.
  32. Kasaai, M.R. Comparison of various solvents for determination of intrinsic viscosity and viscometric constants for cellulose. J. Appl. Polym. Sci. 2002, 86, 2189–2193. [Google Scholar] [CrossRef]
  33. Solala, I.; Volperts, A.; Andersone, A.; Dizhbite, T.; Mironova-Ulmane, N.; Vehniäinen, A.; Pere, J.; Vuorinen, T. Mechanoradical formation and its effects on birch kraft pulp during the preparation of nanofibrillated cellulose with Masuko refining. Holzforschung 2012, 66, 477–483. [Google Scholar] [CrossRef]
  34. Zhang, X.; de Jong, W.; Preto, F. Estimating kinetic parameters in TGA using B-spline smoothing and the Friedman method. Biomass Bioenergy 2009, 33, 1435–1441. [Google Scholar] [CrossRef]
  35. Fernandez, A.; Saffe, A.; Pereyra, R.; Mazza, G.; Rodriguez, R. Kinetic study of regional agro-industrial wastes pyrolysis using non-isothermal TGA analysis. Appl. Therm. Eng. 2016, 106, 1157–1164. [Google Scholar] [CrossRef]
  36. Mothé, C.G.; de Miranda, I.C. Study of kinetic parameters of thermal decomposition of bagasse and sugarcane straw using Friedman and Ozawa–Flynn–Wall isoconversional methods. J. Therm. Anal. Calorim. 2013, 113, 497–505. [Google Scholar] [CrossRef]
  37. Lim, A.C.R.; Chin, B.L.F.; Jawad, Z.A.; Hii, K.L. Kinetic Analysis of Rice Husk Pyrolysis Using Kissinger-Akahira-Sunose (KAS) Method. Procedia Eng. 2016, 148, 1247–1251. [Google Scholar] [CrossRef] [Green Version]
  38. Brown, M.E.; Dollimore, D.; Galwey, A.K. Reactions in the Solid State. In Comprehensive Chemical Kinetics.; Elsevier: Amsterdam, The Netherlands, 1980. [Google Scholar]
  39. Ozawa, T. A New Method of Analyzing Thermogravimetric Data. Bull. Chem. Soc. Jpn. 1965, 38, 1881–1886. [Google Scholar] [CrossRef] [Green Version]
  40. Flynn, J.H.; Wall, L.A. General treatment of the thermogravimetry of polymers. J. Res. Natl. Bur. Stand. Sect. A Phys. Chem. 1966, 70A, 487. [Google Scholar] [CrossRef]
  41. El-Sayed, S.A.; Mostafa, M.E. Kinetic Parameters Determination of Biomass Pyrolysis Fuels Using TGA and DTA Techniques. Waste Biomass Valorization 2015, 6, 401–415. [Google Scholar] [CrossRef]
  42. Opfermann, J.R.; Kaisersberger, E.; Flammersheim, H.J. Model-free analysis of thermoanalytical data-advantages and limitations. Thermochim. Acta 2002, 391, 119–127. [Google Scholar] [CrossRef]
  43. Francis, R.C.; Hausch, D.L.; Granzow, S.G.; Makkonen, H.P.; Kamdem, D.P. Fiber yield for fully bleached kraft pulps from black locust (Robinia pseudoacacia) and silver maple (Acer saccharinum). Holz als Roh-und Werkst. 2001, 59, 49–52. [Google Scholar] [CrossRef]
  44. Barba, C.; Montané, D.; Rinaudo, M.; Farriol, X. Synthesis and characterization of carboxymethylcelluloses (CMC) from non-wood fibers I.Accessibility of cellulose fibers and CMC synthesis. Cellulose 2002, 9, 319–326. [Google Scholar] [CrossRef]
  45. Ye, D.; Farriol, X. Improving Accessibility and Reactivity of Celluloses of Annual Plants for the Synthesis of Methylcellulose. Cellulose 2005, 12, 507–515. [Google Scholar] [CrossRef]
  46. Kim, U.-J.; Eom, S.H.; Wada, M. Thermal decomposition of native cellulose: Influence on crystallite size. Polym. Degrad. Stab. 2010, 95, 778–781. [Google Scholar] [CrossRef]
  47. Przybysz, K.; Małachowska, E.; Martyniak, D.; Boruszewski, P.; Iłowska, J.; Kalinowska, H.; Przybysz, P. Yield of Pulp, Dimensional Properties of Fibers, and Properties of Paper Produced from Fast Growing Trees and Grasses. BioResources 2018, 13. [Google Scholar] [CrossRef]
  48. Fengel, D.; Wegener, G. Wood: Chemistry, Ultrastructure, Reactions; Walter de Gruyter: Berlin, Germany, 1989. [Google Scholar]
  49. Krässig, H.A. Cellulose: Structure, Accessibility, and Reactivity; Krässig Gordon and Breach Science Publishers: Philadelphia, PA, USA, 1993. [Google Scholar]
  50. Agarwal, U.P.; Reiner, R.R.; Ralph, S.A. Cellulose crystallinity of woods, wood pulps, and agricultural fibers by FT-Raman spectroscopy. In Proceedings of the 16th International Symposium on Wood, Fiber and Pulping Chemistry; Wang, L., Kuan, S., Hou, Q., Cao, C., Si, C., Zhang, H., Eds.; China Light Industry Press: Beijing, China, 2011; Volume II, pp. 69–74. [Google Scholar]
  51. Jonoobi, M.; Oladi, R.; Davoudpour, Y.; Oksman, K.; Dufresne, A.; Hamzeh, Y.; Davoodi, R. Different preparation methods and properties of nanostructured cellulose from various natural resources and residues: A review. Cellulose 2015, 22, 935–969. [Google Scholar] [CrossRef]
  52. Martín-Sampedro, R.; Eugenio, M.E.; Fillat, Ú.; Martín, J.A.; Aranda, P.; Ruiz-Hitzky, E.; Ibarra, D.; Wicklein, B. Biorefinery of Lignocellulosic Biomass from an Elm Clone: Production of Fermentable Sugars and Lignin-Derived Biochar for Energy and Environmental Applications. Energy Technol. 2019, 7. [Google Scholar] [CrossRef]
  53. Gümüskaya, E.; Usta, M.; Kirci, H. The effects of various pulping conditions on crystalline structure of cellulose in cotton linters. Polym. Degrad. Stab. 2003, 81, 559–564. [Google Scholar] [CrossRef]
  54. Brown, R.C. Thermochemical Processing of Biomass: Conversion into Fuels, Chemicals and Power, 2nd ed.; Wiley Series in Renewable Resources; John Wiley & Sons Inc.: Hoboken, NJ, USA, 2019; p. 4089. [Google Scholar]
  55. Jin, W.; Singh, K.; Zondlo, J. Pyrolysis Kinetics of Physical Components of Wood and Wood-Polymers Using Isoconversion Method. Agriculture 2013, 3, 12–32. [Google Scholar] [CrossRef] [Green Version]
  56. Huang, Y.; Li, B.; Liu, D.; Xie, X.; Zhang, H.; Sun, H.; Hu, X.; Zhang, S. Fundamental Advances in Biomass Autothermal/Oxidative Pyrolysis: A Review. ACS Sustain. Chem. Eng. 2020, 8, 11888–11905. [Google Scholar] [CrossRef]
  57. Henrique, M.A.; Flauzino Neto, W.P.; Silvério, H.A.; Martins, D.F.; Gurgel, L.V.A.; da Silva Barud, H.; de Morais, L.C.; Pasquini, D. Kinetic study of the thermal decomposition of cellulose nanocrystals with different polymorphs, cellulose I and II, extracted from different sources and using different types of acids. Ind. Crops Prod. 2015, 76, 128–140. [Google Scholar] [CrossRef] [Green Version]
  58. Teeri, T.T. Crystalline cellulose degradation: New insight into the function of cellobiohydrolases. Trends Biotechnol. 1997, 15, 160–167. [Google Scholar] [CrossRef]
  59. Mansfield, S.D.; Meder, R. Cellulose hydrolysis—The role of monocomponent cellulases in crystalline cellulose degradation. Cellulose 2003, 10, 159–169. [Google Scholar] [CrossRef]
  60. Zickler, G.A.; Wagermaier, W.; Funari, S.S.; Burghammer, M.; Paris, O. In situ X-ray diffraction investigation of thermal decomposition of wood cellulose. J. Anal. Appl. Pyrolysis 2007, 80, 134–140. [Google Scholar] [CrossRef] [Green Version]
  61. Hidaka, H.; Kim, U.-J.; Wada, M. Synchrotron X-ray fiber diffraction study on the thermal expansion behavior of cellulose crystals in tension wood of Japanese poplar in the low-temperature region. Holzforschung 2010, 64. [Google Scholar] [CrossRef]
  62. Poletto, M.; Zattera, A.J.; Forte, M.M.C.; Santana, R.M.C. Thermal decomposition of wood: Influence of wood components and cellulose crystallite size. Bioresour. Technol. 2012, 109, 148–153. [Google Scholar] [CrossRef]
  63. Bílková, L. Application of infrared spectroscopy and thermal analysis to the examination of the degradation of cotton fibers. Polym. Degrad. Stab. 2012, 97, 35–39. [Google Scholar] [CrossRef]
  64. Špérová, M.; Nasadil, P.; Průšová, A.; Kučerík, J. A hint on the correlation between cellulose fibers polymerization degree and their thermal and thermo-oxidative degradation. J. Therm. Anal. Calorim. 2012, 110, 71–76. [Google Scholar] [CrossRef]
  65. Mattonai, M.; Pawcenis, D.; del Seppia, S.; Łojewska, J.; Ribechini, E. Effect of ball-milling on crystallinity index, degree of polymerization and thermal stability of cellulose. Bioresour. Technol. 2018, 270, 270–277. [Google Scholar] [CrossRef] [PubMed]
  66. Sánchez-Jiménez, P.E.; Pérez-Maqueda, L.A.; Perejón, A.; Pascual-Cosp, J.; Benítez-Guerrero, M.; Criado, J.M. An improved model for the kinetic description of the thermal degradation of cellulose. Cellulose 2011, 18, 1487–1498. [Google Scholar] [CrossRef]
Figure 1. TGA and DTG at 15 °C min−1 of the studied cellulose samples.
Processes 09 01584 g001
Figure 2. Yielded equations among activation energy and cellulose crystallinity (A), cellulose crystal size (B), and degree of polymerization (C).
Processes 09 01584 g002
Figure 3. Linear relations found among activation energy, crystallinity, and degree of polymerization (A); activation energy, crystal size, and degree of polymerization (B); and activation energy, crystallinity, and crystal size (C).
Processes 09 01584 g003
Table 1. Chemical composition of cellulose samples (weight percentage %).
Total Lignin
(%)
Glucan
(%)
Xylan
(%)
Eucalyptus globulus1.3 ± 0.174.5 ± 2.018.2 ± 0.5
Ulmus minor1.3 ± 0.274.2 ± 1.819.4 ± 0.9
Linun usitatissimum0.2 ± 0.388.7 ± 0.95.2 ± 0.4
Olea europaea2.5 ± 0.269.2 ± 1.720.6 ± 0.8
Robinia pseudoacacia1.0 ± 0.376.4 ± 1.818.7 ± 0.6
Populus alba1.2 ± 0.174.1 ± 1.819.1 ± 0.8
Table 2. Degree of polymerization, cellulose crystallinity, and crystal size of cellulose samples.
Degree of PolymerizationCrystallinity
(%)
Crystal Size
(nm)
Eucalyptus globulus2744 ± 24691.2 ± 1.410.9 ± 0.4
Ulmus minor2682 ± 41289.0 ± 1.18.6 ± 0.1
Linun usitatissimum2023 ± 35195.5 ± 0.19.1 ± 0.4
Olea europaea2138 ± 13886.8 ± 0.68.1 ± 0.4
Robinia pseudoacacia1965 ± 31189.9 ± 2.98.9 ± 0.3
Populus alba1939 ± 39793.8 ± 0.29.4 ± 0.4
Table 3. Calculated statistical values for the different studied kinetic methods.
Kinetic MethodR2F-Test
ASTME-20700.87716,707.22
Friedman0.9964494.01
Eucalyptus globulusOzawa-Flynn-Wall0.998805.53
Kissinger-Akahira-Sunose0.9672142.13
ASTME-20700.90419,899.81
Friedman0.9967990.41
Ulmus minorOzawa-Flynn-Wall0.9993137.64
Kissinger-Akahira-Sunose0.9994544.63
ASTME-20700.912522.26
Friedman0.99618,205.87
Linun usitatissimumOzawa-Flynn-Wall0.999424.28
Kissinger-Akahira-Sunose0.999522.26
ASTME-20700.914150.52
Friedman0.99415.68
Olea europaeaOzawa-Flynn-Wall0.99819.29
Kissinger-Akahira-Sunose0.99817.00
ASTME-20700.958134.78
Friedman0.99513.59
Robinia pseudoacaciaOzawa-Flynn-Wall0.99618.40
Kissinger-Akahira-Sunose0.99712.00
ASTME-20700.907346.06
Friedman0.99038.51
Populus albaOzawa-Flynn-Wall0.99718.00
Kissinger-Akahira-Sunose0.99716.18
Table 4. Maxima activation energy, pre-exponential factor, and conversion degree for studied cellulose samples.
αEa
(kJ mol−1)
Log A
(log (1/s))
Eucalyptus globulus0.82285.3021.86
Ulmus minor0.85242.4216.39
Linun usitatissimum0.80257.6718.80
Olea europaea0.75180.0713.04
Robinia pseudoacacia0.84267.5121.50
Populus alba0.83275.5818.74
Publisher’s Note: MDPI stays neutral with regard to jurisdictional claims in published maps and institutional affiliations.

