Article

Reactor Selection for Upgrading Hemicelluloses: Conventional and Miniaturised Reactors for Hydrogenations

1
Chemical Reaction Engineering and Process Plants, Faculty of Mechanical Science and Engineering, Technische Universität Dresden, D-01062 Dresden, Germany
2
Laboratory of Industrial Chemistry and Reaction Engineering, Faculty of Science and Engineering, Åbo Akademi University, FI-20500 Turku, Finland
*
Author to whom correspondence should be addressed.
Processes 2021, 9(9), 1558; https://doi.org/10.3390/pr9091558
Submission received: 14 June 2021 / Revised: 31 July 2021 / Accepted: 12 August 2021 / Published: 31 August 2021
(This article belongs to the Special Issue Process Intensification in Chemical Reaction Engineering)

Abstract

:
This work presents an advanced reactor selection strategy that combines elements of a knowledge-based expert system to reduce the number of feasible reactor configurations with elaborated and automatised process simulations to identify reactor performance parameters. Special focus was given to identify optimal catalyst loadings and favourable conditions for each configuration to enable a fair comparison. The workflow was exemplarily illustrated for the Ru/C-catalysed hydrogenation of arabinose and galactose to the corresponding sugar alcohols. The simulations were performed by using pseudo-2D reactor models implemented in Aspen Custom Modeler® and automatised by using the MS-Excel interface and VBA. The minichannel packings, namely wall-coated minichannel reactor (MCWR), minichannel reactor packed with catalytic particles (MCPR), and minichannel reactor packed with a catalytic open-celled foam (MCFR), outperform the conventional and miniaturised trickle-bed reactors (TBR and MTBR) in terms of space-time yield and catalyst use. However, longer reactor lengths are required to achieve 99% conversion of the sugars in MCWR and MCPR. Considering further technical challenges such as liquid distribution, packing the reactor, as well as the robustness and manufacture of catalysts in a biorefinery environment, miniaturised trickle beds are the most favourable design for a production scenario of 5000   t / a galactitol. However, the minichannel configurations will be more advantageous for reaction systems involving consecutive and parallel reactions and highly exothermic systems.

1. Introduction

In industrial applications, almost every kind of holding or contacting equipment has been used as chemical reactors, e.g., mixing nozzles, centrifugal pumps, or the most elaborate tower or tube assemblies [1] (p. 549 ff). The systems may be classified by the mode of operation, which is either batch, continuous, or in selected cases also semi-batch. Continuous processing with short downtimes dominates in the production of commodity/bulk chemicals, whereas batch processing typically encounters in the production of fine chemicals, specialties, and pharmaceuticals [2], but also in the latter sectors, continuously operated and miniaturised reactors have emerged more frequently in the last decade often advertised as flow chemistry. These mini- and microreactors offer increased yields and selectivities as well as require less space due to intensified heat and mass transfer and enable an operation within explosive regimes. Furthermore, their use may simplify the process flow scheme making their operation safer [3,4,5,6,7,8,9,10].
The process of reactor selection aims at the identification of the best reactor type for a chemical process. Important criteria for the decision cover achievable yields for the desired components, costs, by-product formation, environmental impact, design complexity, among many others. The screening for the best available reactor technology is rather complicated because there are usually many feasible reactor concepts that may be operated in different flow regimes [11,12]. Each of the possible configurations performs best at different conditions and involves several benefits and drawbacks that affect the up- and downstream process units. Besides the purely technical aspects, industrial experience in the scale-up and operation has to be considered to reduce the risk of failure and to develop the process economically [13]. The sketched intricacy hinders the formulation of a general optimisation function needed for a straightforward analysis of the competing reactor concepts. To tackle the problem, experts stepwise reject configurations that do not satisfy the musts and wants of the process. This approach was also mimicked by knowledge-based expert systems [14].
This article presents an advanced approach for reactor selection that combines elements of a knowledge-based expert system with extensive mathematical modelling to find the best available reactor technology. The feasibility of the methodology will be examined in a case scenario that considers a multiphase hydrogenation step occurring in biorefineries. The evaluation is based on (a) quantitative criteria such as employed catalyst mass, space-time yield, productivity, and required reactor length, as well as (b) qualitative criteria such as catalyst preparation and replacement, difficulty of scaling-up, and experience in operation, among others.

Process of Reactor Selection

Within the process of reactor selection, Krishna and Sie [12] suggested defining key criteria discriminated into “process musts” and “process wants”. Then, the optimal reactor fulfils all “process musts” and as much as possible “process wants”. “Process musts” are (a) ranges of operation in terms of pressures and temperatures, (b) the chance of safe and stable operation without runaways, (c) environmental acceptability, and (d) feasibility of scale-up. “Process wants” cover (a) maximum conversion and selectivity, (b) simple operation, and (c) low capital and operating costs.
It is clear that the fulfilment of these criteria as well as the reactor selection for a specific chemical synthesis is far from being simple and requires a collaborative team of chemists and engineers because several parameters, such as:
  • Reaction parameters (stoichiometry of the reaction network, heats of reaction, equilibrium data,…);
  • Physical properties (densities, viscosities, solubilities, heat capacities,…);
  • Catalyst parameters (reaction rates, selectivity, deactivation characteristics, chemical, mechanical and thermal stability, costs…);
  • Reactor parameters (mass and heat transfer coefficients, thermal conductivities, pressure drop, catalyst replacement, design difficulties, simplicity of scale-up, …); and
  • Safety parameters (stability and controllability, amount of hazardous inventory,…).
have to be considered [10,13,15,16]. Krishna and Sie [12] structured the challenge of reactor selection by creating three strategy levels:
  • Particle/interface;
  • Reactant injection/removal, mixing as well as contacting; and
  • Flow regime.
at which decisions according to the wish list are made. By doing so, the list of feasible reactor configurations stepwise reduces until the optimal reactor design is found.
In strategy level 1, the ideal size and shape of the catalyst, including its porous structure and distribution of active compounds, are specified. These parameters affect the chemical reaction and the diffusive transport of reactants and products. Therefore, the interplay between both processes has to be optimised in finding a suitable catalyst. In heterogeneously catalysed processes, it is well known that significant diffusion limitations occur in catalyst pellets exceeding a few millimetres in size. However, the use of smaller particles is often restricted by the maximal pressure drop across the column. In systems with multiphase reactions at solid surfaces, the situation is more complex due to several interacting mass transfer steps. By further developing Krishna and Sie’s approach, two slightly modified parameters β G L = ε L / ( δ L a ) G L and β L S = ε L / ( δ L a ) L S may be introduced. They relate the overall liquid volume to the volumes in the diffusion layers either between gas and liquid or between liquid and solid phases. For fast reactions, which are usually limited by the gaseous compound, small values of β G L are recommended to maximise the transport of gas molecules into the liquid phase. Additionally, small values of β L S indicate thin liquid layers, which enhance the gas-liquid-solid and liquid-solid mass transfer. In systems that are limited by the liquid compound, usually, only the latter term should be considered. It must be emphasised that minimal values of β G L / L S ensure large mass transfer rates, but this does not mean that the reactor volume is used effectively because of the low liquid content. Therefore, a reasonable compromise has to be found in practice. For example, Khadilkar et al. [17] suggested employing reactors with liquid films only if the gaseous compound limits the reaction. In all other cases, upflow configurations with large β values should be used in order to ensure full wetting of the catalyst. Moreover, large values of β G L / L S may be desired to create a high liquid holdup in the system to ensure a sufficient heat transfer to the reactor wall in non-adiabatic systems. It should be mentioned that one reactor packing may provide broad ranges of β G L / L S . For example, small values of β are obtained if a packed-bed is operated in the downward trickle- or spray regime, whereas high values occur if the same bed is operated in upflow mode as a packed bubble column.
Strategy level 2 aims at the reactant and phase dispersion scheme. Each reactant may be injected (a) by one shot as in a batch system, (b) in the form of a continuous feed, (c) in the form of a periodic feed, or (d) at several injection stages according to reaction time or reactor volume. Continuous processes are generally operated at a steady state, i.e., with a continuous feed of reactants. Nevertheless, a feed modulation in terms of the flow rate or concentration has been proposed because it might enhance the reactor performance, as proven, for example, in lab-scale trickle-bed reactors [18,19]. The reactant injection at different axial positions of the reactor is used to suppress undesired side reactions or subsequent reactions of the product. Membrane reactors represent an extreme case of this concept because reactants are added, or products are removed the whole way along the reactor. To provide an example in multiphase reaction engineering, such a concept was used to maximise the intermediate product hydrogen peroxide in the synthesis from hydrogen and oxygen [20,21,22].
Strategy level 3 aims at the hydrodynamic flow regime. Focusing on the solid phase, it can be either fixed inside the reactor as in packed bed or falling-film reactors or be kept in motion as in bubble columns or stirred-tank reactors. It is obvious that systems with suspended catalysts are used if the catalyst rapidly deactivates or in fine chemical applications, whereas fixed-bed reactors are preferred if the catalyst runtime between the regenerations exceeds several months. With respect to the gas and liquid phase, the choice of the flow regime mainly depends on the phase holdup, the favourable degree of backmixing, and the mass transfer characteristics. An appropriate choice of the phase holdup was already discussed for strategy level 1 by using the parameter β . Large liquid holdups are obtained in bubble column reactors and stirred-tank reactors (>60%), whereas they are comparably small in trickle-bed reactors (20–40%) and falling-film reactors (1–15%) [2,23].
Turbulent regimes provoke better plug flow characteristics than laminar flows [24]. Furthermore, the liquid backmixing in a packed bed is usually intense if the bed is completely flooded as in packed bubble columns, or it is comparatively small if the bed is operated in the trickle flow regime. Plug flow alike regimes should be used in reaction systems with high reaction orders, whereas a high degree of backmixing is preferable for systems showing low reaction orders or autocatalytic kinetics [25]. Mass transfer processes are typically accelerated by an operation at higher flow velocities, i.e., higher energy dissipation inside the system [2,26,27]. In packed beds, higher mass transfer rates may be obtained, for example, by switching from trickle to pulse flows [28].
By combing the decisions made at the three strategy levels, suitable reactor configurations can be identified. For an illustrative example of using this strategy, the interested reader is referred to the article of Krishna and Sie [12]. Deeper explanations were also given by Dudukovic [11], who sketched the process of choosing the best reactor configuration from 200 potential ones.
For completion, other attempts to guide the reactor selection should also be mentioned here. Bulsari et al. [29] developed an expert system suggesting either stirred-tank or tubular reactor systems based on the reaction enthalpy and the viscosity of the mixture. Doan et al. [10] proposed a method to identify the best available technology for reactors in the pharmaceutical industry. The authors suggest plotting spider diagrams using important decision criteria such as the thermicity, the reaction rate, the catalyst deactivation, the solubility and viscosity of the liquid phase, and the desired conversion and selectivity. The graphical depiction helps to choose the best concept from discontinuously or continuously operated stirred-tank, fixed-bed, or falling-film reactors.

2. Methods

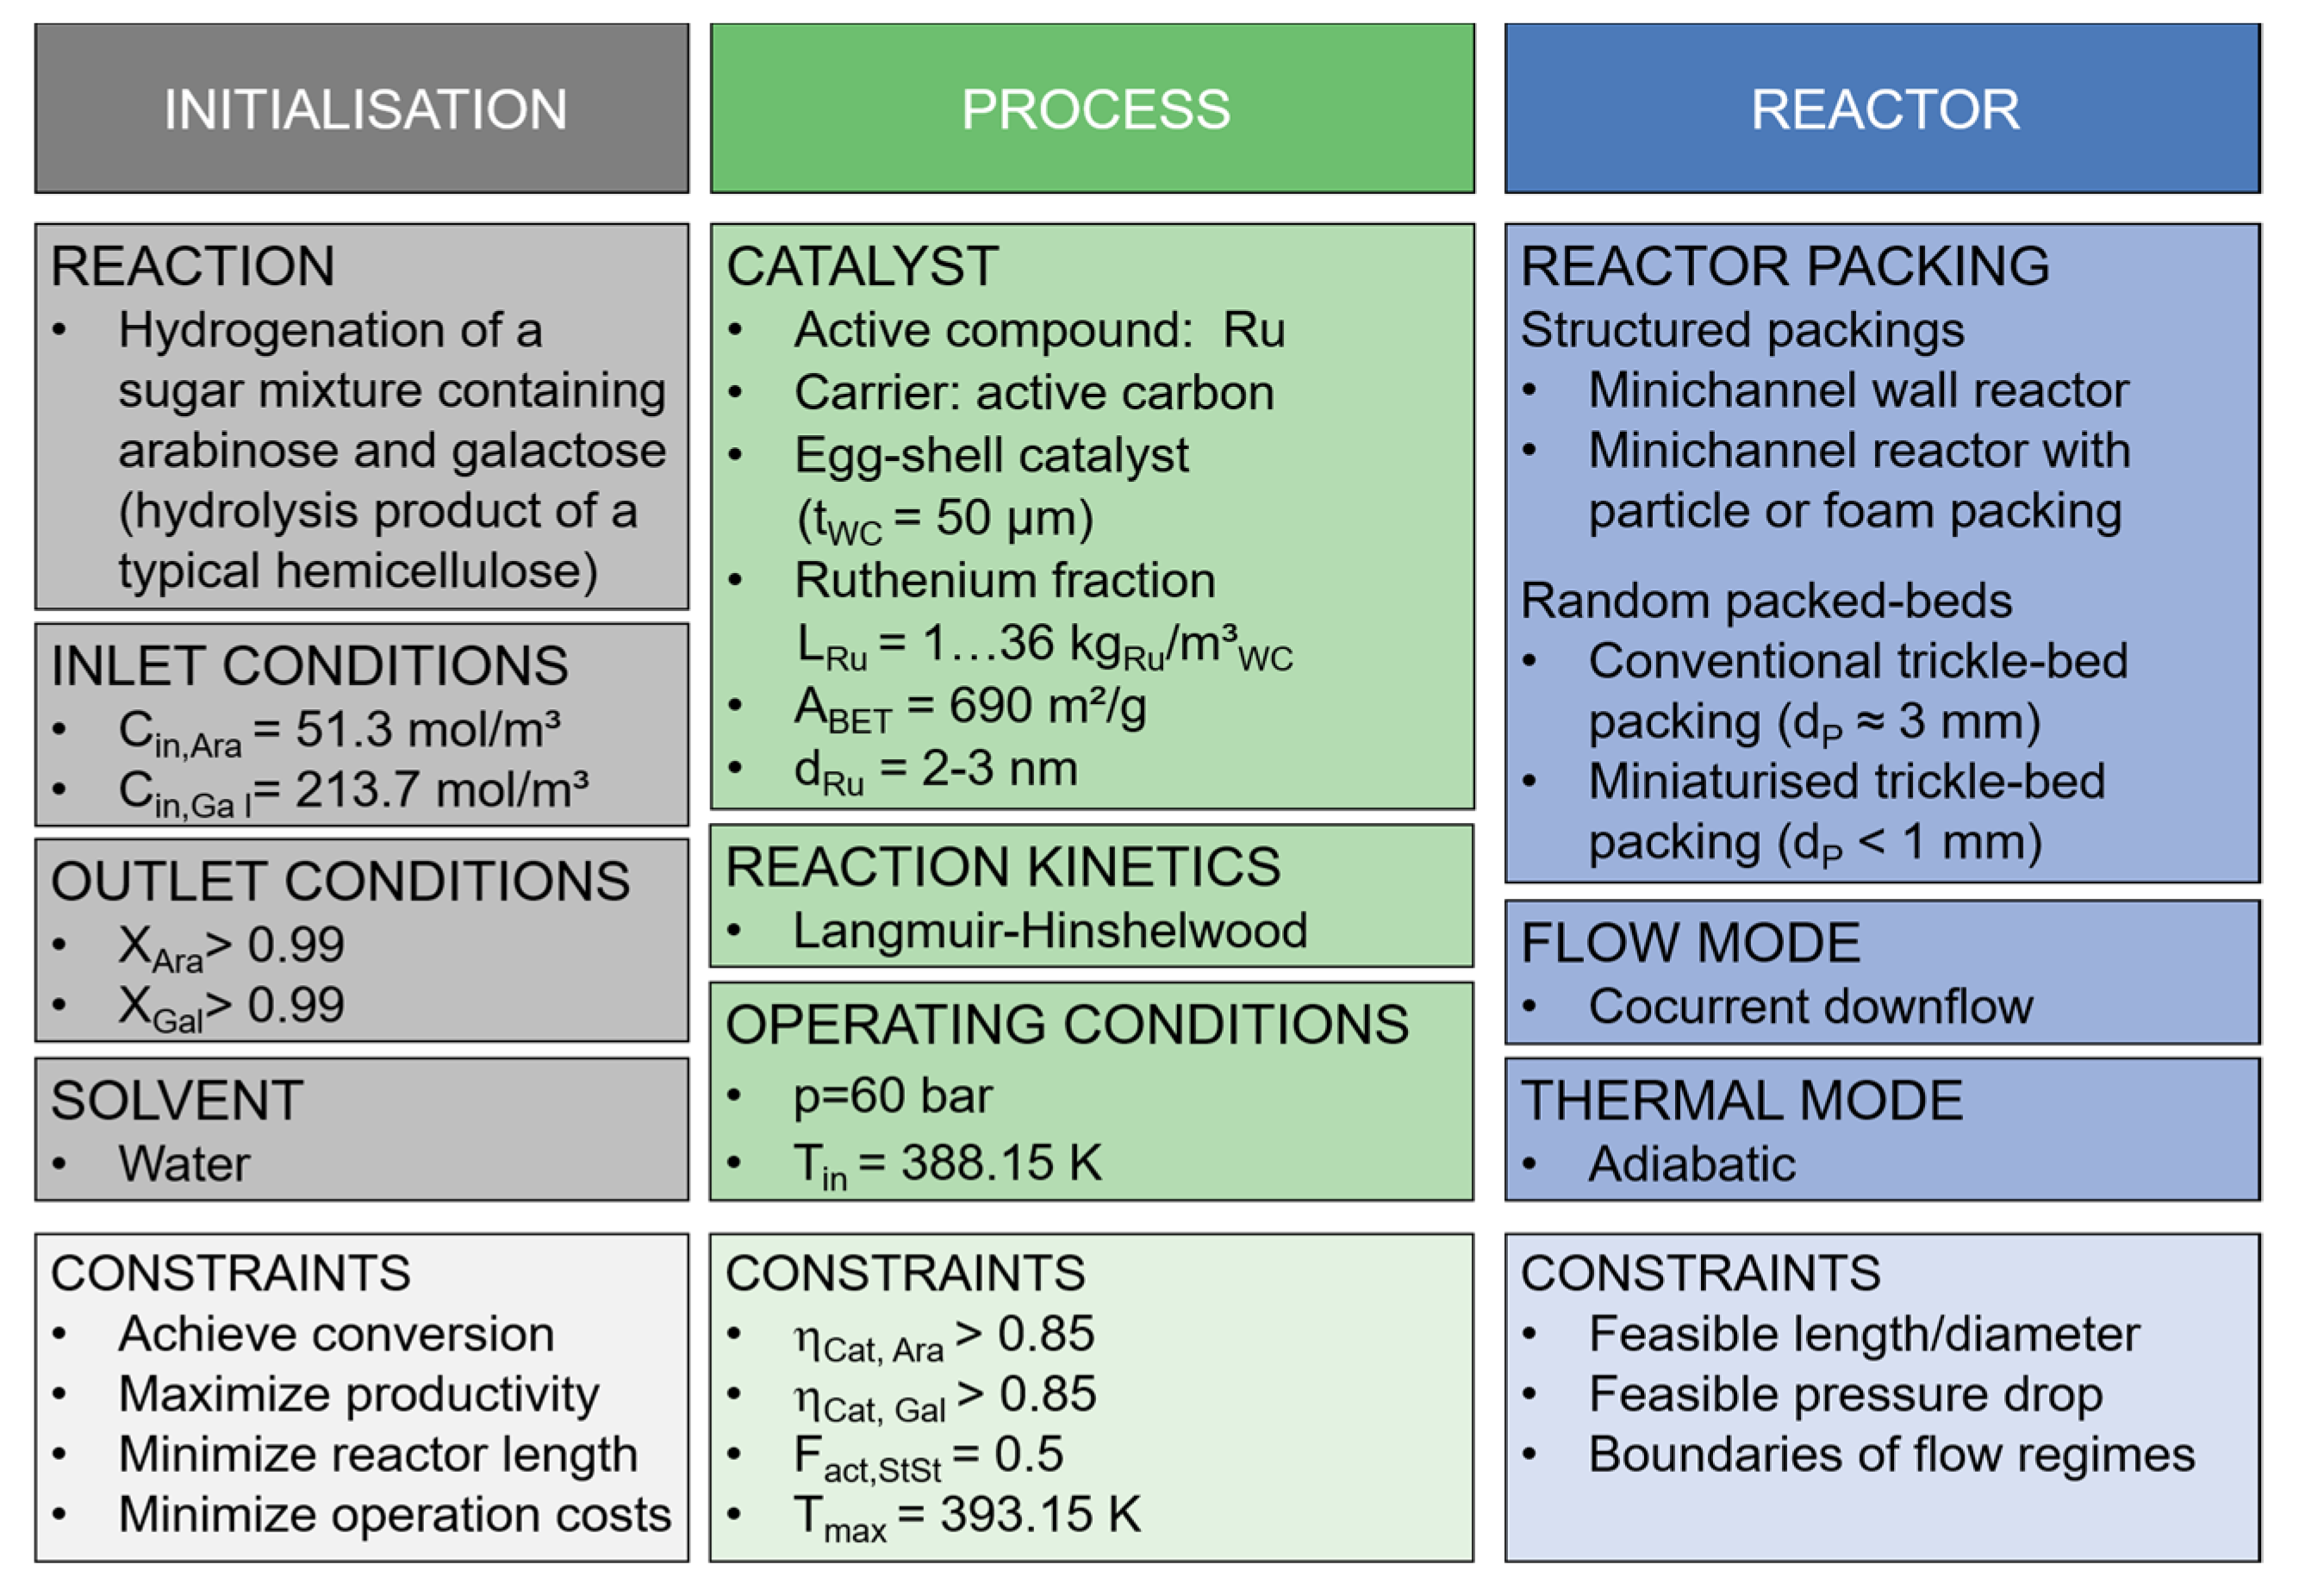
2.1. Definition of the Case Scenario

A biorefinery producing fuels or chemicals from biomass was set as a frame for this work. The main routes of biomass processing can be split into (a) gasification or pyrolysis at high temperatures and (b) hydrolysis at low temperatures. By acid or enzyme hydrolysis, the polysaccharides of cellulose and hemicellulose can be broken down into monosaccharides, which may be further hydrogenated to sugar alcohols. These sugar alcohols can be used directly as food or pharmaceutical ingredients, or this converted biomass may be further processed into hydrogen by aqueous phase reforming, into lubricants by esterification, or into chemicals by performing isomerisations as a first step. [30,31]
As for non-food feedstock, lignocellulosic biomass from wood is the object of intense research. It contains 40–50% cellulose, 25–35% hemicellulose, 23–33% lignin, and minor amounts of extractives (<5%) and mineral matter [32,33,34]. A forest-based biorefinery may be used to produce mainly pulp and paper, whereas hemicellulose-rich sidestreams may be used to create value-added products [35].

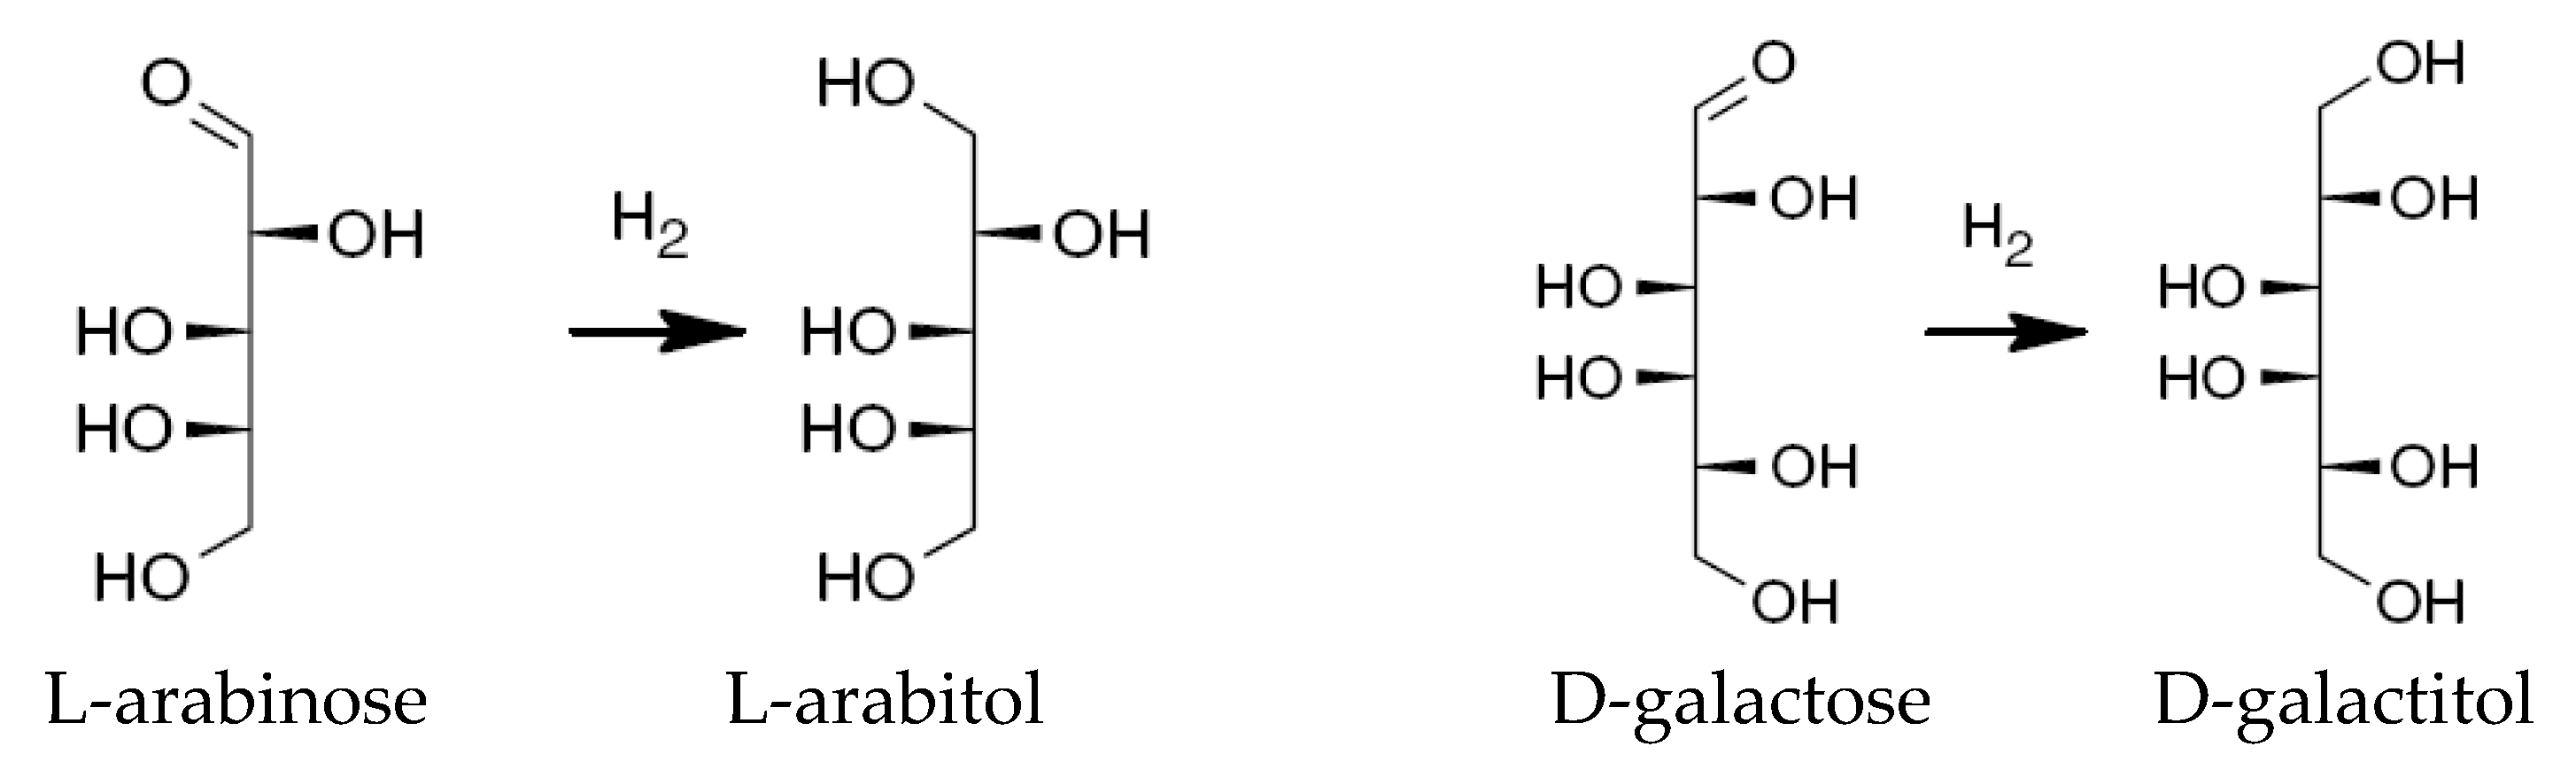
2.1.1. Hydrogenation Process

The sidestreams of a papermill using larch wood are considered in the case study of this work. Prior to pulping, the hemicellulose arabinogalactan can be extracted in a significant amount, which is about 15–20% of the dry wood mass [36]. By hydrolysis, the monomers galactose and arabinose, as well as gluconic acid, are obtained in a mass ratio of 5:1:0.08.
By hydrogenation, the mixture containing galactose and arabinose may be converted into galactitol (GalOH) and arabitol (AraOH), which represent valuable sugar alcohols, as discussed above and shown in Figure 1.

2.1.2. Process Parameters and Constraints

In the considered process, it was defined that the sugar molecules in the aqueous mixture of arabinose and galactose are converted by 99%. The inlet concentrations were chosen in such a way that all reactants and products are completely soluble in the mixture. These specifications are listed in the initialisation column of Figure 2.
Hydrogenation of sugars is usually performed in batch reactors using Raney nickel catalysts. This metal is chosen because of its low price, although there is a significant catalyst leaching [37,38]. In the last decade, ruthenium catalysts were intensively studied because they provide excellent selectivity exhibiting a higher activity than nickel catalysts [39,40,41,42,43,44,45,46,47]. Sifontes Herrera et al. [43] suggested that ruthenium will replace nickel because of its low toxicity and poor stability. This opens the window for continuous processing of sugars, as exemplarily demonstrated for glucose [32,39,45,48]. In the case scenario, a fixed-bed catalyst is preferred because it can handle large product streams and allows a high degree of automation. This leads to a small required workforce, which is especially beneficial in processing sidestreams. As a consequence, a Ru/C catalyst was chosen in this work.
Typical hydrogenation pressures vary between 30 and 180   bar , whereas temperature is kept between 80 and 150   ° C [45,49]. For the case study, a pressure of 60   bar and a maximal reaction temperature of 120   ° C was selected because insignificant amounts of byproducts are formed at these conditions [50]. Taking the thermicity of the reaction and the desired conversion, this is equivalent to an inlet temperature of 115   ° C in an adiabatic mode of operation. Physical properties at these conditions were obtained from state-of-the-art correlations by Hackl [51], Le Bas [52], Matubasi and Nishiyama [53], Origlia et al. [54], Partington [55], Poling et al. [56], Sifontes Herrera [50], as well as Wilke and Chang [57].
After defining main wishes and constraints, suitable reactor technologies may be identified according to the scheme of Krishna and Sie [12] presented before.
At strategy level 1, the size and form of the catalyst have to be specified. It is well known that diffusion limitations have to be respected in sugar hydrogenations because of the large size of the sugar molecules and the comparably low solubility of hydrogen [58,59]. Therefore, an egg-shell configuration of the catalyst was selected to provide short diffusion distances. The option to vary the outer catalyst dimension independently from the thickness of the active layer introduces an additional degree of freedom to reduce the pressure drop. Besides the catalyst design, small values of β , which characterise the ratio between overall liquid volume and the volume in the boundary layers, are desired to ensure intense mass transfer between the phases. To provide large transfer rates, Krishna and Sie [12] suggest forming liquid films inside the reactor as present in trickle-bed reactors. However, small values of β can also be generated by using miniaturised reactor systems. By decreasing the characteristic dimension, naturally, a larger amount of the liquid phase is present in the boundary layer, which enhances mass transfer [60].
Strategy level 2 considers the kind of feeding of the reactants. As discussed above, negligible side reactions occur in the hydrogenation of arabinose and galactose if ruthenium catalysts are used and the temperature is below 120   ° C . As a result, no staged injection of reactants is required. Thinking about the flow orientation of the reactants, co-flowing is preferred in trickle beds to push the liquid phase through the reactor and create thin films. Focusing on minichannel reactors, the counter flow of the fluids is only possible in the film flow mode, which has gained little attention so far. The main reason is that ca. 100-times larger gas than liquid flow rates are needed to establish this flow regime [61,62]. Considering the case of this work, the liquid flow rate has to be about 7-times larger than the gas flow rate to achieve a stoichiometric mixture. In consequence, the gas excess factor would take a value of about 700 if a minichannel film flow reactor is applied. This would cause large recycle loops and was therefore discarded. As a result, gas and liquid should flow co-currently inside the reactor. A periodic operation is not considered here because the regime of Taylor flow appearing in minichannels already offers a periodicity, and little information on mass transfer in transient-operated trickle-bed reactors is available so far.
Considering the selected fixed-bed reactor concepts, the choice at strategy level 3 shrinks to the selection of the two-phase flow regime. In miniaturised structures, only the Taylor flow and similar regimes are considered because they are most favourable in terms of efficient mass transfer and low backmixing [26,63,64]. The trickle-bed reactors are assumed to be operated in trickle flow. It should be mentioned that pulse flow is also possible [65,66] but was not considered here because the focus was laid on small reactor dimensions.
As a result of the reactor selection process, five potential reactor configurations were selected. They cover tubular reactors with (a) a conventional trickle-bed (TBR), (b) a miniaturised trickle-bed (MTBR), (c) a wall-coated minichannel also known as monolith or honeycomb (MCWR), (d) a minichannel packed with pellets (MCPR), and (e) a minichannel packed with an open-celled foam (MCFR). A detailed description of the configurations is given in Section 3.

2.2. Reactor Modelling and Simulation

When creating the reactor model, reaction kinetics, as well as mass and heat balances, have to be considered, which are explained in this section.

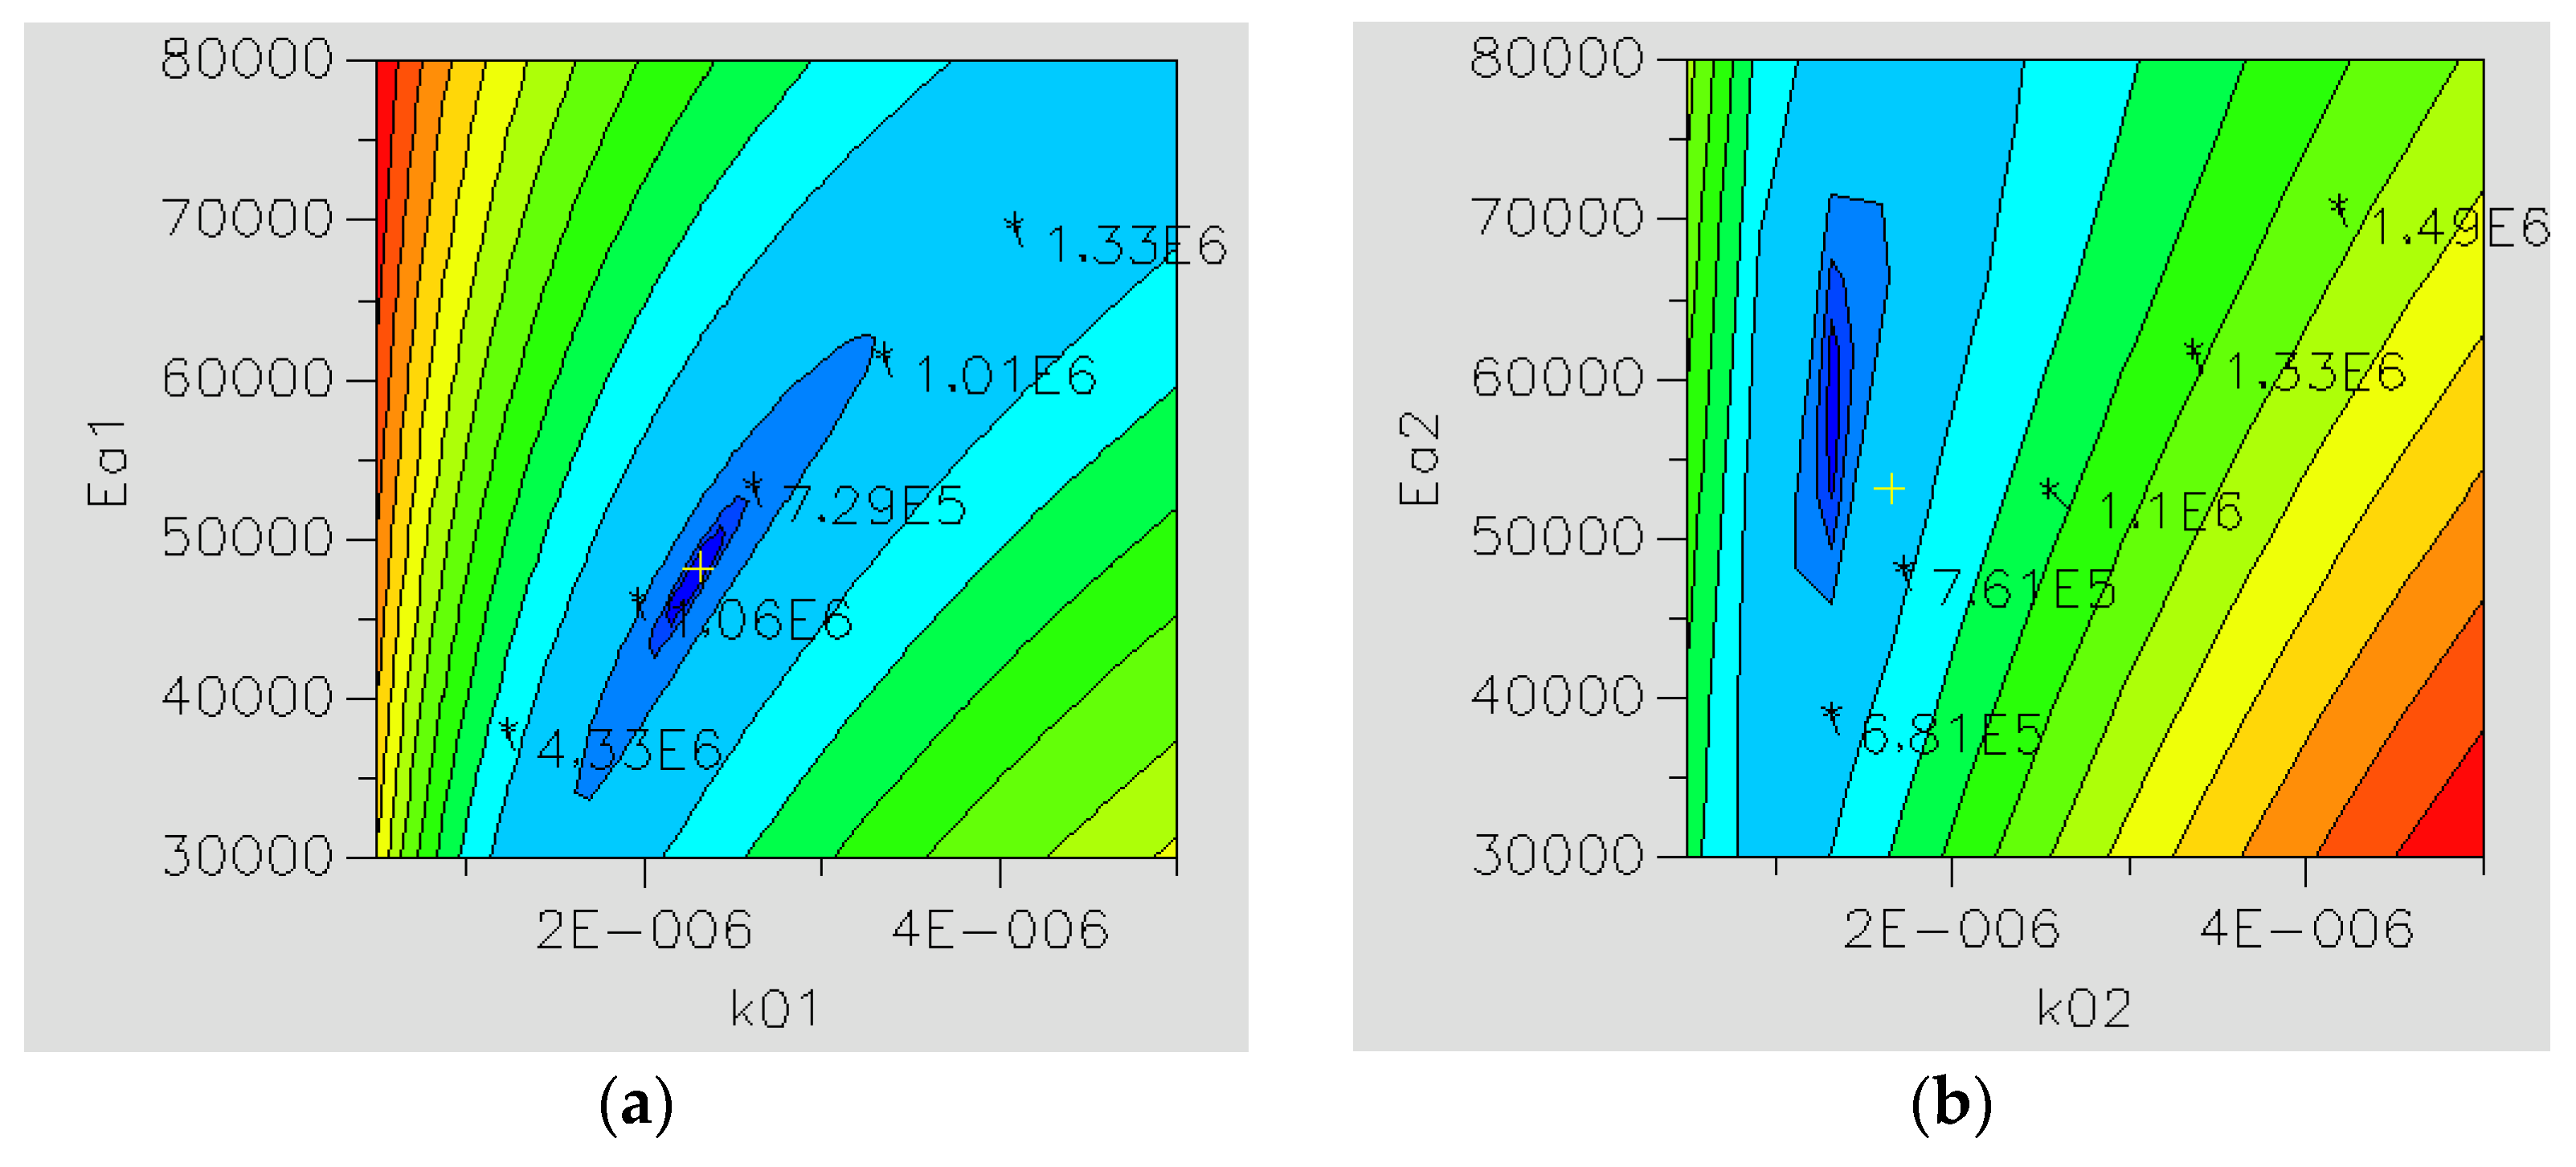
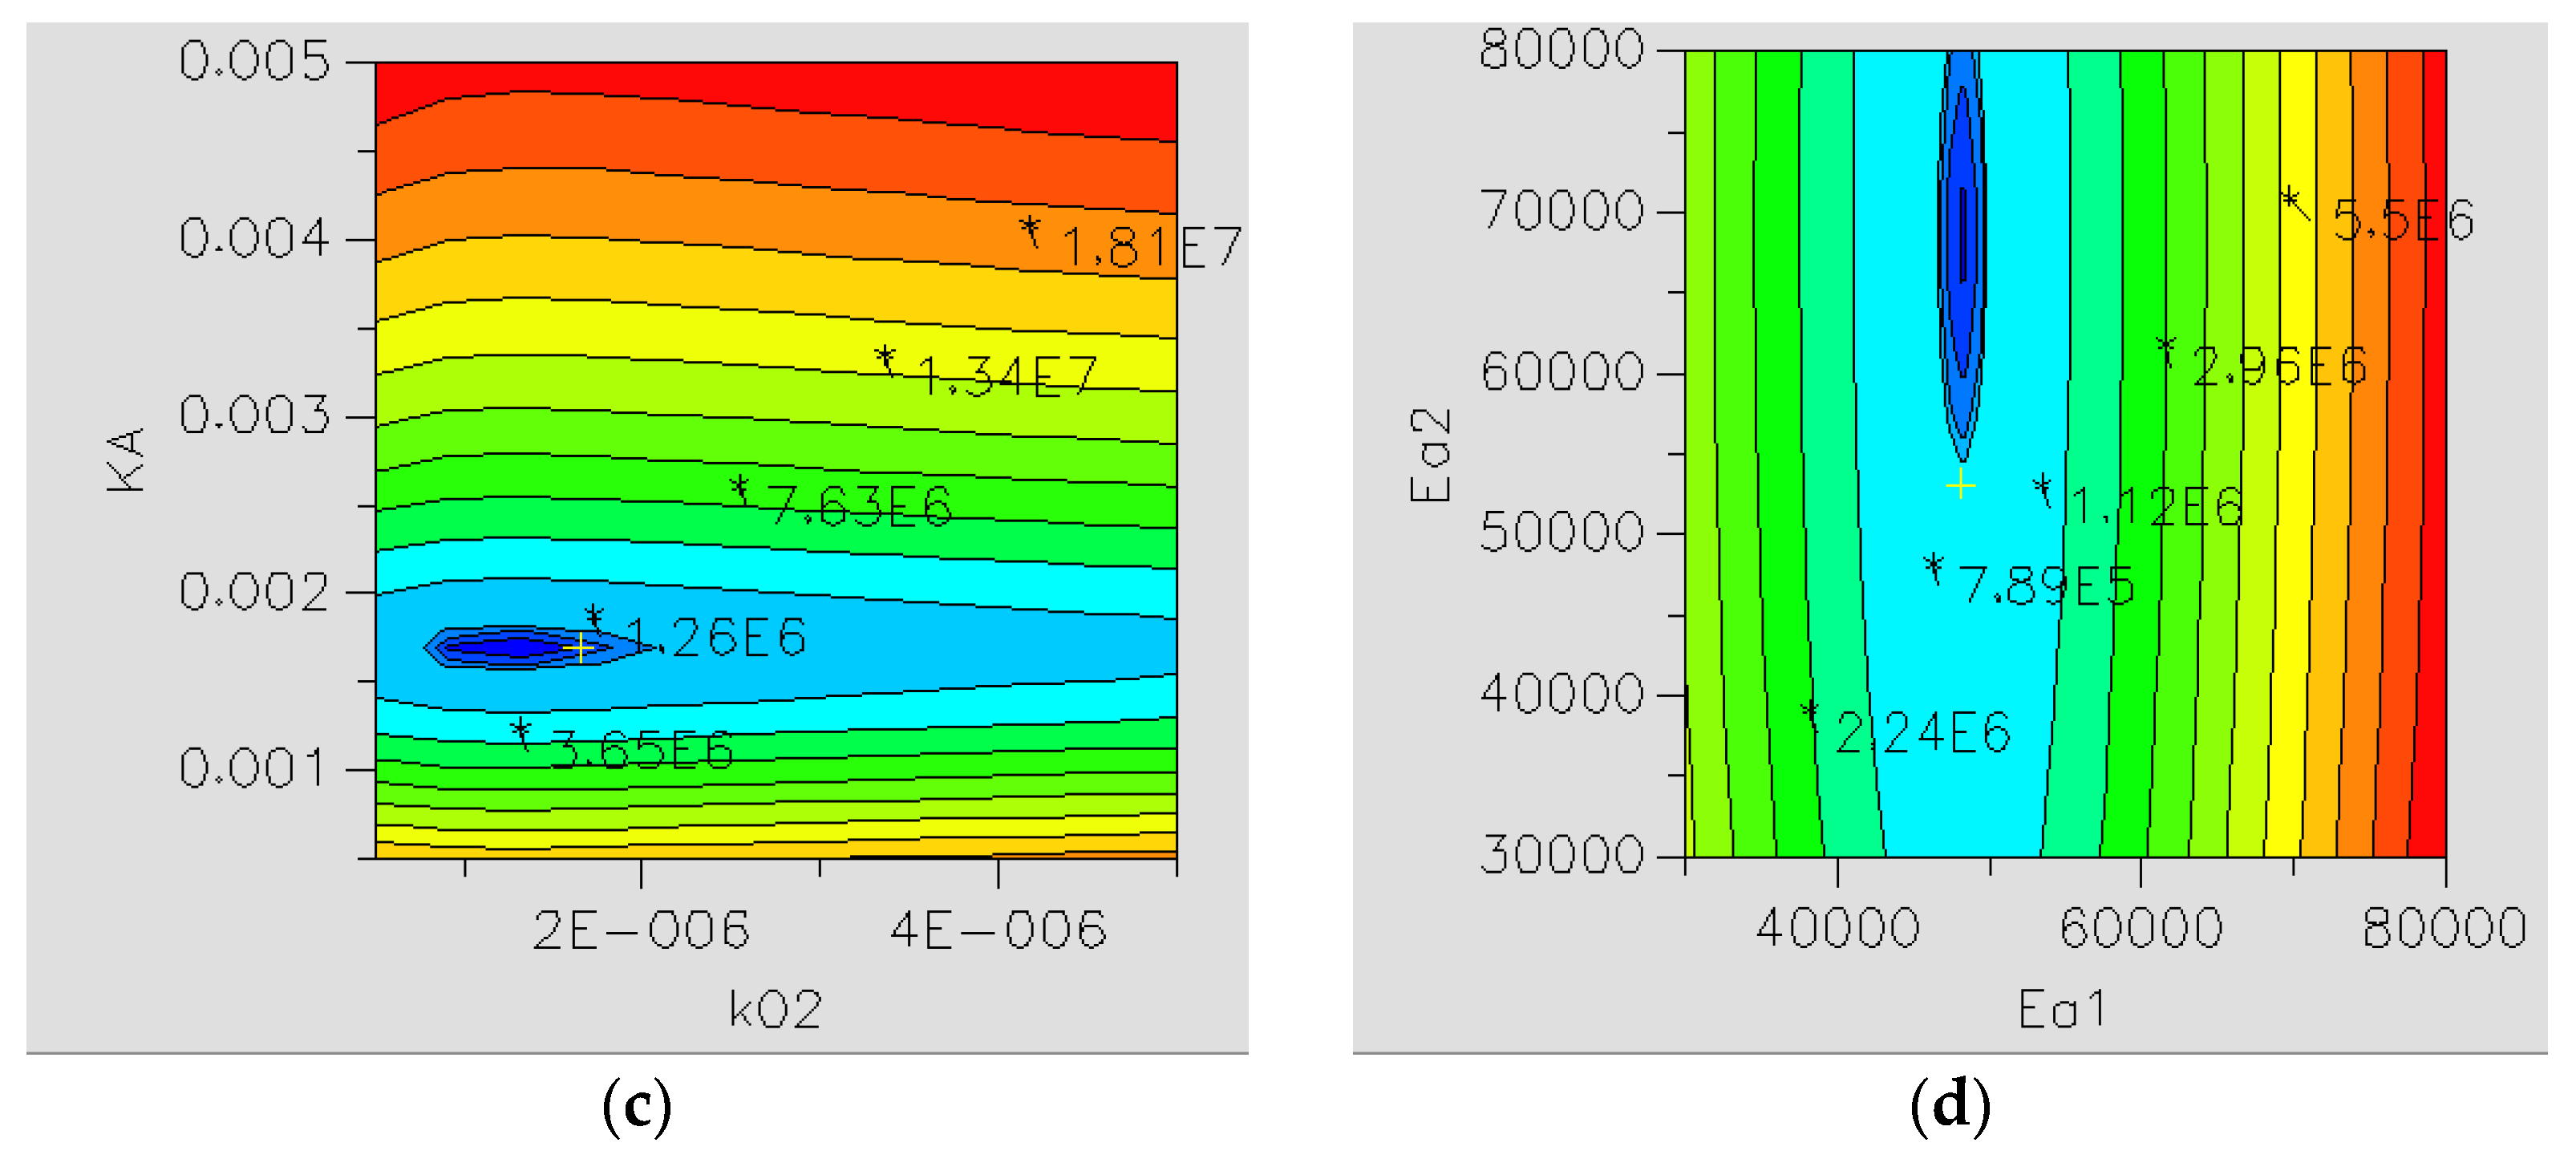
2.2.1. Reaction Kinetics

Sifontes Herrera [50] presented separate reaction kinetics for the hydrogenation of arabinose, galactose, and their mixtures. The experimental data were obtained in a batch stirred-tank reactor operating at pressures between 60 and 90   bar and temperatures between 90 and 120   ° C by using a commercial Ru/C catalyst. It should be mentioned that the corresponding rate laws were formulated by using weight fractions and not molar concentrations.
Therefore, reactor modelling was conducted in order to derive a suitable rate law based on concentrations by using the software Modest 6.0. To identify significant kinetic parameters, they were analysed and evaluated firstly for single sugar hydrogenation. As a result of these pre-studies, the following rate laws for hydrogenation of arabinose r A and galactose r G in aqueous solutions were defined:
r A = k A c A c H 2 ( 1 + K A c A ) 2  
r G = k G c G c H 2
These simplified models describe very precisely the experimental data of single sugar hydrogenations ( R 2 > 95 % ) while enabling a suitable parameter estimation with relative errors smaller than 6%. Based on these results, the following universal rate laws for the hydrogenation of arabinose and galactose and their mixtures were developed:
r A / G = k A / G   c A / G   c H 2 ( 1 + K A c A ) 2  
This expression is identical to Equation (1) for the hydrogenation of pure arabinose. Considering hydrogenation of pure galactose, the concentration of arabinose equals zero, and the denominator disappears, which results in Equation (2). However, this is not the case for the hydrogenation of sugar mixtures. Table 1 lists the estimated model parameters by using the experimental data of Sifontes Herrera et al. [43], 11 arabinose and 12 galactose hydrogenation experiments, and Sifontes Herrera et al. [67], 18 hydrogenation experiments using different arabinose/galactose mixtures. An excellent agreement between experimental and modelled data was found ( R 2 = 0.989 ).
It is shown that both reactions have similar activation energies but different pre-exponential factors. At identical sugar concentrations, the hydrogenation rate of galactose is about 2.5-times higher than the rate for arabinose. The faster conversion of galactose is favourable because the initial reaction mixture contains about four times more galactose than arabinose.
In order to analyse the sensitivity of the regression, the values of the objective function are plotted in 2D plots versus 2 different parameters in Figure 3. The sharp valleys in the depicted 2D plots indicate that all parameters are well defined.

2.2.2. Reactor Model

To model and simulate the reactors in a reasonable time, pseudo-two-dimensional reactor models were formulated, which consider the conservation laws of mass and energy at the reactor scale and at the catalyst scale. At the reactor scale, mainly effects of convection and internal mixing within the fluid phases in the axial direction are considered. For the catalyst scale, contributions of diffusion and reaction appear in the balances. In the model, empirical or semi-empirical correlations describe reaction kinetics and hydrodynamics, e.g., phase holdup, dispersion, mass transfer, and catalyst wetting [68]. The submodels on both scales are coupled via boundary conditions at the catalyst surface.

Mass Balances

Mass balances were composed at the reactor scale in such a way that they also consider changing hydrodynamics over reactor length. This is expressed by axial derivates of phase holdup ε G / L and the superficial phase velocity u G / L , s . The following mass balances for component i in the liquid and in the gas phase at the reactor scale were formulated:
( ε L c L , i ) t = ( u L , s c L , i ) z + D a x , L 2 ( ε L c L , i ) z 2 + k G L , i a G L ( c L , i c L , i ) k L S , i a L S ( c L , i c S , i | i n t e r f a c e )
( ε G c G , i ) t = ( u G , s c G , i ) z + D a x , G 2 ( ε G c G , i ) z 2 k G L , i a G L ( c L , i c L , i ) k G S , i a G S ( c L , i c S , i | i n t e r f a c e )
The system was assumed to operate in a steady state. It has to be mentioned that (a) the axial dispersion coefficients D a x , L , (b) the mass transfer coefficients k G L , i , k G S , i , and k L S , i , and (c) the saturation concentration of the gas in the liquid phase c L , i are functions of the system pressure and temperature and vary depending on the temperature and pressure gradients inside the reactor. Furthermore, the phase velocities and interfacial areas may also vary, especially for the minichannel configurations with segmented flow regimes [69].
When creating the mass balances at the catalyst scale, the shape of the catalyst has to be respected. Three basic geometries are distinguished: (a) spherical, (b) cylindrical, and (c) slab. The mass balance of the component i at the catalyst scale, i.e., within the solid phase or more precisely within the washcoat ( W C ) is as following:
Spherical catalyst with a radial coordinate r S
ε W C c S , i t = D e f f , i ( 2 c S , i r S 2 + 2 r S c S , i r S ) + ϱ M e j υ i , j r j , m
Cylindrical catalyst with a radial coordinate r C
ε W C c S , i t = D e f f , i ( 2 c S , i r C 2 + 1 r C c S , i r C ) + ϱ M e j υ i , j r j , m
Slab catalyst with an axial coordinate y S
ε W C c S , i t = D e f f , i 2 c S , i y S 2 + ϱ M e j υ i , j r j , m
Equations (6)–(8) relate the temporal change in concentration within the catalyst pores c S , i to diffusion within the pores and reaction at the active sites, usually a catalytically active metal compound ( M e ).
Several boundary conditions had to be defined to solve the mathematical problem. The submodels at the reactor and the catalyst scale were coupled via the boundary conditions at the catalyst surface. These conditions state that the flux of transported component i to or from the solid catalyst via the gas-solid or liquid-solid interface is equal to the amount that is consumed or produced per time by the chemical reaction. The catalyst surface is specified by the outer diameter of the spherical particle R S or cylinder R C as well as the end of the washcoat layer in a slab geometry t W C . Further employed boundary conditions are:
c G / L , i | z = 0 = c i , G / L i n   and   c G / L , i z | z = L R = 0 .
The boundary conditions for the solid phase are as follows:
c S , i | z = 0 = c S , i i n , c S , i z | z = L R = 0   and   c S , i r S | r S = 0 = 0   or   c S , i r C | r C = 0 = 0   or   c S , i y S | y S = 0 = 0 .
By doing so, the conditions at the particle centre must be related to the end of the washcoat section instead of the geometric particle centre if washcoated catalysts are used. For very thin washcoat layers on spheres or cylinders, the models using the slab geometry may also be used to keep the description simple without creating significant errors.

Heat Balances

Due to the low heat capacity and thermal conductivity of the gas, the impact of the gas phase was neglected without creating significant errors. As a result, the gas has the same temperature as the liquid ( T G = T L = T R ). Levenspiel [25] (p. 379) pointed out that only a small temperature rise will occur inside the solid catalysts of gas-liquid-solid reactors. Therefore, the reaction and heat production rates do not have to be resolved within the solid layer, and the global reactor heat balance is simplified for adiabatically operated reactors:
( ε L T R ) t = ( u L , s T R ) z + D a x , L 2 ( ε L T R ) z 2 +   λ a x , L ρ L c p , L 2 T R z 2 + ε S ϱ M e j   r j , m ( Δ H r , j ) .
This simplified heat balance declares that the heat accumulation within the bulk fluids is equal to the sum of transferred heat by convection, dispersion, or conduction plus the heat of the reaction. The boundary conditions are:
T R | z = 0 = T R i n   and   T R z | z = L R = 0 .

2.2.3. Model Specifications

In order to create fast-running reactor models, the fluid dynamics in the fixed-bed reactors are expressed through semi-empirical correlations to compute geometric properties as well as hydrodynamic parameters. It is obvious that these equations were developed for specific fixed-bed reactor designs. Therefore, special attention was given to avoid extrapolation to other geometries than in the original research work. The following section lists references to the employed correlations for the different reactor configurations.

Conventional and Miniaturised Trickle-Bed Reactor (TBR and MTBR)

Liquid saturation was computed by the correlation of Larachi et al. [70] for R e L ε L 1.5 , whereas the equation of Lange et al. [71] was used for smaller values. To compute the wetting efficiency, a new correlation was developed:
w e f f = 1 e x p ( 2.64   R e L 0.56 G a G 0.31 0.32 )
which is based on the predictions of Lappalainen et al. [72]. The modification was required to avoid values bigger than unity. Simulations show that the terms E ö and ( 1 + F r G ) can be neglected for u G , s < 0.3   m / s , which are considered within this work. Axial dispersion was considered by the Peclet number. For liquid Reynolds numbers below 4, the Peclet number was computed according to Fu and Tan [73]. For larger Reynolds numbers, the equation of Hochmann and Effron [74] was used. For the studied liquid superficial velocities, the Peclet number was typically between 0.2 and 1.0, and larger values were observed at higher liquid throughputs. The impact of the Peclet number on the achieved conversion was in the range of a few percent at conditions providing maximal space-time yields. Mass transfer coefficients between gas-solid, gas-liquid, and liquid-solid phases were calculated according to the correlations of Dwivedi and Upadhyay [75], Wild et al. [76], and Burghardt et al. [77]. The pressure drop for the bed of spherical particles corresponds to the predictions of Larachi et al. [70].

Wall-Coated Minichannel Reactor (MCWR)

Phase holdups were calculated by using gas bubbles and liquid slug lengths taken from Haase [78]. The mass transfer coefficients were computed by using the same source. The required film thickness was correlated according to Kreutzer et al. [63]. Axial mixing was neglected because only segmented Taylor flow was considered. The pressure drop was estimated by the method of Fries et al. [79] involving the frictional pressure drop of Kreutzer et al. [80]. A slab geometry was used to describe the active layer on the channel wall.

Minichannel Reactor Packed with Pellets (MCPR)

Phase holdups, mass transfer coefficients as well as the pressure drop in the minichannel packing with dumped spherical particles were predicted by using the equations of Haase et al. [26]. Due to the nature of the occurring segmented flow regimes, axial mixing was neglected [81,82].

Minichannel Reactor Packed with an Open-Celled Foam (MCFR)

The geometric surface area, liquid saturation, and holdup, mass transfer coefficients as well as pressure drop were predicted by using the correlations of Tourvieille et al. [27]. The same authors also observed negligible axial mixing, which was therefore also not considered in the reactor model. The struts of the foams were assumed to be of a cylindrical shape.

2.3. Evaluation Method

Different reactor concepts were evaluated (a) by their performance in terms of space-time yields for the production of arabitol (AraOH) and galactitol (GalOH) with respect to either the reactor volume S T Y A r a O H ,   v and S T Y G a l O H ,   v or the mass of the active metal S T Y A r a O H , m and S T Y G a l O H , m , (b) by the required reactor length L R , and (c) by the energy consumption per amount of the generated product P / n p . These performance parameters were predicted by conducting extensive process simulations using the reactor models that were presented before.
The evaluation of the reactor concepts is rather complex because the outcome for each reactor strongly depends on the operating conditions as well as on the catalyst loading if operated in or close to the intrinsic regime. Therefore, favourable operating conditions for each system have to be identified before making a fair comparison. Due to the fact that pressure, temperature, washcoat thickness, and the flow regime are fixed, the list of variables cover (a) the fed flow rates of gas and liquid expressed by their superficial velocities u G , s = V ˙ G / A q and u L , s = V ˙ L / A q as well as (b) the ruthenium loading in the washcoat of the catalyst x R u = m R u / V W C .
The range of feasible superficial velocities is restricted by the flow regime transitions. For trickle-bed reactors and miniaturised packed-bed reactors, the boundaries of the trickle-regime were predicted by using the simulator of Larachi and Grandjean [83]. For the wall-coated minichannel and the minichannel packed with pellets, the Taylor flow areas were predicted after Haase [84]. For foam-packed minichannels, the flow velocities were adjusted according to the studies of Tourvieille et al. [27,85].
For a reliable comparison, the ruthenium loading in each reactor should be adjusted according to its mass transfer capacity. If the loading is too low, the reactor operates in the intrinsic regime, and the mass transfer potential is not fully used. If the ruthenium loading is too high, not all ruthenium is effective in the chemical transformation. In order to find a suitable loading, the reactor was virtually packed with a catalyst containing the highest ruthenium loading of 36   kg Ru / m WC 3 . Afterwards, the reactor length was adjusted in such a way that 99% conversion of both reactants (Ara…Arabinose and Gal…Galactose) was achieved. By using this length, the metal loading is stepwise ( 0.5   kg Ru / m WC 3 ) reduced until the change in conversion exceeds a value of 1%. This procedure was performed twice: first by using the lowest flow velocities and second for the highest flow velocities to imply all possible conditions, which may affect the most intense mass transfer. Figure 4 illustrates this procedure.

3. Results

This section first reviews general aspects of the tubular reactor packed with different catalyst packings before the main performance parameters are discussed in more detail. For each packing, the impact of adjustable process variables is investigated, and the rate-limiting steps are elucidated. Furthermore, favourable operating conditions are determined that generate the highest use of space and catalyst mass, require the shortest reactor, or affect the lowest energy consumption. A detailed definition of the evaluation criteria is given within the discussions of the minichannel wall reactor.

3.1. Minichannel Wall Reactor (MCWR)

In minichannel wall reactors, the catalyst packing contains a variety of parallel flow channels with diameters less than a few millimetres. The active metal is integrated into the channel walls. Such catalyst packings have been used in exhaust gas treatment since the 1970s and are also known as monoliths or honeycombs [86]. They are made of ceramics (mainly cordierite) or metals (stainless steel, metal alloys, etc.) [87]. Ceramic structures typically contain up to 1200 cells per square inch ( cpsi ), i.e., hydraulic diameters down to 0.7   mm [88], whereas cell densities in metal structures may reach 1600   cpsi , i.e., channel diameters down to 0.6   mm [89].
This work investigates the performance of a reactor containing square minichannels with a hydraulic channel diameter of 1.0   mm . This specific size was chosen because it is a very typical technical dimension at present, for example, in monolithic structures with a cell density of 400   cpsi . Furthermore, hydrodynamics and mass transfer were extensively studied in this specific configuration [63,78,84,90,91].
Figure 5a exemplarily shows a concentration profile within the minichannel wall reactor. As expected, both liquid reactant concentrations asymptotically decline with enlarging reactor length, i.e., residence time in the apparatus, whereas the product concentrations oppositely increase. Interestingly, the hydrogen concentration within the liquid phase reaches the saturation concentration within the first 0.5   m of the reactor (please inspect the solid and dashed red line). This indicates that the transport of hydrogen molecules into the liquid slug is much more intense than that from the liquid slug to the solid catalyst. In consequence, the reactor should perform better at conditions that provide the large liquid-solid mass transfer as expected for flows streaming with a high velocity and a comparatively large liquid holdup.
Figure 5b depicts the achieved conversion of arabinose (Ara) and galactose (Gal) at reduced catalyst loadings. As a reference, the reactor configuration with a maximal ruthenium loading of 36   kg Ru / m WC 3 , which is equivalent to a ruthenium loading of about 5 wt.%, was chosen. As supposed, conversion at the reactor outlet is smaller for the lower amounts of ruthenium placed inside the washcoat. By reducing the ruthenium loading, the reactants have to diffuse into deeper washcoat layers until they are completely transformed into the desired products. These additional diffusion resistances lower the achieved conversion. Simultaneously, the catalyst is used more effectively because the reaction also occurs in layers beneath the outer surface. To provide an example, catalyst use in galactose hydrogenation is increased from 80% to 99% by reducing the metal loading from 36 to 1   kg Ru / m WC 3 .
In order to determine a feasible loading, the loading is stepwise reduced from 36   kg Ru / m WC 3 until the drop in conversion exceeds 1%, as explained before. By using this procedure, the ruthenium loading was fixed to 23   kg Ru / m WC 3 , which provides a catalyst use of about 85% in both reactions. It should be noted that all presented data refer to a catalyst activity of 50% in comparison to the initial state to consider a possible catalyst deactivation [50].
By using the fixed loading, extensive simulations were performed using superficial gas and liquid velocities between 0.005–0.31 m/s and 0.02–0.07 m/s, respectively. Within the selected conditions, stable Taylor flows should be generated within the channels [84]. By elevating the flow velocity, longer channels are needed to achieve the desired conversion.
In order to make the performance comparable, the volumetric space-time yields S T Y A r a O H , v and S T Y G a l O H , v were defined by:
S T Y A r a O H , v = n ˙ A r a O H V R = d h , c h 2   u L , s   c A r a , i n   X A r a ( d h , c h + 2   t W C ) 2   L R
S T Y v , G a l O H , v = n ˙ G a l O H V R = d h , c h 2   u L , s   c G a l , i n   X G a l ( d h , c h + 2   t W C ) 2   L R
which relate the molar flow rates of the products n ˙ A r a O H and n ˙ G a l O H to the reactor volume V R . These parameters can be easily calculated by using the hydraulic channel diameter d h , c h , the liquid superficial velocity u L , s , the reactant inlet concentrations, c A r a , i n and c G a l , i n , as well as their conversions at the reactor outlet X A r a and X G a l , the washcoat thickness t W C , and the reactor length L R . It should be mentioned that the wall thickness of the channel was not considered here because it can differ significantly. For example, Corning Inc. provides structures with walls of 3 , 4 , and 6.5   mil in thickness ( 1   mil = 1 / 1000   inch = 25.4   µ m ) [92]. Taking these values, the space-time yields for the whole reactor would shrink by 13%, 17%, and 25% in comparison to the given ones. The space-time yields referring to arabitol are not presented in the following to avoid repetitions because identical trends were observed for arabitol and galactitol.
Figure 6 illustrates that the obtained space-time yield varies between 0.2 20.5   mol / ( s   m R 3 ) depending on the chosen gas and liquid superficial velocities inside the reactor. By pumping more liquid into the reactor, space-time yields are increased, whereas the opposite response follows from feeding more gas. The effect of the gas throughput, in terms of the affected gradient, is about 50% more pronounced than that of the liquid, considering only their absolute values.
Such behaviour further supports the already discussed hypothesis that the reactor performance is mainly limited by the intensity of the liquid-solid mass transfer. By feeding more liquid into the reactor, the two-phase velocity enlarges, which results in higher volumetric mass transfer rates. Simultaneously, the specific liquid-solid interfacial area is elevated due to the enlarged liquid holdup. Both effects contribute to a more intense mass transfer and a better reactor performance. In contrast, higher gas throughputs also provoke larger transfer coefficients but reduce the interfacial areas between the liquid and the solid due to the lower liquid holdup. The second phenomenon seems to dominate because the reactor performs worse by increasing the throughput of the gas phase.
By using the mass of ruthenium instead of the reactor volume as a reference, the mass-specific space-time yield for galactitol can be calculated as following:
S T Y G a l O H , m = n ˙ G a l O H m R u = n ˙ G a l O H V W C x R u = d h , c h 2   u L , s   c G a l , i n   X G a l [ ( d h , c h + 2 t W C ) 2 d h , c h 2 ]   L R x R u  
The ruthenium mass inside the reactor m R u can be computed from the washcoat volume V W C and its metal loading x R u . As expected, the observed trends are identical to that of the volumetric space-time yield. This is not surprising because both space-time yields are connected only by a Factor F m v given by:
F m v = S T Y G a l O H , v S T Y G a l O H , m = m R u V R = [ ( d h , c h + 2   t W C ) 2 d h , c h 2 ] x R u ( d h , c h + 2 t W C ) 2
This ratio takes a value of about 2.0   kg Ru / m R 3 for the studied minichannel configuration. Figure 7 illustrates the necessary reactor length to achieve a sugar conversion of 99 % . In agreement with the theoretical expectations, longer reactors are required if the flow streams faster, e.g., by elevating the gas or liquid throughput. To give a rough number, the reactor length is increased by 50% for a velocity increase of 0. 1   m / s with respect to the gas phase. Similar gradients are obtained for the liquid phase if its velocity exceeds 0.2   m / s . For lower velocities, even higher factors were calculated.
Figure 7 also shows that immensely larger reactors are needed if they operate at very large gas velocities (compare the green, orange and red areas within the figure). This is caused by the extremely long gas bubbles inside the reactor, which reduce the interfacial area for the liquid-solid mass transfer and, consequently, affect low mass transfer rates. As already discussed, this is the core step in designing efficient reactors.
In order to evaluate the energy consumption of the reactor, the energy spent to pump the liquid to the reactor inlet as well as to push the liquid through the reactor is considered. The static head P s t a t is dominated by the liquid feed, which gives the following expression [93]:
P s t a t = Δ p L , f e e d V ˙ L = ( ϱ L g L R ) ( A q u L , s )
with ϱ L as the liquid density, g as the gravitational constant, L R as the reactor length, and the volumetric liquid flowrate as the product of the channel’s cross-section A q and the superficial velocity u L , s . It has to be mentioned that the feeding tube is expected to be large enough to neglect frictional pressure losses in the piping.
The energy dissipation P d y n which is required to force the gas and the liquid through the packing can be written as:
P d y n = Δ p d y n , R ( V ˙ L + V ˙ G )
in which V ˙ G and V ˙ L represent the volumetric gas and liquid flowrates and Δ p d y n , R is the dynamic pressure loss in the column. Several empirical equations are available to compute this term [79,80,94,95,96,97,98]. Within this work, the attempt of Kreutzer [80] was used.
These two contributions were related to the produced amount of galactitol to make a fair comparison. The final equation to evaluate the energy consumption refers to:
P n ˙ G a l O H , o u t = P s t a t + P d y n d h , c h 2 u L , s c G a l , i n X G a l .
Figure 8 presents the corresponding map of energy consumption.
Generally, the energy spent to produce 1   mol galactitol in minichannel wall reactors is very small. Considering superficial liquid velocities above 0.04   m / s , energy of less than 1   kJ is needed. It should be noted that the figure also indicates larger consumptions at very high gas velocities, but these are caused by the transformation of discrete data to a surface plot. By reducing the liquid velocity below 0.04   m / s , the specific energy consumption enumerates due to the low productivity of the reactor.

3.2. Minichannel Reactor Packed with Catalytic Particles (MCPR)

Particle-packed minichannel reactors are discussed as an alternative to minichannel wall reactors because they provide high catalyst loadings, and the catalyst integration is quite simple [99]. In this reactor configuration, the inert walls of the channels only guide the flow, whereas dumped particles inside the channels contain the catalytically active surface.
As potential particle geometries, rods [100], spheres, or cylinders [101] have been proposed, among others. Commercial catalysts are already available, which shortens implementation time besides reduced efforts and costs for catalyst development. In the literature, particle-packed minichannel reactors are also referred to as composite minichannel reactors, structured trickle-bed reactors, or pellet-string reactors. In the 1960s, such a string of particles was proposed by Temkin and Kul’kova for catalyst screening in gas phase reactions [102]. For reactions with gas and liquid phase, they were successfully applied to mimic mass transfer processes in industrial or pilot-scale reactors [82,103,104,105] or were discussed as an alternative reactor design for the fine chemical industry [106,107,108].
This work analyses a reactor containing square minichannels with a hydraulic channel diameter of 1.0   mm that are packed with spherical particles of 0.8   mm in diameter. The channel diameter was chosen identical to that of the minichannel wall reactor to have a fair comparison. The particle size was set according to a configuration that has been extensively investigated in terms of hydrodynamics and mass transfer [26,109].
Figure 9a displays a typical concentration profile within particle-packed minichannel reactors. The hydrogen concentration in the gas-free reaction mixture rapidly increases but does not reach the saturation concentration depicted by the red dashed line. This proves that gas-liquid and liquid-solid transfer coefficients are of the same order of magnitude. In this case, the hydrogen concentration takes such values that identical amounts of hydrogen are transported into or out of the liquid slug. A strong decline in the saturation concentration further indicates a strong pressure drop across the reactor packing. These pressure losses cause a reduced hydrogen concentration within the gas and, consequently, also at the liquid interface, which lowers the overall mass transfer rate.
Figure 9b illustrates the change in arabinose and galactose conversion affected by a lower metal content inside the washcoat. As expected, the largest drop occurs for the fastest reaction (galactose hydrogenation) at the highest flow velocities. Based on the graphs, the ruthenium loading was set to 26   kg Ru / m WC 3 .
The achieved volumetric space-time yield of galactitol depending on the adjusted superficial gas and liquid velocities is shown in Figure 10. As a brief reminder, the same trends are observed for the space-time yield of arabitol, and the mass-specific space-time yield can be easily computed from the volumetric one by using a factor characterising the ruthenium content inside the reactor. For the studied reactor configuration, this takes a value of about 2.5   kg Ru / m R 3 .
The graph shows that space-time yields between 1.4 and 29   mol / ( s   m R 3 ) can be realised in particle-packed minichannel reactors. The space-time yield is generally enlarged by feeding more liquid into the column, whereas higher gas throughputs have only a minor impact. A slight optimum was found at a liquid superficial velocity of about 1.0   m / s . This seems puzzling at first sight because mass transfer intensity and, therefore, reactor productivity should increase by elevating the liquid throughput. However, a higher throughput creates a larger pressure drop across the bed that suppresses the transfer of hydrogen due to the lower saturation concentration at the gas-liquid interface. As a consequence, the volumetric reactor productivity decreases. It should be mentioned that the range of investigated fluid velocities was limited to conditions that provide Taylor-similar flow regimes [109]. The corresponding reactor lengths to achieve a sugar conversion of 99% are depicted in Figure 11.
Figure 11 clearly shows that longer reactors are needed for elevated liquid throughputs, whereas the impact of the gas throughput is the opposite. In order to obtain a deeper understanding of the underlying phenomena, let us consider a reactor operating at u G , s = 0.17   m / s and u L , s = 0.50   m / s . By elevating the gas velocity by 50%, the volumetric transfer coefficients in the inlet region remain almost constant at the gas-liquid and liquid-solid interface but are enhanced by about 50% at the gas-solid interface, whereas the educt conversion is more or less identical. This means that the expected decrease in conversion due to the reduced residence time is compensated by a faster supply of hydrogen via the gas-solid route, and reactors with a similar length exhibit the same conversion.
By elevating the liquid velocity by 50%, the transfer coefficients between gas-liquid and gas-solid are quite the same but increase by 50% at the liquid-solid interface. However, the conversion drops down. Subsequently, a longer reactor is needed to achieve the desired conversion. As a result, the gas-solid mass transfer seems to be the most effective route to supply the catalyst surface with hydrogen.
Figure 12 illustrates the specific energy consumption of the reactor. The values range from about 0.3   kJ / mol at u L , s = 0.05   m / s to about 25   kJ / mol at u L , s = 1.4   m / s . This large impact of the liquid velocity is directly connected with the required reactor length, as discussed above. By elevating the gas velocity, similar reactor lengths may be used to process the same amount of the liquid feed. Therefore, the specific energy consumption changes only marginally.

3.3. Minichannel Reactor with Foam Packing

Foam minichannel reactors are a quite novel minichannel reactor configuration in which inert minichannels are packed with an open-celled foam structure instead of particles, as shown in the last subsection. This reactor concept was firstly presented by the group of Bellefon (Université de Lyon) in 2015. Several publications investigate hydrodynamics such as flow regime, liquid saturation, and residence time [85,110,111] or external mass transfer and pressure drop [27,112,113] in such structures.
Open-cell foams are excellent catalyst supports because of the high porosity (from 0.60 to 0.97 ) and large geometric surface area (up to 10 , 000   m 2 / m 3 ) [114,115]. However, this structure suffers substantially from liquid maldistribution and flow channelling if applied in downflow reactors with diameters of several cm [116,117,118]. This maldistribution may be effectively diminished by integrating the open-celled foams into minichannel structures, which provide segmented flow regimes and ensure full catalyst wetting [110].
This work analyses the performance of a square minichannel with a side length of 2.0   mm , which is packed with an open-celled foam. The channel size was set according to the available publications [27,85,110]. These publications provide data for foams with pore densities of 35 , 45 , and 55   ppi . Coating foam structures with high pore densities is rather crucial because of cell blocking. Lali et al. proposed a method to create carbon-coated foams of 30   ppi [119]. In order to study a practical feasible configuration, the foam density was set to 35   ppi .
Figure 13a shows the axial concentration profiles in a foam-packed reactor. The simulations indicate that extremely short reactors with lengths of only a few centimetres are needed to fully convert the sugars into sugar alcohols. Within such short lengths, the liquid phase does not even saturate. This mainly results from the very intense mass transfer already at very low liquid throughputs. The enormous mass transfer ensures a suitable use of the comparable high catalyst loading ( 7.6   kg Ru / m R 3 ), which is at least 3-times larger than that of the other minichannel configurations. The corresponding washcoat loading is 30.5   kg Ru / m WC 3 as illustrated in Figure 13b.
The space-time yields with respect to galactitol are depicted for different gas and liquid superficial velocities in Figure 14. The figure clearly shows that the volumetric space-time yields between 25 and 50   mol / ( s   m R 3 ) are obtained, and higher values are generated by feeding more gas or liquid through the packing. The gradients describing the impact of the liquid velocity in terms of [ mol / ( s   m R 3 ) ] / [ m / s ] are about 3-times as big as these for the gas velocity. This is not expected from a first inspection of the figure but is a result of a very small velocity range for the liquid phase. Contrary to other minichannel reactors, the surface of the foam is expected to be completely wetted, and the molecules are transported only via the gas-liquid or the liquid-solid interface [27]. As a result, both transfer steps are intensified by forcing more gas or liquid through the column. This is not the case in the other minichannel reactor types in which a higher liquid throughput affects a larger liquid holdup that slows down the gas-solid mass transfer.
Figure 15 illustrates the required reactor lengths to achieve almost full sugar conversion. Generally, the reactor length rises by feeding more liquid and shortens by feeding more gas through the column. On the one hand, a higher gas or liquid throughput provokes a more intense mass transfer. On the other hand, an elevated liquid throughput affects larger molar streams of the sugars that have to be converted. The presented data clearly prove that the latter effect dominates, and longer reactors are needed if more liquid is pumped into the reactor.
The situation is different considering the gas flow. Higher flow rates improve mass transfer processes but are not connected with a higher amount of fed sugars that have to be processed. As a result, the reactor length is less sensitive to the gas velocity.
Figure 16 illustrates that only a few Joule are spent in foam-packed minichannel reactors to produce 1   mol of galactitol. This small energy consumption results from the low-pressure drop due to comparatively low liquid flow rates and very short reactor lengths. Considering one specific gas velocity, the surface plot indicates a minimum in energy consumption with respect to the liquid velocity. By elevating the liquid throughput, the pressure drop and, therefore, the energy consumption, as well as the mass transfer capacity and, consequently, the reactor productivity, is elevated. These counteracting phenomena form a minimum in energy consumption. However, this will not be of high practical interest since the energy consumption is extremely low at all operating conditions.

3.4. Mini Trickle-Bed Reactor

In the last decade, miniaturised trickle-bed reactors have emerged, which can be considered as the scaled-down version of industrial packed beds and represent a compromise between packed beds and microreactors [120]. Such reactors contain particles in the submillimetre range and are, therefore, often called micro-trickle or micro packed-bed reactors. Fundamentals and applications were addressed in several books [121,122,123] and reviews [3,6,120,124,125,126,127].
Micro packed-bed reactors with particles of a few micrometres provide very fast mass transfer and nearly plug flow behaviour that make them an excellent tool to access intrinsic kinetic data [120,128,129,130,131,132,133], although radial mass transfer may negatively affect the obtained data as has been recently discussed by Moulijn et al. [134]. For the near future, Ranade et al. [122] as well as Hommes et al. [135] attested micro packed bed reactors also several application areas, especially in the production of specialties and pharmaceuticals due to the above-discussed features, which excellently meet the needs of hydrogenations, oxidations, or fluorinations.
However, flow paths inside packed beds with particles of a few micrometres are tiny and twisted, affecting extremely large pressure drops, e.g., Losey et al. [128] reported values of 85   bar / m . Additionally, it is highly expected that feeding such reactors with non-ultra-pore liquids, such as the mixtures created by processing biomass, which are the subject of this work, will rapidly cause a complete blockage because of solid scrubs, impurities, or unconverted large molecules flowing within the inlet stream. In order to study a practical, feasible concept, a micro packed bed with comparatively large particle diameter, d P = 0.8   mm , was chosen. In such dimensions, the hydrogenation of pure sugar mixtures was already successfully realized [68,136,137]. In order to avoid confusion with the other concepts, the term mini trickle-bed reactor will be used for this reactor configuration in the following.
Typical axial concentration profiles in the studied mini trickle-bed reactor are shown in Figure 17a. Concentrating on the gaseous reactant, it is obvious that the hydrogen concentration in the first 0.18   m of the reactor only marginally increases with a maximum of about 40% of the saturation concentration. In the lower part of the reactor, the hydrogen concentration rises faster and reaches a final value of about 80% of the saturation concentration. This trend was typical for all operating conditions. It can be explained by the slower transfer into the liquid film than from the film to the solid catalyst, cf. k a G L , H 2 0.8 1/s and k a L S , H 2 5.0 1/s. Having this in mind, the rapid hydrogen consumption due to the fast chemical reaction hinders establishing higher hydrogen concentrations in the liquid phase in the first part of the reactor. As soon as the reaction rate slows down to a critical value (visible by the point of inflection in liquid phase concentrations at a reactor length of about 0.18   m ), the hydrogen concentration increases with larger gradients. Figure 17b illustrates the procedure to choose the metal loading of 27.5   kg Ru / m R 3 .
Figure 18 displays the obtained volumetric space-time yields in mini trickle-bed reactors. They can be transformed into the mass-specific yields by using the ruthenium loading inside the reactor, which is 5.6   kg Ru / m R 3 . By increasing the flow velocity, typical gradients are 200 and 30   [ mol / ( s   m R 3 ) ] / [ m / s ] for the gas and liquid phase, respectively. As a consequence, the fed gas stream is a vital tool to tune the reactor productivity, whereas the liquid stream has a much lower impact. It should be mentioned that the catalyst is completely wetted at all flow conditions due to the high liquid holdup, which is in agreement with observations of other researchers [138].
The corresponding reactor lengths take values between 0.36 and 1.2   m , as depicted in Figure 19. The generated trends agree well with the expectations, i.e., the reactor length is shortened by elevating the gas velocity because of the higher space-time yields, as discussed before. Likewise, the liquid throughput marginally affects the necessary reactor lengths.
The specific energy consumption to generate a galactitol molar stream of 1   mol / s is shown in Figure 20. Generally, more energy is needed if the column is operating at higher gas throughputs. This is surprising because shorter reactors are needed in this case. Subsequently, larger pressure drop caused by faster streaming fluids is overcompensated by the effect of a shorter reactor.
At first glance, the liquid throughput seems to have only a negligible impact on energy consumption. Taking a closer look and considering a low range of flow rates, energy consumption increases by 80% for a liquid velocity increase of just 0.01   m / s . This is ca. the four-fold of the changes obtained for the gas velocity.

3.5. Trickle-Bed Reactor

The performance of a conventional trickle-bed reactor was also studied in addition to the miniaturised reactor designs. Depending on the application, spherical particles, trilobes, full and hollow cylinders, or wagon wheels are placed into the reactor to form the catalytic bed. The characteristic sizes are usually several millimetres.
Details on the general construction, hydrodynamics, and mass transfer for various operation modes, as well as approaches to simulate relevant processes, have been described in numerous original papers, reviews, and books. For general information, the interested reader may be referred to Al-Dahhan et al. [65], Dudukovic et al. [139], Iliuta et al. [140], Ranade et al. [122], whereas the forced cyclic operation was intensively discussed by Atta et al. [141], Lange et al. [142,143] and Schubert [144]. In the last few years, research on offshore installations [145,146,147] and rotating beds [148,149,150] has also appeared.
This work investigates the performance of a column containing spherical catalyst particles with a diameter of 3.0   mm because this represents a very common size in industrial installations. The range of feasible gas and liquid superficial velocities to achieve trickle flow was predicted by the trickle-bed simulator developed at Laval University [83].
Figure 21 shows a typical axial concentration profile within the conventional trickle-bed reactor. The general trends are very similar to those obtained in the miniaturised version. However, the reactor performance is worse due to the reduced mass transfer capacity, which can be deducted from the lower hydrogen concentration in the liquid phase (reaches only about 50% of the saturation concentration) and the smaller amount of used catalyst (loading of 21.5   kg Ru / m WC 3 ). At the highest studied flow velocities in the conventional trickle-bed, the volumetric mass transfer coefficients were only between one-fifth and one-sixth of those obtained in the miniaturised bed.
The volumetric space-time yield of the conventional trickle-bed reactor versus the superficial gas and liquid velocities is depicted in Figure 22. The general behaviour agrees with that of the miniaturised trickle-bed reactor, although the order of magnitude is about five times smaller. However, this is not the case for the mass-specific space-time yield because of the comparable low catalyst loading inside the reactor. It is only about 1.3   kg Ru / m R 3 due to the large particle size d P = 3.0   mm and the thin washcoat thickness t W C = 50   µ m . This means that only the outer 10% of the particle volume is catalytically active. The corresponding surface plots of the required reactor lengths and specific energy consumption are shown in Figure 23 and Figure 24, respectively.
Identical trends are observed in the conventional and miniaturised trickle-bed reactors. The underlying reasons are the same and will, therefore, not be discussed again. What must be mentioned is the order of magnitude. In comparison to the miniaturised bed, about three times longer reactors are needed to achieve the desired sugar conversion. However, the required energy consumption is about 20-times lower.

4. Selection of a Proper Reactor Configuration

The last subsection analyses fluid dynamics and transport processes in each studied reactor configuration and presents feasible performance parameters. This forms the basis for finding the optimal reactor configuration from the set of different fixed-bed reactors.
From an industrial point of view, an objective function may be defined as the profit in a specific time frame, which depends on the investment costs of the equipment, the variable costs of raw materials, consumed utilities, required workforce, and spent energy, as well as the income due to the sale of the product. However, major contributions such as the costs of the catalyst cannot be specified for the innovative catalyst structures appearing in some reactor configurations of this work because they were developed and used only in lab-scale applications and not at the industrial scale. Therefore, the different reactor configurations are evaluated by (a) quantitative criteria covering the obtained yields, consumed energy, and the required reactor length, as well as by (b) qualitative criteria addressing handling, operability, and scale-up.

4.1. Quantitative Parameters

From the extensive process simulations, a database was created that contains (a) the space-time yield with respect to the reactor volume or to the ruthenium mass, (b) the required reactor length, and (c) the specific energy consumption created by pressure drops at about 300 different flow conditions for each reactor configuration. As already mentioned, the reactor length was chosen long enough to achieve at least 99% conversion of arabinose and galactose at each condition. Table 2 lists important minima and maxima for each configuration.
Table 2 clearly demonstrates that the performance parameters vary quite much for all reactors depending on the flow conditions. Considering only the presented data, the obtained space-time yields differ by a factor between 2 and 3 for minichannel wall, foam-packed minichannel, and trickle-bed reactors. This factor is even higher for particle-packed minichannel reactors (value: 21 ) or mini trickle-bed reactors (value: 43 ). This behaviour underlines the importance of determining optimal conditions for each configuration to make a fair comparison.
Maximal space-time yields in minichannel reactors will be generally created if they operate at maximal gas flow rate and a medium liquid flow rate. High gas velocities contribute to intense mass transfer. Considering flows at higher liquid superficial velocities, the counteracting between the mass transfer coefficient (elevates with flow rates) and the mass transfer area (elevates for liquid-solid and declines for gas-solid transfer) explains a maximum at medium flow rates. In trickle-bed reactors, the largest space-time yield is observed at maximal possible gas and liquid flow rates because the liquid flow rate does not affect the liquid holdup to such a large extent as in minichannel reactors.
Reactor lengths reach a minimum if the minichannel configurations are fed by minimal liquid and maximal gas flow rates. Such behaviour is expected because these conditions provide intense mass transfer and the lowest possible liquid throughput. The situation is somewhat different in the trickle-bed reactors, in which the liquid flow rate must be higher to ensure sufficient mass transfer rates. In consequence, the minimal lengths are obtained at medium liquid velocities in the packed beds.
The energy consumption is in most cases minimal if the lowest feasible gas and liquid flow rates are fed into the reactor because such conditions create the lowest pressure drop. The trickle-bed reactor is the only exception in which such conditions lead to very low mass transfer rates, and longer reactors are needed to reach the desired sugar conversion. In this case, conditions allowing a compromise between the mass transfer intensity and the reactor length result in the lowest pressure drop.
The results of Table 2 are also depicted in the form of radar diagrams to provide a more illustrative comparison (Figure 25). Several aspects have to be considered in finding the best reactor configuration. On the one hand, the optimal reactor configuration should inhibit the highest values of both space-time yields to use the reactor space and the mass of ruthenium most effectively. On the other hand, the optimal reactor should be very short for practical implementation. This is especially important for decentralised production units in which the reactors must fit, for example, in an overseas container. In this case, reactor lengths exceeding the height of the container can only be realised in minichannel reactor configurations, which may also operate with horizontally oriented flows.
It is clear that the energy consumption should be minimal. However, it must be noted that heating up of the aqueous sugar solutions to the reaction temperature of 115   ° C requires about 2000   kJ / mol , whereas the maximal energy consumption to pump the liquid through the column is about 12   kJ / mol . Therefore, appropriate heat management is seen as more important to design an efficient process. Furthermore, the absolute values of the specific energy consumption have to be considered. The highest obtained value of 12   kJ / mol is related to 3.3   Wh / mol . Taking even an end-consumer price of 0.28   Euro / kWh , this is equivalent to about 0.1   cent / mol , which is about 40000-times less than the actual price of galactitol being ca. 82   Euro / mol (purity: 99%) [151]. Within this view, the simultaneous production of arabitol is not even considered. In consequence, the mechanical energy consumption is seen as less important to identify the most suitable reactor configuration.
The results of Figure 25 clearly demonstrate that minichannel packings, namely minichannel wall, particle-packed, and foam-packed minichannel reactors outperform the traditional and miniaturised trickle-bed reactors in terms of space-time yields. Considering conditions for maximum productivity, replacement of a conventional trickle-bed by a minichannel reactor configuration will create about 5- to 10-times larger STYs. This means that the reactor volume shrinks to about one-fifth or one-tenth at the same productivity. Additionally, ruthenium is used at least twice as efficiently in these reactors than in the trickle-bed reactor configurations. However, for minichannel wall reactors and particle-packed minichannel reactors, lengths of about 6   m are needed instead of less than 1.4   m for the packed beds because of the comparatively high flow velocities.
Extremely short reactor lengths of less than 3   cm are predicted for the foam-packed minichannel reactor. This mainly results from the low liquid flow velocities of less than 1.7   cm / s and the superior mass transfer rates. The latter is the result of the extremely high solid surface area of about 6000   m 2 / m 3 and the large mass transfer coefficients. For example, simulations predict volumetric mass transfer coefficients of 6.0   s 1 and 360   s 1 for the hydrogen transfer between gas-liquid and liquid-solid phases. At the latter, transfer coefficients reach values of about 150.0   s 1 for the liquid compounds. This seems to be somewhat too optimistic. Larger overestimations are expected by using the correlation of Tourvieille et al. [27] because the equation was developed from the experimental data for overall hydrogen transfer rates, i.e., a combination of gas-liquid and liquid-solid transfer. Therefore, the obtained results have to be interpreted with care. Nevertheless, the impact of the very high liquid-solid transfer coefficients is radically suppressed by the lower hydrogen transfer from the gas into the liquid phase, as also experimentally observed by Sang et al. [113].
Miniaturised trickle beds use the reactor volume about two-fold more effectively than the conventional ones but provide similar mass-specific space-time yields. To further improve the performance of the pellets, an integration into the minichannel structures, which results in a particle-packed structure, seems to be a reasonable approach at the expense of a larger pressure drop. Considering conditions providing the shortest reactor length, i.e., flows with low flow velocities, the benefits of the minichannel reactor configurations mostly disappear because of the drastically slower mass transfer. The only exception is the foam minichannel reactor, which still shows an extraordinary performance.

4.2. Qualitative Parameters

Besides the discussed quantitative performance parameters, technical aspects of implementation have to be considered. This may be mainly related to hurdles of catalyst preparation and use, ease of operation, and reliability of the process scale-up. These issues are addressed in a qualitative fashion, as summarised in Table 3.
Concentrating on the catalyst, it is important how much effort is needed to produce the catalyst. For commercial catalysts such as particles and pellets, no additional work in research and development is needed to manufacture the catalysts. Such catalysts can be used in particle-packed minichannel or trickle-bed reactors. Larger efforts are needed if novel catalyst structures such as coated minichannel walls or foams are employed. In this case, procedures to uniformly coat the structures have to be investigated, which are mainly available only at the lab scale [119,152,153,154]. Besides the procurement, catalyst replacement has to be considered because coking and deactivation will cause activity losses in sugar hydrogenation processes, which may limit the catalyst lifetime [155]. However, it should be mentioned that deactivation may also be less significant after an initial period [39].
In the trickle-bed reactors, the catalyst particles can be easily unloaded by opening the bottom of the reactor. Afterwards, the fresh catalyst is introduced from the top of the reactor, making the catalyst replacement quite simple. A slightly larger effort is needed in the case of particle-packed minichannel reactors because the particles may become wedged, which makes unloading more elaborate. Furthermore, the particles have to be dumped into small channels and not into a large reactor tube, which complicates the catalyst loading. During loading, special attention is needed to ensure the same pressure drop in all channels to create a homogeneous flow distribution. Nevertheless, loading and unloading were successfully realised in the lab of the authors. In minichannel wall reactors, the active compound is a part of the channel wall. Therefore, the whole minichannel packing has to be replaced if the catalyst activity drops below a specific limit. This process is expected to be quite fast because the segments can be loaded like cartridges. However, special care is needed in the alignment of these segments.
Since no commercial data are available, the costs of minichannel and particle catalysts are rather speculative and will not be compared here. In foam-packed minichannel reactors, it is rather unclear if the foams can be replaced without removing the minichannel structure from the reactor or if the complete composite structure has to be replaced. It is expected that the first method will also be feasible only if very short reactor lengths are needed.
Focusing on the process, the risk of blocking, simplicity of scale-up, as well as experience in operation have to be respected. The robustness against blocking is of specific importance because biomass-based reactants are processed, which may contain solid scrubs, impurities, or unconverted large molecules from the upstream steps. Bed structures with straight and comparable large flow paths, such as present in minichannel reactors with active channels or integrated foam structures, will not obstruct the flow, which suppresses channel blockage. Similar behaviour is expected in conventional trickle beds due to the large interstitial void volumes. The situations will be different in mini trickle beds, which exhibit much smaller flow diameters in combination with a high number of flow reversals. This effect may be compensated by flow pulsations and higher flow velocities as present in particle-packed minichannel reactors.
The scale-up of multiphase reactors is always a crucial step, as discussed recently by Dudukovic and Mills [13] and Stitt et al. [156]. Hence, a fundamental understanding of fluid dynamics and transport processes is important to accomplish large scale-up factors [66]. The scale-up of packed beds is not straightforward because mass velocities dictate the hydrodynamics, and thus, mass transfer and space velocities that dictate residence time do not scale linearly [157]. As a result, incomplete wetting, flow channelling, etc., may occur in larger-sized packed-bed reactors. However, these effects will be less pronounced in miniaturised systems, which provide a higher liquid holdup and catalyst wetting [68]. In contrast, the scale-up in minichannel structures is rather an increase in the number of channels instead of the channel dimensions, which is generally expressed by scale-up by numbering-up or scale-up by parallelisation. Therefore, the process development is expected to be fast and straightforward. However, this approach requires a proper design of the gas-liquid-distributor [158]. Several feasible designs have been presented in the literature [159,160,161,162,163,164,165], but functionality has not been proven at the industrial scale.
The huge amount of trickle-bed reactor installations provides advantages of the knowledge and experience of running such reactors resulting in a high level of confidence in such a configuration. However, the minichannel configurations have practically not reached industrial applications, which involves a high risk of failure [166]. However, successful examples in gas-liquid processes and catalyst screening pave the way for the implementation of such reactor designs [60,157].

4.3. Case Study—Production Scenario

In order to evaluate the reactor configurations from a practical view, this subsection investigates an exemplary galactitol production scenario for a plant with an annual capacity of 5000   tonnes . This is roughly equivalent to a waste stream of a typical paper production plant and also represents a typical amount produced in fine chemical synthesis [2,167]. Considering an annual operation time of 8000   h , a molar galactitol stream of about 0.95   mol / s has to flow out of the reactor. It should be mentioned that also arabitol is produced if the starting feedstock is a mixture of galactose and arabinose obtained by hydrolysis of arabinogalactan. The formation of arabitol is not considered below, as the example is selected for the illustration purpose of the reactor comparison.
Table 4 lists the characteristic dimensions and parameters of the different reactor configurations. It should be mentioned that each reactor operates at flow conditions that provide maximal space-time yields (cf. Table 2).
As expected, particle- and foam-packed minichannel reactors are the smallest ones because of their high volumetric productivity. While the particle design requires a length of about 6.0   m to fully reach the desired conversion, the foam design necessitates a cross-sectional area of about 9000   cm 2 to handle the given product stream. This means that about 188,000 parallel channels have to be fed homogeneously with gas and liquid. A homogeneous distribution to so many channels seems to be very doubtful, especially because the pressure drop is very low favouring maldistribution. In this context, it must be emphasised that the simulated flow velocities were related to the available experimental studies. It is rather expected that the foam-packed reactors may also be operated at higher flow velocities, which will drastically reduce the cross-sectional area and the numbers of flow channels. A homogeneous feeding in 5000 to 8000 channels seems at least to be feasible [159]. However, inserting and perfectly aligning about 12 minichannel segments, which all have a length of 500   mm , are far away from the state-of-the-art. Taking into account the sketched technical challenges, simple trickle-bed reactor designs can be recommended for the case production scenario.
However, it should be noted that an unselective and not very exothermic hydrogenation process was studied in this work. The results are expected to differ significantly for consecutive reactions as they are usually very sensitive to variations in the residence time. For example, in oxidations, larger amounts of byproducts will be formed in trickle beds due to liquid backmixing, which is generally suppressed in the miniaturised reactor configurations. Additionally, highly exothermal reactions may cause larger radial and axial gradients in trickle beds of large diameters, which may cause hot-spot formation and runaways. Therefore, multitubular reactor configurations may be chosen to enhance the heat removal of packed beds.

5. Summary and Conclusions

This work presents an advanced reactor selection methodology that combines (a) elements of a knowledge-based expert system to reduce the number of feasible reactor designs to a reasonable number with (b) elaborated and automatised process simulations using pseudo-2D reactor models to identify reactor performance parameters at optimal operating conditions. This enables a fair comparison of the different reactor concepts. The workflow was exemplarily illustrated for a case scenario considering a multiphase hydrogenation step in a potential biorefinery, the Ru/C-catalysed hydrogenation of sugars to the corresponding sugar alcohols. For the case study of this work, the knowledge-based screening identified five potential fixed-bed reactor configurations, namely (a) conventional trickle-bed reactor (TBR), (b) miniaturised trickle-bed reactor (MTBR), (c) wall-coated minichannel reactor (MCWR), (d) minichannel reactor packed with catalytic particles (MCPR), and (e) minichannel reactor packed with a catalytic open-celled foam (MCFR).
In the process-simulation phase, a reasonable ruthenium loading for each of the pre-selected configurations was first identified, which ensures a high catalyst effectiveness factor. The computed loadings were in the range of 23 31   kg Ru / m WC 3 . Afterwards, process simulations predicted performance parameters such as the space-time yield with respect to the reactor volume or the catalyst mass, specific energy consumption as well as the required reactor length to achieve 99% conversion of the sugars. It should be mentioned that the complete range of flow conditions within the typically employed flow regime was covered in the simulations. Especially for the miniaturised reactor concepts, different feasible flow velocities within one regime provided a very large variation in the performance parameters, i.e., factors up to 43 for the space-time yield, above 400 for the energy consumption, and up to 10 for the required reactor length were obtained. This underlines that a fair comparison of different reactors necessitates the prior identification of favourable operating conditions.
Considering the case study, the results clearly demonstrate that minichannel packings, either with the deposited catalyst at the channel wall or with catalytic internals, outperform the traditional and miniaturised packed beds. Considering flow conditions for maximum productivity, the replacement of a conventional trickle-bed by a wall-coated foam-packed minichannel reactor will provoke an about 5- to 10-times larger space-time yield, although the energy spent per converted molecule is similar. Additionally, the efficiency of ruthenium use inside the reactor is at least two-fold compared to a conventional trickle-bed reactor. However, longer reactor lengths are required in the case of minichannel designs in comparison to random packed beds because higher flow velocities are needed to achieve stable Taylor flows. Miniaturised packed beds use the reactor volume more efficiently than the conventional ones but suffer from a large pressure drop. Particle-packed minichannel reactors also provide small reactor volumes and need small ruthenium loadings but inherently consume more energy for pushing the fluids through a comparatively long bed. However, such reactors can be quickly implemented because robust catalysts are commercially available, whereas more efforts are needed to provide catalytically active wall-coated or foam-packed beds.
The presented strategy represents a further step for simulation-assisted reactor selection. The main intention behind the simulation is the identification of the optimal operating conditions, which are not known a priori for emerging reactor concepts. A simulation platform was established that links process musts/wishes and feasible operational parameters with a library of reactor models that are implemented in Aspen Custom Modeler®. By further implementing general reaction schemes, other reaction processes can be analysed with a very small effort only via the MS-Excel interface. Especially, investigation of consecutive or parallel reactions would be very interesting because they involve selectivity issues which are affected additionally by the degree of backmixing inside the apparatus. It should be mentioned that further process constraints, such as the maximal temperature rise in non-adiabatic systems, may be additionally implemented into the process models, or a prior optimisation of the reactor geometry may be performed.
In evaluating the results, it must be emphasised that the prediction accuracy of the models depends on the quality of the mainly empiric correlations to describe hydrodynamic effects such as the flow regime, the phase holdup, backmixing, mass and heat transfer as well as the pressure drop. Because the correlations are usually obtained for specific geometries, and fluid pairs, extrapolation to other dimensions or use for other fluid pairs is always crucial and should be considered with care.
Taking up the idea of designing flow reactors, detailed studies with a manageable amount of standard reactors are suggested. Naturally, these standard reactors are not the optimal configuration for all processes. However, performance simulations for such reactors should be comparably precise because an adequate understanding of the occurring phenomena can be developed with a reasonable effort. By using such reaction modules, future production plants may be quickly and reliably planned and constructed by using solely tested and validated apparatuses. The sketched path towards modular plants is seen as a key driver to shorten process development time. This feature is especially important to realise multi-purpose plants allowing to produce highly individualised products.

Author Contributions

Conceptualisation, methodology and validation, S.H., D.Y.M. and T.S.; software, simulations, S.H., C.A.d.A.F. and J.W.; visualisations, S.H., resources, D.Y.M. and T.S.; writing—original draft preparation, S.H.; writing—review and editing, S.H., C.A.d.A.F., J.W., D.Y.M. and T.S. All authors have read and agreed to the published version of the manuscript.

Funding

This research was funded by the Johan Gadolin International Mobility Programme of the Process Chemistry Centre at Åbo Akademi.

Conflicts of Interest

The authors declare no conflict of interest.

Nomenclature

Latin letters
A [ m 2 ] Area
c [ mol   m 3 ] Concentration
c P [ J   kg 1   K 1 ] Isobaric heat capacity
d ,   D [ m ] Diameter
D a x [ m 2   s 1 ] Axial dispersion coefficient
D i [ m 2   s 1 ] Diffusion coefficient of component i
E A [ J   mol 1 ] Activation energy
F [ ] Factor
g [ m   s 2 ] Gravitational constant (9.81)
k [ m   s 1 ] Mass transfer coefficient
K [ m 3   mol 1 ] Adsorption and desorption quasi-equilibria
k j [ ( mol   m 3 ) 1 n s 1 ] Rate constant for reaction j with reaction order n
k [ ( mol   m 3 ) 1 n s 1 ] Pre-exponential factor for reaction with reaction order n
L [ m ] Length
m [ kg ] Mass
n [ mol ] Amount of substance
n [ ] Order of reaction
n ˙ , n p [ mol   s 1 ] Molar flow rate
p [ Pa ] Pressure
P [ W ] Power
r , R [ m ] Radial coordinate, radius
r [ mol   m 3   s 1 ] or
[ mol   kg 1   s 1 ]
Reaction rate per reaction volume or
per mass of catalyst/active compound
R [ J   mol 1   K 1 ] Ideal gas constant (8.3145)
S T Y [ mol   m 3   s 1 ] Space-time yield
t [ s ] Time
t [ m ] Thickness
T [ K ] Temperature
u [ m   s 1 ] Velocity
V [ m 3 ] Volume
V ˙ ,   V P [ m 3   s 1 ] Volumetric flow rate
X j [ ] Conversion of educt j ( = ( c j , i n c j , o u t ) c j , i n 1 )
x R u [ kg Ru   m R 3 ] Ruthenium loading per reactor volume
z [ m ] Axial coordinate of reactor
Greek symbols
β [ ] Volume inside reactor over volume in boundary layer
Δ H R [ J   mol 1 ] Reaction heat
Δ p [ Pa ] Pressure drop
ε [ ] Void fraction/phase holdup
η [ ] Catalyst effectiveness factor
λ [ W   m 1   K 1 ] Thermal conductivity
π [ ] Mathematical constant (3.14159…)
ρ kg   m 3 Density, loading
υ [ ] Stoichiometric coefficient
Subscripts and superscripts
A , A r a Arabinose
a c t Refers to catalyst activity
A O H , A r a O H Arabitol
a x Axial
C Cylinder
C h Channel
D Distance
d y n Dynamic
e f f Effective
e q Equivalent
e r r Error
G Gas or in the gas phase
G , G a l Galactose
G L Gas-liquid
G O H , G a l O H Galactitol
G S Gas-solid
h Hydraulic
i Index of reaction
i n At the reactor inlet
j Component j
L Liquid or in the liquid phase
L S Liquid-solid
m Related to mass of catalyst
m a x , M a x Maximal
M e Metal (referring to active metal species)
o u t At the reactor outlet
P Spherical particle
q Cross-sectional
R Reaction or reactor
s Superficial
S Solid or in the solid phase
S Slab
s t a t Static
S t S t Steady state
t o t Total
v Related to volume
W C Washcoat
Referring to saturation

References

  1. Walas, S.M. Chemical Process Equipment; Butterworth-Heinemann: Newton, MA, USA, 1990. [Google Scholar]
  2. Baerns, M.; Behr, A.; Brehm, A. Technische Chemie; Wiley-VCH Verlag GmbH: Weinheim, Germany, 2006; p. 733. [Google Scholar]
  3. Hessel, V.V. Novel Process Windows—Gate to Maximizing Process Intensification via Flow Chemistry. Chem. Eng. Technol. 2009, 32, 1655–1681. [Google Scholar] [CrossRef]
  4. Kockmann, N.; Gottsponer, M.; Zimmermann, B.; Roberge, D.M. Enabling Continuous-Flow Chemistry in Microstructured Devices for Pharmaceutical and Fine-Chemical Production. Chem. Eur. J. 2008, 14, 7470–7477. [Google Scholar] [CrossRef] [PubMed]
  5. Malet-Sanz, L.; Susanne, F. Continuous Flow Synthesis. A Pharma Perspective. J. Med. Chem. 2012, 55, 4062–4098. [Google Scholar] [CrossRef]
  6. Mills, P.L.; Quiram, D.J.; Ryley, J.F. Microreactor technology and process miniaturization for catalytic reactions—A perspective on recent developments and emerging technologies. Chem. Eng. Sci. 2007, 62, 6992–7010. [Google Scholar] [CrossRef]
  7. Proctor, L.; Hawkins, J.M. Continuous Processing in the Pharmaceutical Industry. In Green Chemistry in the Pharmaceutical Industry; Wiley: Hoboken, NJ, USA, 2010; pp. 221–242. [Google Scholar]
  8. Ehrfeld, W.; Hessel, V.; Löwe, H. Microreactors; Wiley-VCH: Weinheim, Germany, 2000. [Google Scholar]
  9. Hessel, V. Chemical Micro Process Engineering: Processing and Plants; Wiley-VCH: Weinheim, Germany, 2005. [Google Scholar]
  10. Doan, L.T.V.; Stavarek, P.; de Bellefon, C. A Method to Identify Best Available Technologies (BAT) for Hydrogenation Reactors in the Pharmaceutical Industry. J. Flow Chem. 2012, 2, 77–82. [Google Scholar] [CrossRef] [Green Version]
  11. Dudukovic, M. Reaction Engineering for Environmental Benign Processes; Lecture Notes; Washington State University: St. Louis, MO, USA, 2016. [Google Scholar]
  12. Krishna, R.; Sie, S.T. Strategies for multiphase reactor selection. Chem. Eng. Sci. 1994, 49, 4029–4065. [Google Scholar] [CrossRef]
  13. Duduković, M.; Mills, P. Scale-up and multiphase reaction engineering. Curr. Opin. Chem. Eng. 2015, 9, 49–58. [Google Scholar] [CrossRef]
  14. Jacobs, R.; Jansweijer, W. A knowledge-based system for reactor selection. Comput. Chem. Eng. 2000, 24, 1781–1801. [Google Scholar] [CrossRef]
  15. Salmi, T.; Mikkola, J.-P.; Wärnå, J. Bridging Chemical Reaction Engineering and Reactor Technology; Åbo Akademi University: Turku, Finland, 2009. [Google Scholar]
  16. Hartman, R.L.; McMullen, J.P.; Jensen, K.F. Deciding Whether to Go with the Flow: Evaluating the Merits of Flow Reactors for Synthesis. Angew. Chem. Int. Ed. 2011, 50, 7502–7519. [Google Scholar] [CrossRef] [PubMed]
  17. Khadilkar, M.; Wu, Y.; Al-Dahhan, M.; Duduković, M.; Colakyan, M. Comparison of trickle-bed and upflow reactor performance at high pressure: Model predictions and experimental observations. Chem. Eng. Sci. 1996, 51, 2139–2148. [Google Scholar] [CrossRef]
  18. Lange, R.; Hanika, J.; Stradiotto, D.; Hudgins, R.; Silveston, P. Investigations of periodically operated trickle-bed reactors. Chem. Eng. Sci. 1994, 49, 5615–5621. [Google Scholar] [CrossRef]
  19. Khadilkar, M.; Al-Dahhan, M.; Duduković, M. Parametric study of unsteady-state flow modulation in trickle-bed reactors. Chem. Eng. Sci. 1999, 54, 2585–2595. [Google Scholar] [CrossRef]
  20. Selinsek, M.; Bohrer, M.; Vankayala, B.K.; Haas-Santo, K.; Kraut, M.; Dittmeyer, R. Towards a new membrane micro reactor system for direct synthesis of hydrogen peroxide. Catal. Today 2016, 268, 85–94. [Google Scholar] [CrossRef]
  21. Pashkova, A.; Svajda, K.; Dittmeyer, R. Direct synthesis of hydrogen peroxide in a catalytic membrane contactor. Chem. Eng. J. 2008, 139, 165–171. [Google Scholar] [CrossRef]
  22. Kertalli, E.; D’Angelo, M.N.; Schouten, J.; Nijhuis, T. Design and optimization of a catalytic membrane reactor for the direct synthesis of propylene oxide. Chem. Eng. Sci. 2015, 138, 465–472. [Google Scholar] [CrossRef]
  23. Atta, A.; Roy, S.; Nigam, K. Prediction of pressure drop and liquid holdup in trickle bed reactor using relative permeability concept in CFD. Chem. Eng. Sci. 2007, 62, 5870–5879. [Google Scholar] [CrossRef]
  24. Davis, M.E.; Davis, R.J. Fundmentals of Chelmical Reaction Engineering; Chemical Engineering Series; McGraw-Hill: Boston, MA, USA, 2003. [Google Scholar]
  25. Levenspiel, O. Chemical Reaction Engineering, 3rd ed.; Wiley: New York, NY, USA, 1998; ISBN 978-0-471-25424-9. [Google Scholar]
  26. Haase, S.; Weiss, M.; Langsch, R.; Bauer, T.; Lange, R. Hydrodynamics and mass transfer in three-phase composite minichannel fixed-bed reactors. Chem. Eng. Sci. 2013, 94, 224–236. [Google Scholar] [CrossRef]
  27. Tourvieille, J.-N.; Philippe, R.; de Bellefon, C. Milli-channel with metal foams under an applied gas–liquid periodic flow: External mass transfer performance and pressure drop. Chem. Eng. J. 2015, 267, 332–346. [Google Scholar] [CrossRef]
  28. Iliuta, I.; Iliuta, M.C.; Thyrion, F.C. Gas-liquid mass transfer in trickle-bed reactors: Gas-side mass transfer. Chem. Eng. Technol. 1997, 20, 589–595. [Google Scholar] [CrossRef]
  29. Bulsari, A.B.; Saxén, B.; Saxén, H. A chemical reactor selection expert system created by training an artificial neural network. In Advances in Computing and Information, Proceedings of the ICCI ’91: International Conference on Computing and Information, Ottawa, ON, Canada, 27–29 May 1991; Dehne, F., Fiala, F., Koczkodaj, W.W., Eds.; Springer: Berlin/Heidelberg, Germany, 1991; pp. 645–656. [Google Scholar]
  30. Murzin, D.Y.; Simakova, I. Catalysis in biomass processing. Catal. Ind. 2011, 3, 218–249. [Google Scholar] [CrossRef]
  31. Mikkola, J.-P.; Sklavounos, E.; King, A.W.T.; Virtanen, P. The Biorefinery and Green Chemistry. In Ionic Liquids in the Biorefinery Concept: Challenges and Perspectives; Royal Society of Chemistry (RSC): London, UK, 2015; pp. P001–P006. [Google Scholar]
  32. Corma, A.; Iborra, S.; Velty, A. Chemical Routes for the Transformation of Biomass into Chemicals. Chem. Rev. 2007, 107, 2411–2502. [Google Scholar] [CrossRef] [PubMed]
  33. Murzin, D.Y.; Simakova, I.L. 7.21—Catalysis in Biomass Processing. In Comprehensive Inorganic Chemistry II, 2nd ed.; Poeppelmeier, J.R., Ed.; Elsevier: Amsterdam, The Netherlands, 2013; pp. 559–586. [Google Scholar]
  34. Alonso, D.M.; Bond, J.Q.; Dumesic, J.A. Catalytic conversion of biomass to biofuels. Green Chem. 2010, 12, 1493–1513. [Google Scholar] [CrossRef]
  35. Hörhammer, H. A Larch Biorefinery Producing Pulp and Lactic Acid. Ph.D. Thesis, Department of Forest Products Technology, Aalto University, Helsinki, Finland, 2014. [Google Scholar]
  36. Kusema, B.T.; Hilmann, G.; Mäki-Arvela, P.; Willför, S.; Holmbom, B.; Salmi, T.; Murzin, D.Y. Selective Hydrolysis of Arabinogalactan into Arabinose and Galactose Over Heterogeneous Catalysts. Catal. Lett. 2010, 141, 408–412. [Google Scholar] [CrossRef]
  37. Degelmann, H.; Kowalczyk, J.D.; Kunz, M.D.; Schüttenhelm, M.D. Verfahren zur Hydrierung von Zuckern; Südzucker AG: Manheim, Germany, 1997. [Google Scholar]
  38. Chao, J.C.; Huibers, D.T.A. Catalytic Hydrogenation of Glucose to Produce Sorbitol; Hydrocarbon Research, Inc.: Lawrenceville, NJ, USA, 1980. [Google Scholar]
  39. Aho, A.; Roggan, S.; Eränen, K.; Salmi, T.; Murzin, D.Y. Continuous hydrogenation of glucose with ruthenium on carbon nanotube catalysts. Catal. Sci. Technol. 2014, 5, 953–959. [Google Scholar] [CrossRef]
  40. Makkee, M.; Kieboom, A.P.; van Bekkum, H. Hydrogenation of d-fructose and d-fructose/d-glucose mixtures. Carbohydr. Res. 1985, 138, 225–236. [Google Scholar] [CrossRef]
  41. Crezee, E.; Hoffer, B.W.; Berger, R.J.; Makkee, M.; Kapteijn, F.; Moulijn, J.A. Three-phase hydrogenation of d-glucose over a carbon supported ruthenium catalyst—Mass transfer and kinetics. Appl. Catal. A Gen. 2003, 251, 1–17. [Google Scholar] [CrossRef]
  42. Wisnlak, J.; Simon, R. Hydrogenation of Glucose, Fructose, and Their Mixtures. Ind. Eng. Chem. Prod. Res. Dev. 1979, 18, 50–57. [Google Scholar] [CrossRef]
  43. Sifontes Herrera, V.A.; Oladele, O.; Kordás, K.; Eränen, K.; Mikkola, J.-P.; Murzin, D.Y.; Salmi, T. Sugar hydrogenation over a Ru/C catalyst. J. Chem. Technol. Biotechnol. 2011, 86, 658–668. [Google Scholar] [CrossRef]
  44. Dodgson, I. Trends and Opportunities with Modern Hydrogenation Catalysts. In Studies in Surface Science and Catalysis; Guisnet, M., Ed.; Elsevier: Amsterdam, The Netherlands, 1993; pp. 1–19. [Google Scholar]
  45. Eisenbeis, C.; Güttel, R.; Kunz, U.; Turek, T. Monolith loop reactor for hydrogenation of glucose. Catal. Today 2009, 147, S342–S346. [Google Scholar] [CrossRef]
  46. Aho, A.; Roggan, S.; Simakova, O.A.; Salmi, T.; Murzin, D.Y. Structure sensitivity in catalytic hydrogenation of glucose over ruthenium. Catal. Today 2015, 241, 195–199. [Google Scholar] [CrossRef]
  47. Simakova, I.; Demidova, Y.S.; Murzina, E.V.; Aho, A.; Murzin, D.Y. Structure Sensitivity in Catalytic Hydrogenation of Galactose and Arabinose over Ru/C Catalysts. Catal. Lett. 2016, 146, 1291–1299. [Google Scholar] [CrossRef]
  48. Sifontes Herrera, V.A.; Eränen, K.; Mikkola, J.P.; Wärnå, J.; Murzin, D.; Salmi, T. Sugar Hydrogenation in a Parallel Tube Reactor System Equipped with Ru/C Monoliths, in ICOSCAR-3; Ischia: Naples, Italy, 2009. [Google Scholar]
  49. Chen, B.; Dingerdissen, U.; Krauter, J.; Rotgerink, H.L.; Möbus, K.; Ostgard, D.; Panster, P.; Riermeier, T.; Seebald, S.; Tacke, T.; et al. New developments in hydrogenation catalysis particularly in synthesis of fine and intermediate chemicals. Appl. Catal. A Gen. 2005, 280, 17–46. [Google Scholar] [CrossRef]
  50. Sifontes Herrera, V.A. Hydrogenation of L-Arabinose, D-Galactose, D-Maltose and L-Rhamnose; Laboratory of Industrial Chemistry and Reaction Engineering, Åbo Akademi University: Turku, Finland, 2012. [Google Scholar]
  51. Hackl, F. Reaktionstechnische Modellierung eines Rieselbettreaktors und eines Monolithreaktors für die katalytische Hydrierung von Glucose zu Sorbitol. In Chemical Reaction Engineering and Process Plant; Technische Universität Dresden: Dresden, Germany, 2011. [Google Scholar]
  52. Le Bas, G. The Molecular Volumes of Liquid Chemical Compounds; Longmans, Green & Co.: New York, NY, USA, 1915. [Google Scholar]
  53. Matubayasi, N.; Nishiyama, A. Thermodynamic quantities of surface formation of aqueous electrolyte solutions VI. Comparison with typical nonelectrolytes, sucrose and glucose. J. Colloid Interface Sci. 2006, 298, 910–913. [Google Scholar] [CrossRef] [PubMed]
  54. Origlia, M.; Call, T.; Woolley, E. Apparent molar volumes and apparent molar heat capacities of aqueous d-glucose and d-galactose at temperatures from 278.15 K to 393.15 K and at the pressure 0.35 MPa. J. Chem. Thermodyn. 2000, 32, 847–856. [Google Scholar] [CrossRef]
  55. Partington, J. An Advanced Treatise on Physical Chemistry. In Fundamental Principals: The Properties of Gases; Longmans, Green & Co.: New York, NY, USA, 1949; Volume I. [Google Scholar]
  56. Poling, B.E.; Prausnitz, J.M.; O’Connel, J.P. Properties of Gases and Liquids, 5th ed.; McGraw-Hill: New York, NY, USA, 2001. [Google Scholar]
  57. Wilke, C.R.; Chang, P. Correlation of diffusion coefficients in dilute solutions. AIChE J. 1955, 1, 264–270. [Google Scholar] [CrossRef]
  58. Salmi, T.; Kuusisto, J.; Warna, J.; Mikkola, J.-P. Alternative sweeteners: La dolce vita. Chim. L’Industria 2006, 88, 90–96. [Google Scholar]
  59. Salmi, T.; Murzin, D.Y.; Warna, J.; Mikkola, J.-P.; Aumo, J.E.B.; Kuusisto, J.I. Modeling and optimization of complex three-phase hydrogenations and isomerizations under mass-transfer limitation and catalyst deactivation. In Catalysis of Organic Reactions; Schmidt, S.R., Ed.; CRC Press: Boca Raton, FL, USA, 2007; pp. 187–196. [Google Scholar]
  60. Gascon, J.; van Ommen, J.R.; Moulijn, J.A.; Kapteijn, F. Structuring catalyst and reactor—An inviting avenue to process intensification. Catal. Sci. Technol. 2014, 5, 807–817. [Google Scholar] [CrossRef]
  61. Heibel, A.K.; Lebens, P.J.M. Film Flow Monolithic Reactors. In Structured Catalysts and Reactors; Cybulski, A., Moulijn, J.A., Eds.; Taylor & Francis Group: London, UK, 2006. [Google Scholar]
  62. Mogalicherla, A.K.; Kunzru, D. Performance of monolithic reactors in film flow. Chem. Eng. Res. Des. 2010, 88, 1057–1066. [Google Scholar] [CrossRef]
  63. Kreutzer, M.T.; Du, P.; Heiszwolf, J.J.; Kapteijn, F.; Moulijn, J.A. Mass transfer characteristics of three-phase monolith reactors. Chem. Eng. Sci. 2001, 56, 6015–6023. [Google Scholar] [CrossRef]
  64. Kreutzer, M.; Kapteijn, F.; Moulijn, J.A.; Heiszwolf, J.J. Multiphase monolith reactors: Chemical reaction engineering of segmented flow in microchannels. Chem. Eng. Sci. 2005, 60, 5895–5916. [Google Scholar] [CrossRef]
  65. Al-Dahhan, M.; Larachi, F.; Dudukovic, M.P.; Laurent, A. High-Pressure Trickle-Bed Reactors: A Review. Ind. Eng. Chem. Res. 1997, 36, 3292–3314. [Google Scholar] [CrossRef]
  66. Dudukovic, P.M.; Larachi, F.; Mills, P.L. Multiphase reactors—Revisited. Chem. Eng. Sci. 1999, 54, 1975–1995. [Google Scholar] [CrossRef]
  67. Sifontes Herrera, V.A.; Saleem, F.; Kusema, B.T.; Eränen, K.; Salmi, T. Hydrogenation of l-Arabinose and d-Galactose Mixtures Over a Heterogeneous Ru/C Catalyst. Top. Catal. 2012, 55, 550–555. [Google Scholar] [CrossRef]
  68. Russo, V.; Kilpiö, T.; Di Serio, M.; Tesser, R.; Santacesaria, E.; Murzin, D.Y.; Salmi, T. Dynamic non-isothermal trickle bed reactor with both internal diffusion and heat conduction: Sugar hydrogenation as a case study. Chem. Eng. Res. Des. 2015, 102, 171–185. [Google Scholar] [CrossRef]
  69. Haase, S.; Bauer, T.; Hilpmann, G.; Lange, M.; Ayubi, M.-M.; Abiev, R. Simultaneous Detection of Hydrodynamics, Mass Transfer and Reaction Rates in a Three-Phase Microreactor. Theor. Found. Chem. Eng. 2020, 54, 48–63. [Google Scholar] [CrossRef]
  70. Larachi, F.; Laurent, A.; Midoux, N.; Wild, G. Experimental study of a trickle-bed reactor operating at high pressure: Two-phase pressure drop and liquid saturation. Chem. Eng. Sci. 1991, 46, 1233–1246. [Google Scholar] [CrossRef]
  71. Lange, R.; Schubert, M.; Bauer, T. Liquid Holdup in Trickle-Bed Reactors at Very Low Liquid Reynolds Numbers. Ind. Eng. Chem. Res. 2005, 44, 6504–6508. [Google Scholar] [CrossRef]
  72. Lappalainen, K.; Alopaeus, V.; Manninen, M.; Aittamaa, J. Improved Hydrodynamic Model for Wetting Efficiency, Pressure Drop, and Liquid Holdup in Trickle-Bed Reactors. Ind. Eng. Chem. Res. 2008, 47, 8436–8444. [Google Scholar] [CrossRef]
  73. Fu, M.-S.; Tan, C.-S. Liquid holdup and axial dispersion in trickle-bed reactors. Chem. Eng. Sci. 1996, 51, 5357–5361. [Google Scholar] [CrossRef]
  74. Hochman, J.M.; Effron, E. Two-Phase Cocurrent Downflow in Packed Beds. Ind. Eng. Chem. Fundam. 1969, 8, 63–71. [Google Scholar] [CrossRef]
  75. Dwivedi, P.N.; Upadhyay, S.N. Particle-Fluid Mass Transfer in Fixed and Fluidized Beds. Ind. Eng. Chem. Process Des. Dev. 1977, 16, 157–165. [Google Scholar] [CrossRef]
  76. Wild, G.; Larachi, F.; Charpentier, J.C. Heat and Mass Transfer in Gas-Liquid-Solid Fixed Bed Reactors. In Heat and Mass Transfer in Porous Media; Quintard, M.M.T., Ed.; Elsevier: Amsterdam, The Netherlands, 1992. [Google Scholar]
  77. Burghardt, A.; Bartelmus, G.; Jaroszyński, M.; Kołodziej, A. Hydrodynamics and mass transfer in a three-phase fixed-bed reactor with cocurrent gas—Liquid downflow. Chem. Eng. J. Biochem. Eng. J. 1995, 58, 83–99. [Google Scholar] [CrossRef]
  78. Haase, S. Minichannel Flow Reactors for Gas-Liquid-Solid Reactions. Ph.D. Thesis, TU Dresden, Dresden, Germany, 2013. [Google Scholar]
  79. Fries, D.M.; Trachsel, F.; von Rohr, P.R. Segmented gas–liquid flow characterization in rectangular microchannels. Int. J. Multiph. Flow 2008, 34, 1108–1118. [Google Scholar] [CrossRef]
  80. Kreutzer, M.T.; Kapteijn, F.; Moulijn, J.A.; Kleijn, C.R.; Heiszwolf, J.J. Inertial and interfacial effects on pressure drop of Taylor flow in capillaries. AIChE J. 2005, 51, 2428–2440. [Google Scholar] [CrossRef]
  81. Langsch, R.; Haase, S.; Lange, R. Hydrodynamik und Stofftransport in einem Perlschnurreaktor für Gas/Flüssig/Fest-Reaktionen. Chem. Ing. Tech. 2013, 85, 642–655. [Google Scholar] [CrossRef]
  82. Hipolito, A.; Rolland, M.; Boyer, C.; De Bellefon, C. Single Pellet String Reactor for Intensification of Catalyst Testing in Gas/Liquid/Solid Configuration. Oil Gas Sci. Technol. Rev. L’IFP 2010, 65, 689–701. [Google Scholar] [CrossRef] [Green Version]
  83. Larachi, F.; Grandjean, B. Excel Worksheet Simulators for Packed-Bed Reactors. Available online: http://www.gch.ulaval.ca/flarachi/pbrsimul/pbrsimul.html (accessed on 1 June 2015).
  84. Haase, S. Characterisation of gas-liquid two-phase flow in minichannels with co-flowing fluid injection inside the channel, part I: Unified mapping of flow regimes. Int. J. Multiph. Flow 2016, 87, 197–211. [Google Scholar] [CrossRef]
  85. Tourvieille, N.-J.; Philippe, R.; de Bellefon, C. Milli-channel with metal foams under an applied gas–liquid periodic flow: Flow patterns, residence time distribution and pulsing properties. Chem. Eng. Sci. 2015, 126, 406–426. [Google Scholar] [CrossRef]
  86. Tomašić, V. Application of the monoliths in DeNOx catalysis. Catal. Today 2007, 119, 106–113. [Google Scholar] [CrossRef]
  87. Tomašić, V.; Jović, F. State-of-the-art in the monolithic catalysts/reactors. Appl. Catal. A Gen. 2006, 311, 112–121. [Google Scholar] [CrossRef]
  88. Knon, H.; Brennscheidt, T.; Flörchinger, P. Keramische Ultradünnwandträger für zukünftige Emissionsanforderungen. MTZ 2001, 9, 662–666. [Google Scholar] [CrossRef]
  89. Brück, R.; Müller-Haas, K.; Breuer, J.; Webb, C. Advanced Performance of Metallic Converter Systems Demonstrated on a Production V8 Engine; SAE-Paper 2002-01-0347; Southwest Research Institute: San Antonio, TX, USA, 2002. [Google Scholar]
  90. Mogalicherla, A.K.; Kunzru, D. Effect of Gas and Liquid Superficial Velocities on the Performance of Monolithic Reactors. Ind. Eng. Chem. Res. 2010, 49, 1631–1641. [Google Scholar] [CrossRef]
  91. Haase, S. Characterisation of gas-liquid two-phase flow in minichannels with co-flowing fluid injection inside the channel, part II: Gas bubble and liquid slug lengths, film thickness, and void fraction within Taylor flow. Int. J. Multiph. Flow 2017, 88, 251–269. [Google Scholar] [CrossRef]
  92. Lakhwani, S.; Hughes, K.W. Evaluation of a Stronger Ultra Thin Wall Corning Substrate for Improved Performance; SAE Technical Paper Series; SAE International: Warrendale, PA, USA, 2005. [Google Scholar] [CrossRef]
  93. Kreutzer, M.T. Hydrodynamics of Taylor Flow in Capillaries and Monolith Reactors; Delft University Press: Delft, The Netherlands, 2003. [Google Scholar]
  94. Walsh, E.; Muzychka, Y.; Walsh, P.; Egan, V.; Punch, J. Pressure drop in two phase slug/bubble flows in mini scale capillaries. Int. J. Multiph. Flow 2009, 35, 879–884. [Google Scholar] [CrossRef]
  95. Gupta, R.; Fletcher, D.F.; Haynes, B. On the CFD modelling of Taylor flow in microchannels. Chem. Eng. Sci. 2009, 64, 2941–2950. [Google Scholar] [CrossRef]
  96. Ganapathy, H.; Al-Hajri, E.; Ohadi, M.M. Phase field modeling of Taylor flow in mini/microchannels, Part II: Hydrodynamics of Taylor flow. Chem. Eng. Sci. 2013, 94, 156–165. [Google Scholar] [CrossRef]
  97. Klaseboer, E.; Gupta, R.; Manica, R. An extended Bretherton model for long Taylor bubbles at moderate capillary numbers. Phys. Fluids 2014, 26, 032107. [Google Scholar] [CrossRef]
  98. Wang, X.; Yong, Y.; Yang, C.; Mao, Z.-S.; Li, D. Investigation on pressure drop characteristic and mass transfer performance of gas–liquid flow in micro-channels. Microfluid. Nanofluid. 2014, 16, 413–423. [Google Scholar] [CrossRef]
  99. Pangarkar, K.; Schildhauer, T.J.; Van Ommen, J.R.; Nijenhuis, J.; Kapteijn, F.; Moulijn, J.A. Structured Packings for Multiphase Catalytic Reactors. Ind. Eng. Chem. Res. 2008, 47, 3720–3751. [Google Scholar] [CrossRef]
  100. Vaitsis, E.; Chadwick, D.; Alpay, E. Slug Flow Hydrodynamics in the Presence of Catalyst Rods. Chem. Eng. Res. Des. 2004, 82, 653–658. [Google Scholar] [CrossRef]
  101. Strangio, V.A.; Dautzenberg, F.; Calis, H.P.A.; Gupta, A.V. Fixed Bed Catalytic Bed Reactor; ABB Lummus Global Inc.: Houston, TX, USA, 1999. [Google Scholar]
  102. Temkin, M.I.; Kulkova, N.V. Ideal-Displacement Laboratory Reactor. Kinetika Kataliz 1969, 10, 461–463. [Google Scholar]
  103. Bellos, G.; Galtier, P.; Papayannakos, N. Laboratory Reactor for Studying Gaseous and Liquid Phase Reactions; Corning Incooperated: Somerville, MA, USA, 2009. [Google Scholar]
  104. Kallinikos, L.E.; Papayannakos, N.G. Operation of a Miniscale String Bed Reactor in Spiral Form at Hydrotreatment Conditions. Ind. Eng. Chem. Res. 2007, 46, 5531–5535. [Google Scholar] [CrossRef]
  105. Satterfield, C.N.; Pelossof, A.A.; Sherwood, T.K. Mass transfer limitations in a trickle-bed reactor. AIChE J. 1969, 15, 226–234. [Google Scholar] [CrossRef]
  106. Kallinikos, L.E.; Papayannakos, N.G. Intensification of hydrodesulphurization process with a structured bed spiral mini-reactor. Chem. Eng. Process. Process Intensif. 2010, 49, 1025–1030. [Google Scholar] [CrossRef]
  107. Bauer, T.; Haase, S. Comparison of structured trickle-bed and monolithic reactors in Pd-catalyzed hydrogenation of alpha-methylstyrene. Chem. Eng. J. 2011, 169, 263–269. [Google Scholar] [CrossRef]
  108. Langsch, R.; Haase, S.; Lange, R. Hydrodynamics and Mass Transfer in a Pellet String Reactor for Gas-Liquid-Solid Reactions. Chem. Ing. Tech. 2013, 85, 642–655. [Google Scholar] [CrossRef]
  109. Haase, S.; Langsch, R.; Bauer, T.; Lange, R. Impact of Spherical Catalyst Particles on Gas-Liquid Flow Regimes in Minichannels with Square Cross Section. Chem. Ing. Tech. 2014, 86, 467–475. [Google Scholar] [CrossRef]
  110. Serres, M.; Zanota, M.-L.; Philippe, R.; Vidal, V. On the stability of Taylor bubbles inside a confined highly porous medium. Int. J. Multiph. Flow 2016, 85, 157–163. [Google Scholar] [CrossRef]
  111. Serres, M.; Schweich, D.; Vidal, V.; Philippe, R. Liquid residence time distribution of multiphase horizontal flow in packed bed milli-channel: Spherical beads versus open cell solid foams. Chem. Eng. Sci. 2018, 190, 149–163. [Google Scholar] [CrossRef]
  112. Nguyen, T.-S.; Swesi, Y.; Edouard, D.; Fongarland, P. Platelet Millireactor Filled with Open Cell Foam-Supported Pt Nanoparticles for a Three-Phase Catalytic System. Ind. Eng. Chem. Res. 2019, 58, 9352–9361. [Google Scholar] [CrossRef]
  113. Sang, L.; Tu, J.; Cheng, H.; Luo, G.; Zhang, J. Hydrodynamics and mass transfer of gas–liquid flow in micropacked bed reactors with metal foam packing. AIChE J. 2020, 66, 1–11. [Google Scholar] [CrossRef]
  114. Stemmet, C.; van der Schaaf, J.; Kuster, B.; Schouten, J. Solid Foam Packings for Multiphase Reactors. Chem. Eng. Res. Des. 2006, 84, 1134–1141. [Google Scholar] [CrossRef]
  115. Twigg, M.V.; Richardson, J.T. Fundamentals and Applications of Structured Ceramic Foam Catalysts. Ind. Eng. Chem. Res. 2007, 46, 4166–4177. [Google Scholar] [CrossRef]
  116. Mohammed, I.; Bauer, T.; Schubert, M.; Lange, R. Hydrodynamic multiplicity in a tubular reactor with solid foam packings. Chem. Eng. J. 2013, 231, 334–344. [Google Scholar] [CrossRef]
  117. Lali, F. A hydrodynamic study of cylindrical metal foam packings: Residence time distribution and two phase pressure drop. Chem. Eng. Process. Process Intensif. 2017, 115, 1–10. [Google Scholar] [CrossRef]
  118. Mohammed, I.; Bauer, T.; Schubert, M.; Lange, R. Gas–liquid distribution in tubular reactors with solid foam packings. Chem. Eng. Process. Process Intensif. 2015, 88, 10–18. [Google Scholar] [CrossRef]
  119. Lali, F.; Gärtner, S.; Haase, S.; Lange, R. Preparation Method for Ruthenium Catalysts Supported by Carbon-Coated Aluminum Foams. Chem. Eng. Technol. 2015, 38, 1353–1361. [Google Scholar] [CrossRef]
  120. Faridkhou, A.; Tourvieille, J.-N.; Larachi, F. Reactions, hydrodynamics and mass transfer in micro-packed beds—Overview and new mass transfer data. Chem. Eng. Process. Process Intensif. 2016, 110, 80–96. [Google Scholar] [CrossRef]
  121. Reschetilowski, W. (Ed.) Microreactors in Preparative Chemistry: Practical Aspects in Bioprocessing, Nanotechnology, Catalysis and More; Wiley-VCH Verlag GmbH: Weinheim, Germany, 2013. [Google Scholar]
  122. Ranade, V.V.; Chaudhari, R.V.; Gunjal, P.R. Chapter 6—Applications and Recent Developments. In Trickle Bed Reactors; Elsevier: Amsterdam, The Netherlands, 2011; pp. 211–256. [Google Scholar]
  123. Styring, P. Heterogeneous Catalysis in Chemical Micro Reactors. In Microfluidics: History, Theory and Applications; Zimmerman, W.B.J., Ed.; Springer: Berlin/Heidelberg, Germany, 2006. [Google Scholar]
  124. Kiwi-Minsker, L.; Renken, A. Microstructured reactors for catalytic reactions. Catal. Today 2005, 110, 2–14. [Google Scholar] [CrossRef] [Green Version]
  125. Jensen, K.F. Flow chemistry-Microreaction technology comes of age. AIChE J. 2017, 63, 858–869. [Google Scholar] [CrossRef]
  126. Dencic, I.; Hessel, V.; De Croon, M.H.J.M.; Meuldijk, J.; Van Der Doelen, C.W.J.; Koch, K. Recent Changes in Patenting Behavior in Microprocess Technology and its Possible Use for Gas-Liquid Reactions and the Oxidation of Glucose. ChemSusChem 2012, 5, 232–245. [Google Scholar] [CrossRef]
  127. Jensen, K.F. Microreaction engineering—Is small better? Chem. Eng. Sci. 2001, 56, 293–303. [Google Scholar] [CrossRef]
  128. Losey, M.W.; Schmidt, A.M.A.; Jensen, K.F. Microfabricated Multiphase Packed-Bed Reactors: Characterization of Mass Transfer and Reactions. Ind. Eng. Chem. Res. 2001, 40, 2555–2562. [Google Scholar] [CrossRef]
  129. Al-Rifai, N.; Galvanin, F.; Morad, M.; Cao, E.; Cattaneo, S.; Sankar, M.; Dua, V.; Hutchings, G.; Gavriilidis, A. Hydrodynamic effects on three phase micro-packed bed reactor performance—Gold–palladium catalysed benzyl alcohol oxidation. Chem. Eng. Sci. 2016, 149, 129–142. [Google Scholar] [CrossRef] [Green Version]
  130. Al-Rifai, N.; Cao, E.; Dua, V.; Gavriilidis, A. Microreaction technology aided catalytic process design. Curr. Opin. Chem. Eng. 2013, 2, 338–345. [Google Scholar] [CrossRef]
  131. Kockmann, N. Transport Phenomena in Micro Process Engineering; Springer: Berlin/Heidelberg, Germany, 2008. [Google Scholar]
  132. Van Herk, D.; Kreutzer, M.T.; Makkee, M.; Moulijn, J.A. Scaling down trickle bed reactors. Catal. Today 2005, 106, 227–232. [Google Scholar] [CrossRef]
  133. Sang, L.; Feng, X.; Tu, J.; Xie, B.; Luo, G.; Zhang, J. Investigation of external mass transfer in micropacked bed reactors. Chem. Eng. J. 2020, 393, 124793. [Google Scholar] [CrossRef]
  134. Moulijn, J.A.; Makkee, M.; Berger, R.J. Catalyst testing in multiphase micro-packed-bed reactors; Criterion for radial mass transport. Catal. Today 2016, 259, 354–359. [Google Scholar] [CrossRef]
  135. Hommes, A.; ter Horst, A.J.; Koeslag, M.; Heeres, H.J.; Yue, J. Experimental and modeling studies on the Ru/C catalyzed levulinic acid hydrogenation to γ-valerolactone in packed bed microreactors. Chem. Eng. J. 2020, 399, 125750. [Google Scholar] [CrossRef]
  136. Durante, D.; Kilpiö, T.; Suominen, P.; Herrera, V.S.; Wärnå, J.; Canu, P.; Salmi, T. Modeling and simulation of a small-scale trickle bed reactor for sugar hydrogenation. Comput. Chem. Eng. 2014, 66, 22–35. [Google Scholar] [CrossRef]
  137. Kilpiö, T.T. Mathematical Modeling of Laboratory Scale Three-Phase Fixed Bed Reactors; Laboratory of Industrial Chemistry and Reaction Engineering, Åbo Akademi University: Turku, Finland, 2013. [Google Scholar]
  138. Márquez Luzardo, N.M. Hydrodynamics of Multi-Phase Packed Bed Micro-Reactors; Laboratory of Industrial Chemistry and Reaction Engineering, Chemical Engineering Department, TU Delft: Delft, The Netherlands, 2010. [Google Scholar]
  139. Dudukovic, M.P.; Larachi, F.; Mills, P.L. Multiphase catalytic reactors: A perspective on current knowledge and future trends. Catal. Rev. 2002, 44, 123–246. [Google Scholar] [CrossRef]
  140. Iliuta, I.; Ortiz-Arroyo, A.; Larachi, F.; Grandjean, B.P.; Wild, G. Hydrodynamics and mass transfer in trickle-bed reactors: An overview. Chem. Eng. Sci. 1999, 54, 5329–5337. [Google Scholar] [CrossRef]
  141. Atta, A.; Roy, S.; Larachi, F.; Nigam, K.D.P. Cyclic operation of trickle bed reactors: A review. Chem. Eng. Sci. 2014, 115, 205–214. [Google Scholar] [CrossRef]
  142. Lange, R.; Schubert, M.; Dietrich, W.; Grünewald, M. Unsteady-state operation of trickle-bed reactors. Chem. Eng. Sci. 2004, 59, 5355–5361. [Google Scholar] [CrossRef]
  143. Lange, R. Modeling and Simulation of Unsteady-State-Operated Trickle-Flow Reactors; Wiley: Hoboken, NJ, USA, 2007; pp. 79–98. [Google Scholar]
  144. Schubert, M. Performance enhancement of trickle bed reactors. In Chemical Engineering and Plant Design; Technische Universitaet Dresden: Dresden, Germany, 2007. [Google Scholar]
  145. Iliuta, I.; Larachi, F. Hydrocarbon hydrodesulfurization in vertical, inclined and oscillating trickle beds—Hydrodynamics & reactor performance for offshore petroleum marine applications. Fuel 2016, 186, 35–49. [Google Scholar] [CrossRef]
  146. Dashliborun, M.A.; Larachi, F.; Schubert, M. Hydrodynamics of gas-liquid cocurrent upflow in oscillating packed beds for offshore marine applications. Chem. Eng. Sci. 2017, 170, 583–596. [Google Scholar] [CrossRef]
  147. Motamed Dashliborun, A.; Larachi, F.; Schubert, M. Offshore Floating Packed-Bed Reactors: Current Status, Key Challenges and Potential Solutions. In Proceedings of the AIChE—Annual Meeting, San Francisco, CA, USA, 13–18 November 2016; pp. 39–46. [Google Scholar]
  148. Härting, H.-U.; Berger, R.; Lange, R.; Larachi, F.; Schubert, M. Liquid backmixing in an inclined rotating tubular fixed bed reactor—Augmenting liquid residence time via flow regime adjustment. Chem. Eng. Process. Process Intensif. 2015, 94, 2–10. [Google Scholar] [CrossRef]
  149. Härting, H.-U.; Bieberle, A.; Lange, R.; Larachi, F.; Schubert, M. Hydrodynamics of co-current two-phase flow in an inclined rotating tubular fixed bed reactor—Wetting intermittency via periodic catalyst immersion. Chem. Eng. Sci. 2015, 128, 147–158. [Google Scholar] [CrossRef]
  150. Härting, H.-U.; Lange, R.; Larachi, F.; Schubert, M. A novel inclined rotating tubular fixed bed reactor concept for enhancement of reaction rates and adjustment of flow regimes. Chem. Eng. J. 2015, 281, 931–944. [Google Scholar] [CrossRef]
  151. Fischer Scientific Online Shop. Available online: https://www.fishersci.de/shop/ (accessed on 28 February 2021).
  152. Vergunst, T.; Kapteijn, F.; Moulijn, J. Preparation of carbon-coated monolithic supports. Carbon 2002, 40, 1891–1902. [Google Scholar] [CrossRef]
  153. Vergunst, T.; Linders, M.J.G.; Kapteijn, F.; Moulijn, J.A. Carbon-Based Monolithic Structures. Catal. Rev. 2001, 43, 291–314. [Google Scholar] [CrossRef]
  154. Böttge, D. Werkstoffliche und keramtechnologische Aspekte von funktionalen Beschichtungen auf hochporösen Keramikträgern. In Schriftenreihe Kompetenzen in Keramik; Fraunhofer Verlag: Stuttgart, Germany, 2013; p. 18. [Google Scholar]
  155. Ma, C. Regeneration of Catalyst for Hydrogenation of Sugars; Archer Daniels Midland Company: Minneapolis, MN, USA, 2015. [Google Scholar]
  156. Stitt, H.; Marigo, M.; Wilkinson, S.; Dixon, T. How Good is Your Model? “Just because the results are in colour, it doesn’t mean they are right”. Johns. Matthey Technol. Rev. 2015, 59, 74ff. [Google Scholar] [CrossRef]
  157. Stitt, E. Alternative multiphase reactors for fine chemicals: A world beyond stirred tanks? Chem. Eng. J. 2002, 90, 47–60. [Google Scholar] [CrossRef]
  158. Murzin, D.Y.; Salmi, T. Catalysis for Lignocellulosic Biomass Processing: Methodological Aspects. Catal. Lett. 2012, 142, 817–829. [Google Scholar] [CrossRef]
  159. Haase, S.; Bauer, T.; Lange, R. Numbering-up of mini- and microchannel contactors and reactors. Chim. Oggi Chem. Today 2015, 33, 26–30. [Google Scholar]
  160. Al-Rawashdeh, M.; Fluitsma, L.; Nijhuis, T.; Rebrov, E.; Hessel, V.; Schouten, J. Design criteria for a barrier-based gas–liquid flow distributor for parallel microchannels. Chem. Eng. J. 2011, 181–182, 549–556. [Google Scholar] [CrossRef]
  161. Al-Rawashdeh, M.; Yu, F.; Nijhuis, T.; Rebrov, E.; Hessel, V.; Schouten, J. Numbered-up gas–liquid micro/milli channels reactor with modular flow distributor. Chem. Eng. J. 2012, 207–208, 645–655. [Google Scholar] [CrossRef] [Green Version]
  162. De Mas, N.; Günther, A.; Kraus, T.; Schmidt, M.A.; Jensen, K.F. Scaled-out multilayer gas-liquid microreactor with integrated velocimetry sensors. Ind. Eng. Chem. Res. 2005, 44, 8997–9013. [Google Scholar] [CrossRef]
  163. Haverkamp, V.; Hessel, V.; Lowe, H.; Menges, G.; Warnier, M.J.F.; Rebrov, E.V.; De Croon, M.H.J.M.; Schouten, J.C.; Liauw, M.A. Hydrodynamics and Mixer-Induced Bubble Formation in Micro Bubble Columns with Single and Multiple-Channels. Chem. Eng. Technol. 2006, 29, 1015–1026. [Google Scholar] [CrossRef]
  164. Al-Rawashdeh, M.; Yue, F.; Patil, N.G.; Nijhuis, A.; Hessel, V.; Schouten, J.C.; Rebrov, E. Designing flow and temperature uniformities in parallel microchannels reactor. AIChE J. 2014, 60, 1941–1952. [Google Scholar] [CrossRef]
  165. Devatine, A.; Chaumat, H.; Guillaume, S.; Tchibouanga, B.T.; Martínez, F.D.; Julcour, C.; Billet, A.-M. Hydrodynamic study of a monolith-type reactor for intensification of gas-liquid applications. Chem. Eng. Process. Process Intensif. 2017, 122, 277–287. [Google Scholar] [CrossRef] [Green Version]
  166. Stitt, E.H. Multiphase Reactors. In Proceedings of the XIX International Conference on Chemical Reactors, Vienna, Austria, 5–9 September 2010. [Google Scholar]
  167. Dornack, C.; Dietz, W.; Schütt, F. Reststoffe der Papierindustrie: Ungenutzte Biomasse? Depotech: Leoben, Austria, 2014; p. 4. [Google Scholar]
Figure 1. Reaction scheme of arabinose and galactose hydrogenation.
Processes 09 01558 g001
Figure 2. Overview of parameters and constraints in the case scenario.
Processes 09 01558 g002
Figure 3. Value of the objective function versus (a) activation energy and pre-exponential factor of galactose hydrogenation, (b) activation energy and the pre-exponential factor of arabinose hydrogenation, (c) arabinose adsorption equilibrium constant and the pre-exponential factor of arabinose hydrogenation, and (d) both activation energies. Please note that the depicted pre-exponential factors refer to a reference temperature and, therefore, have different values.
Processes 09 01558 g003aProcesses 09 01558 g003b
Figure 4. Principles of optimisation studies for each reactor type.
Processes 09 01558 g004
Figure 5. (a) Axial concentration profiles of all components in the liquid phase within the minichannel wall reactor at u L , s = 0.68   m / s , u G , s = 0.23   m / s , x R u = 23.0   kg Ru / m WC 3 and (b) the effect of reduced ruthenium content on the conversion of both reactants for high throughput ( u G / L : u L , s = 0.68   m / s , u G , s = 0.32   m / s , L R = 5.93   m ) and low throughput ( u G / L : u L , s = 0.02   m / s , u G , s = 0.005   m / s , L R = 0.62   m ).
Processes 09 01558 g005
Figure 6. Volumetric space-time yield referring to galactitol in minichannel wall reactors operating in the Taylor flow mode of different gas and liquid superficial velocities.
Processes 09 01558 g006
Figure 7. Required reactor length of minichannel wall reactors operating in the Taylor flow mode of different gas and liquid superficial velocities to achieve 99% conversion of the sugars.
Processes 09 01558 g007
Figure 8. Specific energy consumption of minichannel wall reactors operating in the Taylor flow mode of different gas and liquid superficial velocities.
Processes 09 01558 g008
Figure 9. (a) Axial concentration profiles of all components in the liquid phase within the particle-packed minichannel reactor at u L , s = 1.46   m / s , u G , s = 0.22   m / s , x R u = 26.0   kg Ru / m WC 3 and (b) effect of reduced ruthenium content on the conversion of both reactants for high throughput ( u G / L : u L , s = 1.46   m / s , u G , s = 0.22   m / s , L R = 11.6   m ) and low throughput ( u G / L : u L , s = 0.002   m / s , u G , s = 0.004   m / s , L R = 2.49   m ).
Processes 09 01558 g009
Figure 10. Volumetric space-time yield referring to galactitol in particle-packed minichannel reactors operating at different gas and liquid superficial velocities.
Processes 09 01558 g010
Figure 11. Required reactor length of particle-packed minichannel reactors operating at different gas and liquid superficial velocities.
Processes 09 01558 g011
Figure 12. Specific energy consumption of particle-packed minichannel reactors operating at different gas and liquid superficial velocities.
Processes 09 01558 g012
Figure 13. (a) Axial concentration profiles of all components in the liquid phase within the foam-packed minichannel reactor at u L , s = 0.017   m / s , u G , s = 0.17   m / s , x R u = 30.5   kg Ru / m WC 3 and (b) effect of reduced ruthenium content on the conversion of both reactants for high throughput ( u G / L : u L , s = 0.017   m / s , u G , s = 0.17   m / s , L R = 0.063   m ) and low throughput ( u G / L : u L , s = 0.001   m / s , u G , s = 0.008   m / s , L R = 0.008   m ).
Processes 09 01558 g013
Figure 14. Volumetric space-time yield referring to galactitol in foam-packed minichannel reactors operating at different gas and liquid superficial velocities.
Processes 09 01558 g014
Figure 15. Required reactor length of foam-packed minichannel reactors operating at different gas and liquid superficial velocities.
Processes 09 01558 g015
Figure 16. Specific energy consumption of foam-packed minichannel reactors operating at different gas and liquid superficial velocities.
Processes 09 01558 g016
Figure 17. (a) Axial concentration profiles of all components in the liquid phase within the mini trickle-bed reactor at u L , s = 0.03   m / s , u G , s = 0.30   m / s , x R u = 27.5   kg Ru / m WC 3 and (b) effect of reduced ruthenium content on the conversion of both reactants for high throughput ( u G / L : u L , s = 0.03   m / s , u G , s = 0.30   m / s , L R = 0.34   m ) and low throughput ( u G / L : u L , s = 0.001   m / s , u G , s = 0.01   m / s , L R = 0.53   m ).
Processes 09 01558 g017
Figure 18. Volumetric space-time yield referring to galactitol in mini trickle-bed reactors operating at different gas and liquid superficial velocities.
Processes 09 01558 g018
Figure 19. Required reactor length of mini trickle-bed reactors operating at different gas and liquid superficial velocities.
Processes 09 01558 g019
Figure 20. Specific energy consumption of mini trickle-bed reactors operating at different gas and liquid superficial velocities.
Processes 09 01558 g020
Figure 21. (a) Axial concentration profiles of all components in the liquid phase within the trickle-bed reactor at u L , s = 0.03   m / s , u G , s = 0.125   m / s , x R u = 21.5   kg Ru / m WC 3 and (b) effect of reduced ruthenium content on the conversion of both reactants for high throughput ( u G / L : u L , s = 0.03   m / s , u G , s = 0.125   m / s , L R = 1.29   m ) and low throughput ( u G / L : u L , s = 0.001   m / s , u G , s = 0.01   m / s , L R = 1.74   m ).
Processes 09 01558 g021
Figure 22. Volumetric space-time yield referring to galactitol in trickle-bed reactors operating at different gas and liquid superficial velocities.
Processes 09 01558 g022
Figure 23. Required reactor length of trickle-bed reactors operating at different gas and liquid superficial velocities.
Processes 09 01558 g023
Figure 24. Specific energy consumption of trickle-bed reactors operating at different gas and liquid superficial velocities.
Processes 09 01558 g024
Figure 25. Performance parameters of the studied minichannel reactors: Processes 09 01558 i001 minichannel wall reactor, Processes 09 01558 i002 minichannel reactor packed with particles, Processes 09 01558 i003 minichannel reactor with foam packing, and trickle-bed reactors: Processes 09 01558 i004 conventional and Processes 09 01558 i005 
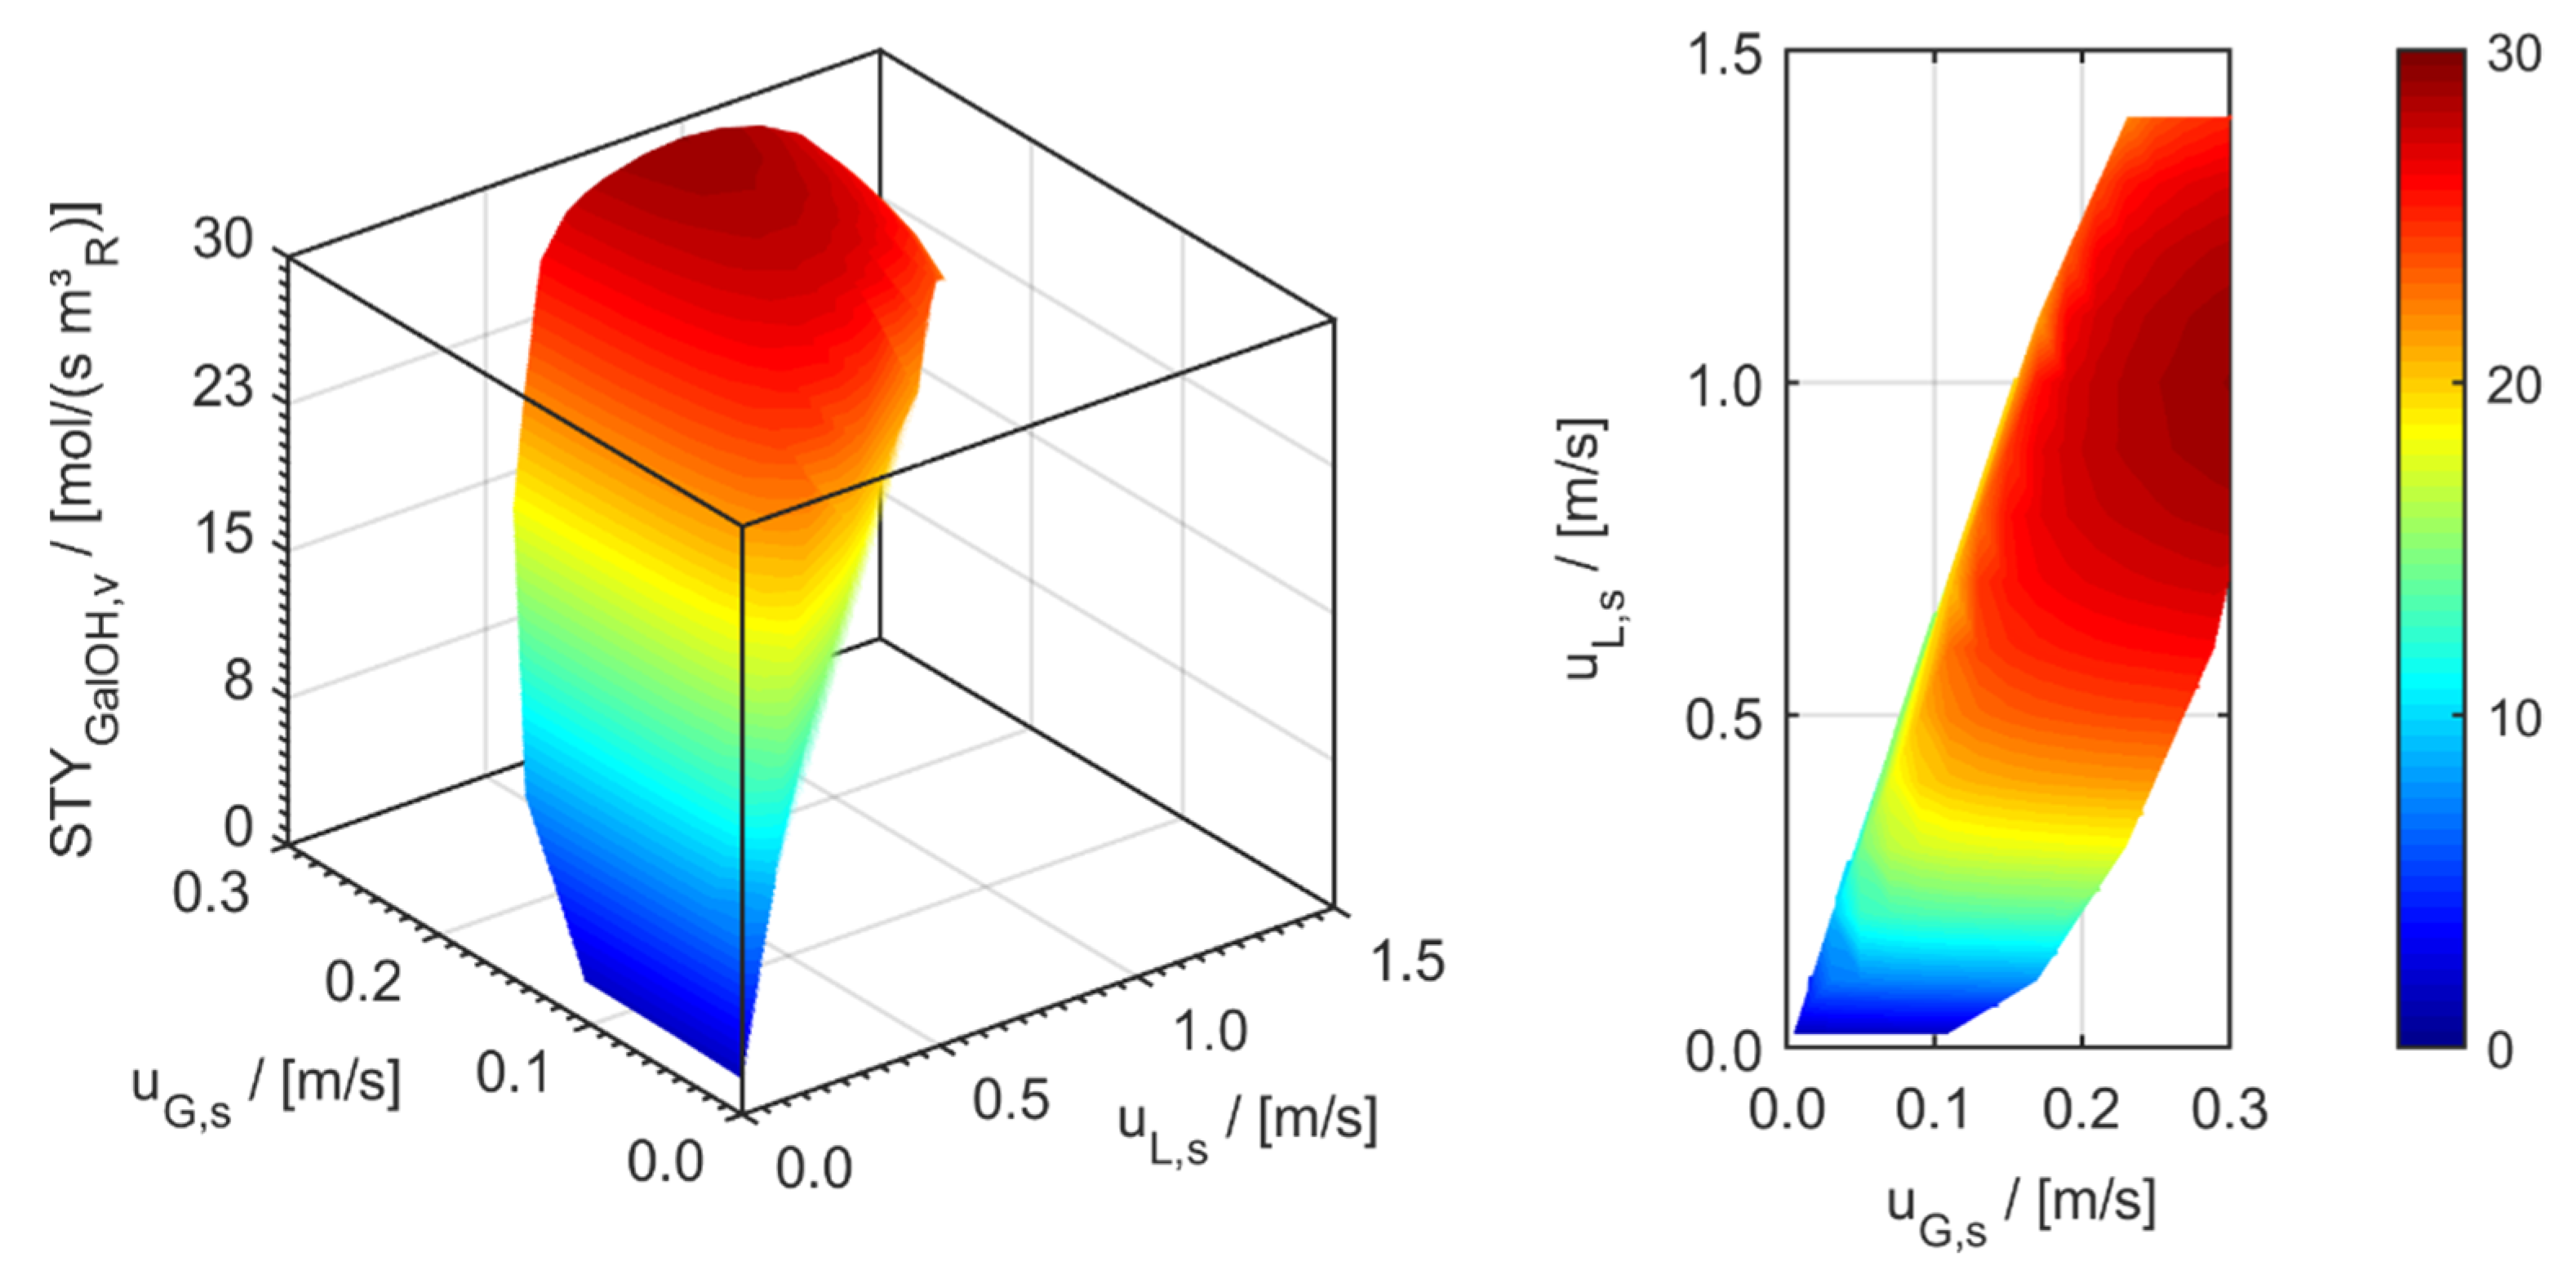
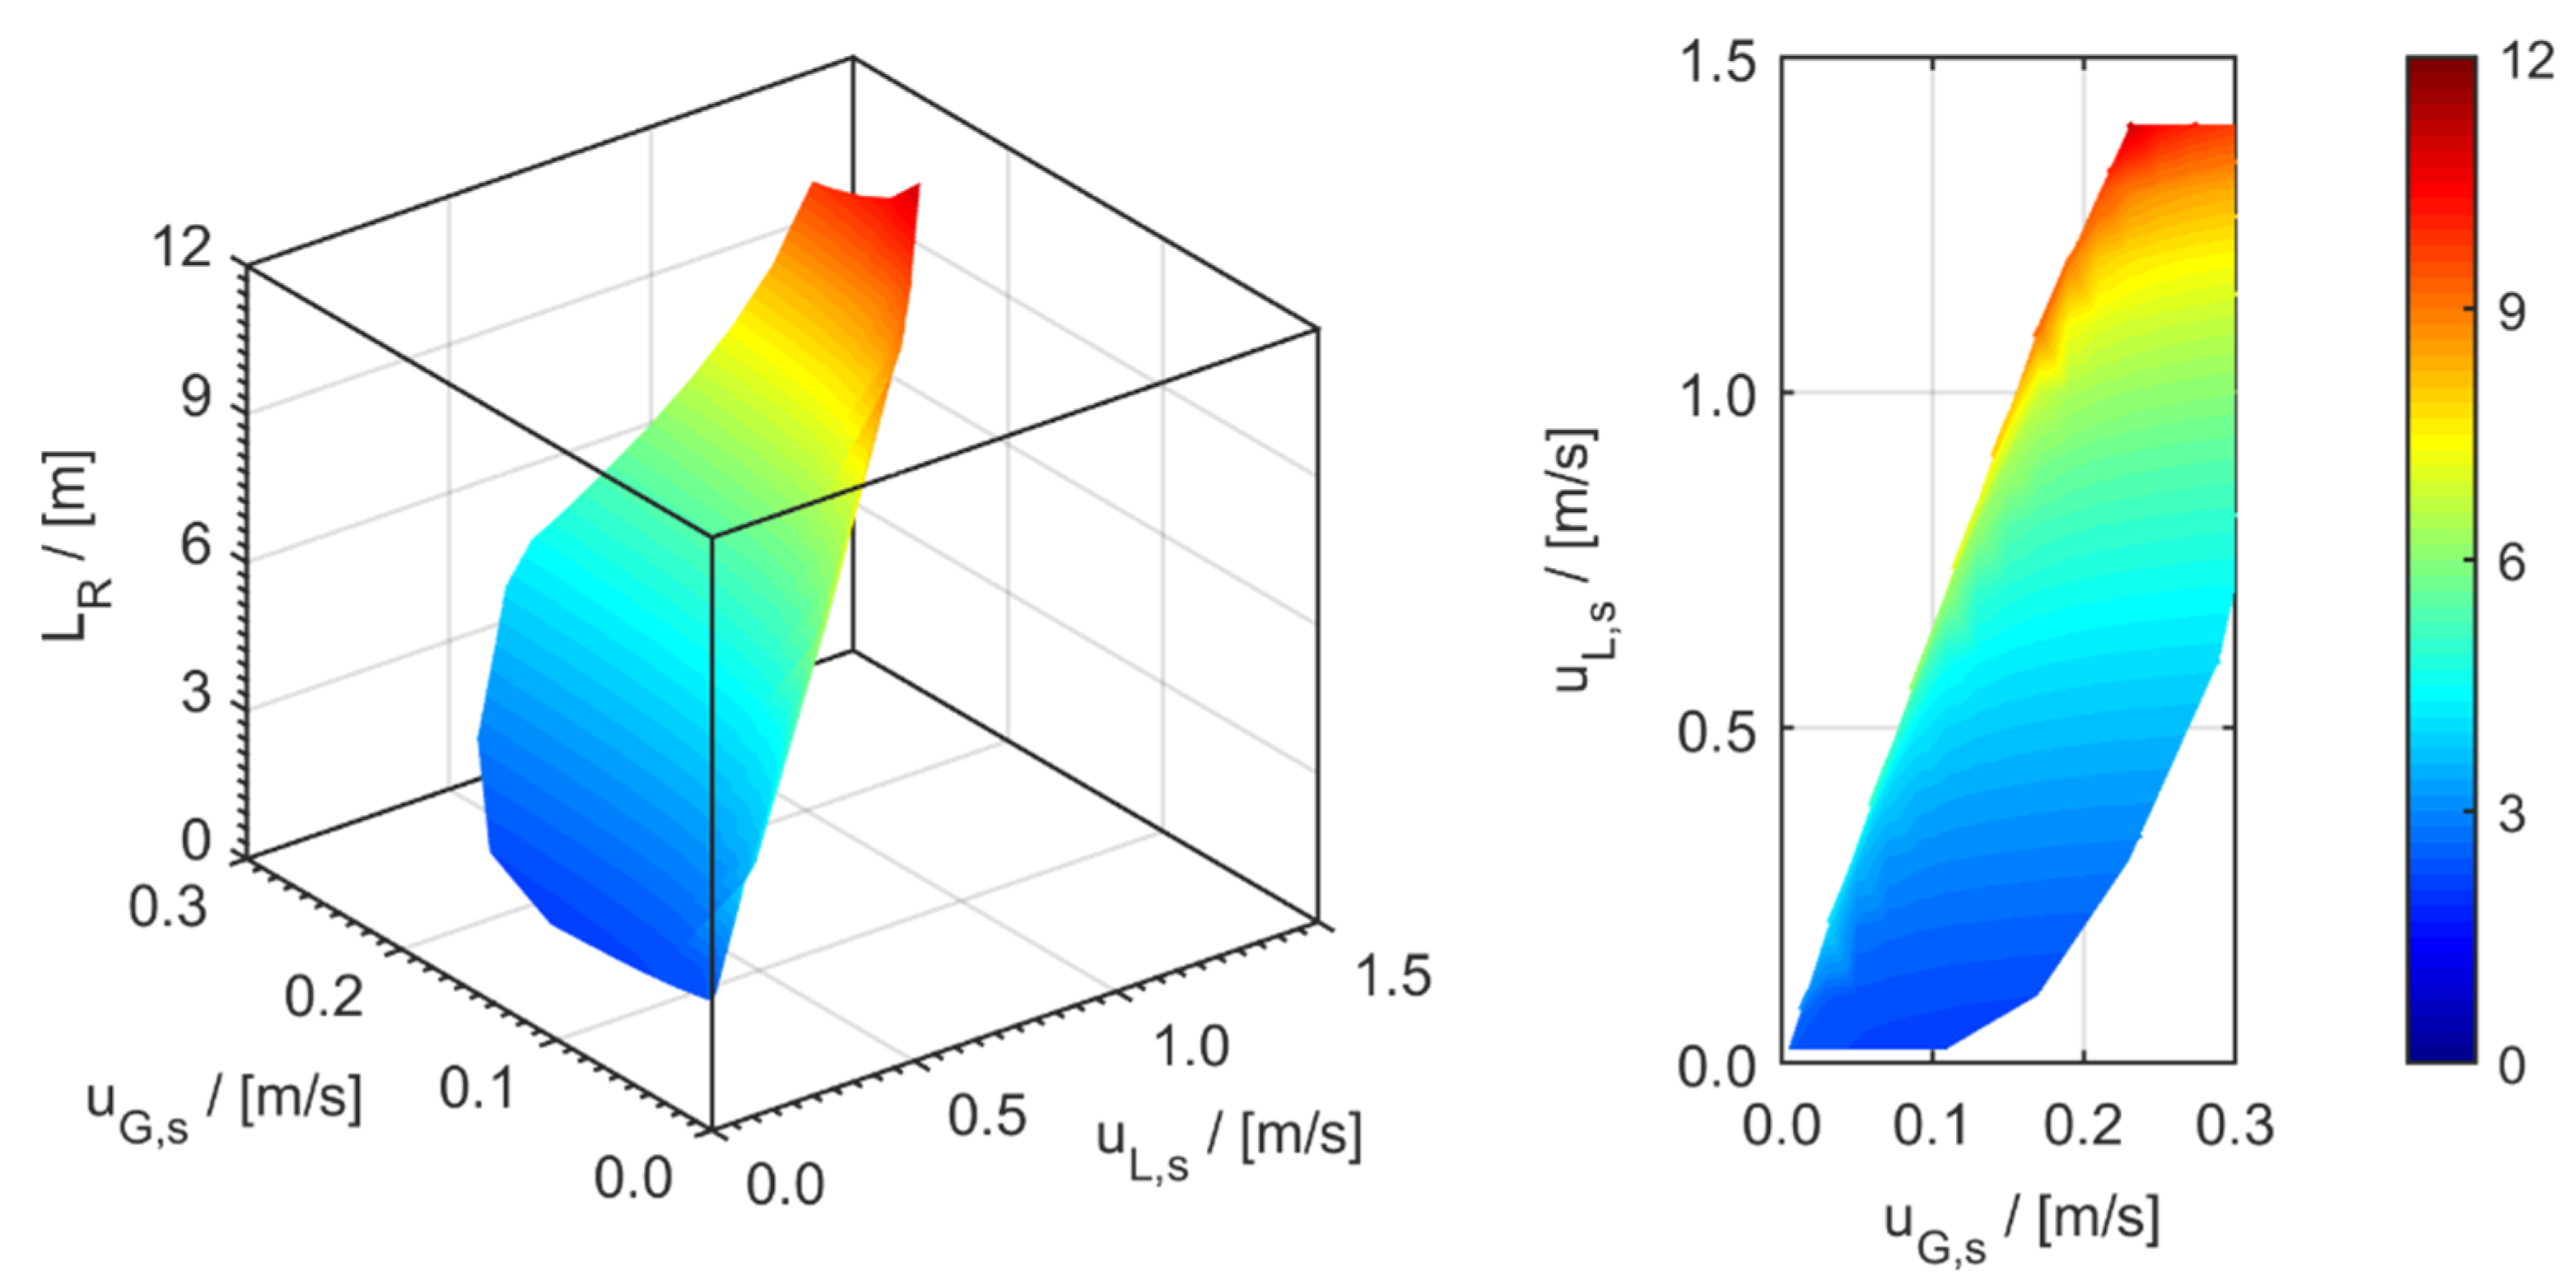
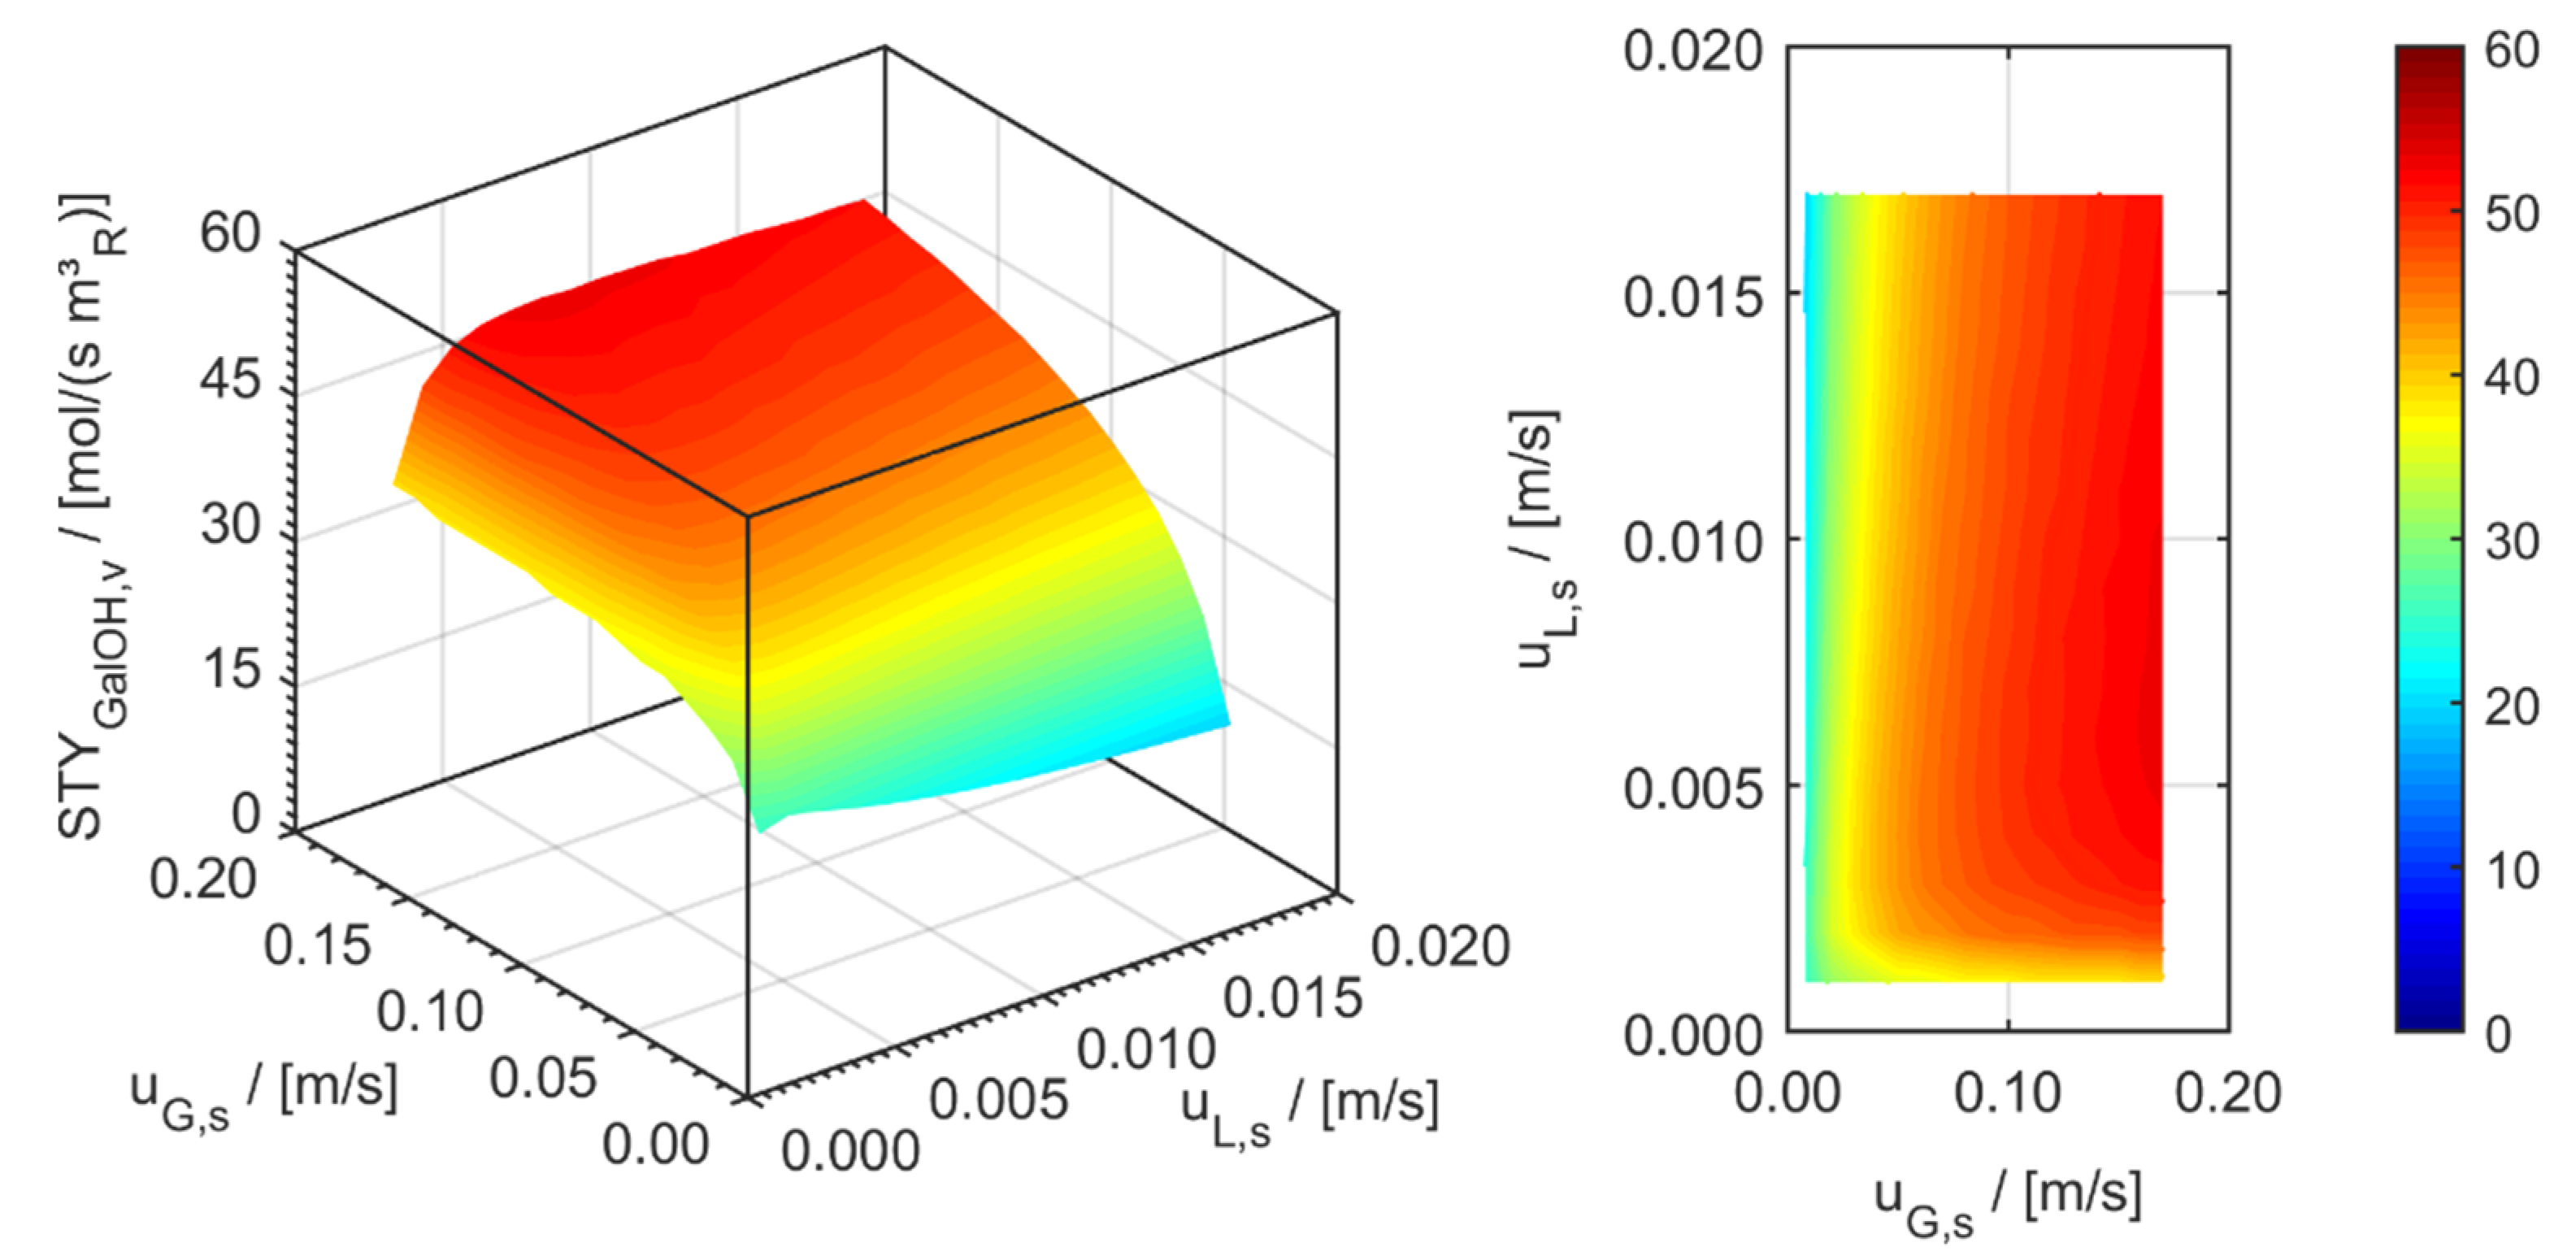
miniaturised at flow conditions creating (a) maximal space-time yields, (b) minimal reactor lengths, and (c) minimal specific energy consumptions in the adiabatic hydrogenation of arabinose/galactose mixtures (pin = 6 MPa, Tin = 115 °C).
Processes 09 01558 g025
Table 1. Kinetic parameters of the rate expressions to describe the 41 experimental concentration-time plots for single sugar hydrogenation [43] as well as sugar mixture hydrogenation [67].
ParameterValueRelative Error (%)
k , A 5.72   m 6 / ( s   mol   g Ru ) 1.8
E A , A 48.3   kJ / ( mol   K ) 1.5
k , G 13.9   m 6 / ( s   mol   g Ru ) 3.0
E A , G 53.2   kJ / ( mol   K ) 3.5
K A 1.64 × 10 3   m 3 / mol 3.0
With k i = k i , exp ( E A , i R T ) .
Table 2. Comparison of the 5 investigated reactor configurations based on quantitative criteria derived from the process simulations.
Reactor 1Flow Condition
for
S T Y G a l O H , v
( m o l / ( s   m R 3 ) )
S T Y G a l O H , m
( m o l / ( s   k g R u ) )
L R
( m )
P / n ˙ G a l O H
( k J / m o l )  
MCWRMax. S T Y 20.5 10.5 5.79 0.54
Min. L R 5.39 2.78 0.65 2.4 × 10 3
Min. P 7.08 3.65 0.98 1.2 × 10 3
Overall Min./Max. 20.5 10.5 0.65 1.2 × 10 3
MCPRMax. S T Y 29.2 11.5 5.98 11.7
Min. L R 1.65 0.65 2.11 0.44
Min. P 1.39 0.55 2.52 0.12
Overall Min./Max. 29.2 11.5 2.52 0.12
MCFRMax. S T Y 52.96.96 2.4 × 10 2 3.3 × 10 3
Min. L R 38.95.11 5.4 × 10 3 3.1 × 10 4
Min. P 25.13.29 8.4 × 10 3 1.6 × 10 5
Overall Min./Max.52.96.96 5.4 × 10 3 1.6 × 10 5
MTBRMax. S T Y 17.33.110.373.68
Min. L R 7.731.380.332.35
Min. P 0.400.070.530.28
Overall Min./Max.17.33.110.330.28
TBRMax. S T Y 4.653.641.370.15
Min. L R 2.582.020.980.15
Min. P 1.631.281.300.14
Overall Min./Max.4.653.640.980.14
1 MCWR—minichannel wall reactor, MCPR—minichannel reactor with particles, MCFR—minichannel reactor with foam packing, MTBR—mini trickle-bed reactor, TBR—trickle-bed reactor.
Table 3. Comparison of the 5 investigated reactor configurations based on qualitative criteria.
CriteriaParameterMCWRMCPRMCFRTBRMTBR
Catalyst 1PreparationLab-scaleIndustrialLab-scaleIndustrialIndustrial
ReplacementModerate (exchange packing)Moderate (exchange particles)Moderate (exchange packing)SimpleSimple
Process 2Blocking riskSmallMediumSmallSmallHigh
ExperienceLab-scaleLab-scaleLab-scaleIndustrialIndustrial
MCWR—minichannel wall reactor, MCPR—minichannel reactor packed with particles, MCFR—minichannel reactor with foam packing, MTBR—mini trickle-bed reactor, TBR—trickle-bed reactor; 1 preparation of Ru/C catalysts, 2 general evaluations not specific for sugar hydrogenation.
Table 4. Characteristic parameters of the different reactor configurations for the case production scenario of 5000 tonnes/year galactitol (reactors operate at maximal space-time yield).
Reactor S T Y G , v
( m o l / ( s   m R 3 ) )
V R
( L )
L R
( m )
D R
( c m )
N o .   o f   C h a n n e l s
( )
P
( M W h / a )
MCWR20.5475.812.980504.1
MCPR29.233610.6546089.3
MCFR52.9180.02108188,0000.03
MTBR17.3550.3744-28.1
TBR 4.652051.3744-1.1
MCWR—Minichannel wall reactor, MCPR—Minichannel reactor with particles, MCFR—Minichannel reactor with foam packing, MTBR—Mini Trickle-bed reactor, TBR—Trickle-bed reactor.
Publisher’s Note: MDPI stays neutral with regard to jurisdictional claims in published maps and institutional affiliations.

