Article

Implications of Soil Potentially Toxic Elements Contamination, Distribution and Health Risk at Hunan’s Xikuangshan Mine

1
College of Agriculture and Biotechnology, Hunan University of Humanities, Science and Technology, Loudi 417000, China
2
Academy of Biology and Biotechnology, Southern Federal University, Rostov-on-Don 344090, Russia
*
Author to whom correspondence should be addressed.
Processes 2021, 9(9), 1532; https://doi.org/10.3390/pr9091532
Submission received: 25 July 2021 / Revised: 25 August 2021 / Accepted: 25 August 2021 / Published: 28 August 2021
(This article belongs to the Section Environmental and Green Processes)

Abstract

:
A field survey was conducted to determine the pollution grade, sources, potential ecological risk, and health risk of soil potentially toxic elements (PTEs) in Xikuangshan Mine (XKS), the largest antimony (Sb) deposit in the world. A total of 106 topsoil samples were collected from 6 sites in XKS to measure the concentrations of PTEs Cr, Zn, Cd, Pb, As, Hg, and Sb. The results show that the average concentrations of these elements at all six sites were generally greater than their corresponding background values in Hunan province, especially Sb, Hg, and As. Correlation and principal component analyses suggested that Cd, Zn, Pb, Hg, and Sb were primarily released from mining and other industrial and human activities, while Cr and As were mainly impacted by the parent material from pedogenesis. A risk index analysis showed that, overall, sites were at very high ecological risk, and Sb is the highest ecological risk factor, followed by Cd and Hg. According to health risk assessment, oral ingestion is the main non-carcinogenic and carcinogenic risk exposure route. The higher potentially non-carcinogenic and carcinogenic risks happen to the local children who live in the vicinity of mining area. It revealed that the mining and smelting processes of XKS have negatively influenced the local people, therefore, we should pay increasing attention to this practical issue and take effective measures to protect the ecology of XKS.

1. Introduction

Potentially Toxic Elements (PTEs) are considered as toxic and persistent pollutants in soil which remain in local ecosystems for a long time and pose a negative threat to human health [1,2]. When PTEs in soil are transformed from solid to ionic form and methylated, they will accumulate in organisms, threatening the safety of animals and humans through the food chain [3].
Xikuangshan Mine (XKS) is well known as the World Antimony Capital and has been developed into the largest industrial and population centre in Hunan province over the past hundreds of years, especially the 21st century [4]. Approximately 3.20 billion cubic meters of Sb-containing exhaust gas has been dispersed into the atmosphere in recent years [5]. The soil Sb contents near XKS ranged from 100 to 5045 mg kg−1 [6]. As a consequence, the soil in the XKS has been extensively contaminated with high concentrations of Sb and other associated metals due to the rapid expansion of the mining industry and urbanization [7]. Sb and its compounds are listed as priority pollutants by the U.S. Environmental Protection Agency (USEPA). High levels of toxic metals may pose health risks to humans.
Due to historical reasons, the century-old massive mining operations in the XKS area were directly discharged without treatment and waste residues were deposited at will, which led to serious damages to soil ecology such as vegetation damage and soil erosion in the mining area [8]. Mining and smelting waste from the tailings are the main sources of PTEs pollution due to the transportation of mine tailings and acid mine drainage into ecosystems [9,10]. A majority of the investigated research about XKS focuses on Sb and As contamination of water, sediment, and crops and estimates the contamination generation by the mining and smelting waste water, indicating that mining activities at the XKS mine have disturbed the natural equilibrium [11,12,13]. Processing wastes in the Sb beneficiation steps at the XKS, contributing severe contamination in localized soil, then dispersing into the air and water and leading to migration in the food chain [14]. The related researchers have studied the distribution characteristics and ecological risk of Sb, As, Pb, and Cd in the smelting area, the road nearby ore, the mining area, and the ore tailing area samples of XKS, which indicate that the antimony mining area was seriously polluted [15]. Sb and As exhibited significant mobility in the soil profiles, showing a capacity of downward migration [16]. When an excessive amount of PTEs enter the human body, Cr, Zn, Cd, Pb, As, Hg, and Sb have chronic toxicity and carcinogenicity to human and environmental organisms to some extent [17,18]. However, there is a lack of studies on the health risk of PETs for adults and children who lived in nearby and severely contaminated areas such as mining and tailing areas. Based on these, a more detailed assessment of Cr, Zn, Cd, Pb, As, Hg, and Sb in the wider region of XKS is required. Moreover, it is of practical significance to investigate the human health risk posed by the PTEs of soils in the XKS area.
In the present study, we are aiming to (i) determine the concentrations of chromium (Cr), zinc (Zn), cadmium (Cd), lead (Pb), arsenic (As), mercury (Hg), and antimony (Sb) in the soils of XKS; (ii) investigate the possible sources and spatial distributions in sample sites of these seven metals; and (iii) evaluate the health risks for people living in the XKS area due to the dietary intake of PTEs via oral ingestion, dermal absorption, and respiratory inhalation. This research could contribute to upgrading the evaluation criteria of soil PTEs pollution and draw attention to both the safety and quality of soil in the XKS region.

2. Materials and Methods

2.1. XKS Area

XKS mine covers 70 km2 and is located in Loudi city, the central part of Hunan Province, China. It lies between 27°30′49″–27°50′38″ S latitude and 111.18′57″–111.36′40″ E longitude. Since the Qing dynasty (1897 AD), the mining and smelting of the XKS have continued for more than a century. XKS Sb mine has two parts: the south mine and the north mine. The antimony deposit consists of the south and north mines, with rich deposits of Hg, Zn, Pb, As, Sb, and coal. The main ore and most abundant mineral is stibnite (Sb2S3) [19].

2.2. Soil Sampling and Pre-Treatment

As shown in Figure 1, the entire XKS antimony mining area was divided into six regions, including Yanjingtang Reservoir (YJT), Shizishan Antimony Company (SZS), Lengshuijiang Senyi Antimony Industry (SYA), northern mine of the Twinkling Star Antimony Company (SXN), southern mine of the Twinkling Star Antimony Company (SXS), and Longwangchi (LWC). YJT is located in Zhushan Village, near the water conservation zone and far away from the mining factory. SZS and SYA are the two main antimony factories in XKS. SZS is located in Huangguang village, less than 1 km from the open-pit mining of Shizishan Co. SYA is located in Quanqiu village, about 0.5 km from the tailing area. SXN and SXS are the two major ore deposits of XKS. SXN is located in Feishuiyan Village, less than 1km from smelting zone. SXS is located in Changziyan Village, less than 1km from the smelter and slag. LWC is located in Zhumushan Village near tail sand dam, about 1km from tailings dam.
Based on the mining, distance, and other factors, 18 soil sample points were random selected in YJT, 14 in SZS, 19 in SYA, 24 in SXN, 20 in SXS, and 11 in LWC. A total of 106 soil samples were collected on non-rainy days from weed soil and agriculture soil near residential area. GPS was used to determine the geographic coordinates. The topsoil (0–20 cm) were collected from the center and at its four equidistant corners from each sampling point (1 × 1 m), and then fully mixed to form one composite sample. The soil samples were sealed and transported to the laboratory in polyethylene plastic bags.

2.3. Sample Analysis

The soil samples were naturally air-dried, after removing the shell fragments and grounded with an agate mortar, the solid was passed through the 20-mesh and 100-mesh nylon mesh sieve. Soil pH was measured using a soil/water ratio of 1:2.5. Organic carbon content was determined by the dichromate oxidation method. Soil samples were digested using a concentrated acid mixture (HNO3-H2O2-HF) for PTE analysis. Briefly, approximately 0.5 g of soil were digested with 8 mL 65% HNO3, 5 mL 30% H2O2, and 3 mL 30% HF in Teflon vessels. The vessels were sealed and incubated in microwave system at 150 °C for 10min, at 180 °C for 10 min, and then at 200 °C for 15 min until a clear liquid was obtained. After digestion, samples were evaporated near to dryness in a sand bath at 120 °C for 3 h. After cooling below 100 °C, digested samples were made up to 10 mL volume with Milli-Q water [20,21]. The extract was then stored at 4 °C until it was analyzed. The concentrations of Cr, Zn, Cd, and Pb were measured with inductively coupled plasma atomic emission spectrometry (Thermo Scientific, iCAP Qc). The concentrations of As, Hg, and Sb were determined using a dual-channel atomic fluorescence photometer (Beijing Haiguang instrument Co., AFS-2100). For quality control (QC), standard reference soils (GBW07407; Center for Certified Reference Materials, China) and blank controls were included in each experiment. The detection limits of Cr, Zn, Cd, Pb, As, Hg, and Sb were 0.240, 0.970, 0.002, 0.240, 0.001, 0.002, and 0.010 mg kg−1, respectively. The recovery rate of each metal in the QC samples was in the range of 92–108%, and the deviation of the parallel samples was within 10%.

2.4. Date Analysis

2.4.1. Assessment of Soil Metal Contamination

The single-factor pollution index (Pi) and Nemerow synthetic pollution index (PN) were calculated to assess the degree of metal pollution in the soils [22]. The single-factor pollution index was calculated as follows:
P i = C i C o
where Pi is the single-factor pollution index of element i in soil; Ci is the on-the-spot survey concentration of element i; and Co is the element i background value of Hunan soil (mg kg−1) (Table S1). Pi > 1 represents element pollution. The Nemerow synthetic pollution index was calculated using the following formula:
P N = P M A X 2 + P A V E 2 2
where PN is the Nemerow synthetic pollution index for all assessed samples; PMAX is the maximum of the single-factor pollution indices for all samples; and PAVE represents the arithmetic average of the single-factor pollution indices for all samples. PTEs pollution was classified into five classes or grades based on the Nemerow index (Table S2).

2.4.2. Potential Ecological Risk Assessment

Hakanson potential ecological hazard index method was used to assess the ecological risk of soil in the six mining areas [23]. The method is the current soil ecological risk assessment of PTEs, not only considering the soil element content, also being linked to the ecological environment effect and toxicology, and the difference of regional background values of PTEs. The calculation formula is as follows:
E i = T i × P i
R I = i = 1 7 E i
where Ei is the potential risk index of element i; Ti is the toxicity response parameter of element i (the toxicity response parameters of Cr, Zn, Cd, Pb, As, Hg, and Sb are 2, 1, 30, 5, 10, 40, and 7, respectively) [23,24]; Pi is the single-factor pollution index of i. RI is the comprehensive potential ecological risk index of various PTEs. Potential ecological risk was classified into five grades based on the Ei and RI index (Table S3).

2.4.3. Calculation of PTEs Intake

Cr, Zn, Cd, Pb, As, Hg, and Sb all have chronic non-carcinogenic health risks, while Cr, Cd, Pb, and As also exhibit carcinogenic risks. PTEs in the soil can enter the human body through three exposure routes: oral ingestion, dermal absorption, and inhalation. The daily average intake from the three exposure routes were calculated using ADI oral ingestion, ADI dermal absorption, and ADI inhalation (mg/kg/d) models, shown as follows:
  • Oral ingestion:
A D I o = C i × I R × C F × E F × E D B W × A T
where ADIo is the average daily intake of PTEs from oral ingestion (mg/kg/day), Ci is the element concentration found in the soil (mg/kg), IR is the ingestion rate (kg/day), CF is the conversion factor (kg/mg), EF is the exposure frequency (day/year), ED is the exposure duration (year), BW is the body weight of the exposed individual (kg), AT is the time period over which the dose is averaged (day), and SIR is the ingestion rate of soil (mg/day).
  • Dermal absorption:
A D I D = C i × S A × A F × A B S × C F × E F × E D B W × A T
where ADID is the average daily intake of PTEs from dermal absorption (mg/kg/day), SA is the exposed skin surface area (cm2), AF is the adherence factor (mg/cm2/day), and ABS is the dermal absorption factor (dimensionless).
  • Inhalation:
A D I R = C i × P M 10 × D A I R × P I A F × F S P O × C F × E F × E D B W × A T
where ADIR is the average daily intake of PTEs from inhalation (mg/kg/day), PM10 is the content of inhalable suspended particulate matter in the air (mg/cm3), DAIR is the human daily air respiration (m3/day), and PIAF is the retention ratio of inhaled particles in human body (dimensionless). FSPO is the proportion of particles from soil in the air (dimensionless). The definitions and values of other parameters proposed and revised by the USEPA are shown in Table S4 [25,26].

2.4.4. Human Health Risk Assessment

The human health risk assessment results of PTEs were divided into two types: one is the non-carcinogenic effect with index HQi from a single element (i) and HI from multiple PTEs; the other is carcinogenic effect, expressed in terms of carcinogenic risk (CR). The specific calculation model formula is as follows:
H Q i = j = 1 n A D I i j R f D i j
H I = i = 1 7 H Q i
C R i = j = 1 n A D I i j × S F i j
C R I = i = 1 4 C R i
where i is a non-carcinogenic or carcinogenic element; j is a certain exposure route; ADIij is the average daily exposure of PTEs i under the exposure route in (mg/kg/day). RfD is the reference dose (mg/kg/day); SF is the carcinogenic risk slope factor under different exposure routes (per mg/kg/day); and the reference dose values and slope factor reference values for various exposure routes are shown in Table S5.
For multiple hazardous substances, if the value of HI < 1, it is unlikely to create adverse health effects for exposed populations. If the value of HI > 1, it is meaning a potential risk associated with the contaminant [27]. CRI < 1 × 10⁻⁶ specified in the “Technical Guidelines for Risk Assessment of Contaminated Sites” issued by the Ministry of Environmental Protection of China [28], indicating that there is no negative impact on the health of the population. CRI lying between 1 × 10⁻⁴ and 1 × 10⁻⁶ are generally considered an acceptable range, depending on the situation and circumstances of exposure. CRI > 1 × 10⁻⁴ are viewed as unacceptable.

2.4.5. Statistical Analysis

Several software were employed in this study, including Arc GIS for preparing the sample distribution map and spatial interpolation mapping, SPSS (IBM SPSS Statistics 23) for correlation analysis among multiple variables, Origin (Origin 2019) for boxplot analysis of PTEs content distribution, and principal component analysis among multiple variables for each sample point.

3. Results and Discussion

3.1. Comprehensive Evaluation of Soil PTEs Concentrations

3.1.1. Soil Properties and PTEs Concentrations

The characteristics of the soils sampled at the six sites are presented in Table 1. The pH values of the soils ranged from 4.29 to 5.33. The soils at YJT, SZS, and SYA were acidic. The low soil pH at these three sites can be attributed to decades of irrigation with waste water derived from mining. The average OC content ranged from 26.41 to 38.67 g kg–1, with the highest and lowest levels found in the SZS and SXS soils, respectively.
As shown in Figure 2, the average concentrations of the PTEs in the topsoil samples (0–20 cm) from the six sites were generally greater than their corresponding background levels in Hunan (indicated by the black lines in Figure 2), especially Sb, Hg, and Cd, which exceeded the standard rate by 100%, 100%, and 97.17%, respectively. In particular, the Sb concentrations at YJT, SZS, SYA, SXN, SXS, and LWC were 75.13, 825.33, 199.57, 901.57, 567.45, and 154.73 times higher than the background value (2.98 mg kg−1), respectively (Figure 2f). Greatest concentration of Sb was observed in tailings from SXS (8591.16 mg kg−1), which was close to the previously reported concentration [11]. The relatively high Sb concentrations were found in the sampling sites rather than the paddy soil in the vicinity of the northern mine (5.91−322.35 mg kg−1) [12]. Compared to the soil which was indirectly exposed to pollution sources, such as the areas near the mines, smelters and tailings, the mean concentration of Sb in Macleay catchment coastal floodplain (located in northeastern New South Wales) was 11.2 mg/kg [29]. Mining and smelting activities produce residues that frequently contain high levels of Sb in the form of sulfides, such as stibnite (Sb2S3), which are readily oxidized when exposed to the environment [30]. This is consistent with the remarkably high level of Sb pollution observed in the smelter sites of SZS, SXN, and SXS. Moreover, it is well-known that the common sources of Hg are fossil fuel combustion (especially coal burning), industrial fumes, vehicle exhausts, and sewage sludge [31]. In our study, the three sites (SZS, SXN, and SXS) showing high Hg levels are located downwind of XKS, suggesting that coal-burning exhausts, industrial fumes, and vehicle exhausts may contribute to the increasing Hg contamination.
In contrast, the average concentrations of Cr at the six sites were much lower. In the SZS and LWC sites, the concentrations of Cr in soil were only 98.31% and 98.36% of the background value (67 mg kg−1), respectively. Moreover, Cr displayed low CV values (Table S1) and quite homogeneous distributions across the entire study area, indicating that the Cr is mainly affected by pedogenesis while Sb and Hg are heavily influenced by anthropogenic activities. Overall, the results indicated that the concentration of PTEs, especially Sb, Hg, and As in the soil samples of XKS is relatively serious and requires adequate attention. The environmental behavior of PTE is critically dependent on their chemical form, which influences their mobility, bioavailability, and toxicity to biota. Determination of the total concentrations of metals in soils is not enough to predict the hazard of these elements [32]. It reported that despite the higher Sb concentration in XKS soil, rice accumulated more As than Sb, indicating the higher phytoavailability of As [12]. We caution that the exchangeable fraction of Sb, Hg, and As should be verified, however, we have obtained the element with high risk at present, and the results lay the foundation for the next experiments.

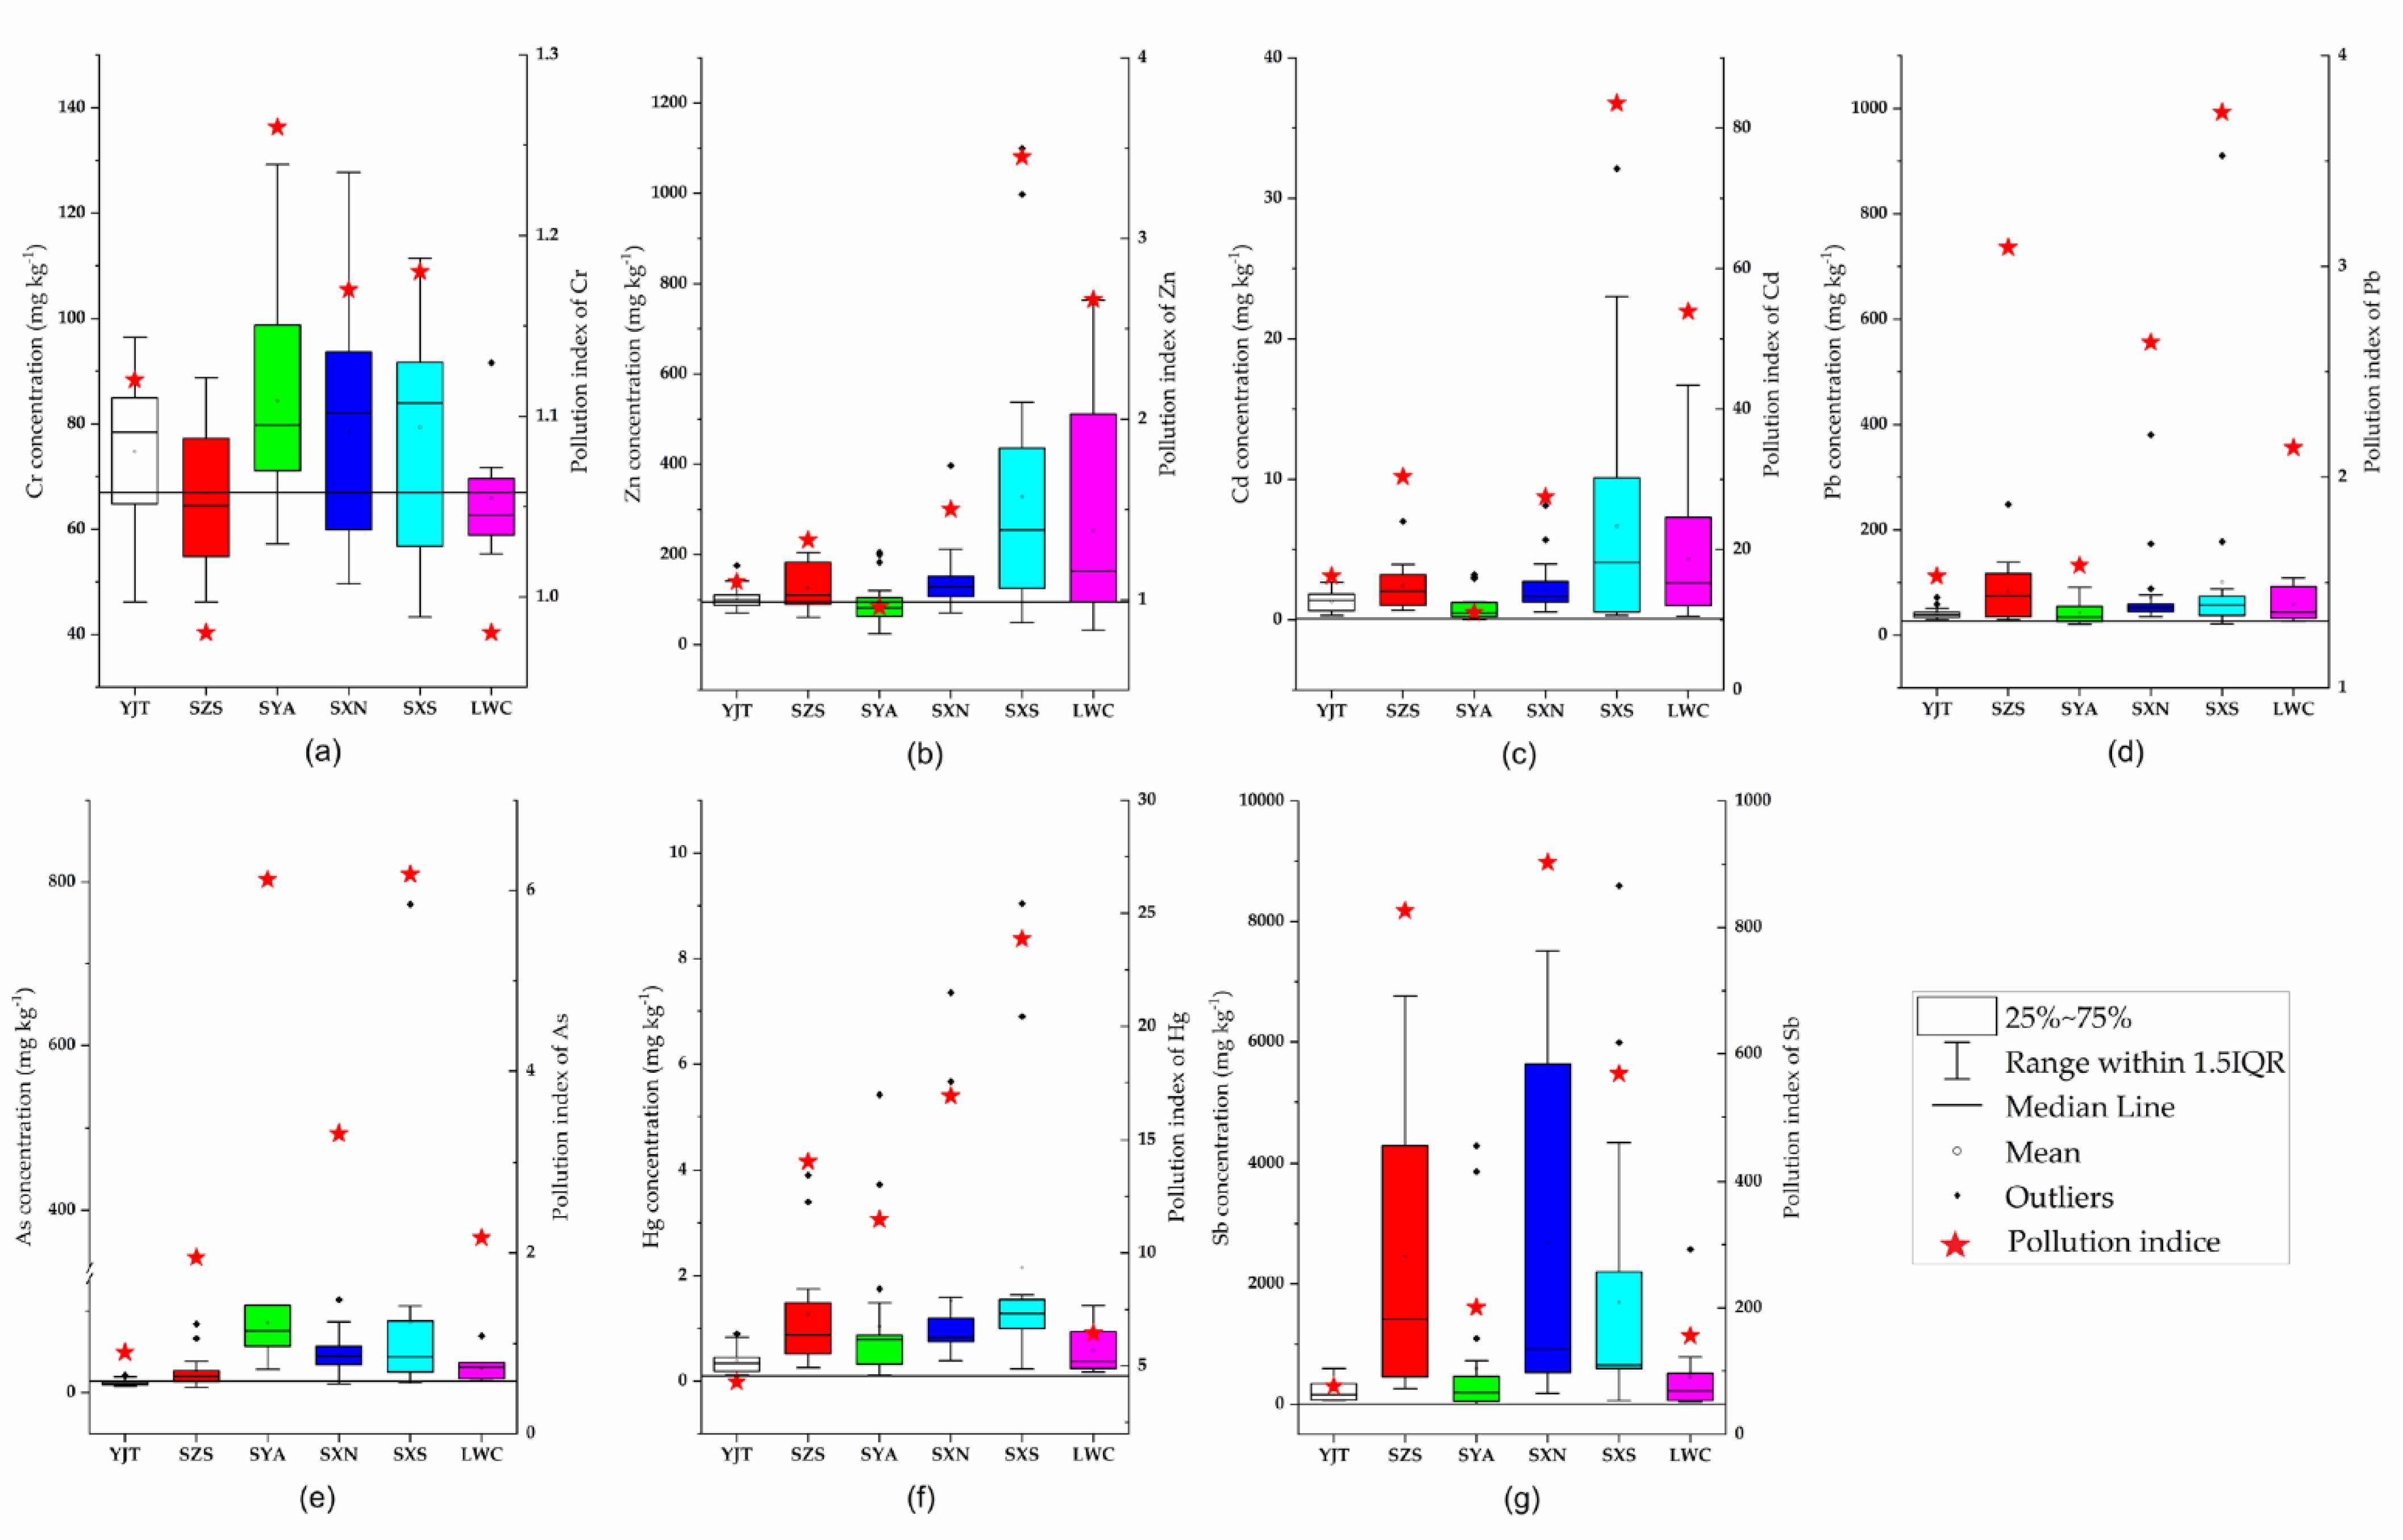
3.1.2. Pollution Index Evaluation of PTEs

The pollution indices of the metals in the soils (Figure 2) and the pollution grades (Table S2) were calculated. Pi varied greatly from PTEs and sites. Only four Pi (14.69% of the entire sample set) were <1, while the majority were >1. The Pi of Sb had a maximum value of each site. Sb pollution was the most serious element in soil, consistent with the finding of the wastewater, dust, and tailings produced from discharge points at the antimony mineral processing plant of XKS [14]. For all the metals at SXN and SXS, Pi > 1, and it was also found SXN had the highest PSb (902.57 ± 910.98, average ± standard deviation, hereafter the same), indicating an extensive Cr/Zn/Cd/Pb/As/Hg/Sb multi-pollution at SXN and SXS. The PN values of YJT, SZS, SYA, SXN, SNS, and LWC were 141.73, 1607.77, 259.11, 1784.95, 2039.74, and 611.39, respectively, indicating serious pollution levels at all six sampling sites and a high potential risk from the ecological environment, especially at SNS, SXN, and SZS.

3.2. Multivariate Statistical Analysis the Sources of Soil PTEs

3.2.1. Correlation Analysis of PTEs in Soil

Inter-element relationships can provide helpful information about metal sources and pathways. Pearson correlation coefficients were calculated between seven PTEs at the six sampling sites, as shown in Table 2. The high correlations suggested that the indicated contaminants have originated from a common source [33]. A significantly positive correlation (p < 0.01) was found with the following elemental pairs: Zn–Cd (0.405), Zn–Pb (0.985), and Cd–Pb (0.384). This indicates the possible same sources of these elements. It is in agreement with other authors who also found that Zn exhibited positive and significant correlations with Pb and Cd, indicating their common origins and similar pathways in XKS [34]. On the other hand, a highly positive correlation was found between Cd and Hg (0.445), Cd and Sb (0.344), and Hg and Sb (0.545) at a 0.01 level, which implies these PTEs were supplied by similar pollution sources. In addition, it was also found that Cr is only positively correlated with As at p < 0.01 and negatively correlated with Hg and Sb at p < 0.05.

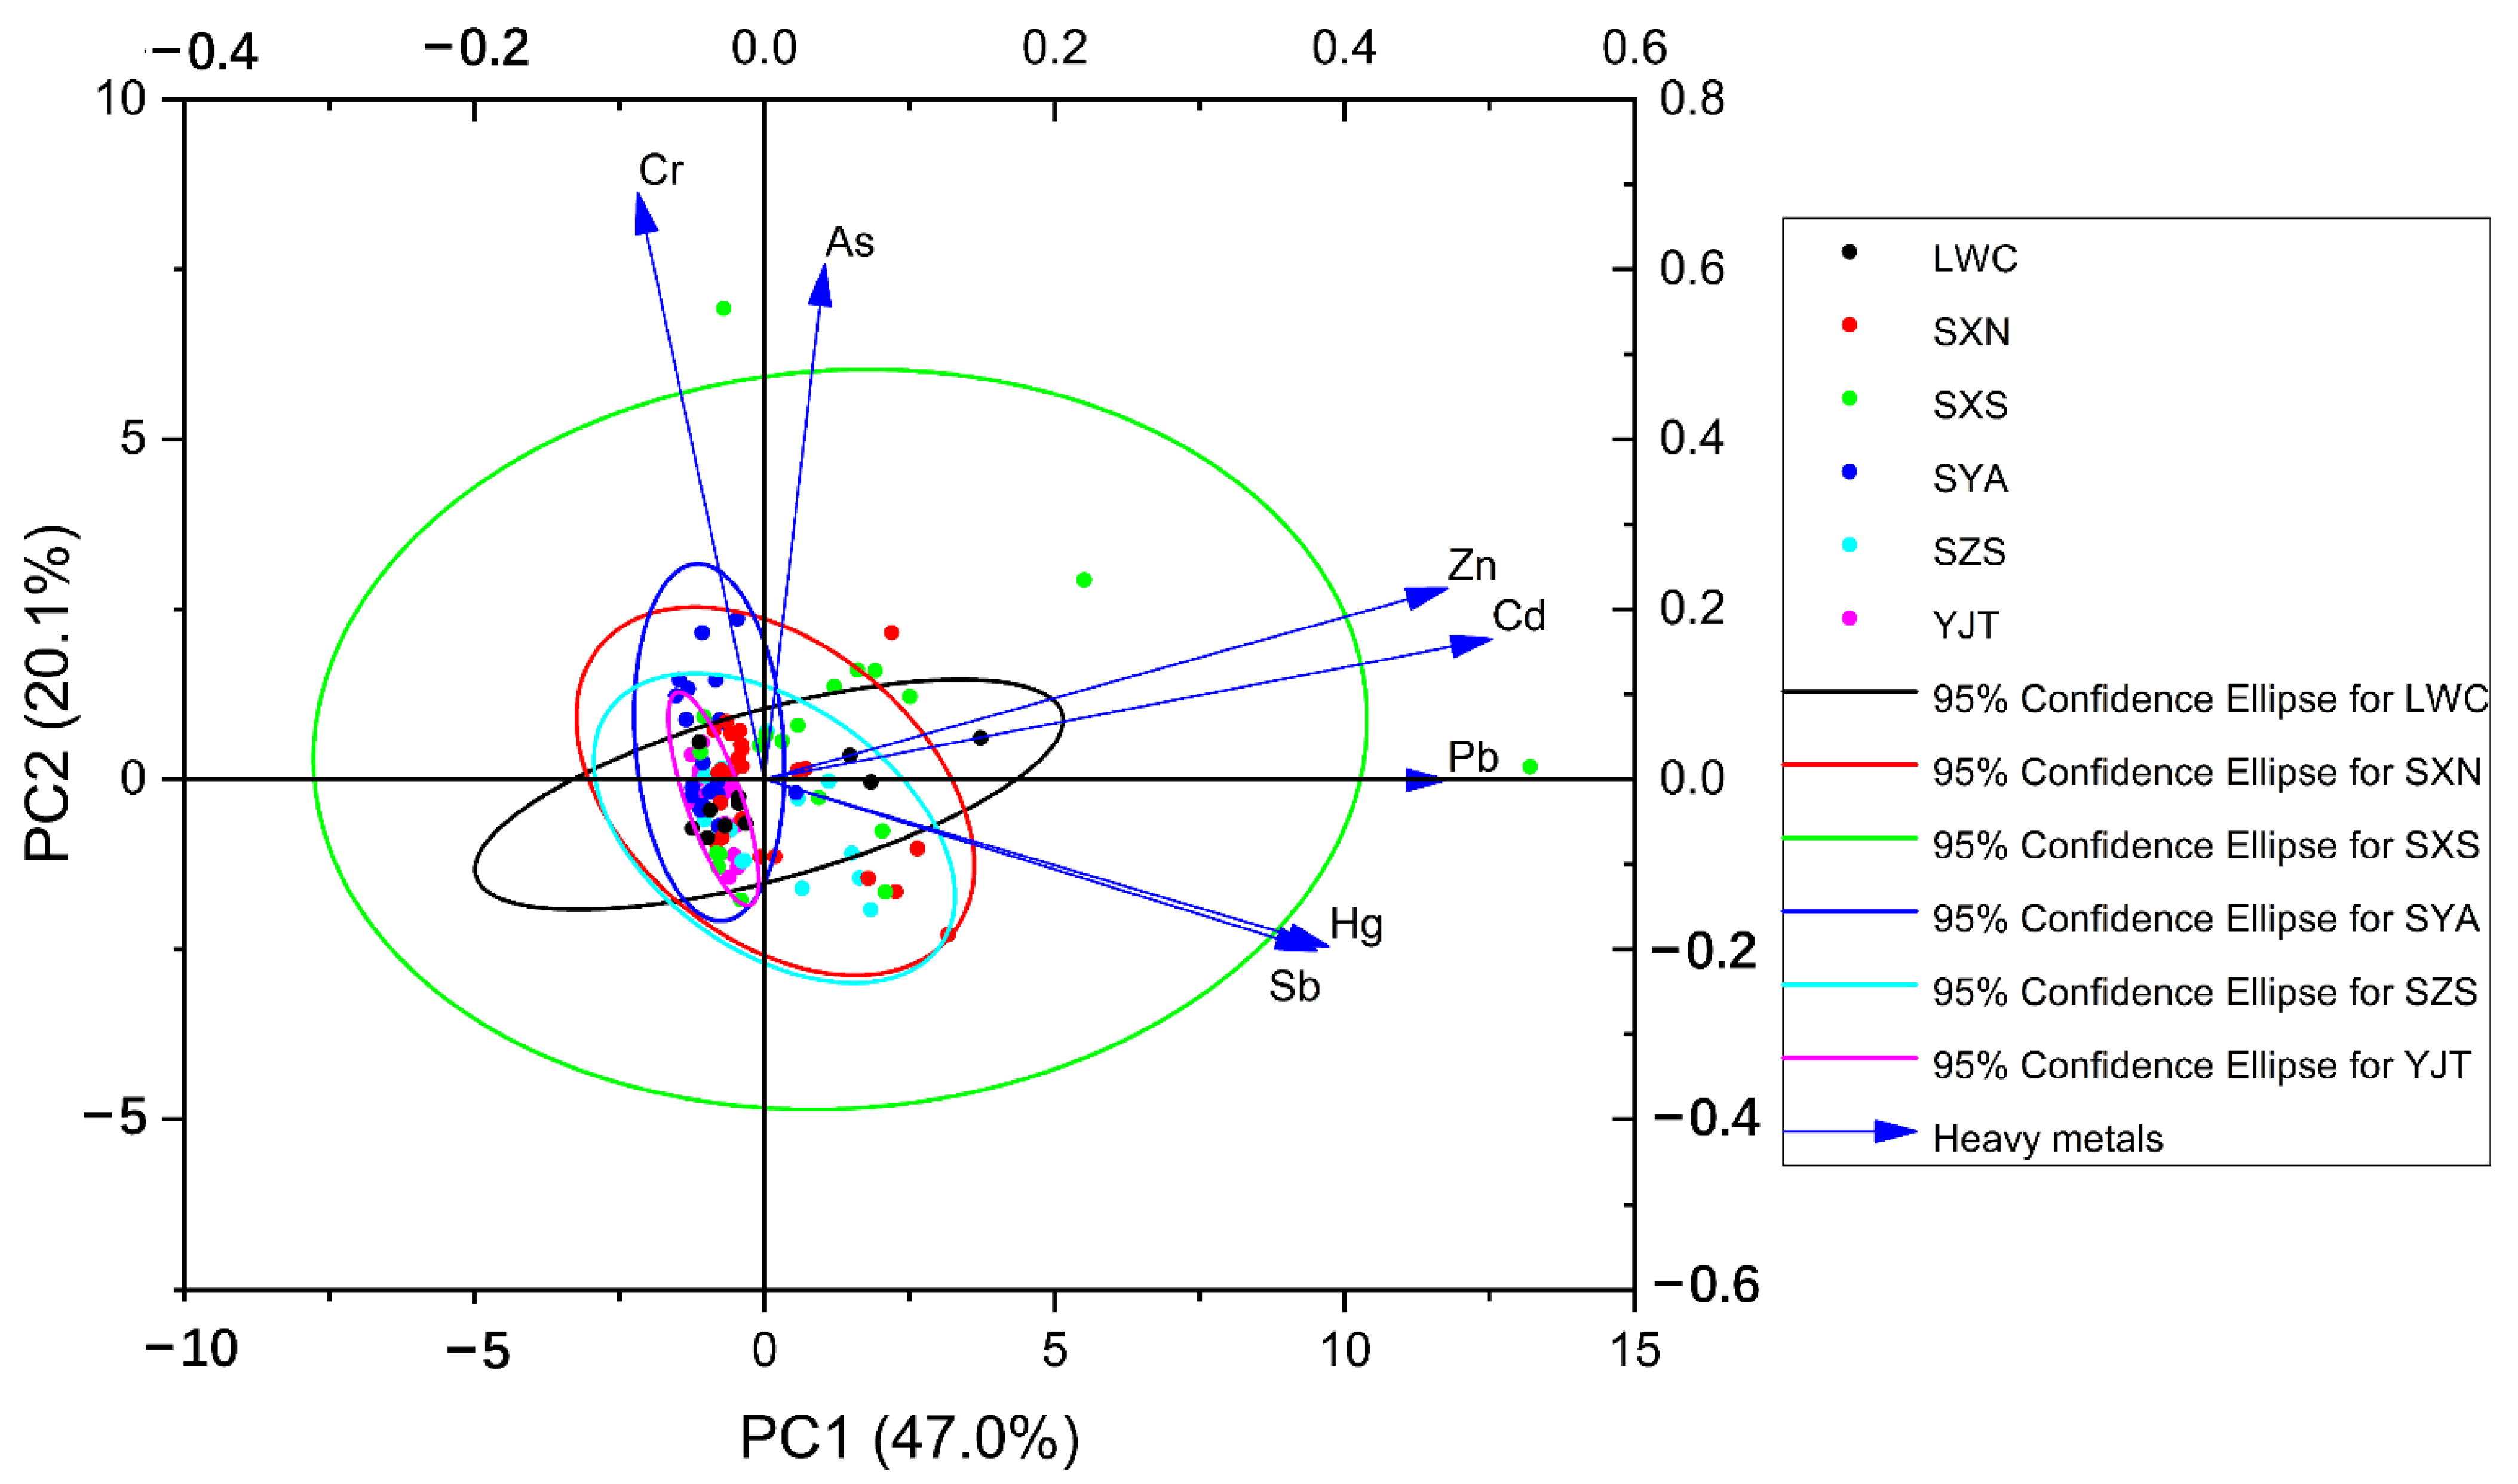
3.2.2. Principal Component Analysis of PTEs in Soil

Principal component analysis (PCA) was used to identify the original sources of the seven PTEs by evaluating their correlation [35]. Finally, the initial dimension dataset was narrowed down into two major components PC1 and PC2 (Figure 3), which can explain 67.1% of the data variation. PC1 explained 47.0% of the total variance and loaded heavily on Sb, Cd, Pb, Hg, and Zn; meanwhile, PC2 accounted for 20.1% and was dominated by Cr and As.
PC1 included Cd, Zn, Pb, Hg, and Sb, which accounted for most of the variability. The load of Cd was up to 0.909, and its correlation with Zn, Pb, Hg, and Sb was extremely significant (p < 0.01, Table 2), which suggests a shared pollution source for the five PTEs. Compared with the background values of Hunan soil, the remarkably elevated concentrations of Cd, Zn, Pb, Hg, and Sb in soils of XKS indicated that anthropogenic sources are likely to be the pollution origins of these metals (Figure 1). Researchers found that smelting slag is an important source of Sb pollution in nearby farmland [36]. PC1 could be defined as an anthropogenic component related to mining and industry practices. The antimony ore mining and smelting industry activities in the study area producing wastewater, waste gas, waste residue are the main sources of Sb, Cd, and Hg [37]. Mining and industrial activities and other human factors are affecting the concentrations of Sb, Cd, Pb, Hg, Zn in the soil.
PC2 included Cr and As. PC2 correlated strongly with Cr, which has the highest loading value (0.909). This correlation was confirmed by the contamination analysis (Table 2). The coefficient of variation of soil Cr showed non-point source contamination, suggesting that there is no significant anthropogenic input of Cr. Cr concentrations in soils did not decrease with depth, which was derived from parent materials [38]. Moreover, Cr is strongly associated with the aluminosilicate phases and Fe-oxide species of the soils, which are important products of parent rock weathering [39]. A significant correlation was found between Cr and As in YJT (Table S6), while no relationship was found in SZS, SXN, SXS, and LWC. PC2 could be a lithogenic component, as the variabilities of soil Cr and As were controlled by parent material and pedogenic processes. The metal concentrations and their correlations reflect the strong impact on parent materials in the pollution of the surrounding soils. Since As exhibited a positive correlation with Cr in XKS (Table 2), and widespread elevated As values were found in all sites except YJT (Figure 1), its sources may be complex, such as from various emissions, e.g., agricultural practices or industrial contamination [40]. This could be attributed to anthropogenic inputs of Cd, Zn, Pb, Hg, and Sb which disturbed the original correlation with Cr and As.

3.3. PTEs Risk Assessment

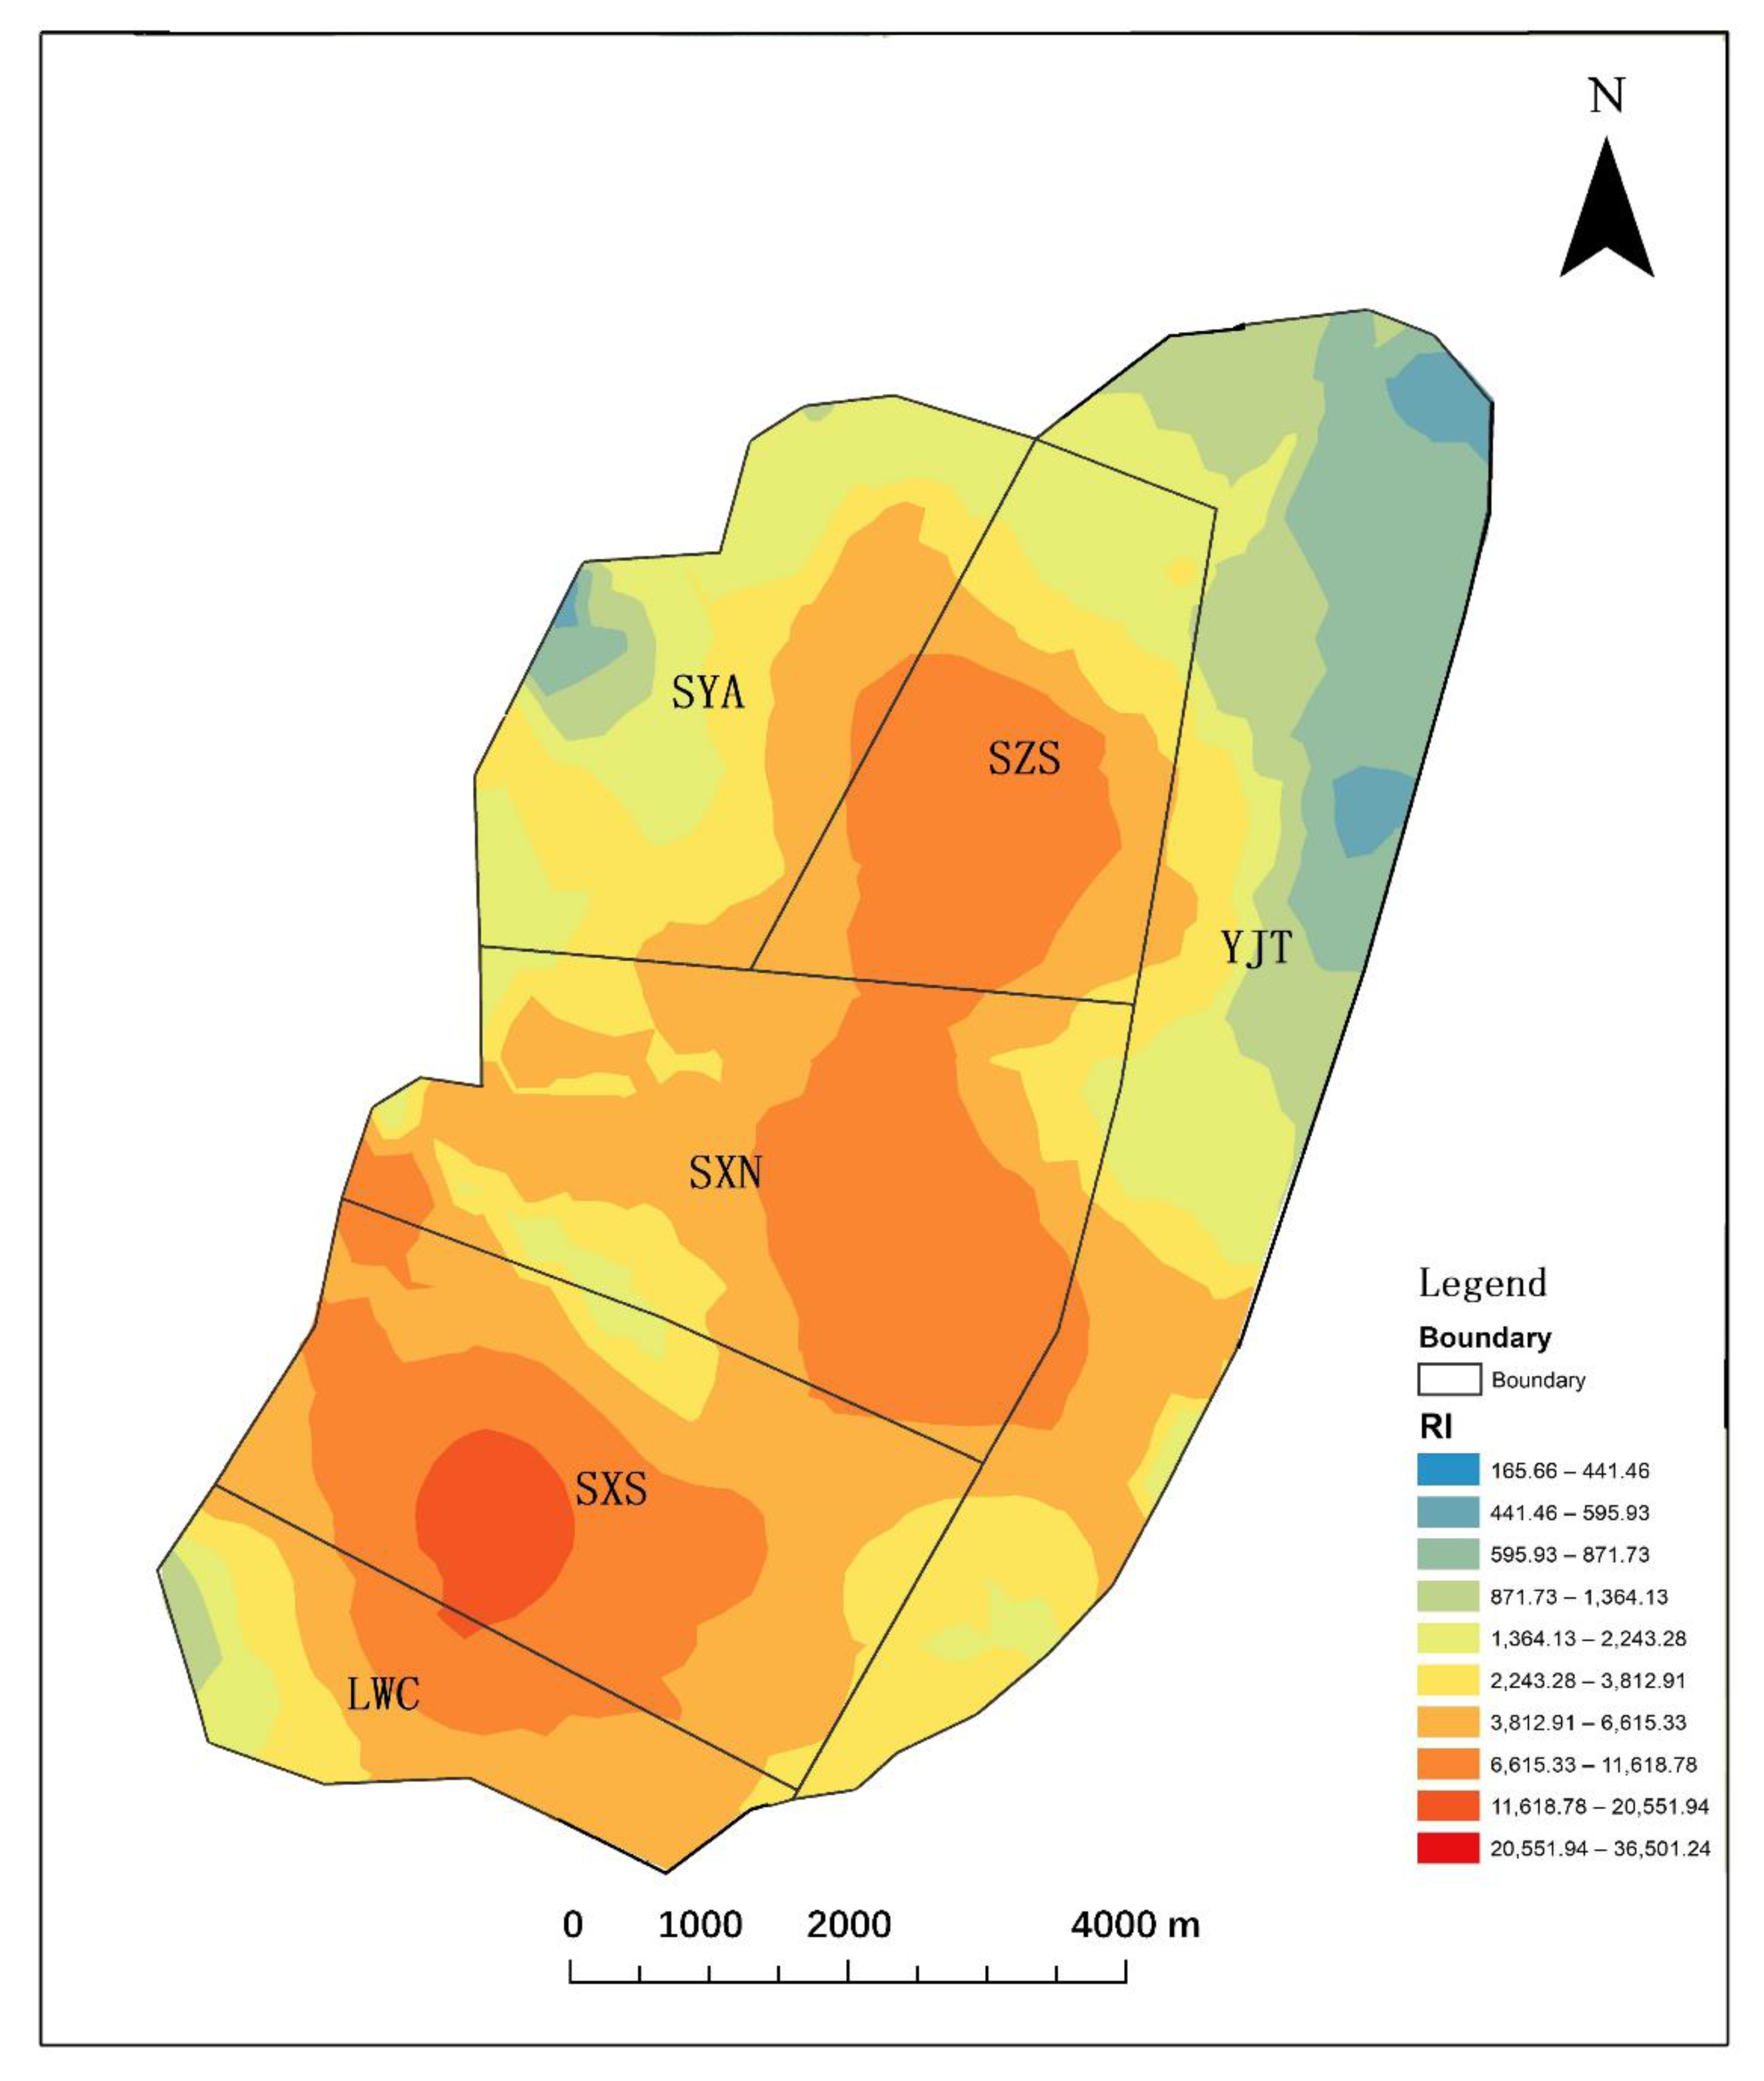
3.3.1. Evaluation of Potential Ecological Risks of PTEs

To estimate the potential ecological risk posed by PTEs in the soils from sampling sites, we calculated the potential ecological risk factor (Ei) of each individual element and the comprehensive index (RI) of the seven PTEs, as shown in Table 3 and Figure 4.
According to Hakanson’s potential ecological risk classification standard (Table S3), the result indicated that the pollution of the evaluated metals was in the following order: Sb > Cd > Hg > As > Pb > Cr > Zn. This result was in agreement with the study of Tang [15]. For each individual element, Sb, Cd, and Hg posed very high ecological risk, and there was low risk for As, Pb, Cr, and Zn. The Ei of Cr, Zn, Pb, and As in six sites were all below 40, placing these metals at low ecological risk levels. For Hg, the average Ei in YJT and LWS was 172.12 and 257.96, respectively, which places it at a moderate pollution level. Meanwhile, the average Ei in SXS and LWC for Cd reached 2505.19 and 1615.96, respectively, which is considered as a very high ecological risk. As the metal with the most potential risk, Sb posed the highest ecological risk in SXN, SZS, and SXS, reaching 6317.99, 5784.30, and 3979.18, respectively, followed by SYA (1403.32). The ESb of soils surrounding the tailings reservoir in the north of XKS reached 10548.42, indicating very high ecological risk [14]. Based on the average RI values (Figure 4) of all seven PTEs, the analysis showed that, overall, sites were at very high ecological risk. Further calculations showed that 72.64% of all soil samples were at very high ecological risk. Spatially, the pollution level at the six sampling sites were ordered as SXN > SXS > SZS > LWC > SYA > YJT. The results show that due to the long-term mining, beneficiation, and production activities of SXS and SXN enterprises, the ecological risk of PTEs in the surrounding soil is high. To conclude, all sites are experiencing high ecological risk, with Sb presenting the highest risk and Zn the least.

3.3.2. Health Risk Assessment of PTEs for Adults and Children

  • Non-carcinogenic risk for adults and children
These results for non-carcinogenic risk for adults and children via oral ingestion, dermal absorption, and inhalation pathways are all presented in terms of HQi, as shown in Table 4, Table 5 and Table 6 and the total non-carcinogenic hazard index (HI) in Figure 5. RfD values are presented in Table S5 and ADI values in Tables S7–S9.
When HQi and HI values exceed 1, this indicates a concern for the potential non-carcinogenic effects. The numerical results were higher than the research of heavy metal in agricultural surface soil for the Guangzhou-Foshan urban zone [41]. The HQ of oral ingestion was higher than dermal absorption and inhalation, suggesting that oral ingestion presented a high risk to the health for adults and children. Therefore, for the non-carcinogenic risks, we would first reduce the hazard from the diet. The HQSb via oral ingestion was significantly greater than other metals, primarily because of the high concentrations in soils. The average HQSb via oral ingestion for children decreased in the following order: Sb > As > Cr > Pb > Hg > Cd > Zn, the same as for adults. Individually, the HQSb and HQAs via oral ingestion for children at SZS, SYA, SXN, SXS, and LWC were greater than 1 because of their high concentration or low RfD values. Moreover, the HQSb via dermal absorption for adults and children at SZS, SXN, and SXS was greater than 1 and significantly higher than YJT, SYA, and LWC. The ratio of HQSb and HQAs (>1) accounted for 8.69% of all the HQ values, indicating that the accumulation of Sb and As would be the main cause of chronic diseases based on their high HQ values. Antimony and its compounds are poisonous materials with acute and chronic toxicity, leading to damage to the liver, skin, lungs, and even the cardiovascular system [42,43]. Thus, because of the hazards posed by these elements, more attention should be paid to this health topic.
The spatial distributions of HI of all interpolated PTEs were similar for both adults and children (Figure 5). Whereas HI for different populations varies partially, generally in the order of children > adults, the results concur with a previous study [44]. Non-carcinogenic risk values of mining areas in the southern provinces (e.g., Hunan and Guizhou) are higher than other provinces of China, whereas most of the northern and western mining areas’ values are less than 1 [45]. The average HI value for the seven metals at all six sites through oral ingestion exposure pathways were greater than 1, which is significantly higher than the safe level. This suggested that oral ingestion was the most significant non-carcinogenic health risk contributor and should be highly stressed.
  • Carcinogenic risk for adults and children
Due to the lack of carcinogenic slope factors for Zn, Hg, and Sb, only Cr, Cd, Pb, and As were estimated for their carcinogenic risks. The results of excess lifetime cancer risks were presented in Table 4, Table 5 and Table 6, and the total cancer risk index (CRI) was shown in Figure 6. More detailed ADI values were listed in Tables S7–S9. The cancer risk was ranked as As > Cr > Cd > Pb, implying that As was the main pollutant source to stimulate cancer. The CRAs via oral ingestion pathways were higher than other metals. The CRCr via dermal absorption and inhalation pathways were higher than other metals. It is worth noting that the CRAs and CRCr via oral ingestion, dermal absorption, and inhalation pathways for adults and children at six sites were greater than 10−6, meaning As and Cr are regarded as ultimately causing cancer risks to the population.
The CRI was calculated by summing the individual CRi across all exposure pathways. The results exhibited that the CRI at all six sites through oral ingestion, dermal absorption, and inhalation pathways were totally higher than the acceptable 10−6. The acceptable range of CRI for adults and children through dermal absorption and inhalation pathways is between 1 × 10⁻⁴ and 1 × 10⁻⁶. The ratio of CRI for adults and children >1 × 10⁻⁴ were accounted for 37.26% via oral ingestion, particularly in SXS, indicating that oral ingestion was the severely dangerous carcinogenic health risk factor. A relative research reported that there is a high chance that the non-carcinogenic and carcinogenic effects may occur in smelting site of south mine (SXS site in our research), which needs more attention [46]. Overall, the total cancer risk value of XKS has exceeded the acceptable value, implying great carcinogenic risk. Therefore, the antimony mining areas, smelting plant, and tailings are selected as the priority control mining areas. Management systems and the implementation of reduction projects need to be concentrated in XKS.
Comprehensive analysis of the non-carcinogenic and carcinogenic risks of PTEs in the soil showed that children are more susceptible to PTEs than adults, and the health risks caused by oral ingestion are much higher than dermal absorption and inhalation. This is consistent with a former study that indicates that children have the highest noncarcinogenic and carcinogenic risk in mining areas [47]. It is closely related to the living habits of children, so that the probability of active contact with the soil is much higher than that of adults. Moreover, children have a weak awareness of hygiene, and the rate of ingestion through the hand–mouth way is higher than that of adults [48]. In addition, human sustainably exposure to PTEs in the atmosphere and water have adverse effects including cancer, skin lesions, and peripheral vascular disease, so local governments and the public need to pay more attention and vigilance to ameliorate this urgent situation [49].
The classification standards of PTEs in soil have been clearly defined, but there was no clear specification for other PTE classification standards that prove to have toxic effects on the soil-plants-human body system [50]. It is not accurate to evaluate the environment as a whole only from the level of PTEs pollution in the soil. Therefore, it is recommended to regularly monitor and evaluate the contents and health risks of PTEs in soil and crops in XKS, and the local government should strengthen the remediation of PTEs to help avoid, mitigate and prevent the health hazards of local residents. It is worthy of attention to further improve the soil-plant-human body standard system when conditions permit. Moreover, special attention should be paid to the remediation of polluted soils. It is crucial to take the effective and sustainable method to remediate the PTEs contaminated soils.

4. Conclusions

(1)
The XKS mining areas were highly contaminated. A descriptive statistical analysis determined that the average concentrations of Cr, Zn, Cd, Pb, As, Hg, and Sb at all six sites were generally higher than their corresponding background levels of Hunan. Sb, Hg, and As are relatively more severe and need adequate attention, especially at SZS, SXN, and SXS.
(2)
A multivariate statistical analysis showed that two main contamination sources were influencing the PTE concentrations. Cd, Zn, Pb, Hg, and Sb were primarily influenced by mining and industrial activities and other human factors, while Cr and As were mainly influenced by the parent material and pedogenic processes.
(3)
An RI analysis showed that XKS was at a very high ecological risk. Sb was the highest risk factor, followed by Cd and Hg. According to the health risk assessment, the non-carcinogenic and carcinogenic risks of PTEs in the soil show that children are more susceptible to PTEs than adults. Oral ingestion is the main non-carcinogenic and carcinogenic risk exposure route. The findings of this study found that Sb, As, and Cr pose a certain health risk to local residents, and effective measurements are needed to remediate the toxic metals.

Supplementary Materials

The following are available online at www.mdpi.com/article/10.3390/pr9091532/s1, Table S1: PTEs concentration in the soil of the study area (n = 106), Table S2: Five grade comprising the PN index; Table S3: Grading standards of Hakanson potential ecological risk, Table S4: Values of variables for human health risk assessment models, Table S5: Summary of reference dose (RfD) and cancer slope factor (SF) values for each element from different exposure pathways, Table S6: Correlation coefficients between the PTEs concentrations in the study area, Table S7: Average daily intake (ADI) values for adults and children in soil from XKS mining area for non-carcinogenic risk calculations, Table S8: ADI values for adults and children in soil from XKS mining area for carcinogenic risk calculations.

Author Contributions

Conceptualization, J.B. and R.D.; data curation: J.B. and W.Z. and W.L.; funding acquisition: J.B. and G.X.; investigation: Y.Z., X.Z. and Z.Y.; methodology, J.B.; software, J.B. and W.Z.; writing—original draft, J.B. and W.Z.; writing—review and editing, S.S. and T.M. All authors have read and agreed to the published version of the manuscript.

Funding

This work was financially supported by the National Natural Science Foundation of China (grant number 41907037), the Natural Science Foundation of Hunan, China (grant number 2020JJ5268), and the Research Foundation of Education Bureau of Hunan Province, China (grant number 19B293).

Institutional Review Board Statement

Not applicable.

Informed Consent Statement

Not applicable.

Data Availability Statement

The data presented in this study are available on request from the corresponding author.

Acknowledgments

We would like to thank the editors and the anonymous reviewers for their helpful comments and suggestions on our paper.

Conflicts of Interest

The authors declare no conflict of interest.

References

  1. Yu, Z.Z.; Liu, E.F.; Lin, Q.; Zhang, E.L.; Yang, F.; Wei, C.Y.; Shen, J. Comprehensive assessment of heavy metal pollution and ecological risk in lake sediment by combining total concentration and chemical partitioning. Environ. Pollut. 2021, 269, 116–212. [Google Scholar] [CrossRef] [PubMed]
  2. Bai, J.; Li, W.Y.; Zhang, Y.L.; Xiao, L.; Lu, W.S.; Li, Y.T. Distributions and risks of Cu, Cd, Pb and Zn in soils and rice in the North River Basin, South China. Earth Environ. Sci. Trans. R. Soc. 2018, 109, 483–493. [Google Scholar] [CrossRef]
  3. Madrid, L.; Diaz-Barrientos, E.; Madrid, F. Distribution of heavy metal contents of urban soils in parks of Seville. Chemosphere 2002, 49, 1301–1308. [Google Scholar] [CrossRef]
  4. He, M.C.; Wang, X.Q.; Wu, F.C.; Fu, Z.Y. Antimony pollution in China. Sci. Total Environ. 2012, 421–422, 41–50. [Google Scholar] [CrossRef] [PubMed]
  5. Li, J.Y.; Zheng, B.H.; He, Y.Z.; Zhou, Y.Y.; Chen, X.; Ruan, S.; Yang, Y.; Dai, C.H.; Tang, L. Antimony contamination, consequences and removal techniques: A review. Ecotoxicol. Environ. Saf. 2018, 156, 125–134. [Google Scholar] [CrossRef]
  6. He, M. Distribution and phytoavailability of antimony at an antimony mining and smelting area, Hunan, China. Environ. Geochem. Health 2007, 29, 209–219. [Google Scholar] [CrossRef]
  7. Liang, Z.W.; Hua, Z.S.; Jia, P.; Liu, J.; Luo, Z.H.; Chen, W.C.; Kuang, J.J.; Liao, B.; Shu, W.S.; Li, J.T. Strong Associations Between Biogeochemical Factors and Sb Species in Sediments of the World’s Largest Sb Mine (Xikuangshan) in China. J. Geophys. Res. Biogeosci. 2018, 123, 1548–1556. [Google Scholar] [CrossRef]
  8. Guo, W.J.; Fu, Z.Y.; Wang, H.; Song, F.H.; Wu, F.C.; Giesy, J.P. Environmental geochemical and spatial/temporal behavior of total and speciation of antimony in typical contaminated aquatic environment from Xikuangshan, China. Microchem. J. 2018, 137, 181–189. [Google Scholar] [CrossRef]
  9. Pierart, A.; Shahid, M.; Séjalon-Delmas, N.; Dumat, C. Antimony bioavailability: Knowledge and research perspectives for sustainable agricultures. J. Hazard. Mater. 2015, 289, 219–234. [Google Scholar] [CrossRef] [PubMed] [Green Version]
  10. Tian, H.Z.; Zhou, J.R.; Zhu, C.Y.; Zhao, D.; Gao, J.J.; Hao, J.M.; He, M.C.; Liu, K.Y.; Wang, K.; Hua, S.B. A Comprehensive Global Inventory of Atmospheric Antimony Emissions from Anthropogenic Activities, 1995–2010. Environ. Sci. Technol. 2014, 48, 10235–10241. [Google Scholar] [CrossRef]
  11. Wang, X.Q.; He, M.C.; Xi, J.H.; Lu, X.F. Antimony distribution and mobility in rivers around the world’s largest antimony mine of Xikuangshan, Hunan Province, China. Microchem. J. 2011, 97, 4–11. [Google Scholar] [CrossRef]
  12. Wu, T.; Cui, X.; Cui, P.; Ata-Ul-Karim, S.T.; Sun, Q.; Liu, C.; Fan, T.-T.; Gong, H.; Zhou, D.-M.; Wang, Y.-J. Speciation and location of arsenic and antimony in rice samples around antimony mining area. Environ. Pollut. 2019, 252, 1439–1447. [Google Scholar] [CrossRef]
  13. Zhou, B.L.; Zhou, J.W.; Nyirenda, M.T.; Xie, L.; Li, Y.; Zhu, Y.; Liu, H.L. Mine waste acidic potential and distribution of antimony and arsenic in waters of the Xikuangshan mine, China. Appl. Geochem. 2017, 77, 52–61. [Google Scholar] [CrossRef]
  14. Zhou, S.; Deng, R.; Hursthouse, A. Risk Assessment of Potentially Toxic Elements Pollution from Mineral Processing Steps at Xikuangshan Antimony Plant, Hunan, China. Processes 2020, 8, 29. [Google Scholar] [CrossRef] [Green Version]
  15. Tang, Z.; Deng, R.; Zhang, J.; Ren, B.; Hursthouse, A. Regional distribution characteristics and ecological risk assessment of heavy metal pollution of different land use in an antimony mining area—Xikuangshan, China. Hum. Ecol. Risk Assess. 2020, 26, 1779–1794. [Google Scholar] [CrossRef]
  16. Yang, H.; He, M.; Wang, X. Concentration and speciation of antimony and arsenic in soil profiles around the world’s largest antimony metallurgical area in China. Environ. Geochem. Health. 2015, 37, 21–33. [Google Scholar] [CrossRef]
  17. Okkenhaug, G.; Zhu, Y.; He, J.; Li, X.; Luo, L.; Mulder, J. Antimony (Sb) and Arsenic (As) in Sb Mining Impacted Paddy Soil from Xikuangshan, China: Differences in Mechanisms Controlling Soil Sequestration and Uptake in Rice. Environ. Sci. Technol. 2012, 46, 3155–3162. [Google Scholar] [CrossRef]
  18. Nigra, A.E.; Ruiz-Hernandez, A.; Redon, J.; Navas-Acien, A.; Tellez-Plaza, M. Environmental metals and cardiovascular disease in adults: A systematic review beyond lead and cadmium. Curr. Environ. Health Rep. 2016, 3, 416–433. [Google Scholar] [CrossRef] [PubMed]
  19. Fu, Z.Y.; Wu, F.C.; Mo, C.L.; Deng, Q.J.; Meng, W.; Giesy, J.P. Comparison of arsenic and antimony biogeochemical behavior in water, soil and tailings from Xikuangshan, China. Sci. Total Environ. 2016, 539, 97–104. [Google Scholar] [CrossRef]
  20. Yu, B.B.; Wang, Y.; Zhou, Q.X. Human Health Risk Assessment Based on Toxicity Characteristic Leaching Procedure and Simple Bioaccessibility Extraction Test of Toxic Metals in Urban Street Dust of Tianjin, China. PLoS ONE 2014, 9, e92459. [Google Scholar] [CrossRef]
  21. Kalantzi, I.; Shimmield, T.M.; Pergantis, S.A.; Papageorgiou, N.; Black, K.D.; Karakassis, I. Heavy metals, trace elements and sediment geochemistry at four Mediterranean fish farms. Sci. Total Environ. 2013, 444, 128–137. [Google Scholar] [CrossRef] [PubMed]
  22. Chen, H.W.; An, J.; Wei, S.H.; Gu, J. Spatial Patterns and Risk Assessment of Heavy Metals in Soils in a Resource-Exhausted City, Northeast China. PLoS ONE 2015, 10, e137694. [Google Scholar] [CrossRef] [PubMed]
  23. Hakanson, L. An ecological risk index for aquatic pollution control. A sedimentological approach. Water Res. 1980, 14, 975–1001. [Google Scholar] [CrossRef]
  24. Wang, N.N.; Wang, A.H.; Kong, L.H.; He, M.C. Calculation and application of Sb toxicity coefficient for potential ecological risk assessment. Sci. Total Environ. 2018, 610–611, 167–174. [Google Scholar] [CrossRef] [PubMed]
  25. US EPA. Exposure Factors Handbook; National Center for Environmental Assessment: Washington, DC, USA, 2011.
  26. US EPA. Highlights of the Child–Specific Exposure Factors Handbook (Final Report); U.S. Environmental Protection Agency: Washington, DC, USA, 2009.
  27. US EPA. Regional Screening Level (RSL) for Chemical Contaminants at Superfund Sites; U.S. Environmental Protection Agency: Washington, DC, USA, 2013.
  28. PRC Ministry of Environmental Protection of China. Technical Guidelines for Risk Assessment of Contaminated Sites: HJ 25.3—2014; China Environmental Science Press: Beijing, China, 2014. [Google Scholar]
  29. Tighe, M.; Ashley, P.; Lockwood, P.; Wilson, S. Soil, water, and pasture enrichment of antimony and arsenic within a coastal floodplain system. Sci. Total Environ. 2005, 347, 175–186. [Google Scholar] [CrossRef]
  30. Casiot, C.; Ujevic, M.; Munoz, M.; Seidel, L.J.; Elbaz-Poulichet, F. Antimony and arsenic mobility in a creek draining an antimony mine abandoned 85 years ago (upper Orb basin, France). Appl. Geochem. 2006, 22, 788–798. [Google Scholar] [CrossRef]
  31. Luo, L.; Ma, Y.B.; Zhang, S.Z.; Wei, D.P.; Zhu, Y.G. An inventory of trace element inputs to agricultural soils in China. J. Environ. Manag. 2009, 90, 2524–2530. [Google Scholar] [CrossRef]
  32. Caceres Choque, L.F.; Ramos Ramos, O.E.; Valdez Castro, S.N.; Choque Aspiazu, R.R.; Choque Mamani, R.G.; Fernandez Alcazar, S.G.; Sracek, O.; Bhattacharya, P. Fractionation of heavy metals and assessment of contamination of the sediments of Lake Titicaca. Environ. Monit. Assess. 2013, 185, 9979–9994. [Google Scholar] [CrossRef]
  33. Rahman, S.H.; Khanam, D.; Adyel, T.M.; Islam, M.S.; Ahsan, M.A.; Akbor, M.A. Assessment of Heavy Metal Contamination of Agricultural Soil around Dhaka Export Processing Zone (DEPZ), Bangladesh: Implication of Seasonal Variation and Indices. Appl. Sci. 2012, 2, 584–601. [Google Scholar] [CrossRef] [Green Version]
  34. Li, X.; Yang, H.; Zhang, C.; Zeng, G.M.; Liu, Y.G.; Xu, W.H.; Wu, Y.E.; Lan, S.M. Spatial distribution and transport characteristics of heavy metals around an antimony mine area in central China. Chemosphere 2017, 170, 17–24. [Google Scholar] [CrossRef]
  35. Wang, X.D.; Sun, Y.F.; Li, S.Y.; Wang, H.X. Spatial distribution and ecological risk assessment of heavy metals in soil from the Raoyanghe Wetland, China. PLoS ONE 2019, 14, e220409. [Google Scholar] [CrossRef] [PubMed] [Green Version]
  36. Guo, X.J.; Wang, K.P.; He, M.C.; Liu, Z.W.; Yang, H.L.; Li, S.S. Antimony smelting process generating solid wastes and dust: Characterization and leaching behaviors. J. Environ. Sci. 2014, 26, 1549–1556. [Google Scholar] [CrossRef]
  37. Fu, S.; Wei, C.Y.; Li, L.H. Characterizing the accumulation of various heavy metals in native plants growing around an old antimony mine. Hum. Ecol. Risk Assess. 2015, 22, 882–898. [Google Scholar] [CrossRef]
  38. Gong, X.; Chen, Z.H.; Luo, Z.H. Spatial distribution, temporal variation, and sources of heavy metal pollution in groundwater of a century-old nonferrous metal mining and smelting area in China. Environ. Monit. Assess. 2014, 186, 9101–9116. [Google Scholar] [CrossRef] [PubMed]
  39. Cai, L.M.; Xu, Z.C.; Bao, P.; He, M.; Dou, L.; Chen, L.G.; Zhou, Y.Z.; Zhu, L.G. Multivariate and geostatistical analyses of the spatial distribution and source of arsenic and heavy metals in the agricultural soils in Shunde, Southeast China. J. Geochem. Explor. 2015, 148, 189–195. [Google Scholar] [CrossRef]
  40. Cai, L.M.; Xu, Z.C.; Ren, M.Z.; Guo, Q.W.; Hu, X.B.; Hu, G.C.; Wan, H.F.; Peng, P.G. Source identification of eight hazardous heavy metals in agricultural soils of Huizhou, Guangdong Province, China. Ecotoxicol. Environ. Saf. 2012, 78, 2–8. [Google Scholar] [CrossRef]
  41. Xiao, Y.; Guo, M.Y.; Li, X.H.; Luo, X.X.; Pan, R.K.; Ouyang, T.P. Spatial distribution, pollution, and health risk assessment of heavy metal in agricultural surface soil for the Guangzhou-Foshan urban zone, South China. PLoS ONE 2020, 15, e0239563. [Google Scholar] [CrossRef]
  42. Saerens, A.; Ghosh, M.; Verdonck, J.; Godderis, L. Risk of Cancer for Workers Exposed to Antimony Compounds: A Systematic Review. Int. J. Environ. Res. Public Health 2019, 16, 4474. [Google Scholar] [CrossRef] [Green Version]
  43. Boreiko, C.J.; Rossman, T.G. Antimony and its compounds: Health impacts related to pulmonary toxicity, cancer, and genotoxicity. Toxicol. Appl. Pharmacol. 2020, 403, 115156. [Google Scholar] [CrossRef]
  44. Li, Z.Y.; Ma, Z.W.; van der Kuijp, T.J.; Yuan, Z.W.; Huang, L. A review of soil heavy metal pollution from mines in China: Pollution and health risk assessment. Sci. Total Environ. 2014, 468–469, 843–853. [Google Scholar] [CrossRef]
  45. Zhang, X.W.; Yang, L.S.; Li, Y.H.; Li, H.R.; Wang, W.Y.; Ye, B.X. Impacts of lead/zinc mining and smelting on the environment and human health in China. Environ. Monit. Assess. 2012, 184, 2261–2273. [Google Scholar] [CrossRef]
  46. Li, J.N.; Wei, Y.; Zhao, L.; Zhang, J.; Shangguan, Y.X.; Li, F.S.; Hou, H. Bioaccessibility of antimony and arsenic in highly polluted soils of the mine area and health risk assessment associated with oral ingestion exposure. Ecotoxicol. Environ. Saf. 2014, 110, 308–315. [Google Scholar] [CrossRef] [PubMed]
  47. Tong, R.; Jia, Q.; Ma, X.; Fang, Y.; Wang, W. Comprehensive comparison of probabilistic health risks of soil heavy metals in China’s mining areas. Hum. Ecol. Risk Assess. 2020, 26, 2059–2077. [Google Scholar] [CrossRef]
  48. Watt, J.; Thornton, I.; Cotter-Howells, J. Physical evidence suggesting the transfer of soil Pb into young children via hand-to-mouth activity. Appl. Geochem. 1993, 8, 269–272. [Google Scholar] [CrossRef]
  49. Lu, Q.; Wang, S.J.; Bai, X.Y.; Liu, F.; Li, C.J.; Deng, Y.H.; Tian, S.Q. Quantitative assessment of human health risks under different land uses based on soil heavy metal pollution sources. Hum. Ecol. Risk Assess. 2021, 27, 327–343. [Google Scholar] [CrossRef]
  50. Jiang, Y.X.; Chao, S.H.; Liu, J.W.; Yang, Y.; Chen, Y.J.; Zhang, A.C.; Cao, H.B. Source apportionment and health risk assessment of heavy metals in soil for a township in Jiangsu Province, China. Chemosphere 2017, 168, 1658–1668. [Google Scholar] [CrossRef] [PubMed]
Figure 1. The sampling sites. Yanjingtang Reservoir (YJT), Shizishan Antimony Company (SZS), Lengshuijiang Senyi Antimony Industry (SYA), northern mine of the Twinkling Star Antimony Company (SXN), southern mine of the Twinkling Star Antimony Company (SXS), Longwangchi (LWC).
Processes 09 01532 g001
Figure 2. Boxplots of the PTEs concentrations (mg kg−1) in the soils from the six sampling sites YJT (n = 18), SZS (n = 14), SYA (n = 19), SYN (n = 24), SYS (n = 20), and LWC (n = 11). (a) Cr, (b) Zn, (c) Cd, (d) Pb, (e) As, (f) Hg, and (g) Sb. The boxes span from the 25th percentile to the 75th percentile. The circle inside each box represents the mean. The whiskers of each box denote the interval between the minimum and maximum values. The black dots outside each box represent the outliers. The red star represents the average of pollution indices of each element. The black lines (BVSH) represent the background value for soils in Hunan (Table S1).
Processes 09 01532 g002
Figure 3. Principal component analysis of the total PTEs concentrations.
Processes 09 01532 g003
Figure 4. Spatial distribution of potential ecological risk index of PTEs from the six sampling sites.
Processes 09 01532 g004
Figure 5. Spatial distribution of hazard index of PTEs from the six sampling sites.
Processes 09 01532 g005
Figure 6. Spatial distribution of Cancer risk index of PTEs from the six sampling sites.
Processes 09 01532 g006
Table 1. Properties of the soils from the six sampling sites.
SitenpHOrganic Carbon (g kg–1)
YJT184.39 ± 1.08 b27.23 ± 6.71 b
SZS144.37 ± 1.25 b27.78 ± 7.91 b
SYA194.29 ± 1.41 b26.41 ± 8.67 b
SXN245.33 ± 0.98 a36.76 ± 6.76 a
SXS205.29 ± 1.03 a38.67 ± 7.53 a
LWC115.05 ± 1.12 ab36.41 ± 8.08 a
The values shown are mean ± standard deviation. Different letters in the same column denote significant differences (p < 0.05).
Table 2. Correlation coefficients between the PTEs concentrations from the six sampling sites.
CrZnCdPbAsHgSb
Cr1
ZnNC1
CdNC0.405 **1
PbNC0.985 **0.384 **1
As0.310 **NCNCNC1
Hg−0.227 *NC0.445 **NCNC1
Sb−0.190 *NC0.344 **NCNC0.545 **1
NC: not correlated. **: Correlation is significant at the 0.01 level. *: Correlation is significant at the 0.05 level.
Table 3. Assessment of potential ecological risks of soil PTEs from the six sampling sites.
Siten Potential   Ecological   Risks   ( E r i )
CrZnCdPbAsHgSb
YJT182.23 ± 0.44 ab1.10 ± 0.27 c484.95 ± 272.02 bc7.64 ± 1.99 a8.96 ± 2.56 b172.12 ± 108.98 b532.92 ± 435.06 b
SZS141.97 ± 0.44 b1.33 ± 0.52 bc911.14 ± 649.39 bc15.43 ± 11.26 a19.49 ± 15.83 ab561.80 ± 497.23 ab5784.30 ± 5419.49 a
SYA192.52 ± 0.56 a0.96 ± 0.53 c331.38 ± 368.28 c7.90 ± 5.02 a61.19 ± 28.78 b458.93 ± 558.03 ab1403.32 ± 2729.32 b
SXN242.34 ± 0.59 ab1.50 ± 0.66 bc823.68 ± 645.12 bc13.19 ± 13.20 a33.21 ± 16.28 ab675.90 ± 811.59 ab6317.99 ± 6376.88 a
SXS202.37 ± 0.61 ab3.45 ± 3.02 a2505.19 ± 3128.47 a18.63 ± 35.86 a61.83 ± 117.44 b953.89 ± 1165.36 a3979.18 ± 5286.83 ab
LWC111.97 ± 0.29 b2.66 ± 2.51 ab1615.96 ± 1916.04 ab10.72 ± 5.67 a21.67 ± 11.04 ab257.96 ± 190.73 b1090.10 ± 1738.47 b
The values shown are average ± standard deviation. Different letters in the same column denote significant differences (p < 0.05).
Table 4. Non-carcinogenic hazards (HQi) and carcinogenic risk (CRi) index of PTEs by oral ingestion.
SitenHQi via Oral IngestionCRi via Oral Ingestion
HQCrHQZnHQCdHQPbHQAsHQHgHQSbCRCrCRCdCRPbCRAs
Adults
YJT184.39 × 10−2 ab a6.11 × 10−4 c2.28 × 10−3 bc2.07 × 10−2 a7.37 × 10−2 b2.27 × 10−3 b9.99 × 10−1 b2.20 × 10−5 ab4.63 × 10−6 bc2.06 × 10−7 a1.10 × 10−5 b
SZS143.87 × 10−2 b7.40 × 10−4 bc4.28 × 10−3 bc4.19 × 10−2 a1.60 × 10−1 ab7.42 × 10−3 ab1.08 × 101 a1.94 × 10−5 b8.70 × 10−6 bc4.16 × 10−7 a2.40 × 10−5 ab
SYA194.87 × 10−2 a4.03 × 10−4 c7.72 × 10−4 c1.56 × 10−2 a5.11 × 10−1 a2.70 × 10−3 ab8.37 × 10−1 b2.44 × 10−5 a1.57 × 10−6 c1.55 × 10−7 a7.67 × 10−5 a
SXN253.91 × 10−2 ab8.28 × 10−4 bc4.16 × 10−3 bc3.73 × 10−2 a2.77 × 10−1 ab1.20 × 10−2 ab1.38 × 101 a1.96 × 10−5 ab8.45 × 10−6 bc3.70 × 10−7 a4.15 × 10−5 ab
SXS204.66 × 10−2 ab1.92 × 10−3 a1.18 × 10−2 a5.06 × 10−2 a5.08 × 10−1 a1.26 × 10−2 a7.46 × 100 ab2.33 × 10−5 ab2.39 × 10−5 a5.02 × 10−7 a7.62 × 10−5 a
LWC113.87 × 10−2 b1.48 × 10−3 ab7.59 × 10−3 ab2.91 × 10−2 a1.78 × 10−1 ab3.41 × 10−3 b2.04 × 100 b1.94 × 10−5 b1.54 × 10−5 ab2.89 × 10−7 a2.67 × 10−5 ab
Children
YJT183.13 × 10−1 ab4.37 × 10−3 c1.63 × 10−2 bc1.48 × 10−1 a5.26 × 10−1 b1.62 × 10−2 b7.13 × 100 b3.93× 10−5 ab8.27 × 10−6 bc3.67 × 10−7 a1.97 × 10−5 b
SZS142.76 × 10−1 b5.29 × 10−3 bc3.06 × 10−2 bc2.99 × 10−1 a1.14 × 100 ab5.30 × 10−2 ab7.74 × 101 a3.46× 10−5 b1.55× 10−5 bc7.42 × 10−7 a4.29 × 10−5 ab
SYA193.48 × 10−1 a2.88 × 10−3 c5.52 × 10−3 c1.12 × 10−1 a3.65 × 100 a1.93 × 10−2 ab5.98 × 100 b4.36× 10−5 a2.80 × 10−6 c2.77 × 10−7 a1.37 × 10−4 a
SXN252.79 × 10−1 ab5.91 × 10−3 bc2.97 × 10−2 bc2.66 × 10−1 a1.98 × 100 ab8.55 × 10−2 ab9.85 × 101 a3.50× 10−5 ab1.51× 10−5 bc6.60 × 10−7 a7.41 × 10−5 ab
SXS203.33 × 10−1 ab1.38 × 10−2 a8.40 × 10−2 a3.61 × 10−1 a3.63 × 100 a9.00 × 10−2 a5.33 × 101 ab4.17× 10−5 ab4.27× 10−5 a8.96 × 10−7 a1.36 × 10−4 a
LWC112.76 × 10−1 b1.06 × 10−2 ab5.42 × 10−2 ab2.08 × 10−1 a1.27 × 100 ab2.43 × 10−2 b1.46 × 101 b3.46× 10−5 b2.76× 10−5 ab5.16 × 10−7 a4.77 × 10−5 ab
a The values shown are mean. Different lowercases represent significant difference (p < 0.05) of the same group (adults and children) in different sampling sites, while the same lowercases show no significant difference. The same as below.
Table 5. Non-carcinogenic hazards (HQi) and carcinogenic risk (CRi) index of PTEs by dermal absorption.
SitenHQi via Dermal AbsorptionCRi via Dermal Absorption
HQCrHQZnHQCdHQPbHQAsHQHgHQSbCRCrCRCdCRPbCRAs
Adults
YJT182.23 × 10−2 ab3.10 × 10−5 c2.31 × 10−3 bc1.40 × 10−3 a1.82 × 10−3 b3.30 × 10−4 b5.07 × 10−1 b8.91 × 10−6 ab4.70 × 10−8 bc4.18 × 10−9 a2.74 × 10−7 b
SZS141.96 × 10−2 b3.76 × 10−5 bc4.34 × 10−3 bc2.84 × 10−3 a3.96 × 10−3 ab1.08 × 10−3 ab5.50 × 100 a7.85 × 10−6 b8.83 × 10−8 bc8.44 × 10−9 a5.95 × 10−7 ab
SYA192.47 × 10−2 a2.04 × 10−5 c7.84 × 10−4 c1.06 × 10−3 a1.27 × 10−2 a3.91 × 10−4 ab4.25 × 10−1 b9.88 × 10−6 a1.59 × 10−8 c3.15 × 10−9 a1.90 × 10−6 a
SXN251.99 × 10−2 ab4.20 × 10−5 bc4.22 × 10−3 bc2.52 × 10−3 a6.85 × 10−3 ab1.73 × 10−3 ab7.00 × 100 a7.94 × 10−6 ab8.58 × 10−8 bc7.50 × 10−9 a1.03 × 10−6 ab
SXS202.36 × 10−2 ab9.77 × 10−5 a1.19 × 10−2 a3.42 × 10−3 a1.26 × 10−2 a1.83 × 10−3 a3.78 × 100 ab9.45 × 10−6 ab2.43 × 10−7 a1.02 × 10−8 a1.89 × 10−6 a
LWC111.96 × 10−2 b7.52 × 10−5 ab7.70 × 10−3 ab1.97 × 10−3 a4.41 × 10−3 ab4.94 × 10−4 b1.04 × 100 b7.85 × 10−6 b1.57 × 10−7 ab5.86 × 10−9 a6.61 × 10−7 ab
Children
YJT183.84 × 10−2 ab5.35 × 10−5 c3.98 × 10−3 bc2.42 × 10−3 a3.14 × 10−3 b5.68 × 10−4 b8.73 × 10−1 b3.84 × 10−6 ab2.02 × 10−8 bc1.80 × 10−9 a1.18 × 10−7 b
SZS143.38 × 10−2 b6.47 × 10−5 bc7.48 × 10−3 bc4.89 × 10−3 a6.83 × 10−3 ab1.85 × 10−3 ab9.48 × 100 a3.38 × 10−6 b3.80 × 10−8 bc3.63 × 10−9 a2.56 × 10−7 ab
SYA194.26 × 10−2 a3.52 × 10−5 c1.35 × 10−3 c1.82 × 10−3 a2.18 × 10−2 a6.74 × 10−4 ab7.32 × 10−1 b4.26 × 10−6 a6.87 × 10−9 c1.36 × 10−9 a8.18 × 10−7 a
SXN253.42 × 10−2 ab7.24 × 10−5 bc7.27 × 10−3 bc4.35 × 10−3 a1.18 × 10−2 ab2.99 × 10−3 ab1.21 × 101 a3.42 × 10−6 ab3.70 × 10−8 bc3.23 × 10−9 a4.43 × 10−7 ab
SXS204.07 × 10−2 ab1.68 × 10−4 a2.06 × 10−2 a5.90 × 10−3 a2.17 × 10−2 a3.15 × 10−3 a6.52 × 100 ab4.07 × 10−6 ab1.05 × 10−7 a4.39 × 10−9 a8.13 × 10−7 a
LWC113.38 × 10−2 b1.30 × 10−4 ab1.33 × 10−2 ab3.39 × 10−3 a7.59 × 10−3 ab8.51 × 10−4 b1.79 × 100 b3.38 × 10−6 b6.75 × 10−8 ab2.52 × 10−9 a2.85 × 10−7 ab
Table 6. Non-carcinogenic hazards (HQi) and carcinogenic risk (CRi) index of PTEs by inhalation.
SitenHQi via InhalationCRi via Inhalation
HQCrHQZnHQCdHQPbHQAsHQHgHQSbCRCrCRCdCRPbCRAs
Adults
YJT183.88 × 10−2 ab5.16 × 10−6 c8.00 × 10−3 bc1.74 × 10−4 a6.19 × 10−4 b7.51 × 10−5 b2.41 × 10−2 b1.55 × 10−5 ab4.03 × 10−8 bc8.58 × 10−9 a9.38 × 10−7 b
SZS143.42 × 10−2 b6.25 × 10−6 bc1.50 × 10−2 bc3.52 × 10−4 a1.35 × 10−3 ab2.45 × 10−4 ab2.61 × 10−1 a1.37 × 10−5 b7.58 × 10−8 bc1.73 × 10−8 a2.04 × 10−6 ab
SYA194.31 × 10−2 a3.40 × 10−6 c2.72 × 10−3 c1.31 × 10−4 a4.30 × 10−3 a8.91 × 10−5 ab2.02 × 10−2 b1.72 × 10−5 a1.37 × 10−8 c6.46 × 10−9 a6.52 × 10−6 a
SXN253.46 × 10−2 ab6.98 × 10−6 bc1.46 × 10−2 bc3.13 × 10−4 a2.33 × 10−3 ab3.95 × 10−4 ab3.32 × 10−1 a1.39 × 10−5 ab7.37 × 10−8 bc1.54 × 10−8 a3.52 × 10−6 ab
SXS204.12 × 10−2 ab1.62 × 10−5 a4.13 × 10−2 a4.24 × 10−4 a4.27 × 10−3 a4.16 × 10−4 a1.80 × 10−1 ab1.65 × 10−5 ab2.08 × 10−7 a2.09 × 10−8 a6.47 × 10−6 a
LWC113.42 × 10−2 b1.25 × 10−5 ab2.67 × 10−2 ab2.44 × 10−4 a1.50 × 10−3 ab1.13 × 10−4 b4.92 × 10−2 b1.37 × 10−5 b1.34 × 10−7 ab1.20 × 10−8 a2.27 × 10−6 ab
Children
YJT186.94 × 10−2 ab9.21 × 10−6 c1.43 × 10−2 bc3.11 × 10−4 a1.11 × 10−3 b1.34 × 10−4 b4.30 × 10−2 b6.94 × 10−6 ab1.80 × 10−8 bc3.83 × 10−9 a4.19 × 10−7 b
SZS146.11 × 10−2 b1.12 × 10−5 bc2.69 × 10−2 bc6.28 × 10−4 a2.41 × 10−3 ab4.38 × 10−4 ab4.67 × 10−1 a6.12 × 10−6 b3.38 × 10−8 bc7.74 × 10−9 a9.11 × 10−7 ab
SYA197.69 × 10−2 a6.07 × 10−6 c4.85 × 10−3 c2.34 × 10−4 a7.68 × 10−3 a1.59 × 10−4 ab3.60 × 10−2 b7.70 × 10−6 a6.11 × 10−9 c2.88 × 10−9 a2.91 × 10−6 a
SXN256.18 × 10−2 ab1.25 × 10−5 bc2.61 × 10−2 bc5.58 × 10−4 a4.16 × 10−3 ab7.06 × 10−4 ab5.94 × 10−1 a6.19 × 10−6 ab3.29 × 10−8 bc6.88 × 10−9 a1.57 × 10−6 ab
SXS207.36 × 10−2 ab2.90 × 10−5 a7.39 × 10−2 a7.58 × 10−4 a7.63 × 10−3 a7.43 × 10−4 a3.21 × 10−1 ab7.37 × 10−6 ab9.31 × 10−8 a9.34 × 10−9 a2.89 × 10−6 a
LWC116.11 × 10−2 b2.23 × 10−5 ab4.76 × 10−2 ab4.36 × 10−4 a2.67 × 10−3 ab2.01 × 10−4 b8.80 × 10−2 b6.12 × 10−6 b6.00 × 10−8 ab5.37 × 10−9 a1.01 × 10−6 ab
Publisher’s Note: MDPI stays neutral with regard to jurisdictional claims in published maps and institutional affiliations.

