Article

Cell Length Growth in the Fission Yeast Cell Cycle: Is It (Bi)linear or (Bi)exponential?

1
Department of Applied Biotechnology and Food Science, Budapest University of Technology and Economics, Szt. Gellért tér 4., 1111 Budapest, Hungary
2
Department of Genetics and Applied Microbiology, University of Debrecen, 4032 Debrecen, Hungary
*
Author to whom correspondence should be addressed.
Processes 2021, 9(9), 1533; https://doi.org/10.3390/pr9091533
Submission received: 16 July 2021 / Revised: 18 August 2021 / Accepted: 20 August 2021 / Published: 28 August 2021
(This article belongs to the Section Biological Processes and Systems)

Abstract

:
Fission yeast is commonly used as a model organism in eukaryotic cell growth studies. To describe the cells’ length growth patterns during the mitotic cycle, different models have been proposed previously as linear, exponential, bilinear and biexponential ones. The task of discriminating among these patterns is still challenging. Here, we have analyzed 298 individual cells altogether, namely from three different steady-state cultures (wild-type, wee1-50 mutant and pom1Δ mutant). We have concluded that in 190 cases (63.8%) the bilinear model was more adequate than either the linear or the exponential ones. These 190 cells were further examined by separately analyzing the linear segments of the best fitted bilinear models. Linear and exponential functions have been fitted to these growth segments to determine whether the previously fitted bilinear functions were really correct. The majority of these growth segments were found to be linear; nonetheless, a significant number of exponential ones were also detected. However, exponential ones occurred mainly in cases of rather short segments (<40 min), where there were not enough data for an accurate model fitting. By contrast, in long enough growth segments (≥40 min), linear patterns highly dominated over exponential ones, verifying that overall growth is probably bilinear.

1. Introduction

Fission yeast has been an attractive model organism for several decades in studies of eukaryotic cellular growth [1,2,3,4,5,6,7]. Revealing the rules of cellular growth is crucial in understanding how size control mechanisms maintain size homeostasis in steady-state cell cultures, and this point has also been extensively studied in fission yeast [5,7,8,9,10,11,12,13,14,15,16,17,18,19,20,21,22,23,24,25,26].
Despite many extensive research projects on how fission yeast cells grow during the mitotic cycle, there is no general solution (or general rule found) for this problem [27,28]. It is a crucial point to determine the most adequate mathematical function which best describes the fission yeast cells’ growth patterns, because it can be an important stepping-stone to investigate the underlying molecular background. Moreover, knowing the growth regularities would help to establish robust in silico models describing the biochemical network of the cell cycle [29,30]. Many years ago, it was observed that fission yeast cells grow for about 75% of the cycle. At this point, cells (nearly) stop growing, and the last ~25% of the cycle is defined as the constant length phase [1]. Note that these yeast cells are rod-shaped with a constant diameter, elongating exclusively at the tips; therefore, cell volume is considered to be proportional to cell length [31,32,33]. As a consequence, one can easily measure length growth on time-lapse microscopic films to study this phenomenon, although one important paper argues that cell surface matters, which could be revealed in mutants having a significantly larger or smaller cell diameter than that of wild-type cells [34]. In this study, we may simply characterize cell size by length, as only cells of ‘normal’ width are examined. Cell mass and protein content, however, are thought to grow exponentially rather than linearly, at least during most of the cycle; meanwhile, the total protein concentration and the buoyant density of a cell are not constant, but have characteristic patterns between birth and division [26,28,35]. These findings prove that cell length and mass follow different growth kinetics.
As we restrict our research to cell length growth, it is important to emphasise that during the constant length period cells show little or no extension in length. As a consequence, growth pattern analyses are restricted to only the elongation period (the first ~75% of the cycle). It has previously also been observed that in some cases there is a short period with a higher growth rate at the beginning of the cycle, which could be caused by the rounding off of the cell tips, due to the turgor pressure [3]. Such abnormal parts should also be omitted from the pattern analyses.
To date, three different models have mainly been proposed to describe the cellular growth process during the fission yeast cell cycle [3,4,6,7,22,36,37,38]. First of all, the simplest linear model (with two parameters) assumes a constant growth rate during the elongation period, which is supported by tip growth [31]. However, in several cases a positive correlation has been detected between the growth rate and cell size, which is in contradiction with such a simple linear model [20]. Another possibility is the exponential model (also having two parameters), which relies on the simple logical assumption that growth rate is proportional to cell size [4]. However, the exponential model lacks the ability to demonstrate discrete events during the cell cycle, which might affect growth suddenly, such as DNA synthesis (gene dosage effect), or the NETO (New End Take Off) event, where monopolar elongation changes to bipolar. Note that in wild-type fission yeast cells of a steady-state culture, however, this gene dosage effect cannot be detected, because genome replication coincides with cell division, but it can be observed for example in the small wee1 mutant cells [20,21].The third model is the more complicated multilinear (mainly bilinear) model. These multilinear models propose that there are so called Rate Change Points (RCPs) within the elongation period, separating phases (or segments) of different linear growth rate. Such a bilinear model has been determined to be the most adequate mainly in fission yeast and also in some other model organisms [3,5,20,21,39,40,41].
Moreover, two different types of bilinear models have been introduced. The first type consists of two linear phases with a sudden change in the growth rate at the RCP (having four parameters), the function of which cannot be continuously differentiated at the RCP [3,36]. Applying such a function requires that the researcher should determine the RCP’s position oneself (mainly by eye). The second type of bilinear model has a smooth transition period linking the two linear segments, thus making the function continuously differentiable. In this case, a non-linear regression is suitable to position the RCP (rather than the researcher oneself), making the fitting more accurate. For ‘historical’ reasons, this RCP positioned by regression is designated as RCP2 later in this paper [5,20,22]. More precisely, this second type model is a linearized biexponential one (LinBiExp); however, it is often referred as ‘bilinear’ for simplicity [3]. Moreover, the LinBiExp function enables us to model both abrupt and smoothly changing growth rates, and it contains five parameters.
Certain discrete events during the cell cycle have probably considerable effects on the growing capacity of the cell, but even these events have some time requirements. Therefore, multilinear models with smooth transitions seem to be feasible. Recently the problem of distinguishing between bilinear and exponential models has been revisited by Rhind and co-workers. Their conclusion was that exponential model is a robust approximation for the fission yeast length growth, and the bilinear model’s adequacy is only caused by the substantial biological and experimental noise [6]. However, to our mind, these results are controversial. Enlarging the difference between the two (bilinear vs. exponential) models was achieved via artificially extending the cell cycle (namely the G2 phase, where the main growth occurs in fission yeast). Although these experiments favoured applying the exponential model over the bilinear one [6], blocking the cell cycle could have unforeseen effects on the growth; therefore, these results cannot be compared with other ones from experiments with steady-state cultures of wild-type fission yeasts or some cell cycle mutants.
In this paper, we analyse length growth patterns of many individual fission yeast cells, from cultures of wild-type and also of two different cell cycle mutants (one of them, pom1Δ, has never been used previously in similar studies). The cultures are steady-state ones, i.e., the cells are studied in a mid-exponential phase without any perturbation. The films taken for this study have much better spatial and time resolutions than our formerly analysed films [5,19,20,21,22,36]. In all these former studies, the length growth pattern data were smoothed before the analyses; however, the better resolution makes it possible to ignore smoothing in the present research. This is important, since some concerns often arise about smoothing patterns as described in [36]. In case of every cell’s length growth, we determine whether a linear, exponential or bilinear pattern is the most adequate one. The most important novelty of our present analyses is that in cases where the bilinear function is favoured, we further analyse separately the two growing segments to determine whether they are really linear (or rather exponential). Note that if the cell grew bilinearly, both of these segments should theoretically be linear. By contrast, if they were found both exponential in several cells, that would raise the possibility that a biexponential function was also worth to be fitted. In a former study, it was tested whether a biexponential function was also suitable to describe length growth in fission yeast cells, but it was generally not favoured [3]. However, we decided to reconsider this possibility here as well.

2. Materials and Methods

2.1. Strains, Media, and Film Techniques

The wee1-50 and pom1Δ mutant Schizosaccharomyces pombe strains were obtained from Jacqueline Hayles (Cell Cycle Laboratory, Francis Crick Institute, London, UK), and a h- wild-type (WT) strain from our lab collection has also been used for the analyses. The time-lapse films were made at the University of Debrecen, Department of Genetics and Applied Microbiology. The conditions were set to be quite similar to our previous experiments [21]. The strains were maintained on YEA (Yeast Extract Agar) complex medium, containing 3% glucose, 1% yeast extract and 2% agar. The cells were incubated at 35 °C for 24 h prior taking the films in 100–250 mL liquid EMM2 (Edinburgh Minimal Medium) [35]. During this incubation the cultures reached a mid-exponential phase with a cell concentration of ~106 cells/mL. A microscopical slide was inserted into a Petri dish, and then the dish was filled with the medium EMM2 with agar, which covered the slide. The cells in suspension were shifted onto this EMM2 agar pad about 10–20 min prior starting to take the films. The cells were proliferating at 35 °C between the pad and a coverslip during the filming, and the temperature was maintained via a Petri dish heater. We set the temperature to 35 °C in all our measurements, because this is the restrictive temperature for the wee1-50 mutant [42]. The photographs were taken with an Olympus BX40F-3 microscope with an Ach 40x/0.65 Ph2 objective, and a Dp-74 camera was attached. Software called DP Controller was used to set the frames taken every 2 min, for over ~6 h. We could study cells from two consecutive generations, but could not observe any significant difference between the generations; thereby, we may render it probable that the cultures were really steady-state ones.

2.2. Cell Length Measurements and Model Fittings

Cell size was measured via ImageJ (version 1.51k) program enabling additional magnification corresponding to about 150%. Every individual visible cell was measured in every frame from birth to division. As the photos had a relatively high resolution, the length growth patterns were not smoothed in contrast to several previous studies [5,6,20,21,22]. For every individual cell, the elongation period was determined by eye, omitting once the data of the constant length period, and sometimes also some data from the beginning of the cycle (if growth abnormalities occurred).
For the model fittings, three different mathematical functions have been applied as described previously [5,36,43]. The three analysed models were linear, exponential and bilinear—all giving cell length (L) as a function of time (t) during the growing period. The linear and exponential models both have two parameters and are given as L ( t ) = γ · t + σ , and L ( t ) = κ · e µ t , respectively. The bilinear (LinBiExp) model with five parameters had the function L ( t ) = η · l n [ e α 1 ( t τ R C P 2 ) η + e α 2 ( t τ R C P 2 ) η ] + ε . This model is a sum of two exponential terms, linearized by the natural logarithm (ln) function [36,43]. Although somewhat arbitrarily, this function can be separated into three segments; two linear ones described with α1 and α2 slopes, respectively, and a transition period connecting them. The τ R C P 2 parameter represents the position of the RCP2 (note that this rate change is generally not sharp), and the η parameter characterizes the width of the transition period between the linear segments. For technical reasons, an upper and a lower limit needed to be set for the η parameter, as discussed before. The fifth parameter (ε) is an additive constant, representing a hypothetical cell length at around RCP2 [5,36].
The fittings were executed via Microsoft ® Excel using the Solver Add-in to determine the parameters, which resulted in the best fits, i.e., having the minimum SSE (sum of square errors) values. In some cases, the bilinear fitting resulted in two (or even more) solutions, as local SSE minima arose, but generally the global minimum could easily be obtained by comparing the relevant SSE values. Moreover, the most adequate model for the cells’ growth pattern could not be selected by comparing their minimal SSE values, as the models differed in their parameter numbers (npar). Relying on our previous observations, the most adequate model was selected by the statistical model selection criterion AIC (Akaike Information Criterion), which is defined as AIC = nobs∙ln(SSE) + 2∙npar. Here, nobs represents the number of observations and npar represents the number of parameters of the model [5,20,22]. In some cases where severe abnormalities were detected during the bilinear fitting, such a bilinear model was rejected to be the most adequate one, and the second best model (either linear or exponential) was chosen instead.

2.3. Further Analyses of Bilinear Patterns

Those patterns from all the three cell cultures, where the bilinear model was selected to be the most adequate one, were further analysed. Relying on the data obtained from the initial fitting, the two growth phases (before and after the omitted transition period) were separately analysed. By applying the same fitting method, it was determined whether the linear or the exponential model is more adequate for each growing phase.
We analysed by two-sample t-tests (p < 0.05) in each fission yeast culture to determine if there were any significant differences between the duration of the growing periods in linear vs. exponential cases. First, we compared all the existing linear growing phases with that of all the existing exponential ones. Next, we separated the first (before RCP2) and second (after RCP2) growing periods, and again we compared the duration of these phases in linear vs. exponential patterns. Finally, we separated the growing periods into short (<40 min) and long (≥40 min) groups, and examined again if there were any significant differences between the durations in linear vs. exponential subgroups. Distinguishing between short and long growing phases is important, because the results of these fittings are much more relevant in long than in short ones. Although this borderline (40 min) seems to be arbitrary, it is rather based on two important considerations. Once it is about 1/3 of the total elongation part of an average WT cell (~120 min), moreover, such a period consists of 20 (probably large enough) measurements. We expect that in the short growing phases the adequate model (linear or exponential) might even be random because of too few data. However, if any tendency really exists, it might probably be observed in the long growth phases consisting of more data. For the statistical tests, the Minitab 14.13 (Minitab, State College, PA, USA) software has been used.

3. Results

3.1. Growth Patterns in Different Cell Cultures

To study the growth patterns in the three different fission yeast cell cultures, we have measured and analysed cell length from birth to division, individually in 61 WT, 93 wee1-50 and 144 pom1Δ cells. All the measured WT, wee1-50 and pom1∆ data are given in Table S1. The generation time (measured as the mean of the studied cells’ cycle times) was 150.2 ± 18.4 min for WT, 155.9 ± 36.5 min for wee1-50 and 153.1 ± 30.4 min for pom1∆, being consistent with literature data [21]. Analysing the wee1-50 mutant is interesting, as cells of this mutant are small and have a generation time similar to WT, but have quite different distribution of cell cycle phases compared to WT [44,45]. The protein encoded by the wee1 gene is a highly conserved cell cycle regulator among eukaryotes [46,47]. The pom1 gene encodes an upstream regulator of the Wee1 protein, which is localized in the cell cortex with a decreasing spatial gradient from the poles to the middle of the cell [14,48]. The pom1∆ mutant cells divide rather asymmetrically (compared to WT) and therefore the culture has a broad range of birth length [48,49]. As a consequence, cycle time also varies much in this mutant; therefore, it is an interesting one to be examined (although formerly not applied in similar studies). Moreover, a large number of cells are worth being involved in the analyses. It is noteworthy that the Pom1 protein is not conserved at all, but is unique to the genus Schizosaccharomyces [47].
The manually measured cell length data were plotted versus time, thus obtaining the growth profile of each cell. Note that the birth length of a cell is generally larger than half of its division length, which is a consequence of the new cell ends’ rounding-off from the septum. Three different models (linear, exponential and bilinear) were fitted on every cell’s growth pattern (for a representative example, see Figure 1). The most adequate model has been determined for every cell via calculating the relevant AIC values, which led to the conclusion that the majority of the cells (~60−70%) were best described by the bilinear model (Table 1). Approximately 23−33% of the cells was found to show linear-like growth and the exponential model was adequate in less than 10% of all cells in any culture (Table 1). These results definitely strengthened our previous results regarding the growth pattern types and their distribution in fission yeast cells [5,20,22].

3.2. Further Growth Pattern Analyses of the Adequate Bilinear Cases

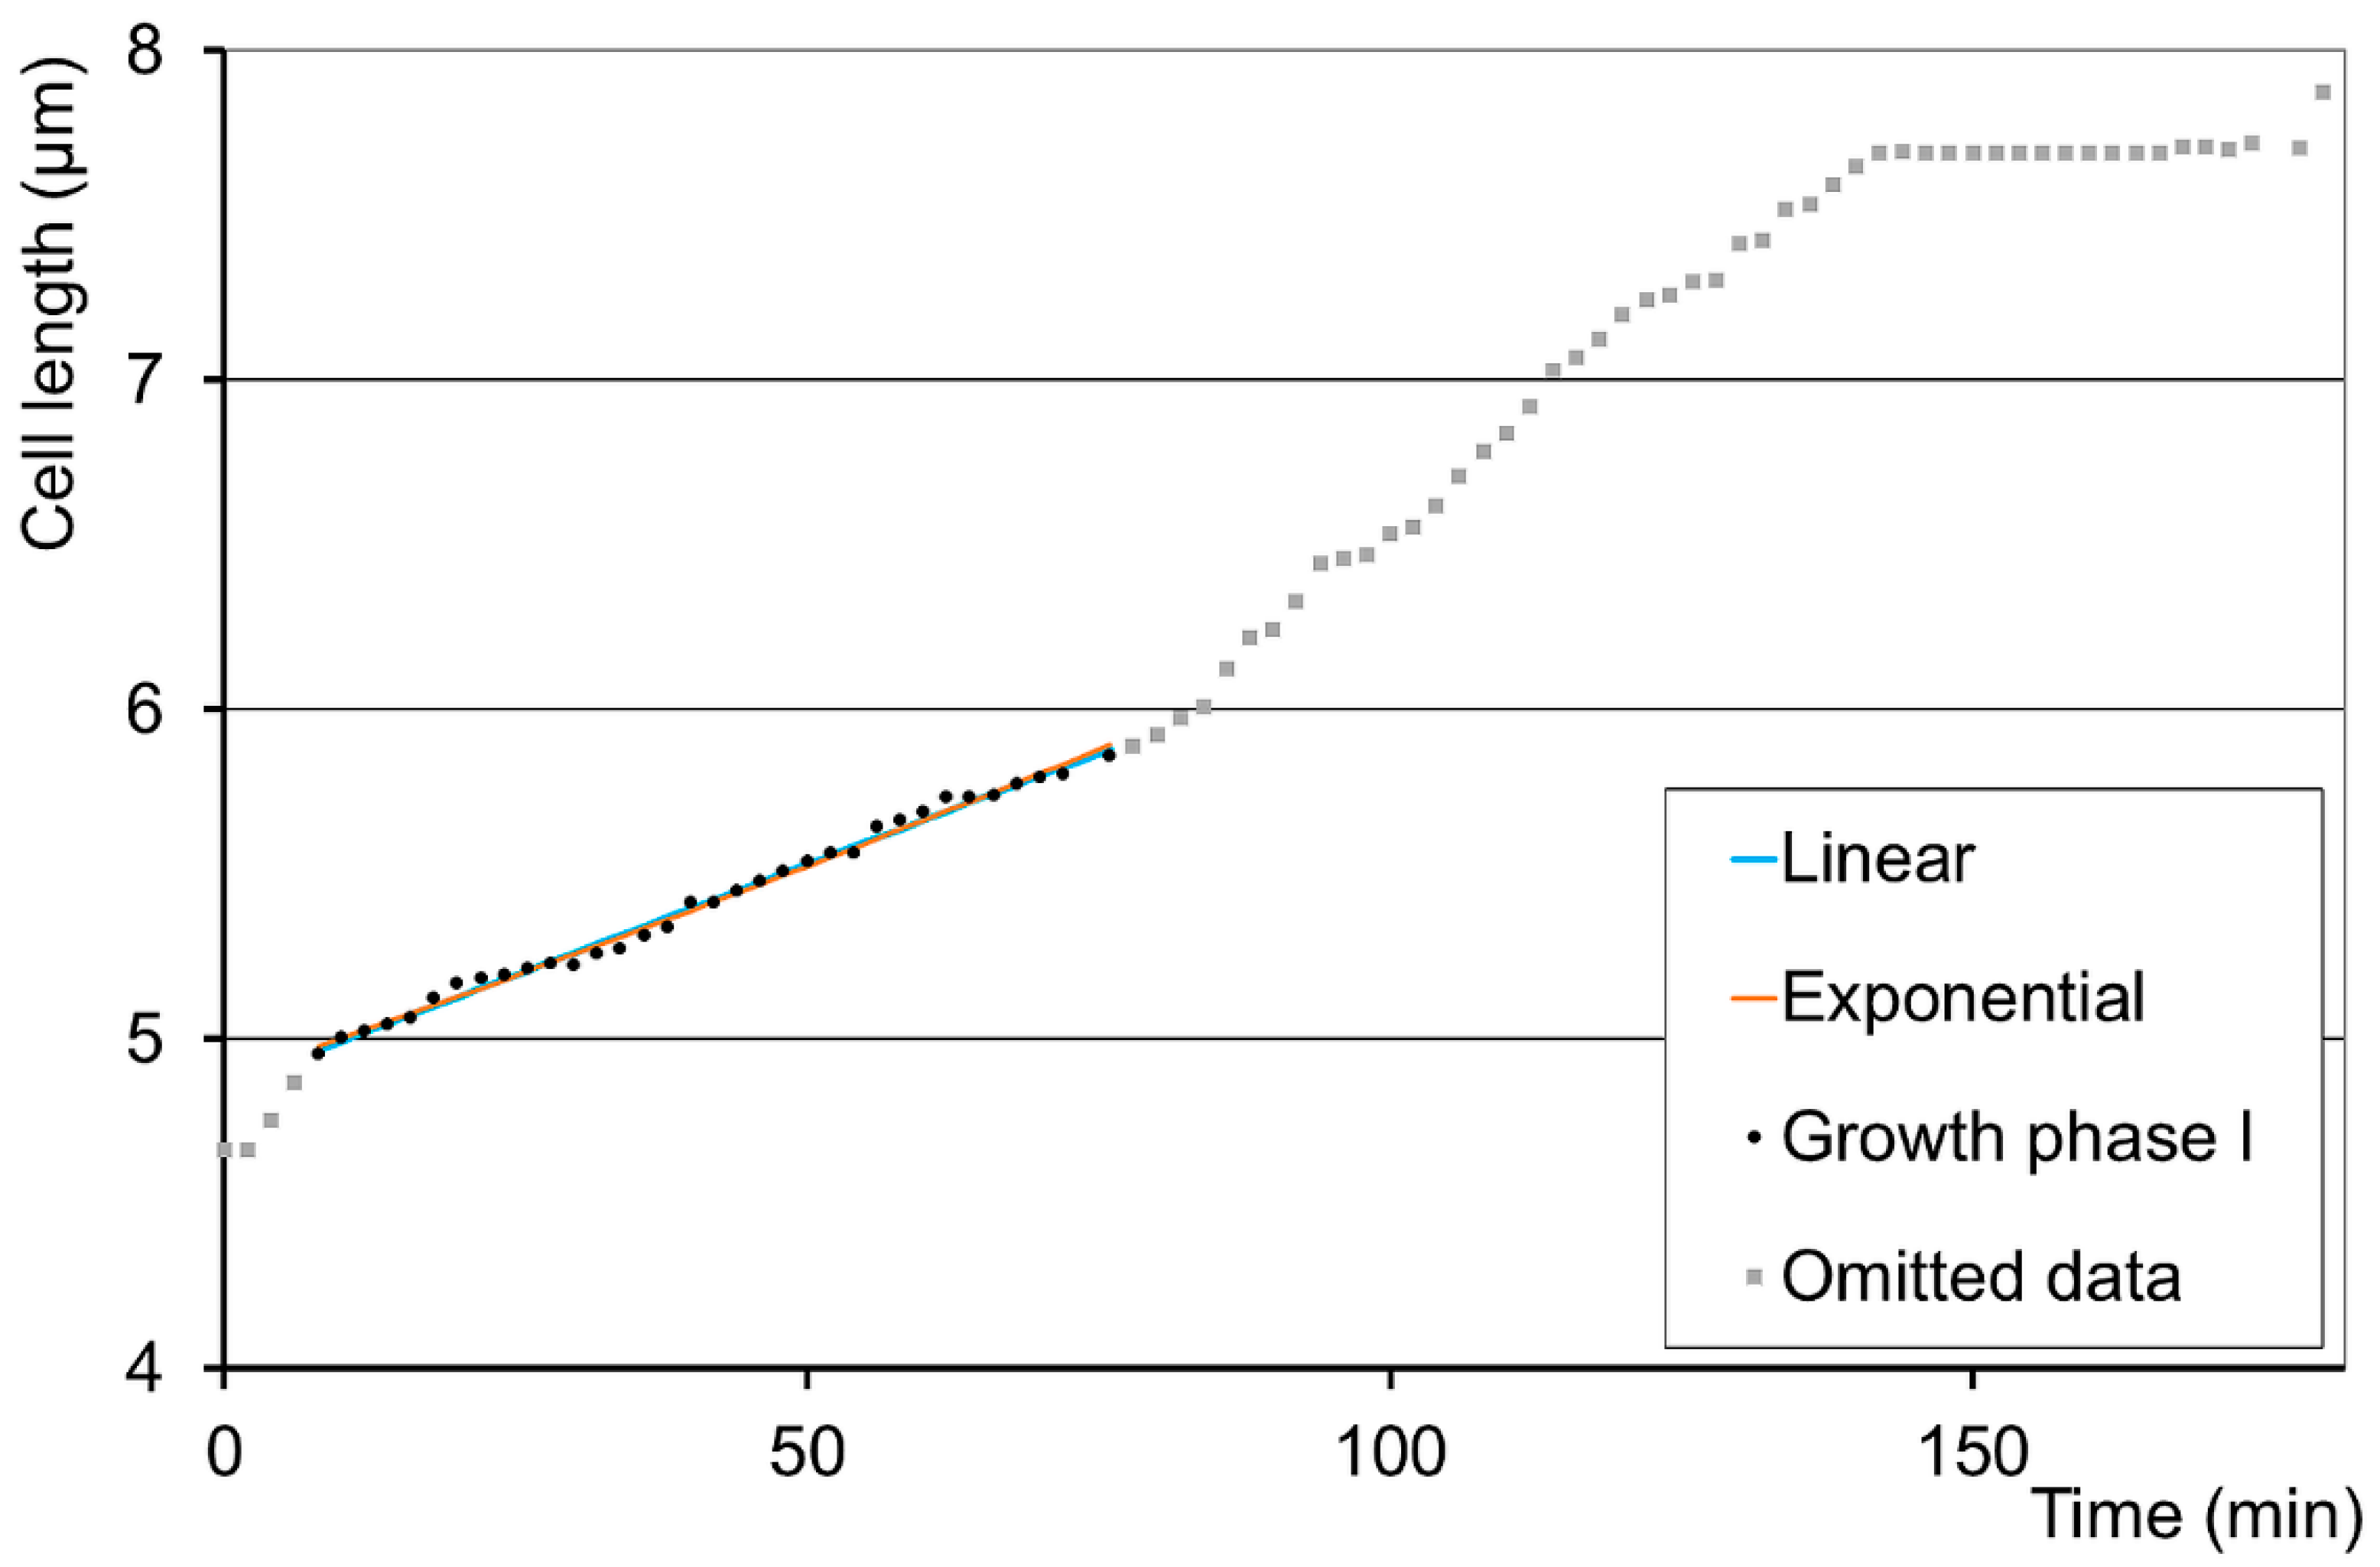
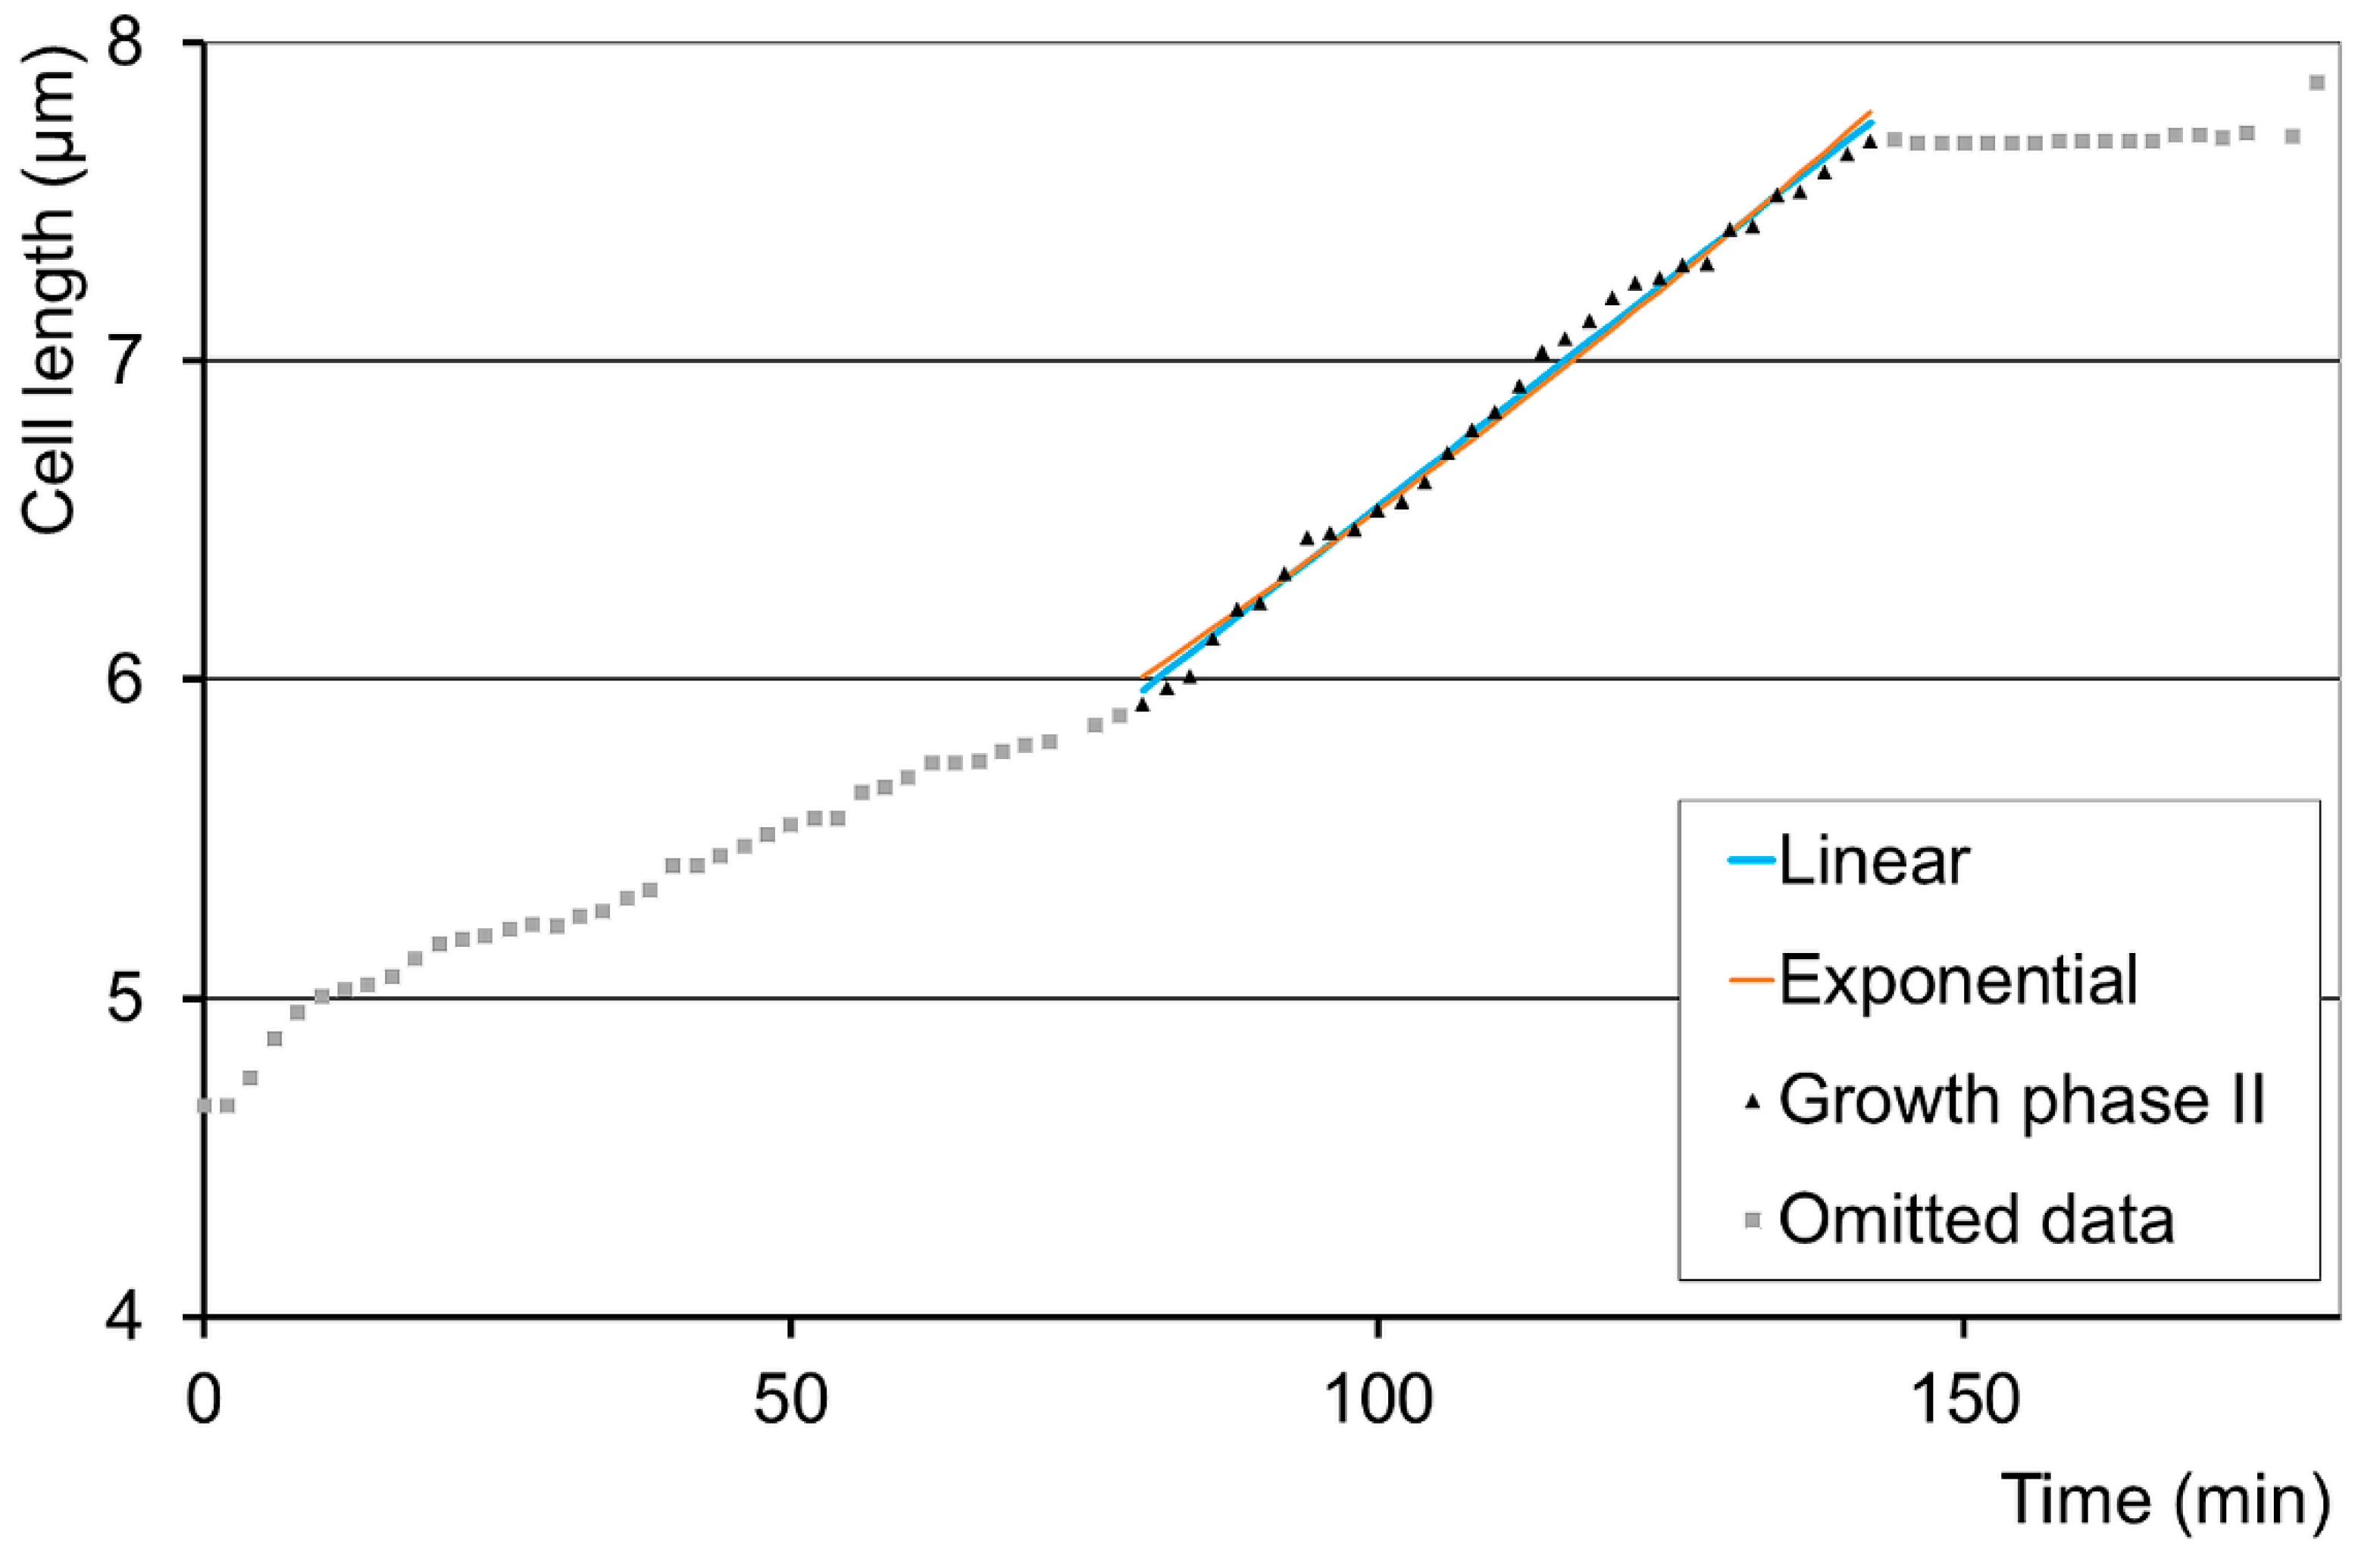
To ensure the adequacy of the LinBiExp model, the cells of which growth patterns were found to be best described as bilinear have been further analysed. Note that our bilinear model consists of two linear growth segments (called I and II) linked with a transition period (Figure 1). These linear segments have been further analysed to determine whether they were really linear or not. Omitting the data belonging to the transition period was based on mathematical considerations of the LinBiExp model [5,36]. By using the data exclusively from either growth phase I or II, linear and exponential functions were fitted (see Figure 2 and Figure 3 for the same representative cell as is shown in Figure 1). It is also noteworthy that the difference between the linear and exponential fitting is sometimes extremely small, mainly in growth phase I (Figure 2), if the cell’s growth rate is low. By contrast, if the growth rate is large enough (as in growth phase II), then the difference between the two fittings is much more visible (Figure 3).
As the linear and exponential functions both have two parameters, the more adequate model could be determined via simply the SSE values here. We have found that there was a remarkable heterogeneity between the adequate growth patterns in all the strains studied (Table 2, Table 3 and Table 4). Since the exponential model can be more easily differentiated from the linear one in longer growing periods, we investigated if the duration of the growth phases had any impact on the favoured model. In all the three cell cultures, it was worth examining all the growth phases, and then separately only growth phase I, and only growth phase II (Table 2, Table 3 and Table 4). The results clearly indicate that the short duration growth phases (<40 min) show a much larger heterogeneity than the long ones (≥40 min), as few data make the fittings less accurate. Long growth periods are much more frequently characterized with the linear model than the exponential one (Table 2, Table 3 and Table 4). Relatively more exponentially growing phases have been observed among the short ones, as proposed. To confirm the observations, statistical tests have been performed separately on all the three cell cultures, once for all the studied growing periods and also for the separated subgroups (growth phase I/II; short/long periods). In the next sessions, we interpret these results first in wild-type cells, then in the mutants.

3.3. Analysis of Growth Phases in Wild-Type Cells

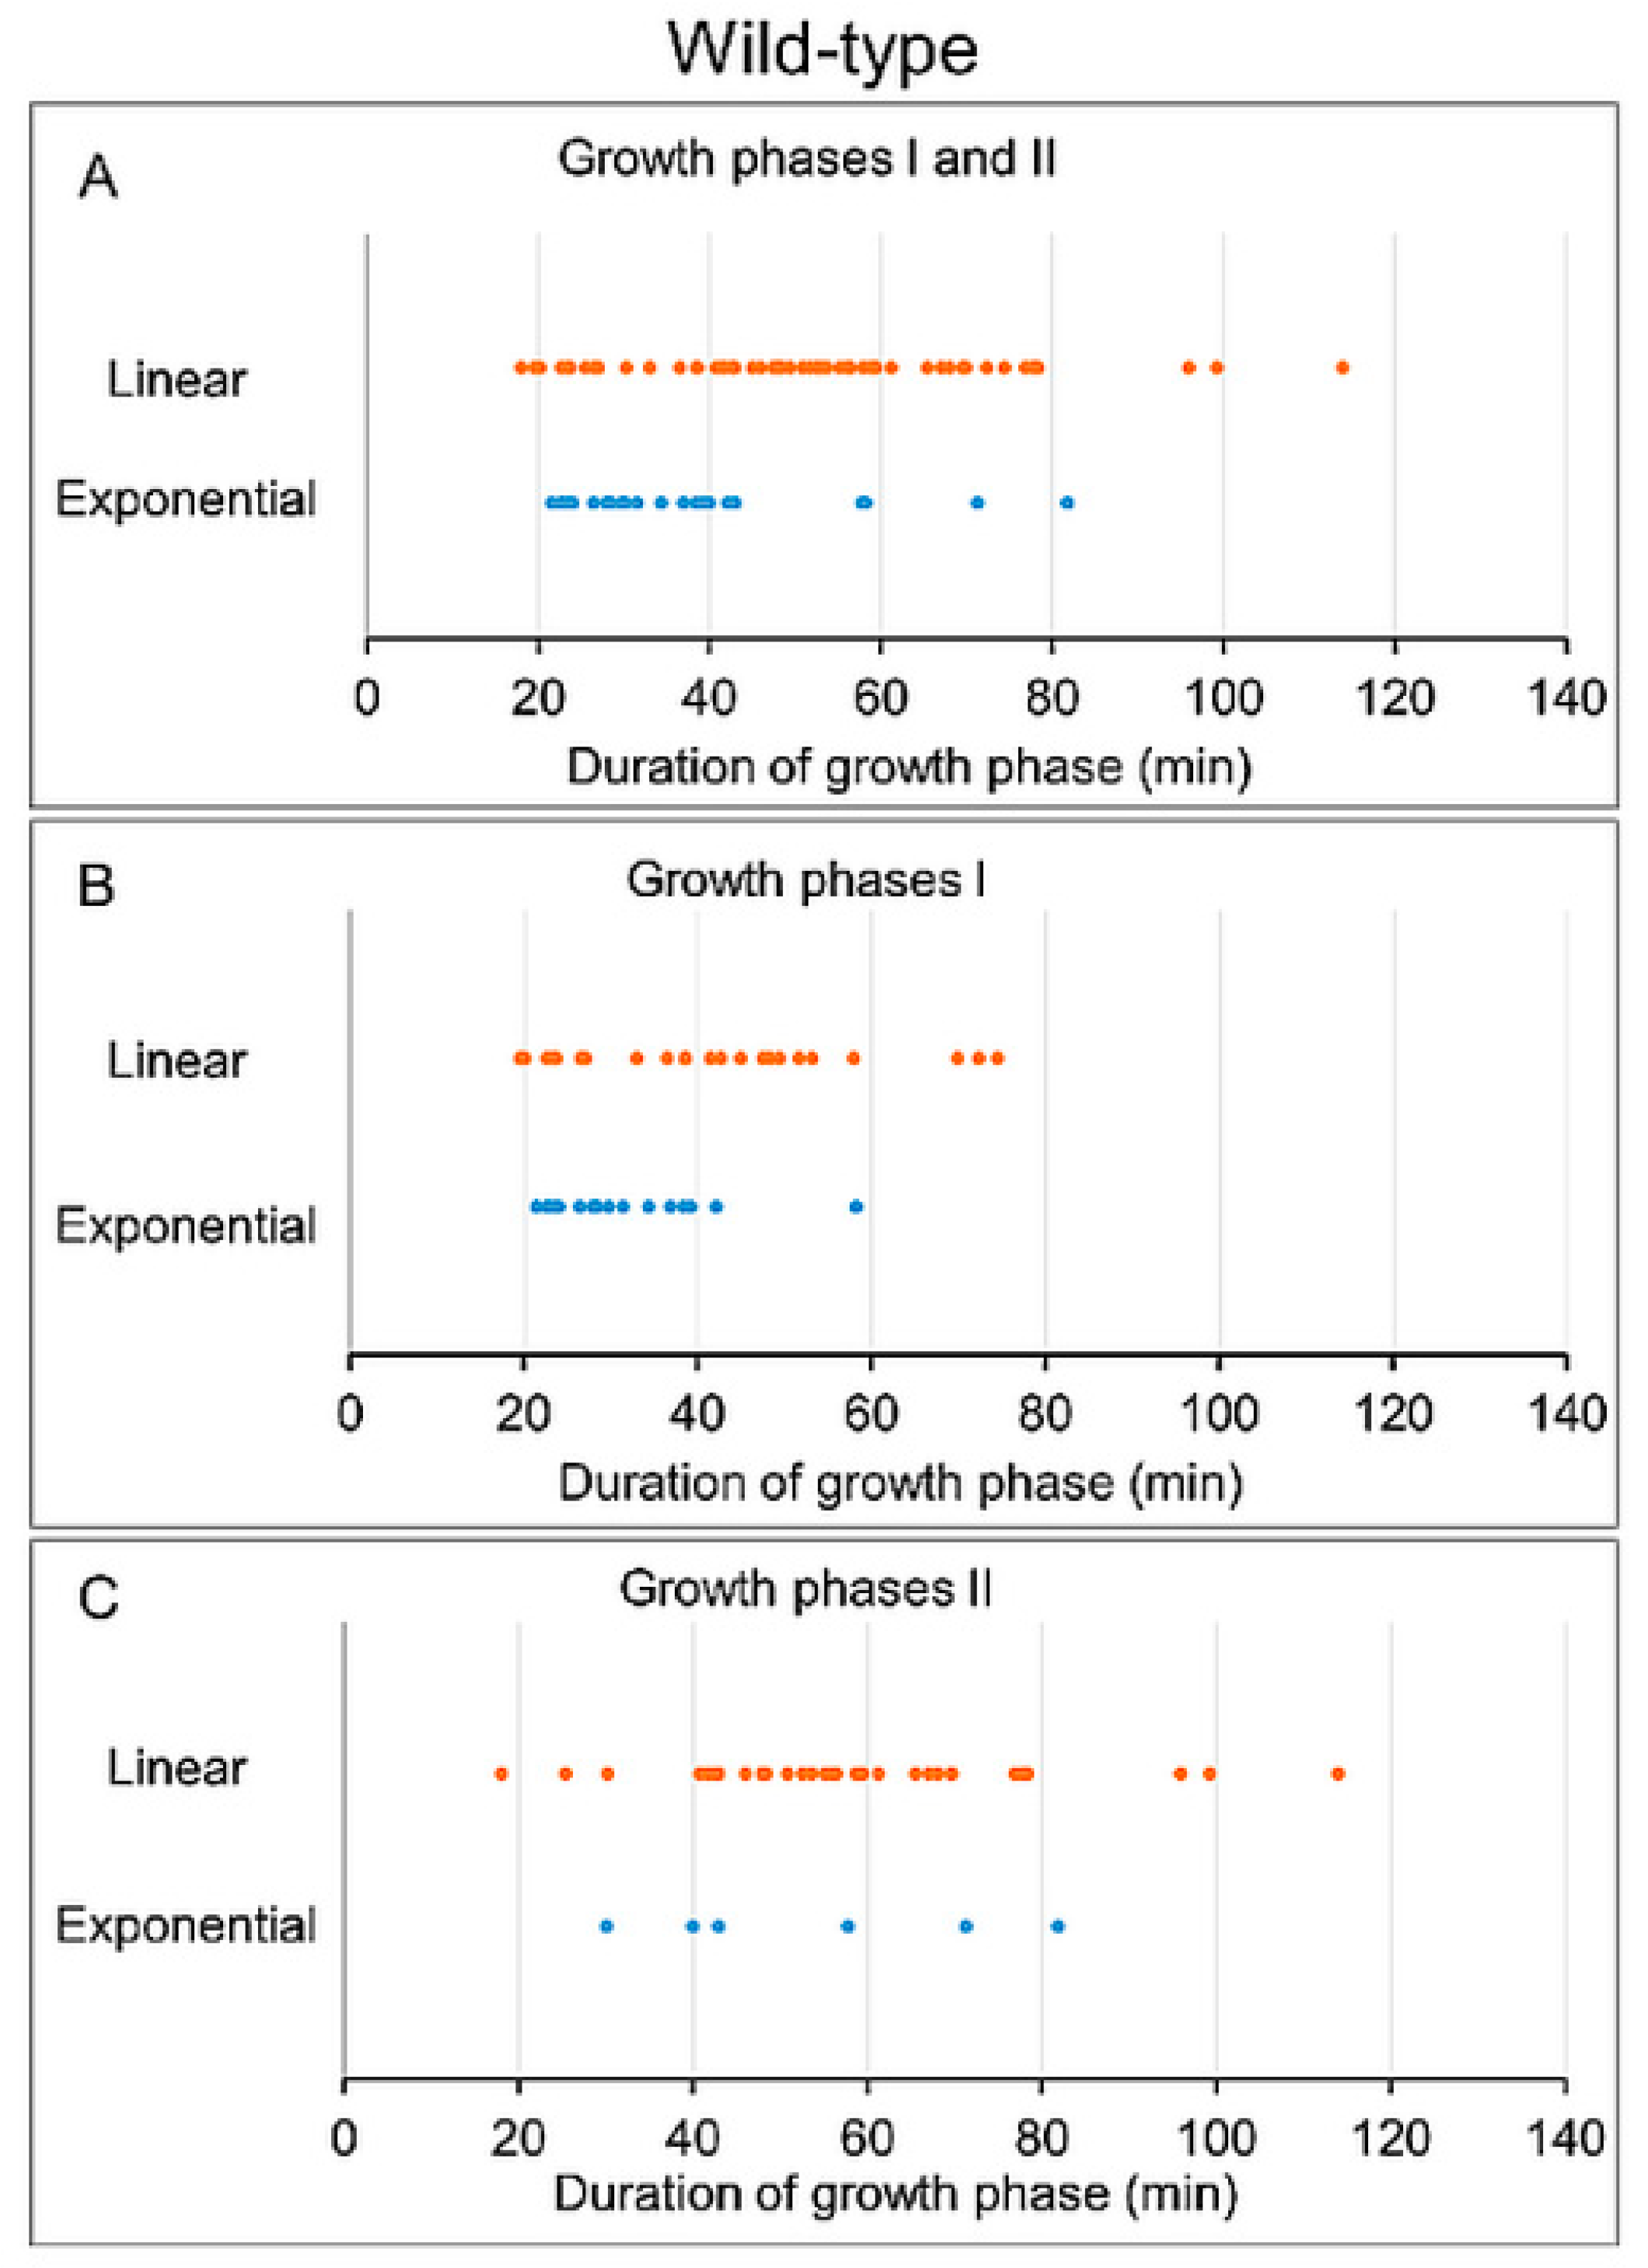
The distribution (linear or exponential) of the growing periods’ duration for WT is shown in Figure 4, while the corresponding statistical analyses are given in Table 2. The overall data indicate that the growth phases determined to be linear have a significantly longer duration than those of exponential ones (Figure 4A). The same statement is true for growth phase I (Figure 4B), but not for growth phase II (Figure 4C). In the latter case, note that we have observed only six exponential cases (Table 2), which is a small number of observations for the relevant statistics. Table 2 also indicates that the linear patterns (57/80 = 71%) dominate over exponential ones (23/80 = 29%), supporting our hypothesis that length growth in fission yeast is generally linear (or bilinear). This dominancy of linear patterns is even more obvious in growth phase II patterns, which are generally longer than growth phase I. All these data seem to indicate that the longer the studied segment, the larger the probability of its linearity.
In the subgroup of short segments (<40 min), the studied 30 cases were nearly equally distributed into linear and exponential ones; moreover, there is no statistical difference between their durations, neither in growth phase I, nor in growth phase II nor in both analysed together (Table 2). Further, observe that in growth phase II, there are only an extremely small number of such cases. As a consequence, this subgroup contains data mainly from the growth phase I periods; moreover, the short period means that there is an insufficient amount of measurements in these segments, making the fitting inaccurate. Thus, the distribution between the two models became rather random. Finally, in the subgroup of long segments (≥40 min), there are hardly any exponential patterns, which makes the statistical comparison nearly impossible. The fraction of linear patterns is 86% (43/50), and again there is no statistical difference between the duration of linear vs. exponential ones, neither in growth phase I, nor in growth phase II nor in both analysed together (Table 2).

3.4. Analysis of Growth Phases in Wee1-50 Mutant Cells

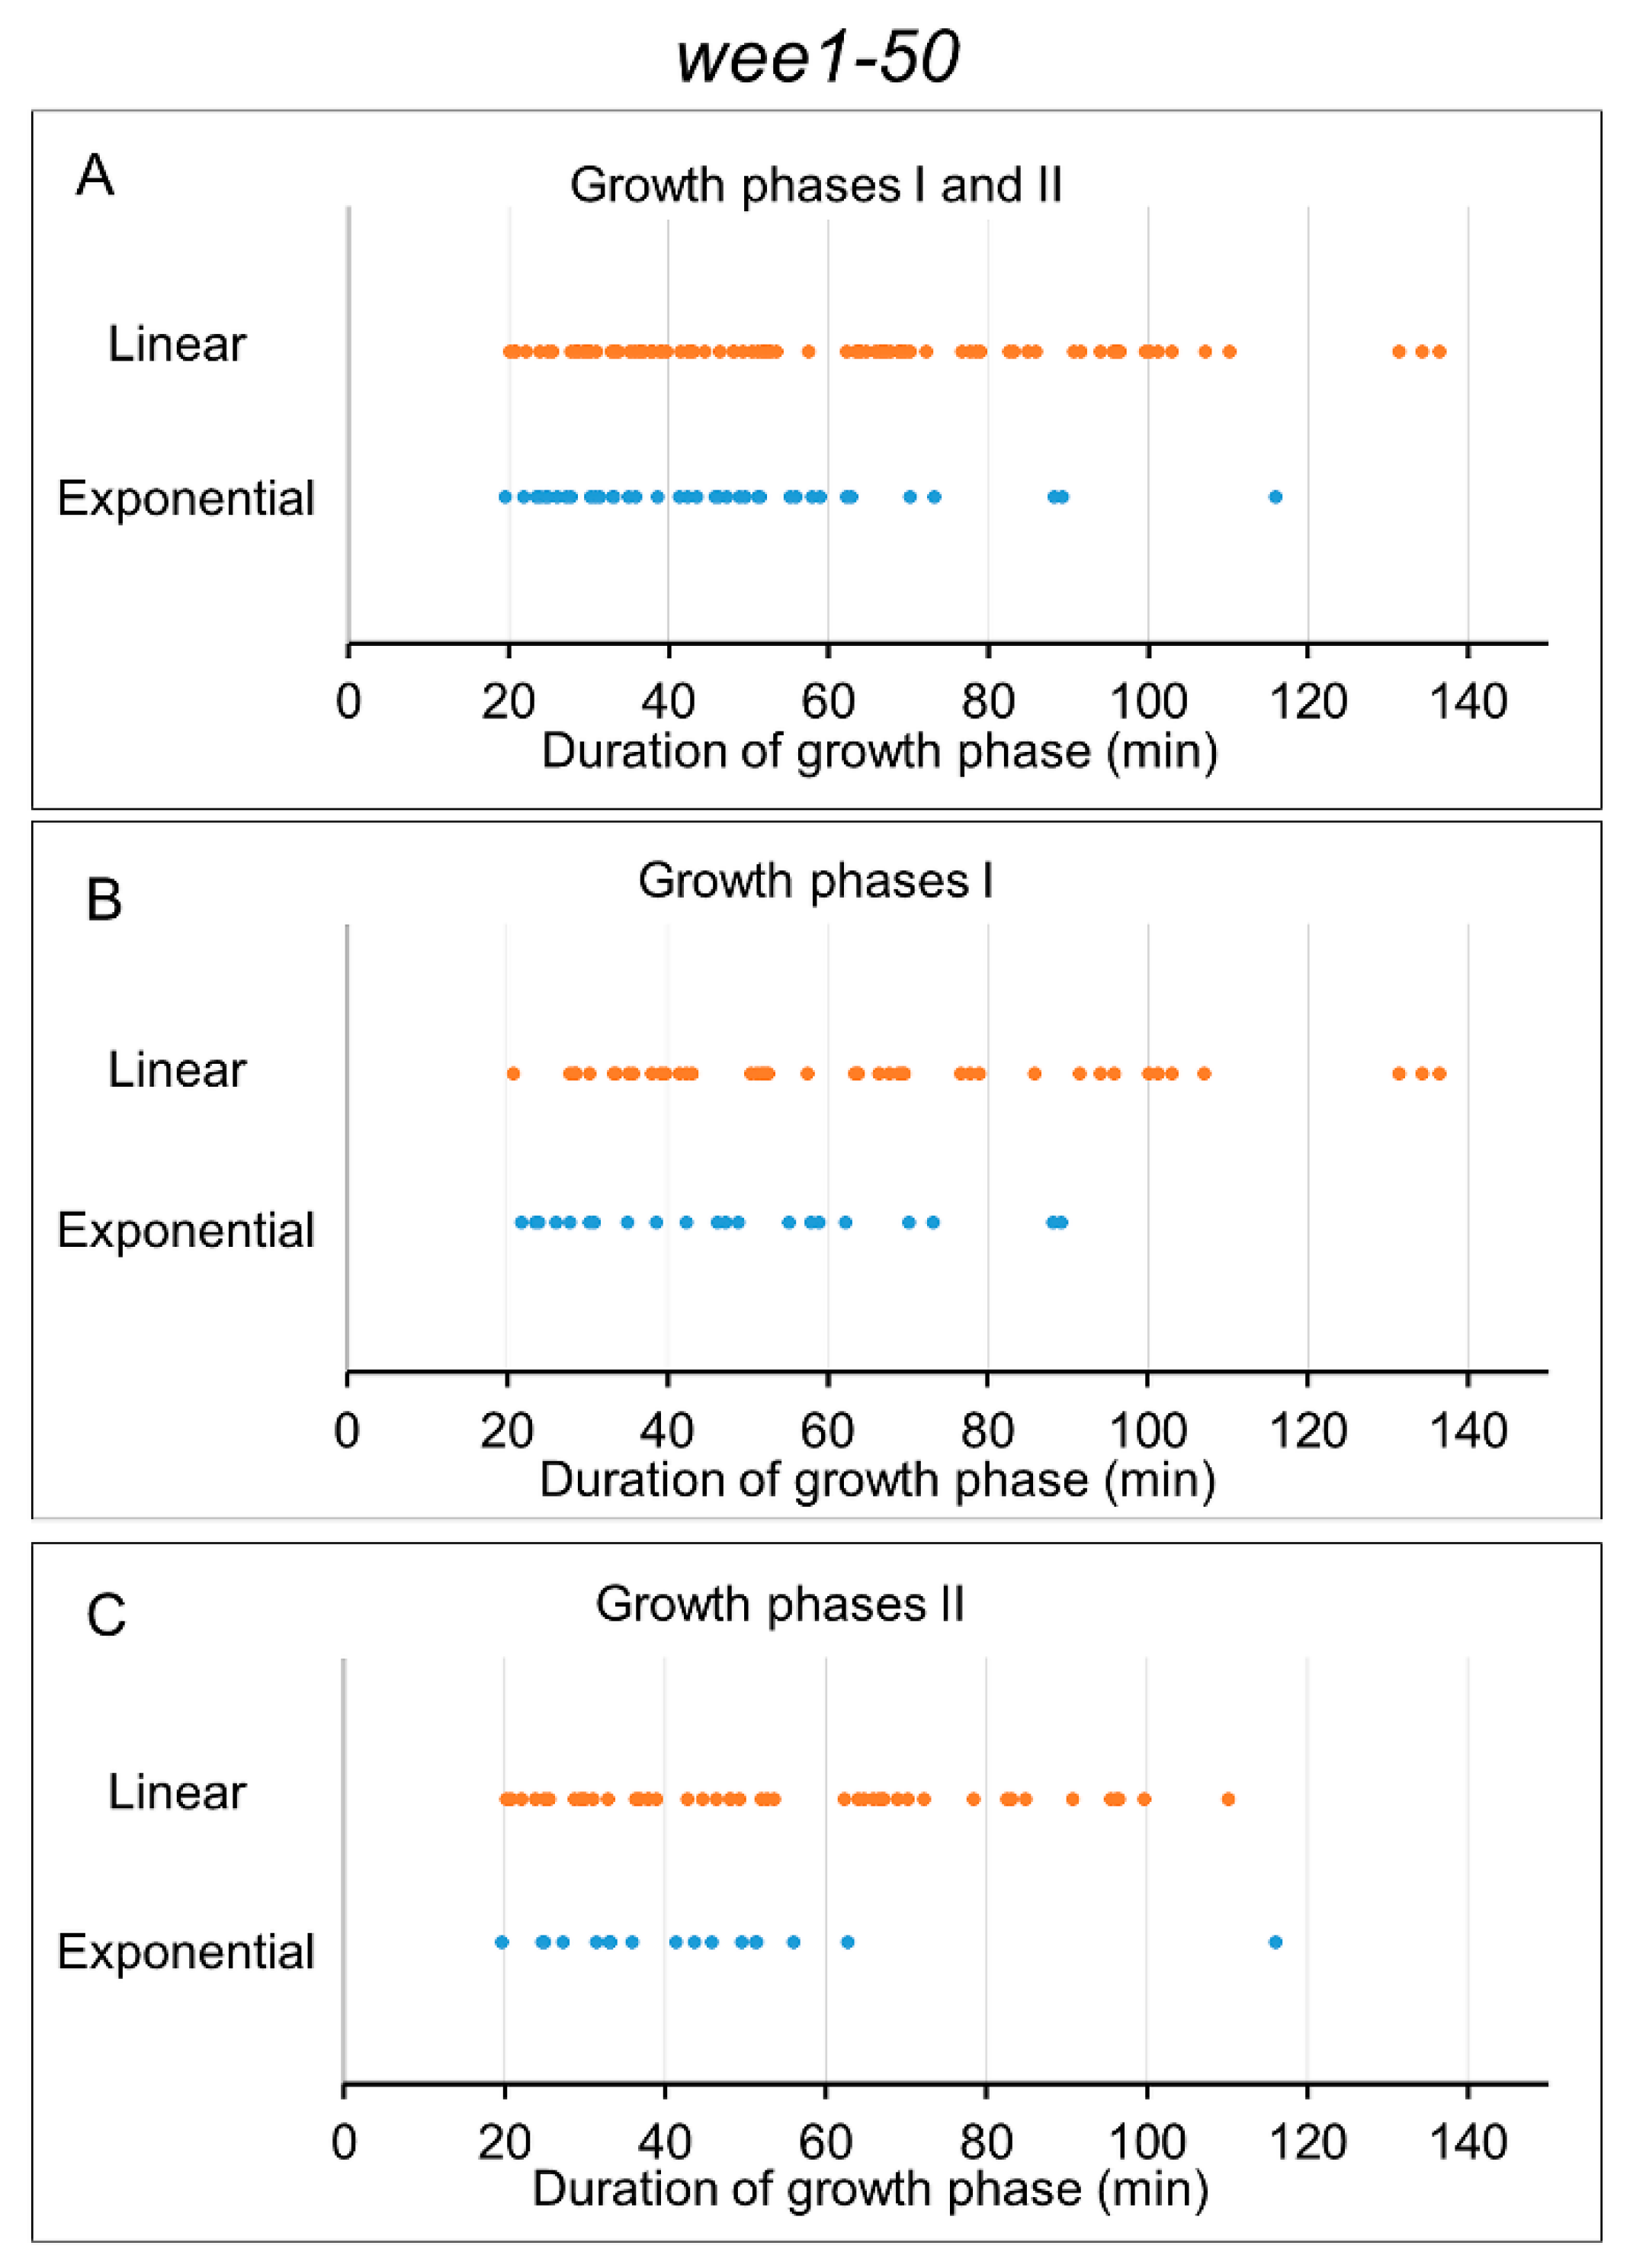
Results for the small sized wee1-50 mutant fission yeast cells are shown in Figure 5 and Table 3. Compared to WT, growth phase I is much longer in this mutant (and growth phase II is a bit shorter), as RCP2′s position is (in average) later in the cycle here. The results of the two-sample t-tests about the wee1-50 mutant growth phases are similar to that of WT. Linear patterns are significantly longer than exponential ones amongst all the measured segments (Figure 5A), and also amongst growth phase I patterns (Figure 5B), but they are not significantly longer amongst growth phase II patterns (Figure 5C). In the latter case, although the mean value of linear segments is about 11 min longer than that of exponential ones, the large standard deviations (above 20 min) mean that the difference is statistically not relevant (Table 3). Again, linear patterns (91/130 = 70%) absolutely dominate over exponential ones, but in this case such a dominancy is valid both in growth phases I and II.
In this mutant, a linear dominancy (31/49 = 63%) is visible even in the short segments (<40 min, Table 3); however, the difference between the durations is also not significant. The linear dominancy (60/81 = 74%) is even larger amongst the long segments (≥40 min, Table 3); moreover, the differences between the durations of the phases are significant here (again with the exception of growth phase II). The background of this significance is that there were more segments analysed in these mutants, which enabled more relevant statistics. Taken together, the tendency that longer growth periods are rather linear than exponential is even more obvious in the wee1-50 mutant than in WT.

3.5. Analysis of Growth Phases in Pom1δ Mutant Cells

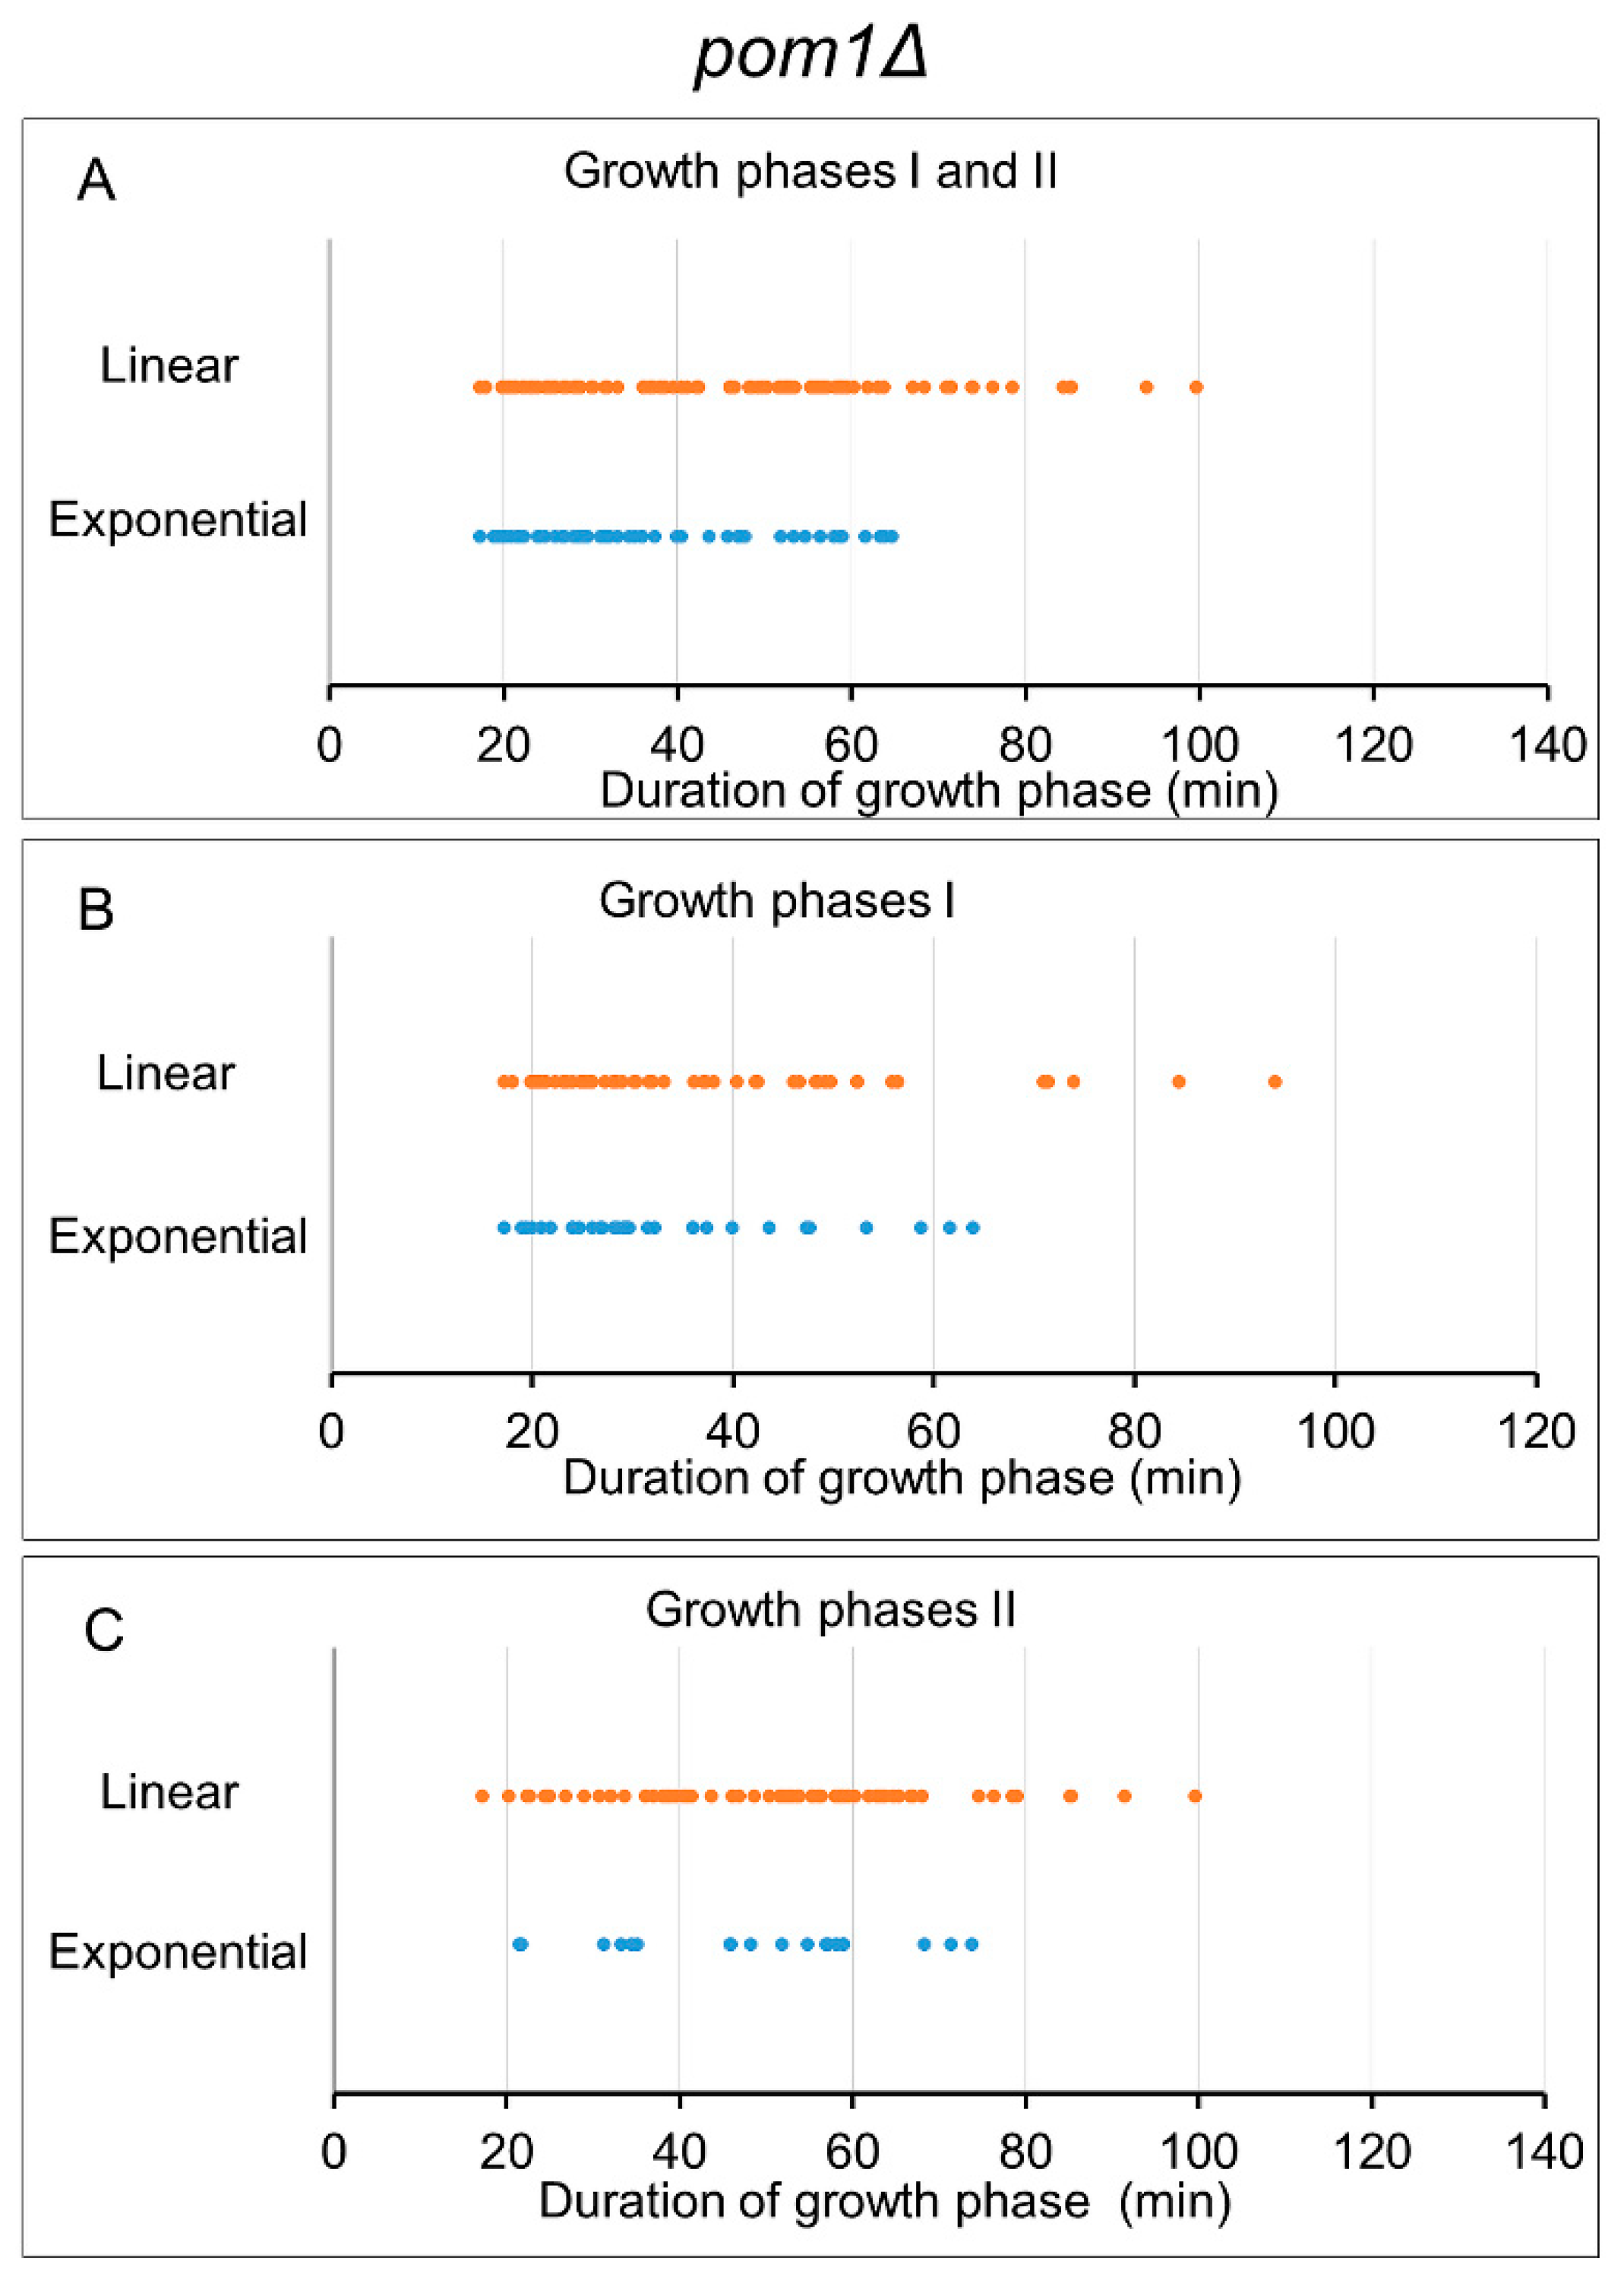
Results for the pom1Δ mutant fission yeast cells are shown in Figure 6 and Table 4. These cells’ size at division is close to WT; therefore, their growth phase II duration is longer than that of the growth phase I. The p values indicate that the linear growing phases are significantly longer than the exponential ones (Table 4), if we consider all the data (Figure 4A) or only growth phase II data (Figure 4C). The two-sample t-test for the growth phase I data (Figure 4B), however, shows that there is no significant difference between the linear and exponential cases. The latter unexpected result might have been caused by the fact, that the durations of the growth phase I periods are generally short in this mutant, their averages are below 40 min (Table 4), which makes the fittings less accurate. By contrast, the significance amongst growth phases II might be a consequence of how we have analysed more segments here than either in WT or wee1-50. In this mutant, linear patterns (120/170 = 71%) again absolutely dominate over exponential ones, and in this case such a dominancy is valid both in growth phases I (54/85 = 64%) and II (66/85 = 78%), but in varying degrees.
Examining the subgroup of short segments (<40 min), it was observed that linear patterns are dominant even here (52/85 = 61%), but there were no significant differences between linear and exponential data at all (similarly to the other two cell cultures). Results from the subgroup of long segments (≥40 min) indicated an absolute dominancy of linearity (68/85 = 80%), which is similarly valid both in growth phases I and II. Significant difference was detected in the tests including either all the growth phases or only the growth phase II data, similarly to the combined analyses of the all the short and long segments discussed above.

3.6. Analysis of Both Growth Segments in the Same Cells

In this study, we have examined a large number of cells in three different steady-state fission yeast cultures. Among them we have found 190 bilinear patterns, and afterwards analysed further all the 380 growth segments of them. More than 70% of these segments were found to be linear rather than exponential, and considering only the long segments (≥40 min) pushed this linear bias above 80%. To our mind, these results further strengthen the adequacy of the bilinear (LinBiExp) model, which has been used for many years in our group to describe cell length growth in fission yeast [5,20,36].
Until now, we have analyzed all the individual growth patterns separately. However, any cell might even have a ‘bilinear’ pattern, whose phase I might be linear and its phase II exponential, or vice versa, or both might be the same type (either linear or exponential). Finally, therefore, we have examined this point, i.e., what about the two growth patterns of the very same cell, and how they behave and distribute in the cell cultures (Table 5)? Since we have argued formerly that the short segments’ (<40 min) growth patterns are probably randomly distributed, we excluded them from these analyses. Rather, we limited this examination to exclusively those cells whose growth phases (I and II) are both long (≥40 min), as they are reliable. Unfortunately, a small number of cases (11–22 cells) were found in all the three strains (Table 5), which did not enable us to apply any reliable statistics. On the other hand, handling these data (45 cells) altogether showed that in most cases (32 cells, 71%) both segments were found to be linear, and only in three cases (7%) were they both found to be exponential. In the remaining cases, a mixed model (either linear-exponential, or exponential-linear; ~10% each) was the best fitted one (Table 5). These analyses also reinforce that probably the bilinear function is generally the best to describe cell length growth in fission yeast, at least among the usually applied models.

4. Discussion

Finding a universal mathematical model to describe cellular growth has been found to be controversial; however, among several other eukaryotic species, fission yeast is an essential one in these studies. While some studies claimed that the growth pattern can be best described as exponential [4,6,7], other research groups showed heterogeneity in different fission yeast strains, but with a dominating number of bilinear growth patterns [3,5,20,21,22]. Applying the LinBiExp function to model a bilinear growth pattern also makes the description of transition periods between linear segments possible; moreover, with different abruptness [36]. This model is based on the assumption that certain discrete molecular events during the cycle might cause rate changes in growth; moreover, the punctuality of these events in the individual cells can differ, thus resulting in more or less abrupt (or smooth) transition periods. Based on this hypothesis, an adequate exponential model for some cells is the extreme case of a bilinear one with an abnormally wide transition period. Furthermore, an adequate linear function for several cells is another extreme case: RCP2 is probably pushed back to the beginning of the cycle here [22].
Recently the adequacy of the bilinear model was claimed to be extinguished by a research focusing on the difference between exponential and bilinear functions, as the cells were examined for a long time [6]. In steady-state cultures, the difficulty of distinguishing between these two models is the short range of the elongation period (~120 min), which makes the fitted curves’ difference small. Blocking the cell cycle increases the elongation period; however, it also causes a serious physiological intervention in the cells. Therefore, in this paper a different approach has been introduced: we went back to study steady-state cultures without any perturbations during the experiments. Moreover, the adequacy of the bilinear models has been confirmed by statistical analyses of the individual cells’ separate growth phases (before and after RCP2). These analyses support that the two growth phases, separated by the transition period, are mainly best described with constant growth rates, i.e., with linear functions.
Although the initial results showed heterogeneity in the favoured model of the growth phases (linear/exponential), an extensive statistical analysis has revealed some interesting tendencies. Growth phases with short duration (<40 min) caused inaccurate fittings, which resulted in rather random distribution between the two possible models (linear/exponential). By contrast, growth phases with long enough duration (≥40 min) generally showed a domination of linear patterns over exponential ones. Analysing three different cell types (WT, wee1-50 and pom1Δ) has provided more evidence supporting the feasibility of the applied methods. The significant difference between the duration of the linear vs. exponential segments could be observed before the transition period (growth phase I) in the WT and wee1-50 cells; meanwhile in the pom1Δ cells the significant difference was detected after the transition period (growth phase II). As it was surmised, the significant difference is due to longer growth phases, and the difference between the two mutants can be explained via the main differences in their cell cycle. The wee1-50 cells exhibit a long G1 phase before DNA duplication (which may cause the gene dosage effect), the molecular event proposed to be the cause of the rate change point in the elongation period, resulting in a longer growth phase I. The pom1Δ cells’ cycle probably has a short G1 phase, so such a gene dosage effect cannot be detected as cells grow nearly exclusively in G2 (with a doubled DNA content). We propose that the NETO event is the molecular background of the RCP2 here, and generally the growth phase II was found to be longer here. The NETO event takes place around 0.3-0.4 in the WT cell cycle [1,20,21,50], which means that the growth phase II periods have longer durations. However, in our own WT culture, we observed a small number of exponential segments after RCP2, which made the statistical analyses unreliable.
In contrast to the experiments based on serious interventions into the cell cycle and measurements of rather few individual cells [6], here we have studied a much larger number of individual fission yeast cells’ length growth patterns (61 WT, 93 wee1-50 and 144 pom1Δ cells). The presented results do not refute absolutely the probability of misidentification of individual cells’ growth patterns. We have found a distribution of linear, bilinear and exponential patterns amongst the whole elongation periods, and also a distribution of linear and exponential patterns amongst the separated segments of the formerly detected ‘bilinear’ patterns. However, the data presented here does strengthen the adequacy of the bilinear model applied by us formerly and also in this paper for two reasons. Firstly, because the majority of the cells showed a bilinear pattern in all the three cell types investigated (Table 1), and secondly, because the majority of the individual segments showed a linear pattern (Table 2, Table 3, Table 4 and Table 5). If individual fission yeast cells tended to grow (bi)exponentially, then we should have found many more cases where either the whole growing period was exponential, or both separate segments were exponential. Because none of these statements are true, we may conclude that the general length growth pattern during the mitotic cycle of fission yeast is bilinear. It is worth emphasising again that the resolution of the presently used photos were good enough to neglect smoothing of the data before the analyses, which was generally part of the protocol in earlier studies in this field.

Supplementary Materials

The following is available online at https://www.mdpi.com/article/10.3390/pr9091533/s1, Table S1: The measured individual cells’ length growth pattern data (WT, wee1-50, pom1∆), which have been analyzed in this paper.

Author Contributions

Conceptualization, Z.N., M.S. and Á.S.; methodology, B.P., Z.N., L.A.P., M.S. and Á.S.; formal analysis, B.P. and Z.N.; investigation, B.P., Z.N., L.A.P. and Á.S.; resources, L.A.P. and M.S.; writing, B.P., Z.N. and Á.S.; visualization, B.P. and Z.N.; supervision, M.S. and Á.S.; funding acquisition, L.A.P. and Á.S. All authors have read and agreed to the published version of the manuscript.

Funding

This work was supported by the National Research, Development and Innovation Office of Hungary (NKP-2018-1.2.1-NKP-2018-00005), and the BME-Biotechnology FIKP grant of EMMI (BME FIKP-BIO). The research was also supported by the Thematic Excellence Programme (TKP2020-IKA-04) of the Ministry for Innovation and Technology in Hungary.

Data Availability Statement

All data included in this study are available upon request by contact with the corresponding author.

Acknowledgments

We are grateful to Jacqueline Hayles (Cell Cycle Laboratory, Francis Crick Institute, London, UK), who provided us with the wee1-50 and pom1Δ mutant strains of fission yeast. We thank our former BSc student Bendegúz Szabó for his contributions in the initial parts of this study.

Conflicts of Interest

The authors declare no conflict of interest. The funders had no role in the design of the study; in the collection, analyses, or interpretation of data; in the writing of the manuscript, or in the decision to publish the results.

References

  1. Mitchison, J.M.; Nurse, P. Growth in cell length in the fission yeast Schizosaccharomyces pombe. J. Cell Sci. 1985, 75, 357–376. [Google Scholar] [CrossRef] [PubMed]
  2. May, J.W.; Mitchison, J.M. Pattern of polar extension of the cell wall in the fission yeast Schizosaccharomyces pombe. Can. J. Microbiol. 1995, 41, 273–277. [Google Scholar] [CrossRef] [PubMed]
  3. Baumgartner, S.; Tolic-Norrelykke, I.M. Growth pattern of single fission yeast cells is bilinear and depends on temperature and DNA synthesis. Biophys. J. 2009, 96, 4336–4347. [Google Scholar] [CrossRef] [PubMed] [Green Version]
  4. Cooper, S. Schizosaccharomyces pombe grows exponentially during the division cycle with no rate change points. FEMS Yeast Res. 2013, 13, 650–658. [Google Scholar] [CrossRef] [Green Version]
  5. Horváth, A.; Rácz-Mónus, A.; Buchwald, P.; Sveiczer, A. Cell length growth in fission yeast: An analysis of its bilinear character and the nature of its rate change transition. FEMS Yeast Res. 2013, 13, 635–649. [Google Scholar] [CrossRef] [PubMed] [Green Version]
  6. Pickering, M.; Hollis, L.N.; D’Souza, E.; Rhind, N. Fission yeast cells grow approximately exponentially. Cell Cycle 2019, 18, 869–879. [Google Scholar] [CrossRef] [Green Version]
  7. Knapp, B.D.; Odermatt, P.; Rojas, E.R.; Cheng, W.; He, X.; Huang, K.C.; Chang, F. Decoupling of Rates of Protein Synthesis from Cell Expansion Leads to Supergrowth. Cell Syst. 2019, 9, 434–445. [Google Scholar] [CrossRef]
  8. Neumann, F.R.; Nurse, P. Nuclear size control in fission yeast. J. Cell Biol. 2007, 179, 593–600. [Google Scholar] [CrossRef] [Green Version]
  9. Moreno, S.; Nurse, P. Regulation of progression through the G1 phase of the cell cycle by the rum1+ gene. Nature 1994, 367, 236–242. [Google Scholar] [CrossRef]
  10. Allard, C.A.H.; Opalko, H.E.; Liu, K.W.; Medoh, U.; Moseley, J.B. Cell size-dependent regulation of Wee1 localization by Cdr2 cortical nodes. J. Cell Biol. 2018, 217, 1589–1599. [Google Scholar] [CrossRef] [Green Version]
  11. Gerganova, V.; Bhatia, P.; Vincenzetti, V.; Martin, S.G. Direct and indirect regulation of Pom1 cell size pathway by the protein phosphatase 2C Ptc1. Mol. Biol. Cell 2021, 32, 703–711. [Google Scholar] [CrossRef] [PubMed]
  12. Martin, S.G.; Berthelot-Grosjean, M. Polar gradients of the DYRK-family kinase Pom1 couple cell length with the cell cycle. Nature 2009, 459, 852–856. [Google Scholar] [CrossRef]
  13. Moseley, J.B.; Mayeux, A.; Paoletti, A.; Nurse, P. A spatial gradient coordinates cell size and mitotic entry in fission yeast. Nature 2009, 459, 857–860. [Google Scholar] [CrossRef] [PubMed]
  14. Opalko, H.E.; Nasa, I.; Kettenbach, A.N.; Moseley, J.B. A mechanism for how Cdr1/Nim1 kinase promotes mitotic entry by inhibiting Wee1. Mol. Biol. Cell 2019, 30, 3015–3023. [Google Scholar] [CrossRef]
  15. Rhind, N.; Ohira, M.J.; D’Souza, E.; Magner, M.; Mayhew, M.B.; Keifenheim, D.; Sun, X.-M.; Marguerat, S. Size-Dependent Expression of the Mitotic Activator Cdc25 Suggests a Mechanism of Size Control in Fission Yeast. Curr. Biol. 2017, 27, 1491–1497. [Google Scholar] [CrossRef] [Green Version]
  16. Navarro, F.J.; Weston, L.; Nurse, P. Global control of cell growth in fission yeast and its coordination with the cell cycle. Curr. Opin. Cell Biol. 2012, 24, 833–837. [Google Scholar] [CrossRef]
  17. Patterson, J.O.; Rees, P.; Nurse, P. Noisy Cell-Size-Correlated Expression of Cyclin B Drives Probabilistic Cell-Size Homeostasis in Fission Yeast. Curr. Biol. 2019, 29, 1379–1386.e4. [Google Scholar] [CrossRef] [Green Version]
  18. Nurse, P.; Fantes, P.A. Cell cycle controls in fission yeast: A genetic analysis. In The Cell Cycle; John, P.C.L., Ed.; Cambridge University Press: Cambridge, UK, 1981; pp. 85–98. [Google Scholar]
  19. Sveiczer, A.; Novak, B.; Mitchison, J.M. Mitotic control in the absence of cdc25 mitotic inducer in fission yeast. J. Cell Sci. 1999, 112, 1085–1092. [Google Scholar] [CrossRef]
  20. Horváth, A.; Rácz-Mónus, A.; Buchwald, P.; Sveiczer, Á. Cell length growth patterns in fission yeast reveal a novel size control mechanism operating in late G2 phase. Biol. Cell 2016, 108, 259–277. [Google Scholar] [CrossRef]
  21. Sveiczer, A.; Novak, B.; Mitchison, J.M. The size control of fission yeast revisited. J. Cell Sci. 1996, 109, 2947–2957. [Google Scholar] [CrossRef]
  22. Nagy, Z.; Medgyes-Horváth, A.; Vörös, E.; Sveiczer, Á. Strongly oversized fission yeast cells lack any size control and tend to grow linearly rather than bilinearly. Yeast 2021, 38, 206–221. [Google Scholar] [CrossRef]
  23. Coudreuse, D.; Nurse, P. Driving the cell cycle with a minimal CDK control network. Nature 2010, 468, 1074–1079. [Google Scholar] [CrossRef]
  24. Schmoller KM The phenomenology of cell size control. Curr. Opin. Cell Biol. 2017, 49, 53–58. [CrossRef] [PubMed]
  25. Scotchman, E.; Kume, K.; Navarro, F.J.; Nurse, P. Identification of mutants with increased variation in cell size at onset of mitosis in fission yeast. J. Cell Sci. 2021, 134. [Google Scholar] [CrossRef] [PubMed]
  26. Odermatt, P.D.; Miettinen, T.P.; Lemière, J.; Kang, J.H.; Bostan, E.; Manalis, S.R.; Huang, K.C.; Chang, F. Variations of intracellular density during the cell cycle arise from tip-growth regulation in fission yeast. Elife 2021, 10, 1–23. [Google Scholar] [CrossRef] [PubMed]
  27. Sveiczer, Á.; Horváth, A.; Buchwald, P. Is there a universal rule for cellular growth?—Problems in studying and interpreting this phenomenon. FEMS Yeast Res. 2014, 14, 679–682. [Google Scholar] [CrossRef] [Green Version]
  28. Mitchison, J.M. Growth during the cell cycle. Int. Rev. Cytol. 2003, 226, 165–258. [Google Scholar]
  29. Sveiczer, A.; Tyson, J.J.; Novak, B. Modelling the fission yeast cell cycle. Brief. Funct. Genom. Proteom. 2004, 2, 298–307. [Google Scholar] [CrossRef] [Green Version]
  30. Chica, N.; Rozalén, A.E.; Pérez-Hidalgo, L.; Rubio, A.; Novak, B.; Moreno, S. Nutritional Control of Cell Size by the Greatwall-Endosulfine-PP2A·B55 Pathway. Curr. Biol. 2016, 26, 319–330. [Google Scholar] [CrossRef] [Green Version]
  31. Atilgan, E.; Magidson, V.; Khodjakov, A.; Chang, F. Morphogenesis of the fission yeast cell through cell wall expansion. Curr. Biol. 2015, 25, 2150–2157. [Google Scholar] [CrossRef] [Green Version]
  32. Hayles, J.; Nurse, P. A journey into space. Nat. Rev. Mol. Cell. Biol. 2001, 2, 647–656. [Google Scholar] [CrossRef]
  33. Verde, F. On growth and form: Control of cell morphogenesis in fission yeast. Curr. Opin. Microbiol. 1998, 1, 712–718. [Google Scholar] [CrossRef]
  34. Facchetti, G.; Knapp, B.; Flor-Parra, I.; Chang, F.; Howard, M. Reprogramming Cdr2-Dependent Geometry-Based Cell Size Control in Fission Yeast. Curr. Biol. 2019, 29, 350–358. [Google Scholar] [CrossRef] [Green Version]
  35. Creanor, J.; Mitchison, J.M. Patterns of protein synthesis during the cell cycle of the fission yeast Schizosaccharomyces pombe. J. Cell Sci. 1982, 58, 263–285. [Google Scholar] [CrossRef]
  36. Buchwald, P.; Sveiczer, A. The time-profile of cell growth in fission yeast: Model selection criteria favoring bilinear models over exponential ones. Theor. Biol. Med. Model. 2006, 3, 16. [Google Scholar] [CrossRef] [PubMed] [Green Version]
  37. Das, M.; Drake, T.; Wiley, D.J.; Buchwald, P.; Vavylonis, D.; Verde, F. Oscillatory dynamics of Cdc42 GTPase in the control of polarized growth. Science 2012, 337, 239–243. [Google Scholar] [CrossRef] [PubMed] [Green Version]
  38. Sveiczer, Á.; Horváth, A. How do fission yeast cells grow and connect growth to the mitotic cycle? Curr. Genet. 2017, 63, 165–173. [Google Scholar] [CrossRef] [PubMed]
  39. Reshes, G.; Vanounou, S.; Fishov, I.; Feingold, M. Cell shape dynamics in Escherichia coli. Biophys. J. 2008, 94, 251–264. [Google Scholar] [CrossRef] [PubMed] [Green Version]
  40. Bryan, A.K.; Goranov, A.; Amon, A.; Manalis, S.R. Measurement of mass, density, and volume during the cell cycle of yeast. Proc. Natl. Acad. Sci. USA 2010, 107, 999–1004. [Google Scholar] [CrossRef] [PubMed] [Green Version]
  41. Hannebelle, M.T.M.; Ven, J.X.Y.; Toniolo, C.; Eskandarian, H.A.; Vuaridel-Thurre, G.; McKinney, J.D.; Fantner, G.E. A biphasic growth model for cell pole elongation in mycobacteria. Nat. Commun. 2020, 11, 452. [Google Scholar] [CrossRef]
  42. Nurse, P.; Thuriaux, P.; Nasmyth, K. Genetic control of the cell division cycle in the fission yeast Schizosaccharomyces pombe. Mol. Gen. Genet. 1976, 146, 167–178. [Google Scholar] [CrossRef] [PubMed]
  43. Buchwald, P. A general bilinear model to describe growth or decline time profiles. Math. Biosci. 2007, 205, 108–136. [Google Scholar] [CrossRef]
  44. Fantes, P.A.; Nurse, P. Control of the timing of cell division in fission yeast: Cell size mutants reveal a second control pathway. Exp. Cell Res. 1978, 115, 317–329. [Google Scholar] [CrossRef]
  45. Mitchison, J.M. Cell cycle growth and periodicities. In Molecular Biology of the Fission Yeast; Nasim, A., Young, P., Johnson, B.F., Eds.; Academic Press: New York, NY, USA, 1989; pp. 205–242. [Google Scholar]
  46. Sorrell, D.A.; Marchbank, A.; McMahon, K.; Dickinson, R.J.; Rogers, H.J.; Francis, D. A WEE1 homologue from Arabidopsis thaliana. Planta 2002, 35, 518–522. [Google Scholar] [CrossRef] [PubMed]
  47. Nagy, Z.; Medgyes-Horváth, A.; Szalay, C.; Sipiczki, M.; Sveiczer, Á. Phylogenetic Analyses of Proteins Coordinating G2 Size Control in Fission Yeast. Period. Polytech. Chem. Eng. 2019, 63, 555–568. [Google Scholar] [CrossRef]
  48. Wood, E.; Nurse, P. Pom1 and cell size homeostasis in fission yeast. Cell Cycle 2013, 12, 3228–3236. [Google Scholar] [CrossRef] [Green Version]
  49. Bähler, J.; Pringle, J.R. Pom1p, a fission yeast protein kinase that provides positional information for both polarized growth and cytokinesis. Genes Dev. 1998, 12, 1356–1370. [Google Scholar] [CrossRef] [PubMed] [Green Version]
  50. Martin, S.G.; Chang, F. New end take off: Regulating cell polarity during the fission yeast cell cycle. Cell Cycle 2005, 4, 1046–1049. [Google Scholar] [CrossRef] [Green Version]
Figure 1. Illustrative length growth profile of an individual wee1-50 mutant fission yeast cell with an adequate bilinear pattern. Measured cell length is shown as a function of time, with the different parts of the cell cycle (growth phase I-II, transition period and constant length period) indicated. All the three fitted models (linear, exponential and bilinear) are shown.
Processes 09 01533 g001
Figure 2. Illustrative length growth profile of the same individual wee1-50 mutant fission yeast cell, which is given in Figure 1. Growth phase I is emphasized here, as the rest of the data is omitted from this analysis. The two fitted models (linear, exponential) are shown.
Processes 09 01533 g002
Figure 3. Illustrative length growth profile of the same individual wee1-50 mutant fission yeast cell, which is given in Figure 1. Growth phase II is emphasized here, as the rest of the data is omitted from this analysis. The two fitted models (linear and exponential) are shown.
Processes 09 01533 g003
Figure 4. Distribution of the growing segments, examined in the ‘bilinearly’ growing wild-type fission yeast cells. The growth phases are separated by the more adequate fitted model (linear or exponential). The symbols represent the growing segments, whose durations are given in minutes. (A) All the growth phases (I and II) are shown. (B) Only growth phase I is shown. (C) Only growth phase II is shown.
Processes 09 01533 g004
Figure 5. Distribution of the growing segments, examined in the ‘bilinearly’ growing wee1-50 mutant fission yeast cells. The growth phases are separated by the more adequate fitted model (linear or exponential). The symbols represent the growing segments, whose durations are given in minutes. (A) All the growth phases (I and II) are shown. (B) Only growth phase I is shown. (C) Only growth phase II is shown.
Processes 09 01533 g005
Figure 6. Distribution of the growing segments, examined in the ‘bilinearly’ growing pom1Δ mutant fission yeast cells. The growth phases are separated by the more adequate fitted model (linear or exponential). The symbols represent the growing segments, whose durations are given in minutes. (A) All the growth phases (I and II) are shown. (B) Only growth phase I is shown. (C). Only growth phase II is shown.
Processes 09 01533 g006
Table 1. Distribution of different cell length growth patterns in different cell lines based on the AIC model selection criteria.
Wild-Typewee1-50pom1Δ
N%N%N%
Bilinear4065.66569.98559.0
Linear1524.62223.74732.6
Exponential69.866.4128.3
Total61100.093100.0144100.0
Data represent the number (N) and percent (%) of the cells with the corresponding adequate growth pattern (bilinear, linear or exponential).
Table 2. Results of the two-sample t-tests for analysing the growing phases in those wild-type cells, which grew bilinearly.
WT
NMean ± SD (min)
Total ExpLinExpLinp
All growth phases235737.4 ± 16.052.6 ± 20.7* 0.001
Growth phase I172331.6 ± 9.442.0 ± 16.5* 0.026
Growth phase II63454.0 ± 19.959.8 ± 20.30.520
<40All growth phases161429.2 ± 5.727.5 ± 7.00.468
Growth phase I151129.1 ± 5.928.2 ± 7.20.740
Growth phase II1330.124.6 ± 6.1
≥40All growth phases74356.3 ± 15.960.8 ± 16.60.513
Growth phase I21250.2 ± 11.454.5 ± 11.60.708
Growth phase II53158.8 ± 18.063.2 ± 17.80.628
Data represent number (N) and mean ± standard deviation of the growth phases. The p-Value of the statistical test is also given, and the significant cases are marked with the symbol *. Exp and Lin means exponential and linear growth patterns, respectively. The results are given once for the total studied growth phases, and also for subgroups (growth phase I/II; short and long periods).
Table 3. Results of the two-sample t-tests for analysing the growing phases in those wee1-50 mutant cells, which grew bilinearly.
wee1-50
NMean ± SD (min)
Total ExpLinExpLinp
All growth phases399145.7 ± 21.059.1 ± 28.0* 0.003
Growth phase I214447.6 ± 20.763.9 ± 30.6* 0.014
Growth phase II184743.4 ± 21.754.7 ± 24.70.080
<40All growth phases183129.0 ± 5.331.1 ± 6.00.200
Growth phase I91328.7 ± 5.632.3 ± 5.50.149
Growth phase II91829.3 ± 5.330.3 ± 6.30.673
≥40All growth phases216059.9 ± 18.773.6 ± 23.4* 0.010
Growth phase I123161.7 ± 15.777.1 ± 26.8* 0.026
Growth phase II92957.6 ± 22.969.9 ± 18.90.170
See the legend to Table 2.
Table 4. Results of the two-sample t-tests for analysing the growing phases in those pom1Δ, mutant cells, which grew bilinearly.
pom1Δ
NMean ± SD (min)
Total ExpLinExpLinp
All growth phases5012036.6 ± 14.245.8 ± 19.5* 0.001
Growth phase I315433.4 ± 12.936.8 ± 17.60.312
Growth phase II196641.7 ± 15.153.1 ± 17.9* 0.009
<40All growth phases335227.6 ± 6.127.6 ± 6.50.997
Growth phase I243527.5 ± 6.126.2 ± 5.90.451
Growth phase II91728.0 ± 6.330.4 ± 7.00.382
≥40All growth phases176854.0 ± 7.659.7 ± 13.8* 0.027
Growth phase I71953.7 ± 7.956.2 ± 15.40.602
Growth phase II104954.1 ± 7.861.0 ± 13.0* 0.038
See the legend to Table 2.
Table 5. Distribution of growth patterns based on both segments of ‘bilinear’ cells.
WTwee1-50pom1ΔΣ = WT + wee1-50 + pom1Δ
Lin-Lin915832 (71%)
Exp-Lin3126 (13%)
Lin-Exp0314 (9%)
Exp-Exp0303 (7%)
All12221145 (100%)
Number of cells with having both growth phases I and II ≥40 min, represented separately in each cell culture (wild-type, wee1-50, pom1Δ). The last column shows the sum of the data from the three cell cultures (number and percentage). Lin-Lin, both growth phases I and II are linear; Exp-Lin, growth phase I is exponential, growth phase II is linear; Lin-Exp, growth phase I is linear, growth phase II is exponential; Exp-Exp, both growth phases I and II are exponential.
Publisher’s Note: MDPI stays neutral with regard to jurisdictional claims in published maps and institutional affiliations.