
Investigating the Impact of Economic Uncertainty on Optimal Sizing of Grid-Independent Hybrid Renewable Energy Systems

 ,
,  ,
, 
 and
and 
Abstract
:1. Introduction
2. Literature Review
3. Geographical Specifications
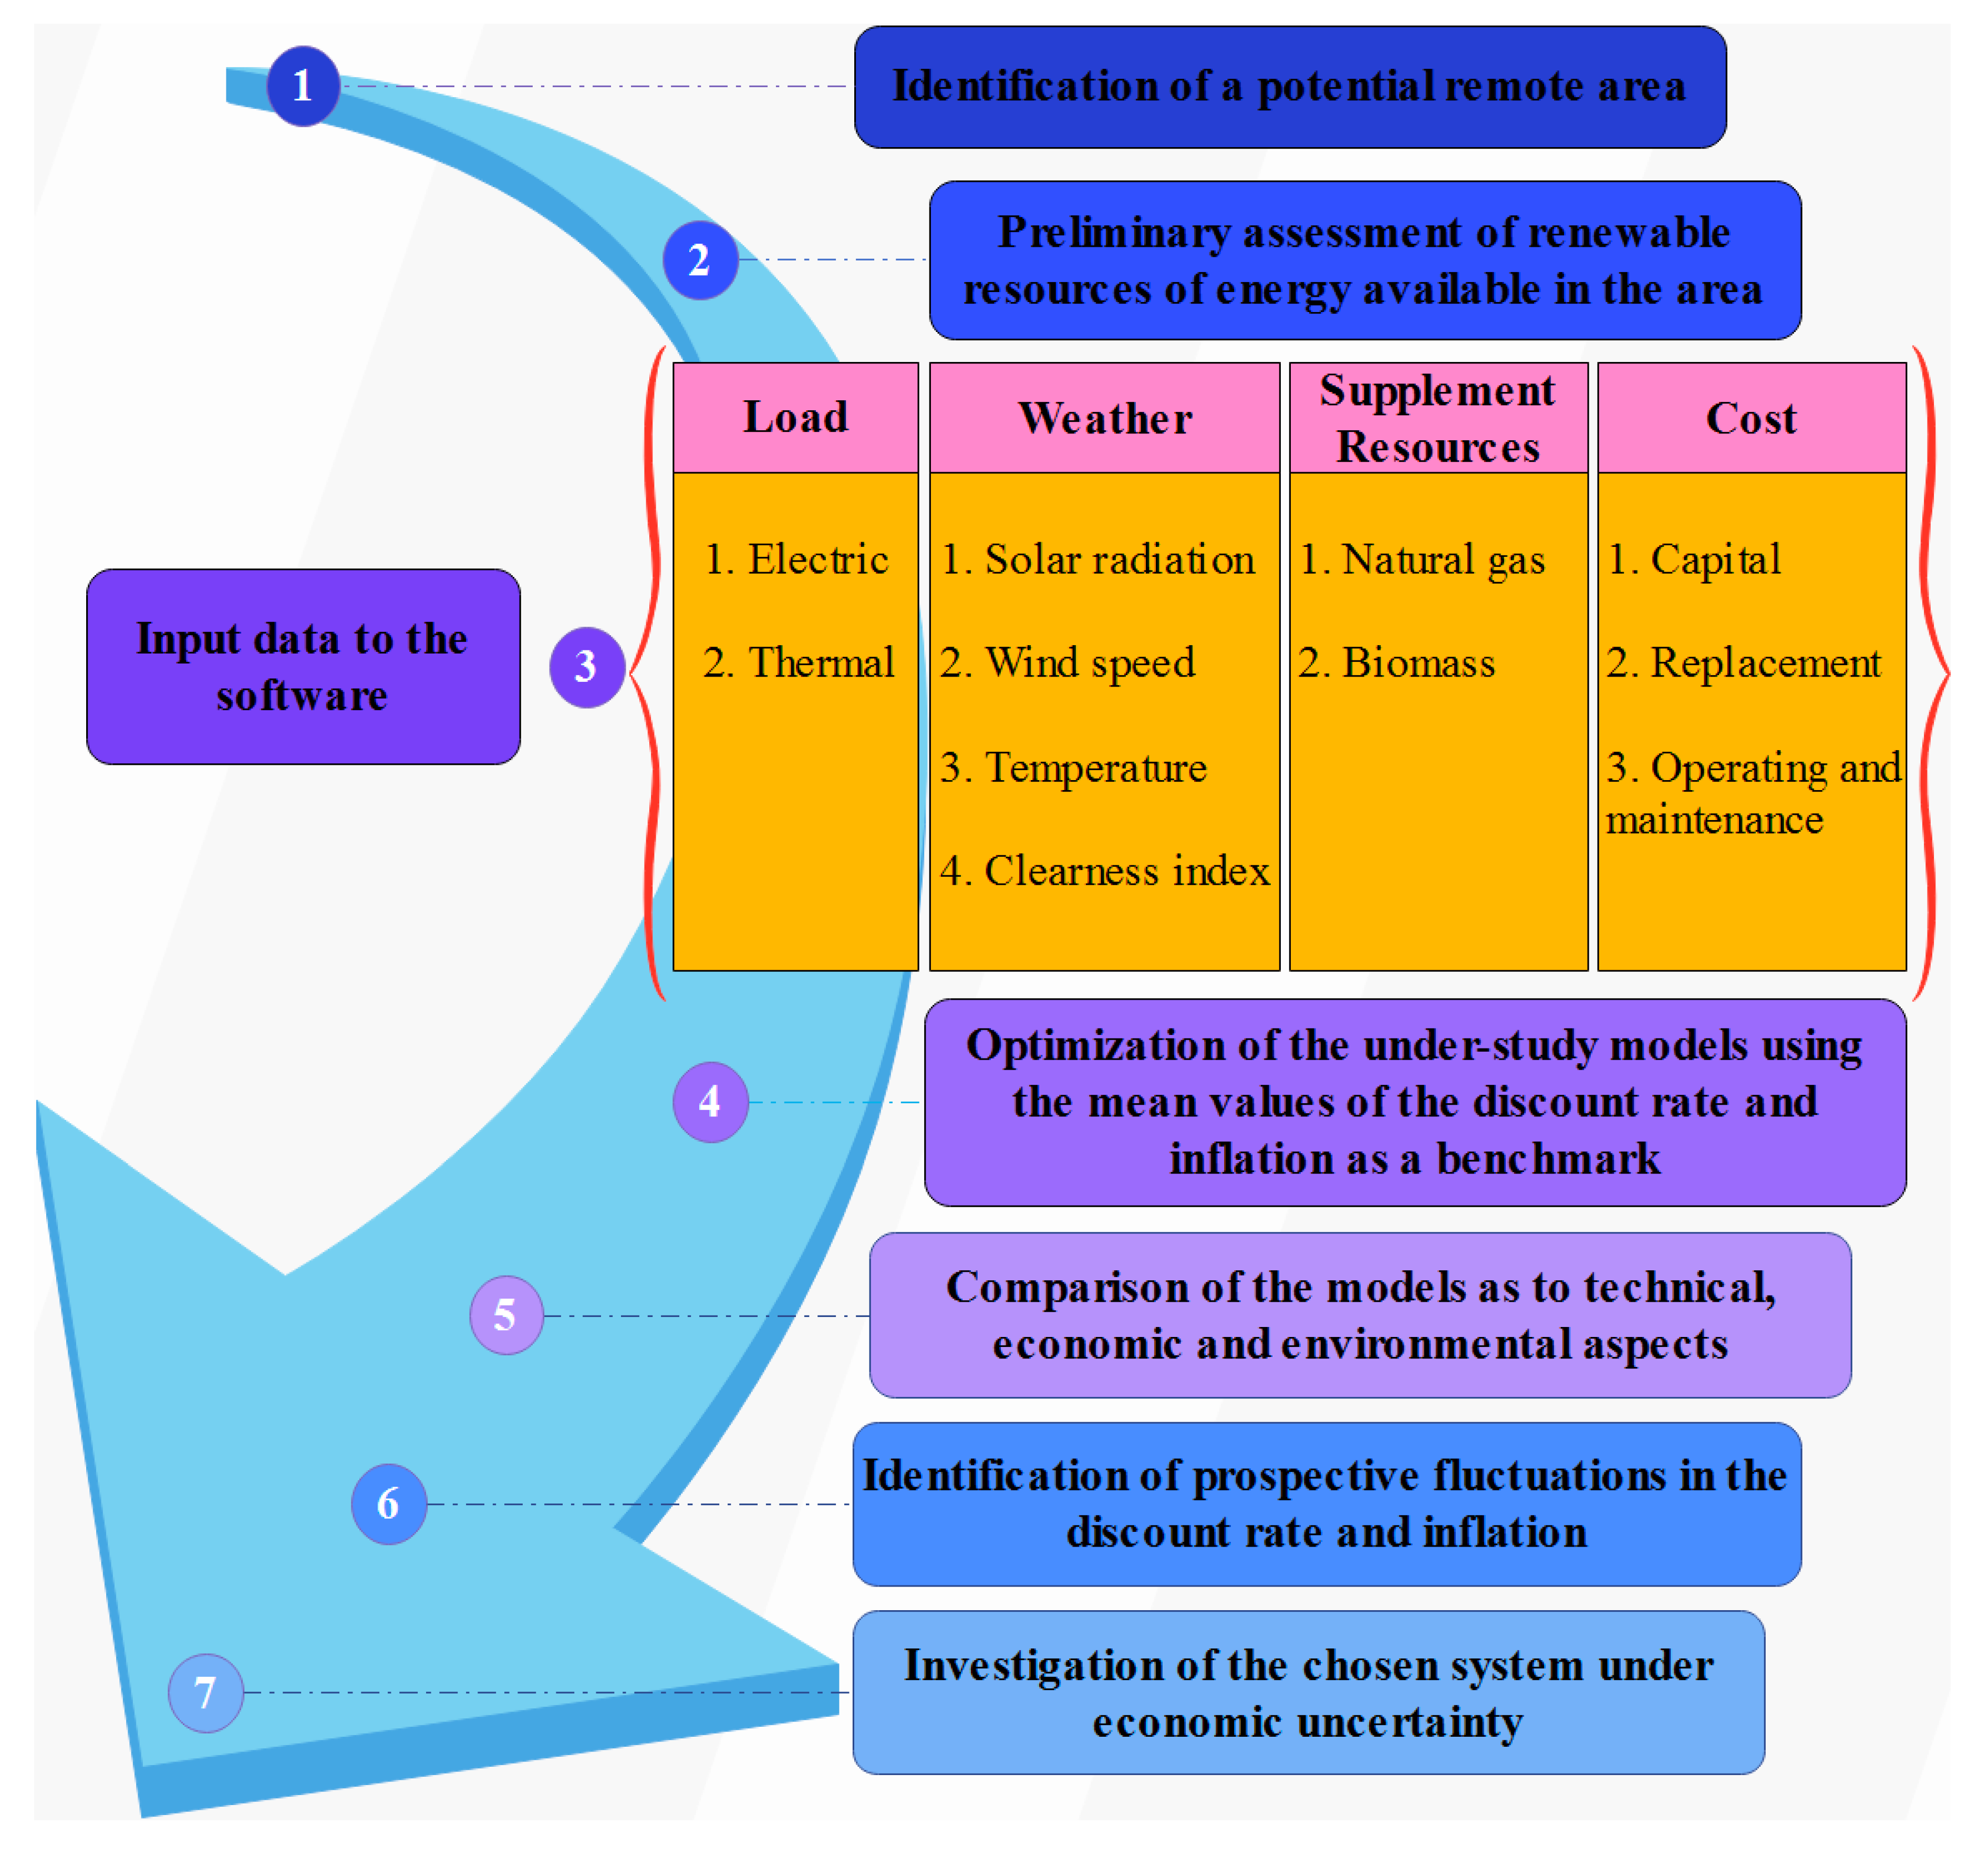
4. Materials and Methods
4.1. Economic Analysis
4.2. PV Modeling
4.3. WT Modeling
4.4. Electrolyzer Modeling
4.5. FC Modeling
4.6. BMG Modeling
4.7. Converter Modeling
4.8. Thermal Load Controller (TLC) Modeling
4.9. H2 Tank Modeling
4.10. Boiler Modeling
5. Technical Characteristics, Cost of Equipment and Assumptions
- (I)
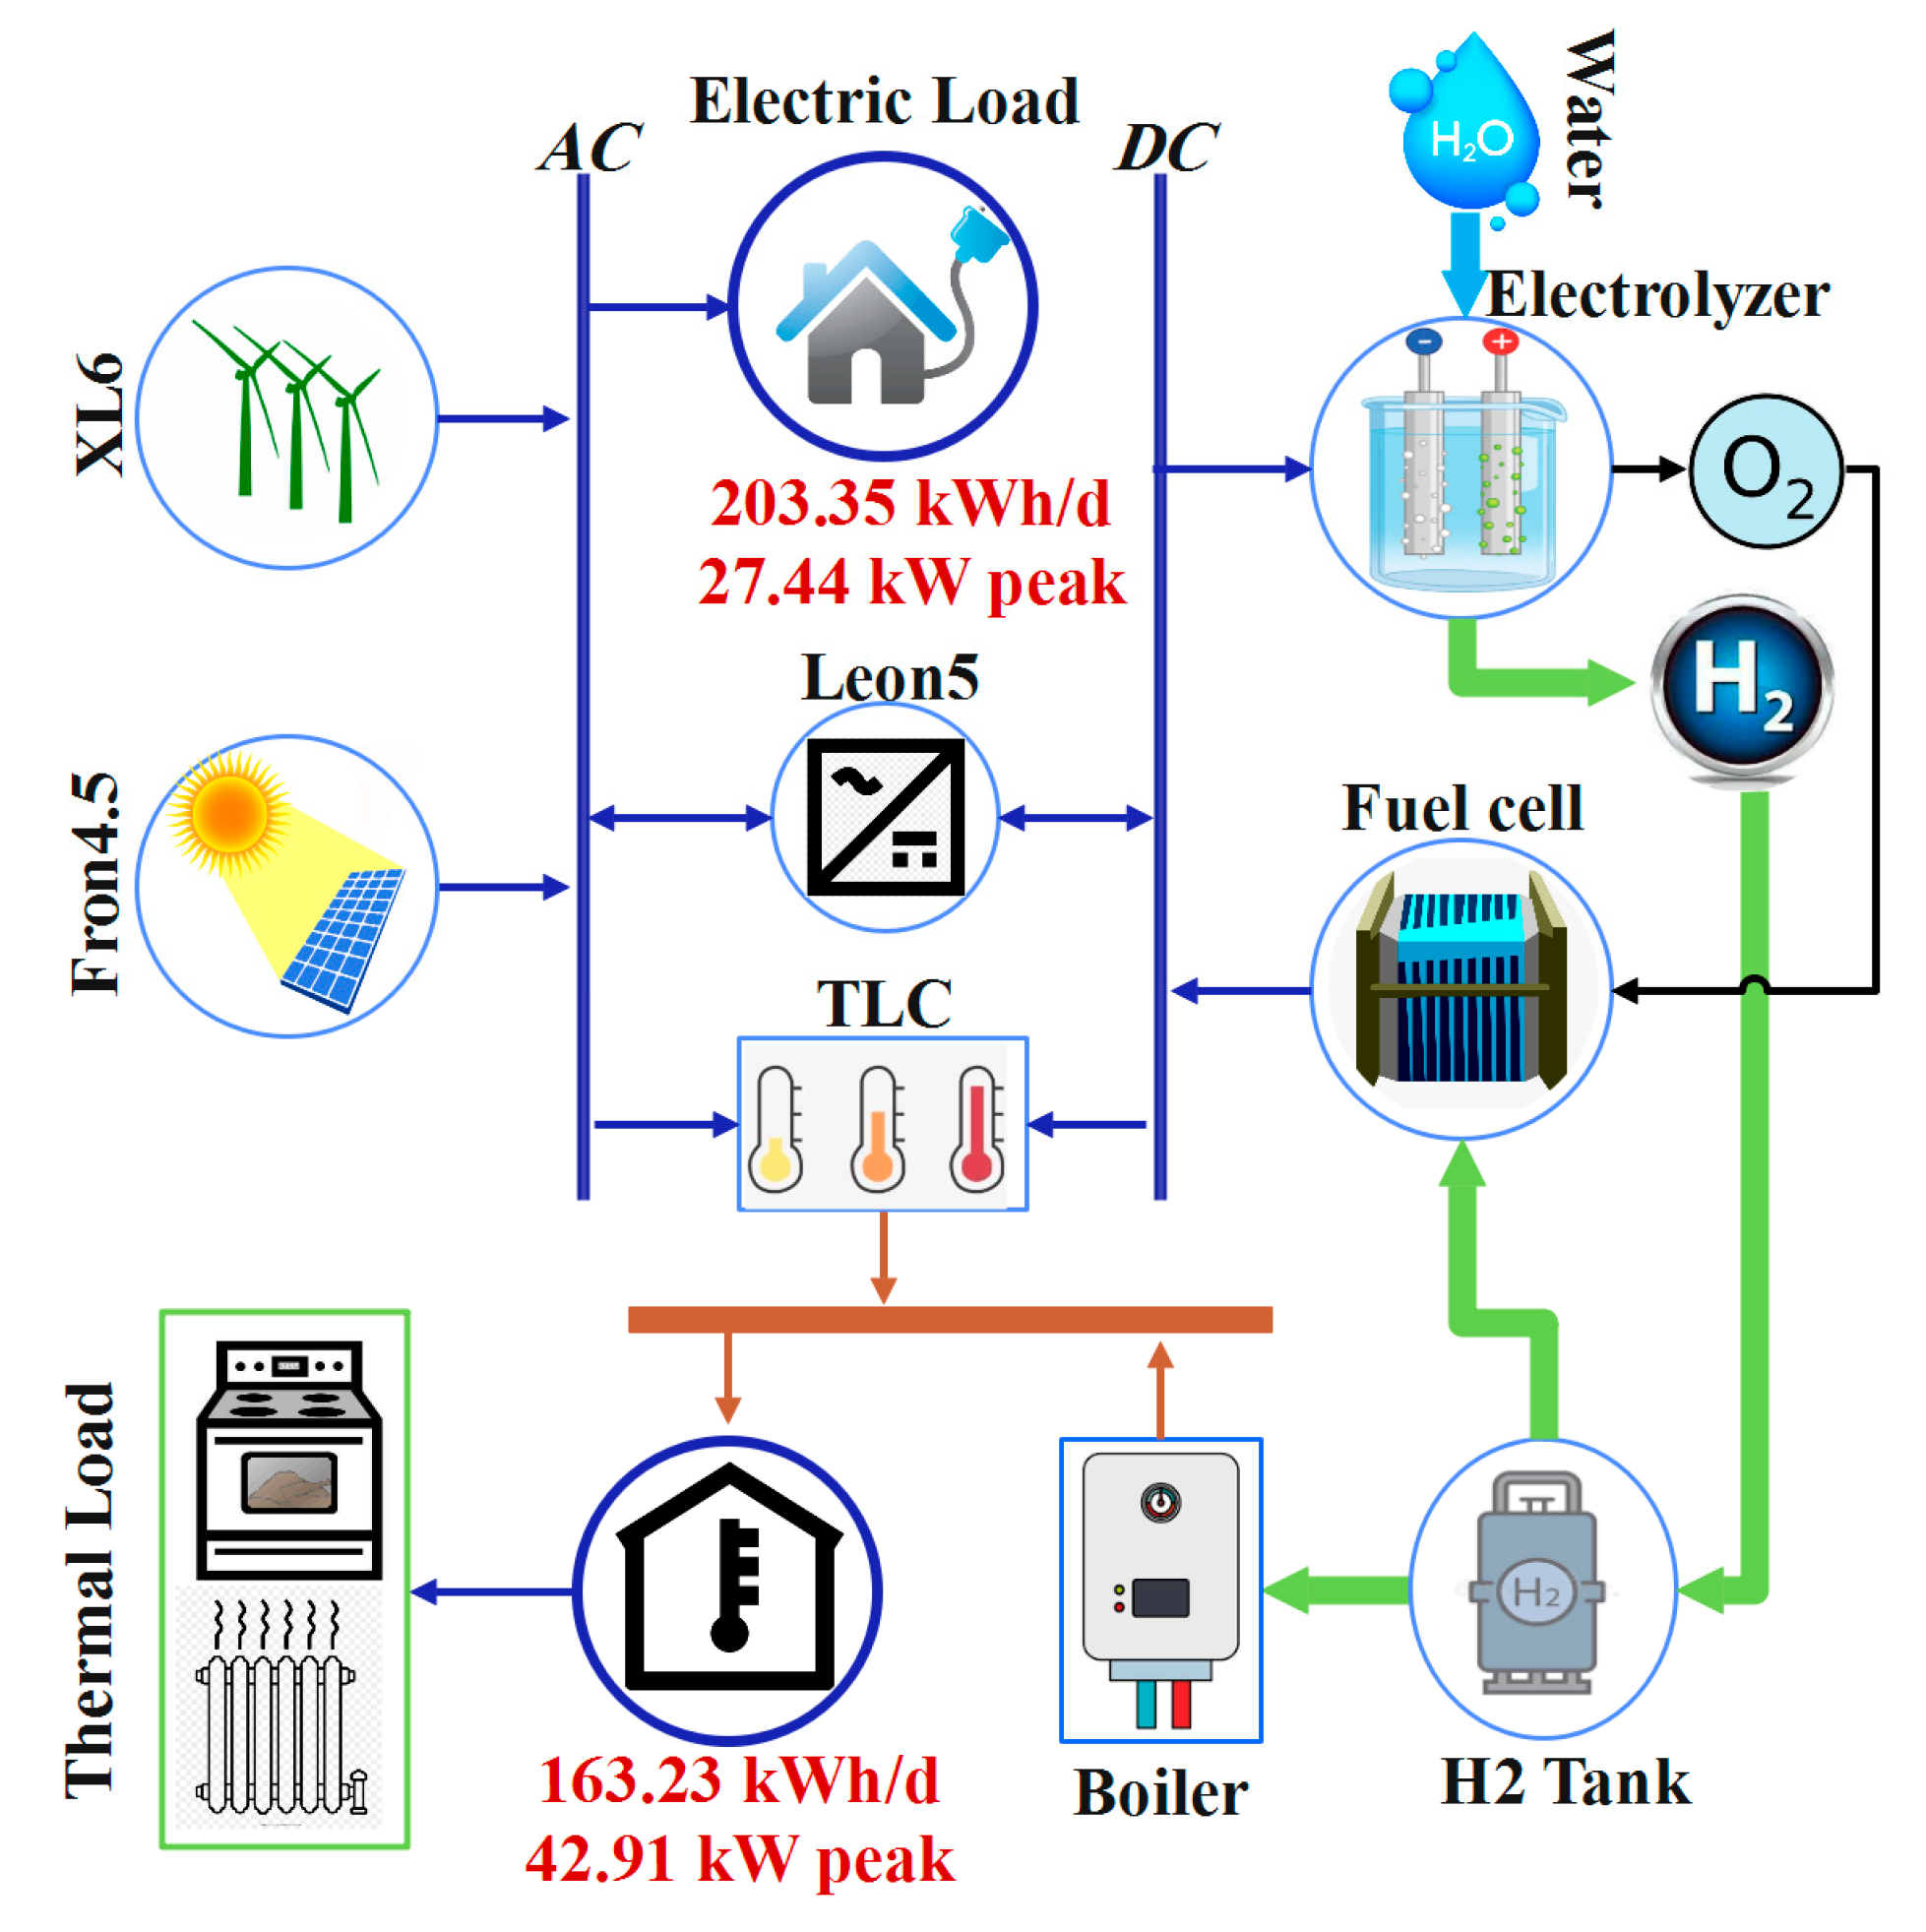
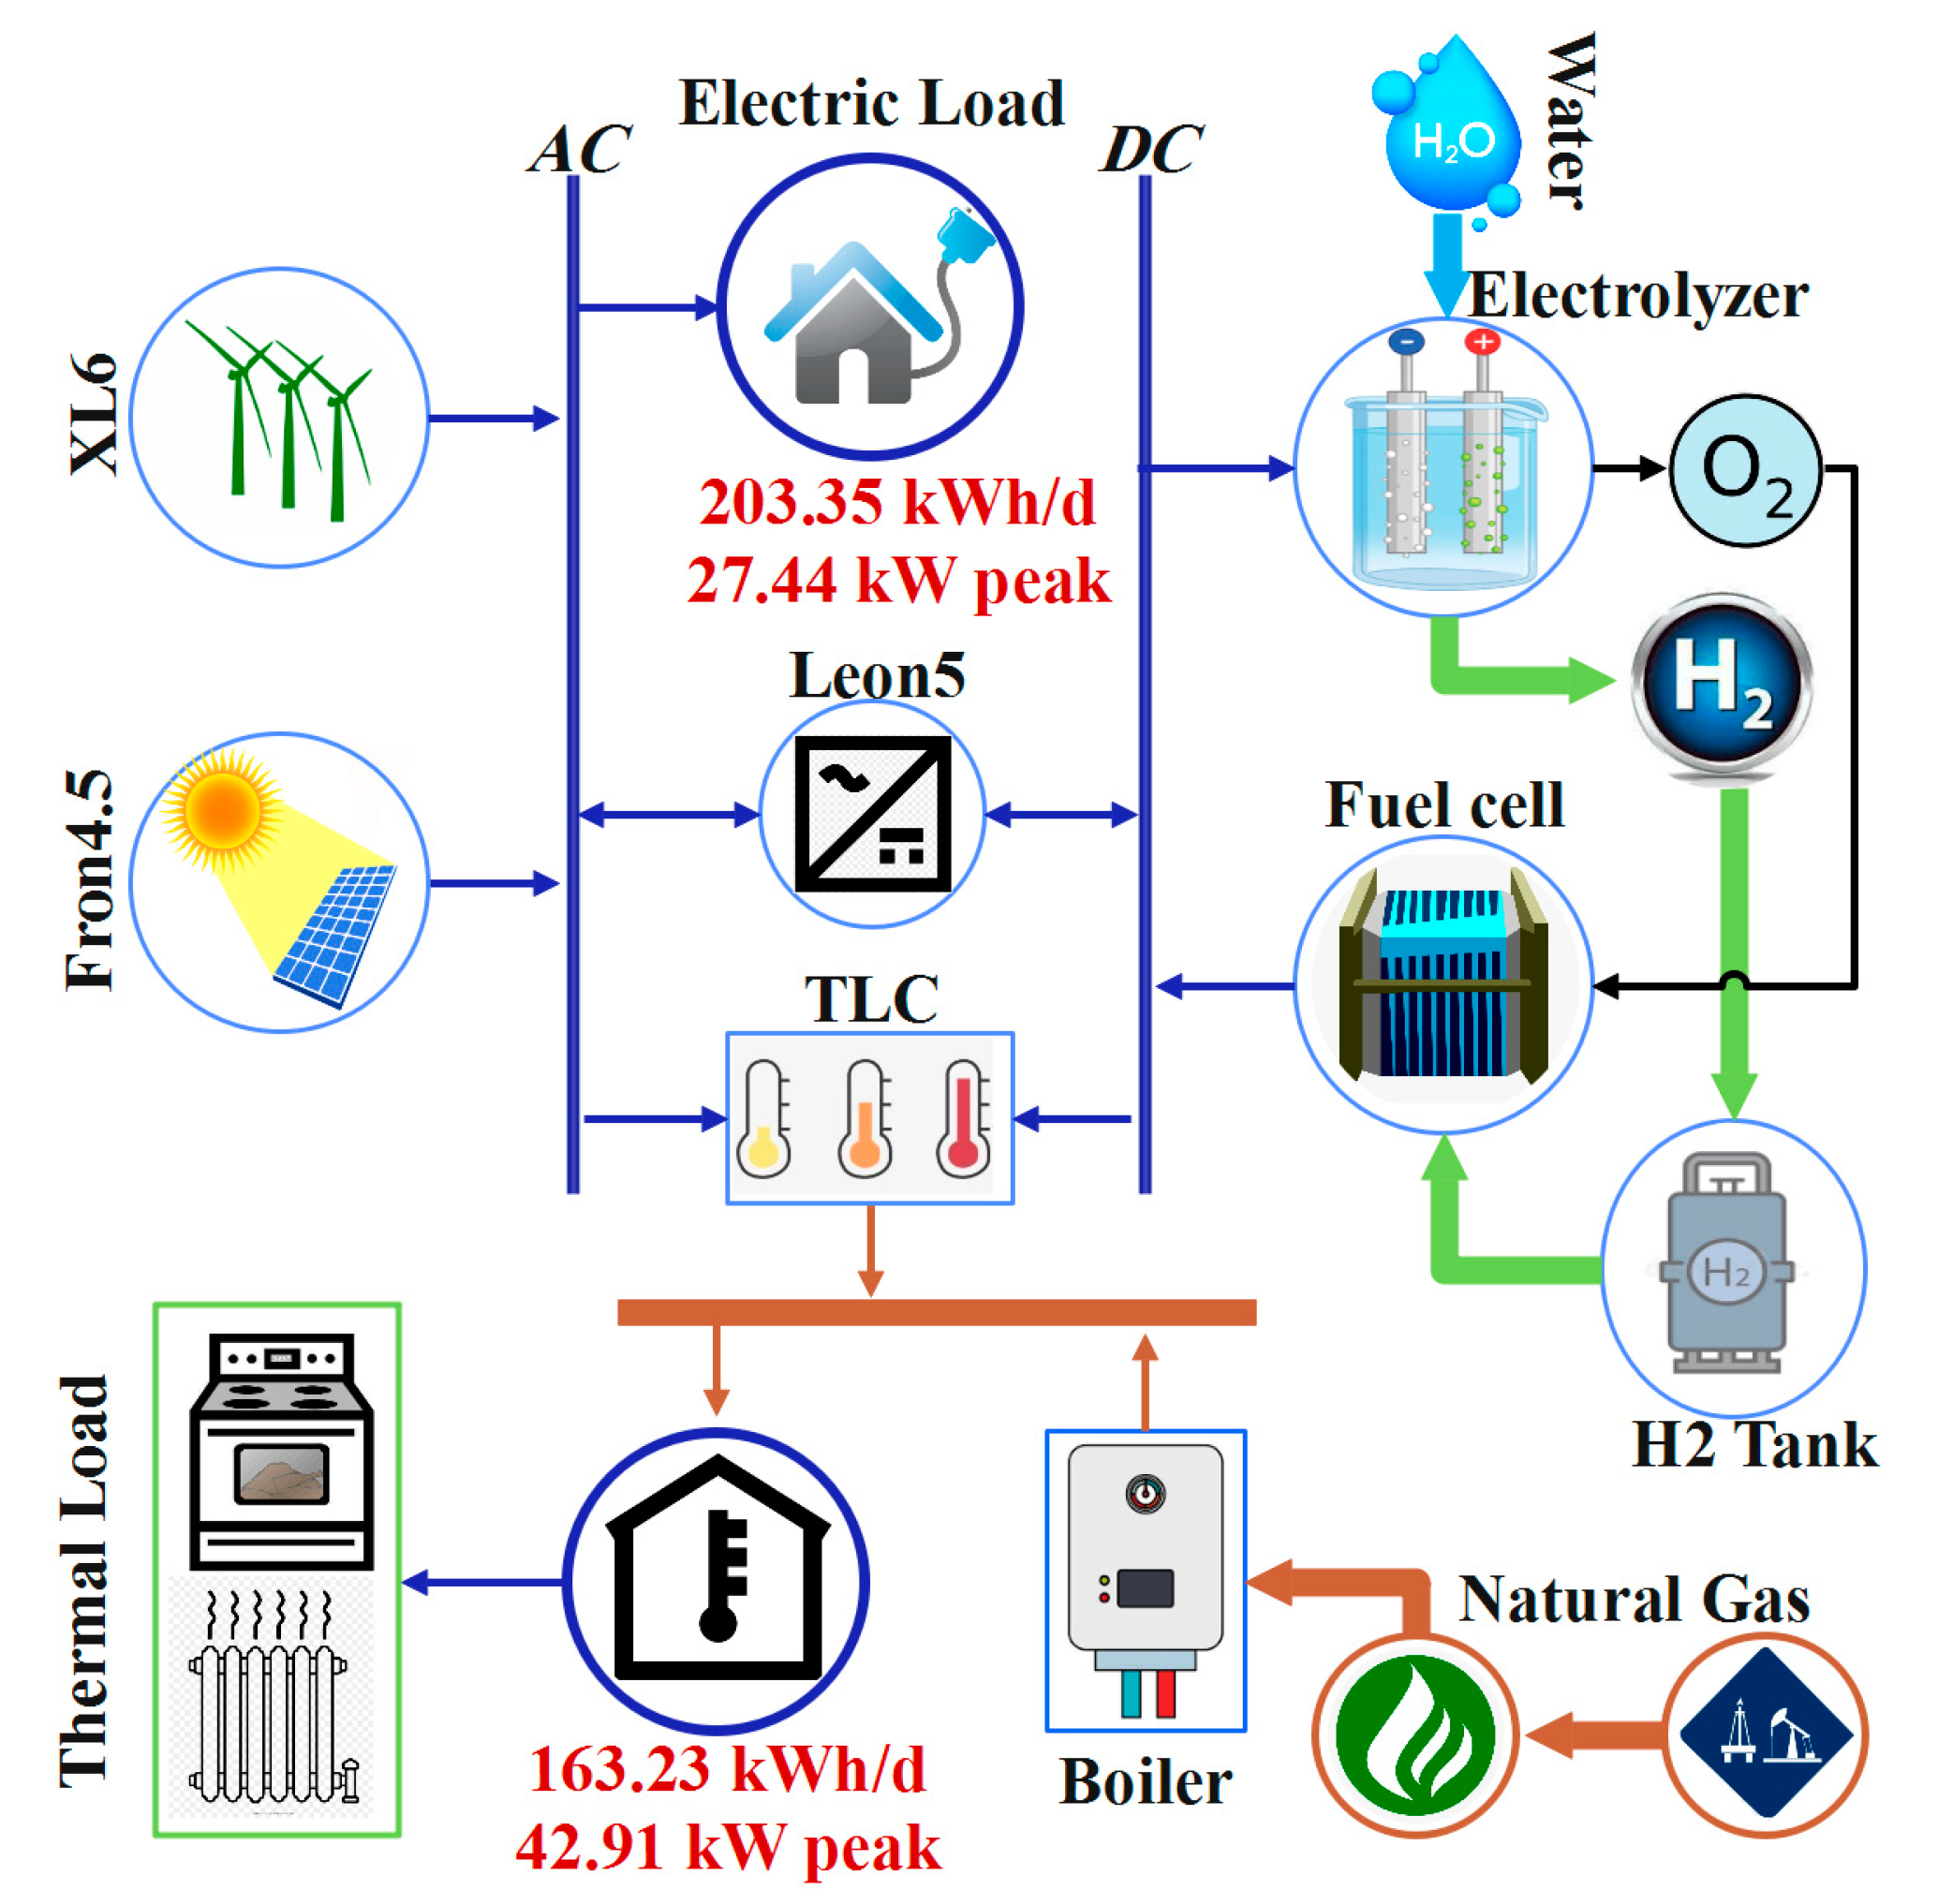
- PV/WT/electrolyzer/H2-based FC/H2-based boiler
- (II)
- PV/WT/electrolyzer/H2-based FC/NG-based boiler
- (III)
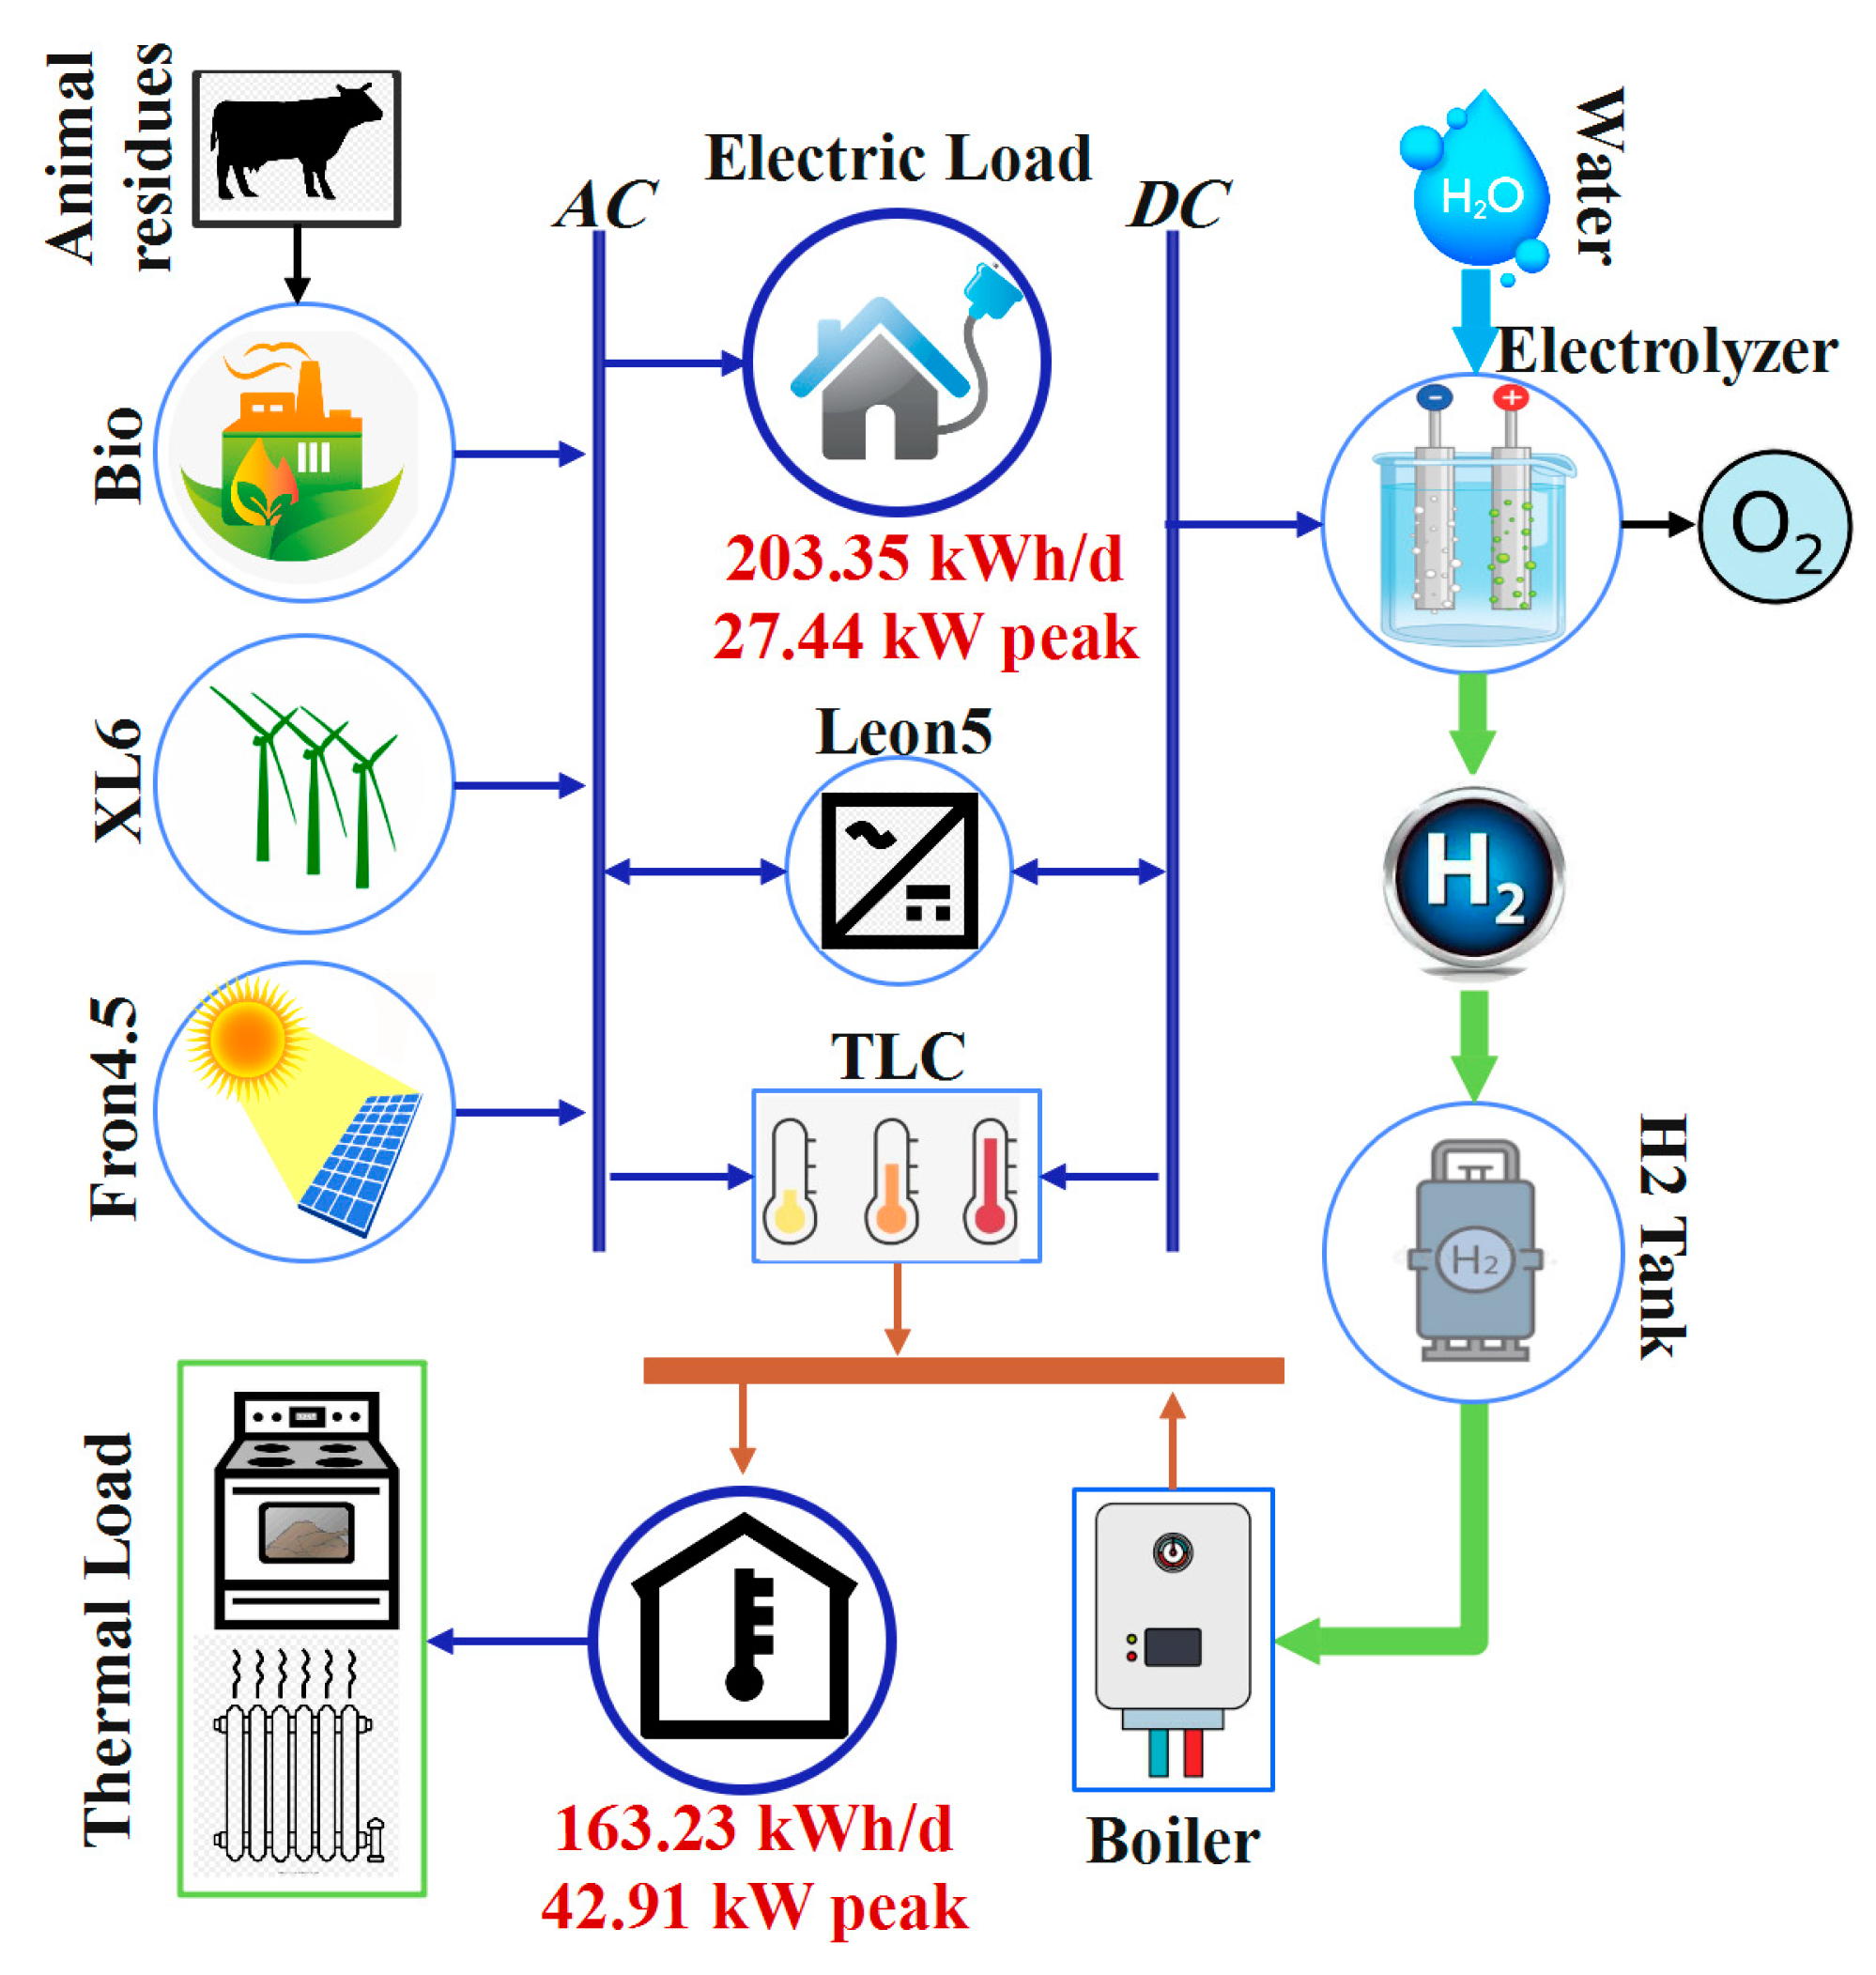
- PV/WT/BMG/electrolyzer/H2-based boiler
6. Analysis
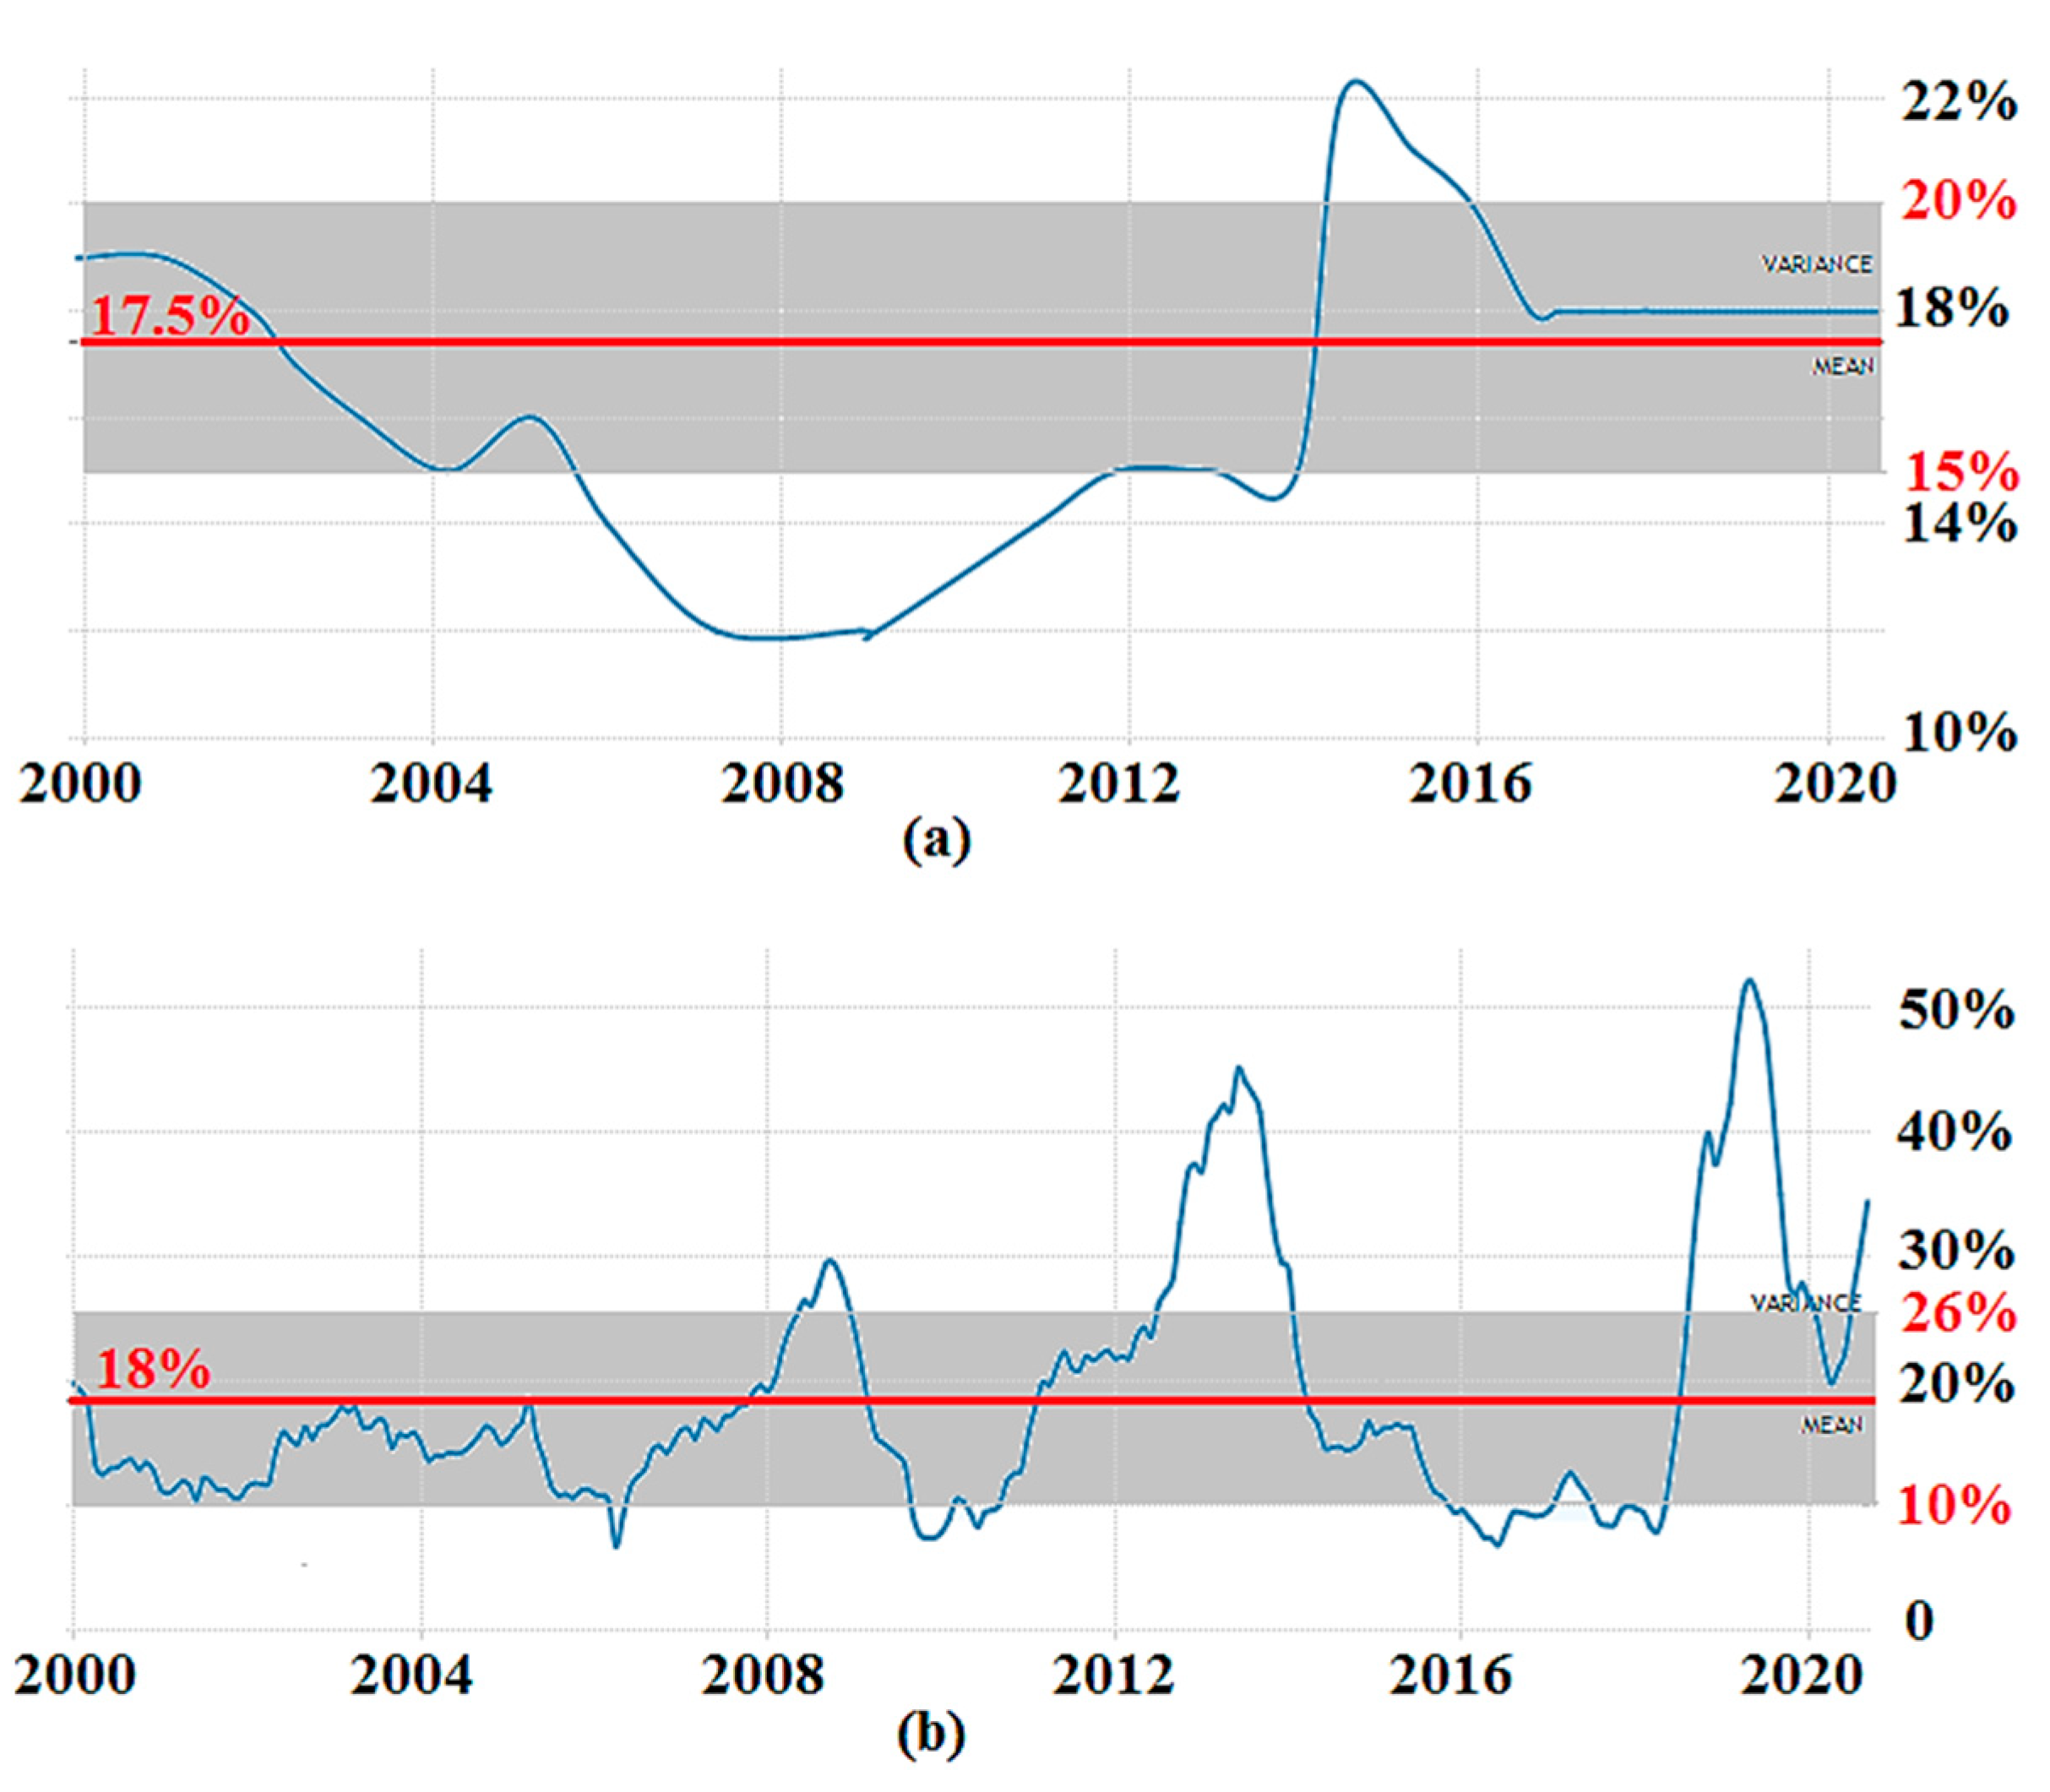
6.1. The Benchmark Case ( = 17.5% and = 18%)
6.2. Analysis of the First Model under Economic Uncertainty
7. Discussion and Suggestions for Implementation
- (I)
- Furnishing the investors or private companies with zero percent or low-rate loans.
- (II)
- Introducing carbon tax to encourage the generation and use of renewable electricity.
- (III)
- Setting strict rules and regulations against carbon-intensive means of generating electricity.
- (IV)
- Developing the concept of green tourism to attract as many national and international visitors as possible. The corresponding revenues can cover a substantial proportion of the project’s costs.
- (V)
- Subsidizing the price of renewable electricity for residents (can be achieved from the resource of funding allocated to operating and maintaining the transmission and distribution network as it would no longer be needed).
- (VI)
- Lifting tariffs on importing equipment such as PV, WT, electrolyzer, FC, etc.
8. Conclusions
- The first model, the PV/WT/electrolyzer/H2-based FC/H2-based boiler, had the highest TNPC ($647,708), the lowest unmet electric load, and the highest reliability without any detrimental impact on the environment.
- The second model, the PV/WT/electrolyzer/H2-based FC/NG-based boiler, possessed the second least TNPC ($548,906), and it could meet almost all electric demand. Whereas, utilizing it would end up releasing some 11.5 tons of CO2 per year. This carbon footprint constitutes a challenging negative point for the second model which may strongly inhibit all the attempts to accomplish the Paris Agreement targets.
- The techno-economic analysis of the third model, the PV/WT/BMG/electrolyzer/H2-based boiler, showed that it would not be reliable, as 20.5% of total electric load could not be met via this system. However, its TNPC, $488,878, was the least amongst the three analyzed configurations.
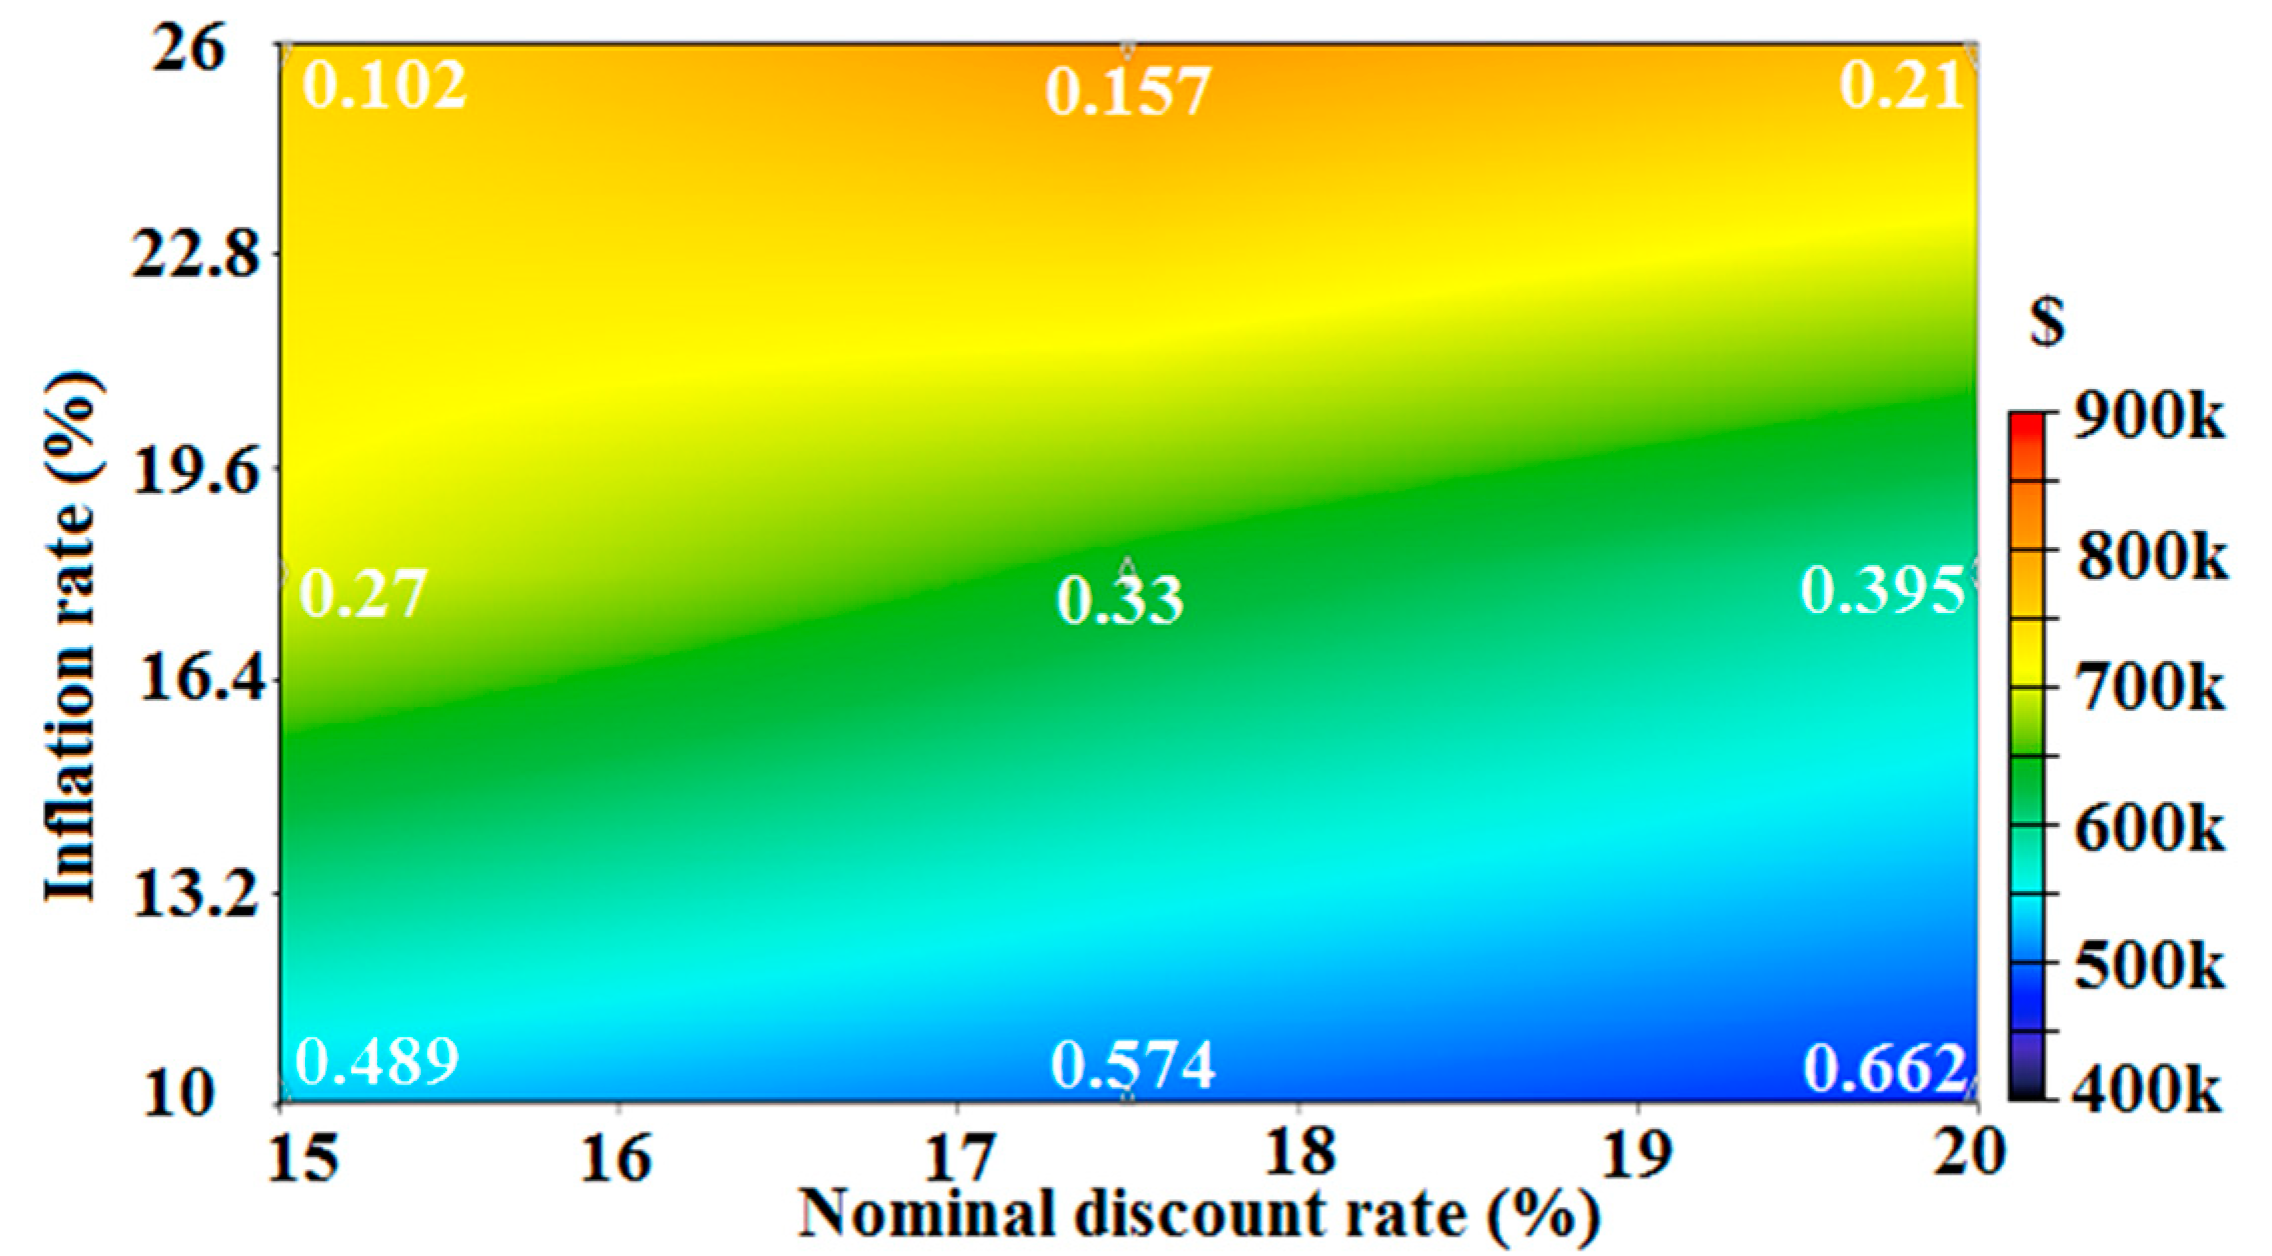
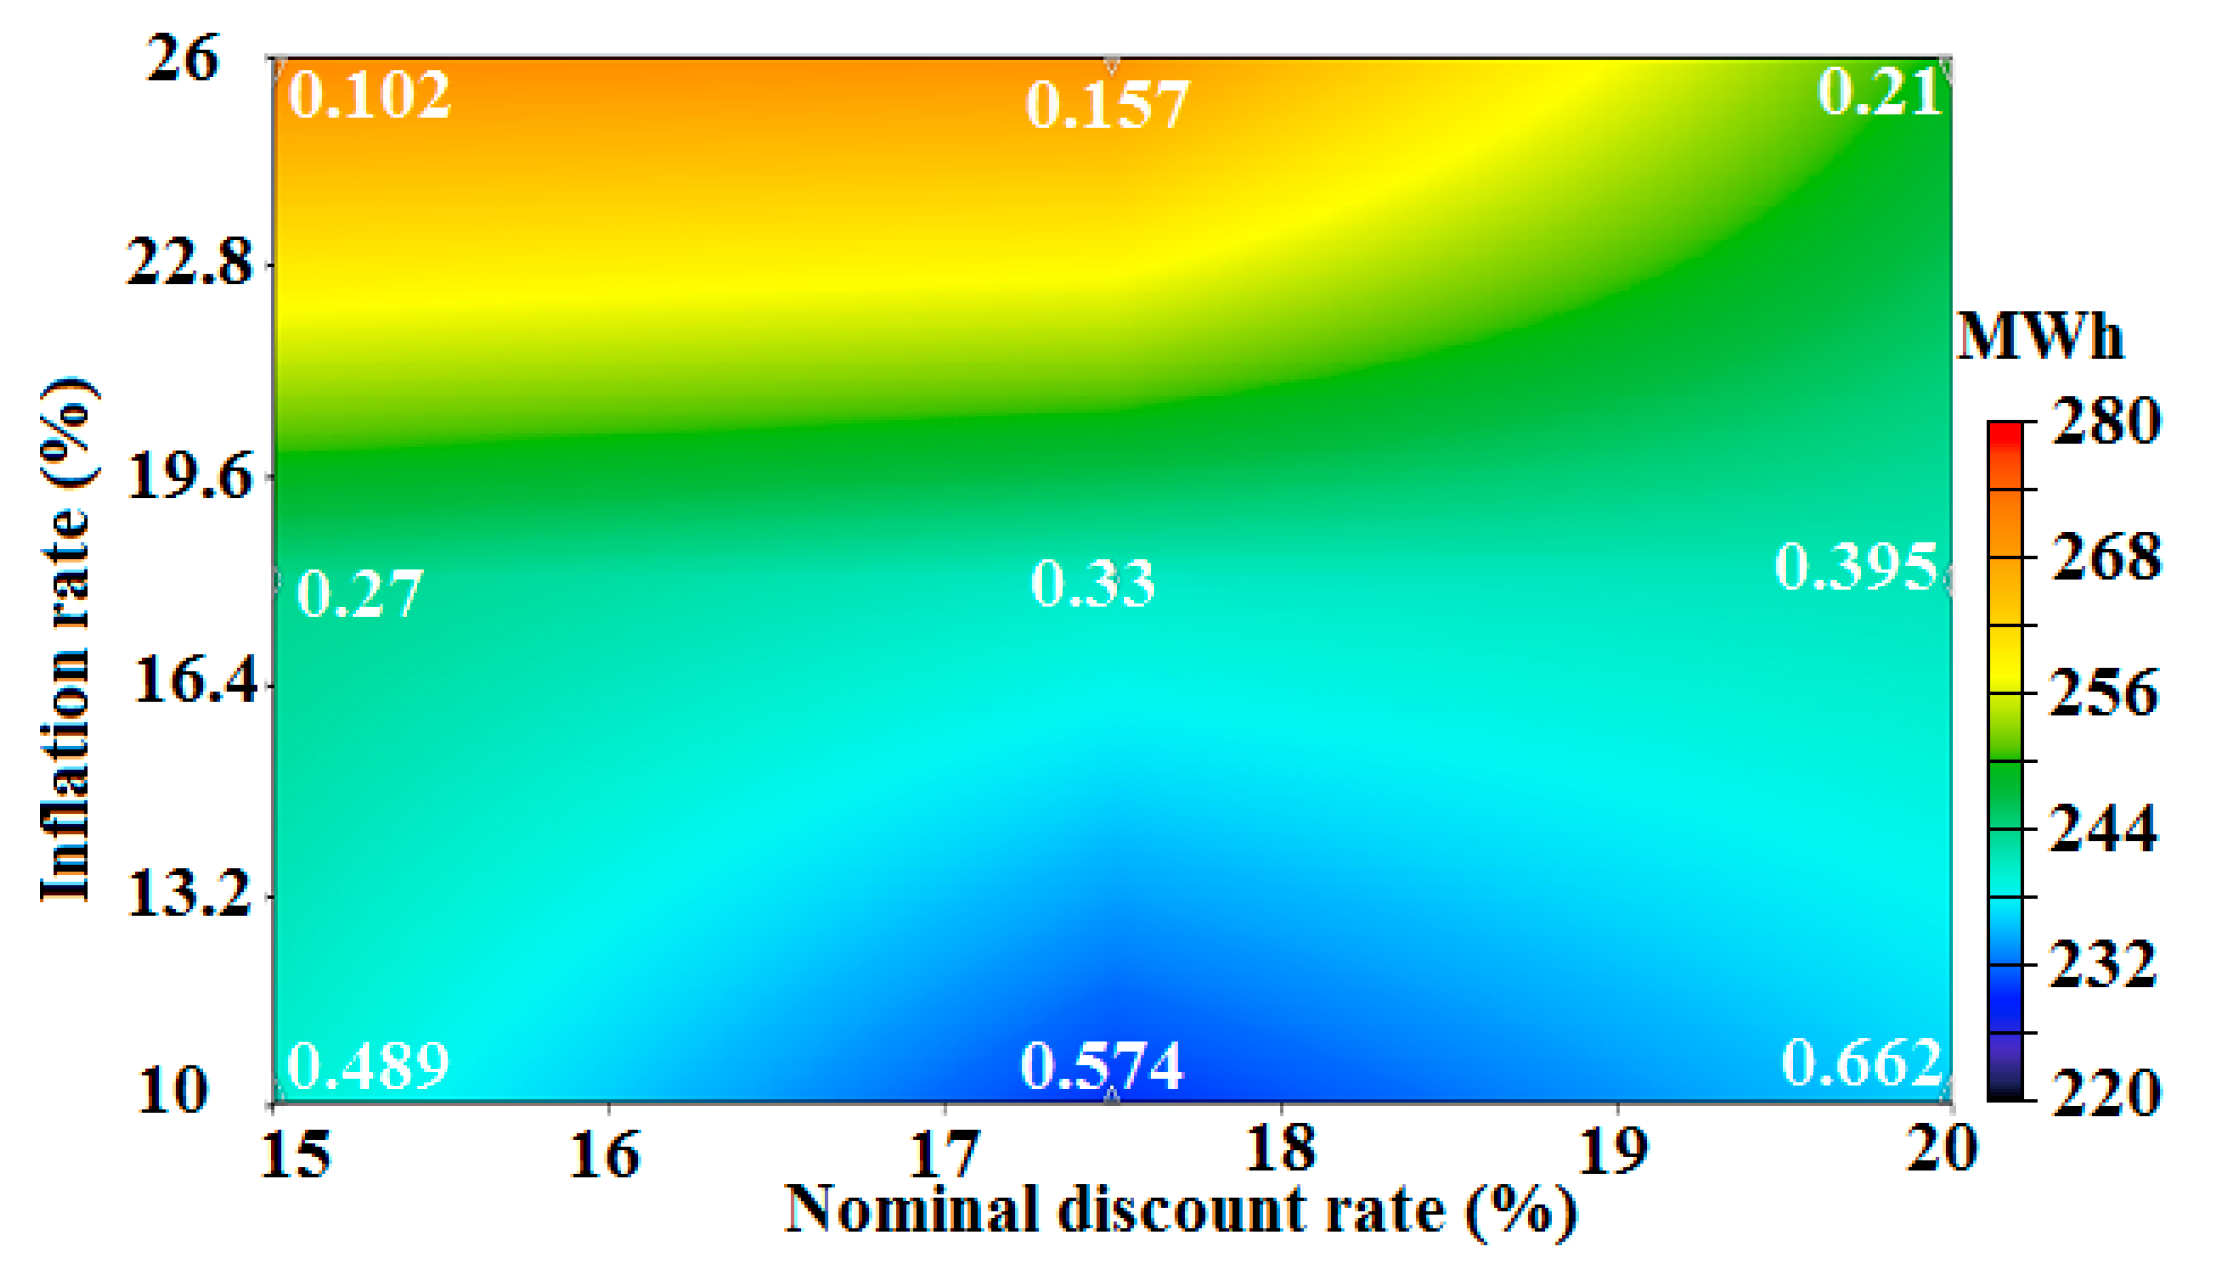
- The amount of LCOE would vary from 0.102 $/kWh to 0.662 $/kWh, meaning LCOE could be between one-third of the benchmark value and two-fold that (LCOE for the benchmark case = 0.33 $/kWh). Additionally, TNPC would fluctuate between $478,704 and $814,905 from 26% less than the benchmark value up to 26% more than that (TNPC for the benchmark case = $647,708).
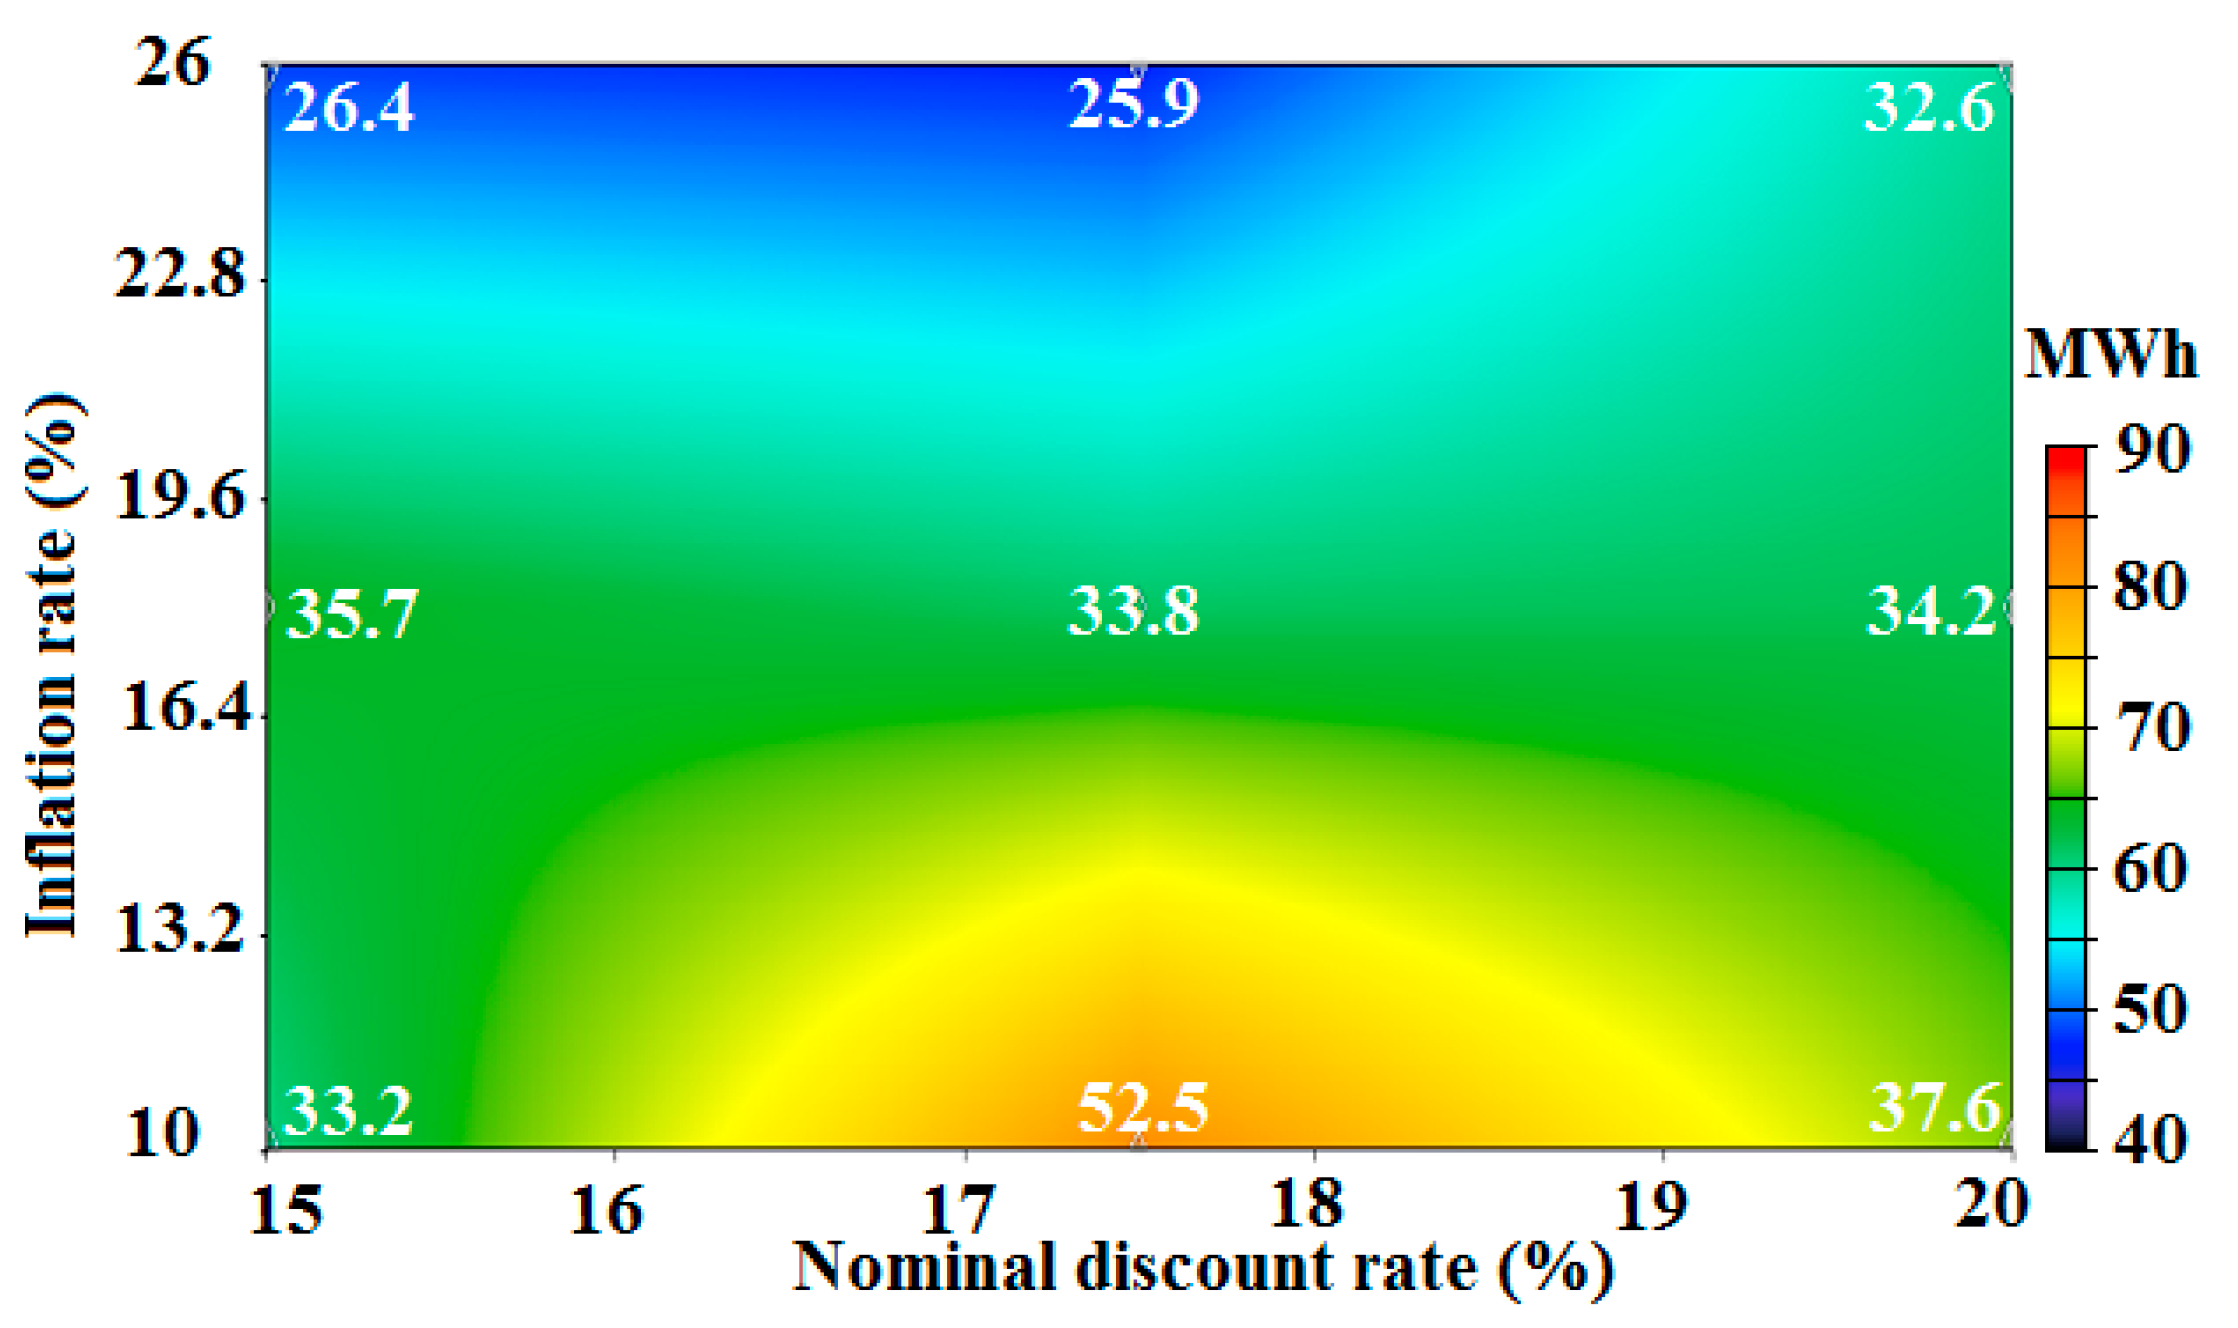
- The optimal size of PV and the number of WT units would change from 25.9 to 52.5 kW and from 11 to 18, respectively. Comparing with the benchmark case (PV size = 33.8 kW and number of WT units = 14), the PV size could vary from an amount of 23% less than the benchmark case up to 55% more than that, and corresponding figures for WT would be 21% and 29%, respectively.
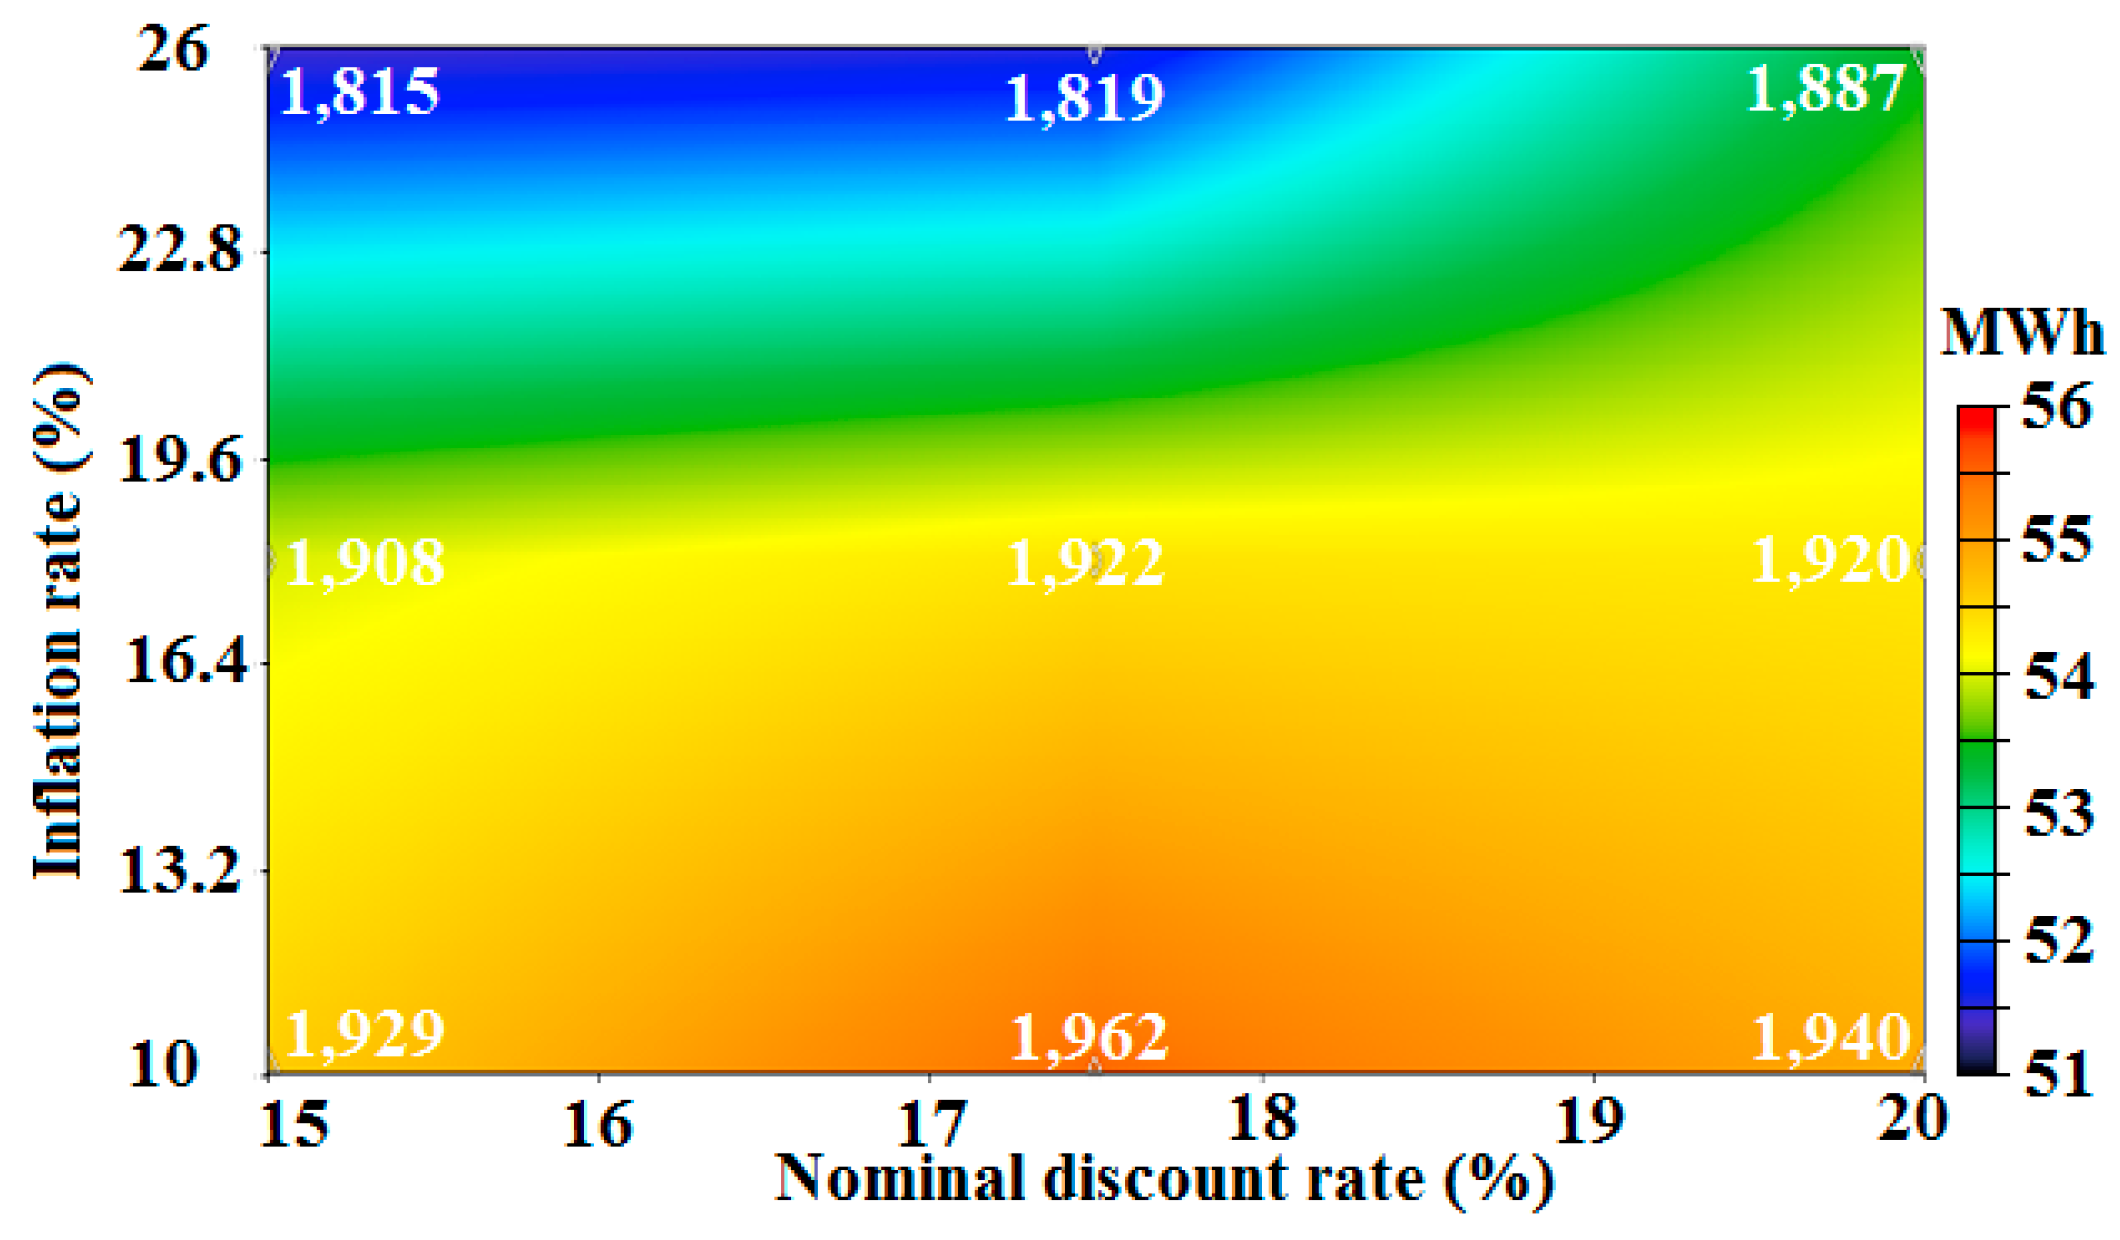
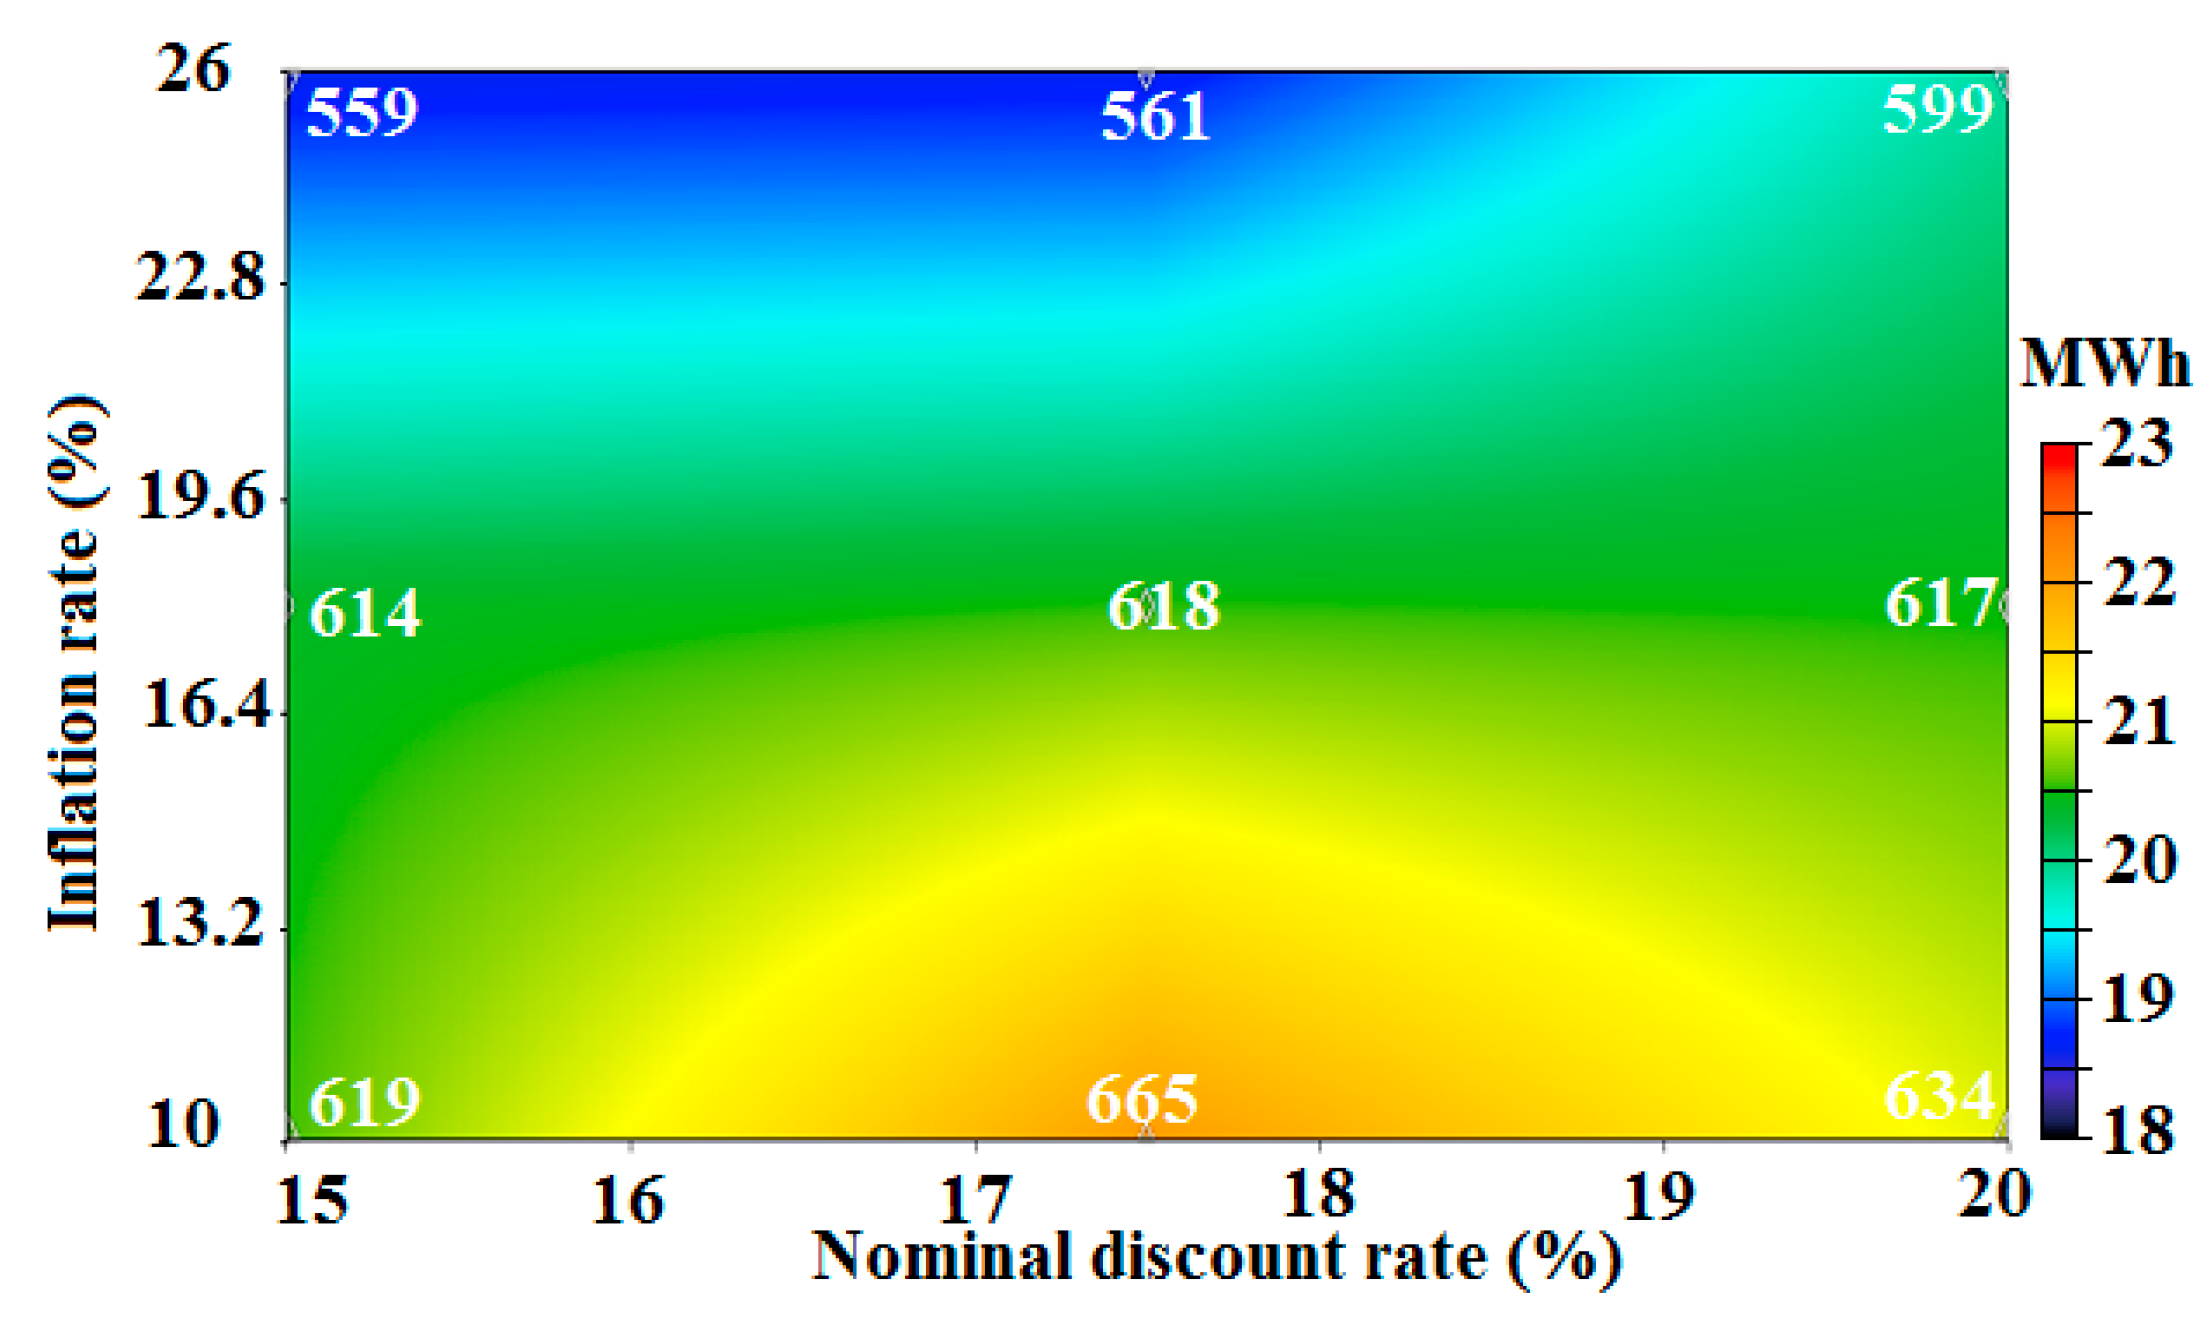
- The amount of renewable H2 consumed by boiler and FC would be in the ranges of 1815–1962 kg and 559–665 kg, respectively. When comparing with the benchmark (H2 consumption in boiler = 1922 kg and that in FC = 618), the former would fluctuate from an amount of 6% less than the benchmark value up to an amount of 2% more than that, and related numbers for FC would be 10% and 8%, respectively.
9. Future Research Direction
Author Contributions
Funding
Institutional Review Board Statement
Informed Consent Statement
Data Availability Statement
Conflicts of Interest
Nomenclature
| AC | Alternating Current |
| and | Curve consumption coefficients (kW/kg/h) of electrolyzer |
| BMG | Biomass generator |
| Biomass’s calorific value | |
| Compressibility rate of hydrogen | |
| Operating cost ($) | |
| Replacement cost ($) | |
| Capacity rate factor | |
| Total annualized cost ($) | |
| Total initial capital cost ($) | |
| Capacity utilization factor | |
| DC | Direct Current |
| DG | Diesel generator |
| Open circuit voltage (v) | |
| Annual output electricity of a biomass gasifier (kW) | |
| Required electricity by the electrolyzer (kW) | |
| Electricity sold to the grid (kWh/yr) | |
| AC primary load served (kWh/yr) | |
| DC primary load served (kWh/yr) | |
| Annual inflation rate (%) | |
| Faraday constant | |
| FC | Fuel cell |
| Degradation factor (%) of PV | |
| Solar radiation (W/m2) | |
| Amount of solar radiation at which NOCT is defined which equals 800 W/m2 | |
| Standard radiation (W/m2) | |
| Surface roughness length (m) | |
| Hydrogen | |
| Anemometer height (m) | |
| Hub height (m) | |
| Hydrogen production rate | |
| HRE | Hybrid renewable energy |
| Real annual discount rate (%) | |
| Nominal discount rate (%) | |
| Electrolyzer current (A) | |
| Fuel cell current (A) | |
| kg | Kilogram |
| kW | Kilowatt |
| kWh | Kilowatt hour |
| LCOE | Levelized cost of electricity ($/kWh) |
| LHV | Lower heating value (MJ/kg) |
| NG | Natural gas |
| Air density at standard pressure and temperature (kg/m3) | |
| Project lifetime (yr) | |
| Number of cells in series in the electrolyzer | |
| Lifetime of a component (yr) | |
| Total number of cells in the fuel cell | |
| Hours of operating biomass gasifier (h) | |
| Oxygen | |
| Rating of a biomass gasifier system | |
| Maximum rating of biomass gasifier | |
| Input power of inverter | |
| Output power of inverter | |
| Pressure of hydrogen in the tank | |
| Power output of PV system (kW) | |
| PV | Photovoltaic |
| Power output of wind turbine (kW) | |
| Wind turbine output under STC (kW) | |
| Mass flowrate of hydrogen (kg/h) | |
| Nominal mass flowrate of hydrogen (kg/h) | |
| Salvage value of a component ($) | |
| Temperature | |
| Ambient temperature (°C) | |
| Ambient temperature at which NOCT is defined which equals 20 °C | |
| Total amount of biomass | |
| PV cell temperature (°C) | |
| Nominal operating cell temperature (°C) | |
| Standard PV cell temperature (°C) | |
| TLC | Thermal load controller |
| TNPC | Total net present cost ($) |
| Wind speed at the anemometer height (m/s) | |
| Wind speed at the hub height (m/s) | |
| The coefficient of heat transfer (kW/m2) | |
| Average voltage of a cell in the fuel cell (v) | |
| Activation fuel cell overvoltage (v) | |
| Concentration fuel cell overvoltage (v) | |
| Fuel cell output voltage (v) | |
| Volume of hydrogen in tank | |
| Ohmic fuel cell overvoltage (v) | |
| W | Watt |
| WT | Wind turbine |
| Rated capacity of PV system (kW) | |
| yr | Year |
| α | Solar absorption of PV array (%) |
| Temperature coefficient (%/°C) | |
| °C | Degree Celsius |
| τ | Transmittance of the cover over PV system |
| Real air density (kg/m3) | |
| Electrical conversion efficiency of PV system | |
| Biomass to electricity conversion efficiency | |
| Fuel cell efficiency | |
| Inverter efficiency | |
| Hydrogen gas constant (4124.18 Nm/kg.K) |
References
- Al-Ghussain, L.; Ahmad, A.D.; Abubaker, A.M.; Mohamed, M.A. An integrated photovoltaic/wind/biomass and hybrid energy storage systems towards 100% renewable energy microgrids in university campuses. Sustain. Energy Technol. Assess. 2021, 46, 101273. [Google Scholar]
- Mostafaeipour, A.; Rezayat, H.; Rezaei, M. A thorough investigation of solar-powered hydrogen potential and accurate location planning for big cities: A case study. Int. J. Hydrogen Energy 2020, 45, 31599–31611. [Google Scholar] [CrossRef]
- Mohamed, M.A.; Abdullah, H.M.; El-Meligy, M.A.; Sharaf, M.; Soliman, A.T.; Hajjiah, A. A novel fuzzy cloud stochastic framework for energy management of renewable microgrids based on maximum deployment of electric vehicles. Int. J. Electr. Power Energy Syst. 2021, 129, 106845. [Google Scholar] [CrossRef]
- Rezaei, M.; Mostafaeipour, A.; Jafari, N.; Naghdi-Khozani, N.; Moftakharzadeh, A. Wind and solar energy utilization for seawater desalination and hydrogen production in the coastal areas of southern Iran. J. Eng. Des. Technol. 2020, 18, 1951–1969. [Google Scholar] [CrossRef]
- Rezaei, M.; Khalilpour, K.R.; Mohamed, M.A. Co-production of electricity and hydrogen from wind: A comprehensive scenario-based techno-economic analysis. Int. J. Hydrogen Energy 2021, 46, 18242–18256. [Google Scholar] [CrossRef]
- Samy, M.M.; Mosaad, M.I.; Barakat, S. Optimal economic study of hybrid PV-wind-fuel cell system integrated to unreliable electric utility using hybrid search optimization technique. Int. J. Hydrogen Energy 2020, 46, 11217–11231. [Google Scholar] [CrossRef]
- Wang, S.; Wang, S.; Liu, J. Life-cycle green-house gas emissions of onshore and offshore wind turbines. J. Clean. Prod. 2019, 210, 804–810. [Google Scholar] [CrossRef]
- Sedaghat, A.; Mostafaeipour, A.; Rezaei, M.; Jahangiri, M.; Mehrabi, A. A new semi-empirical wind turbine capacity factor for maximizing annual electricity and Hydrogen production. Int. J. Hydrogen Energy 2020, 45, 15888–15903. [Google Scholar] [CrossRef]
- Al-Ghussain, L.; Ahmad, A.D.; Abubaker, A.M.; Abujubbeh, M.; Almalaq, A.; Mohamed, M.A. A Demand-Supply Matching-Based Approach for Mapping Renewable Resources Towards 100% Renewable Grids in 2050. IEEE Access 2021, 9, 58634–58651. [Google Scholar] [CrossRef]
- Alshammari, N.; Asumadu, J. Optimum unit sizing of hybrid renewable energy system utilizing harmony search, Jaya and particle swarm optimization algorithms. Sustain. Cities Soc. 2020, 60, 102255. [Google Scholar] [CrossRef]
- Mohamed, M.A.; Almalaq, A.; Abdullah, H.M.; Alnowibet, K.A.; Alrasheedi, A.F.; Zaindin, M.S.A. A Distributed Stochastic Energy Management Framework Based-Fuzzy-PDMM for Smart Grids Considering Wind Park and Energy Storage Systems. IEEE Access 2021, 9, 46674–46685. [Google Scholar] [CrossRef]
- Abbassi, A.; Dami, M.A.; Jemli, M. A statistical approach for hybrid energy storage system sizing based on capacity distributions in an autonomous PV/Wind power generation system. Renew. Energy 2017, 103, 81–93. [Google Scholar] [CrossRef]
- Guo, S.; He, Y.; Pei, H.; Wu, S. The multi-objective capacity optimization of wind-photovoltaic-thermal energy storage hybrid power system with electric heater. Sol. Energy 2020, 195, 138–149. [Google Scholar] [CrossRef]
- Attemene, N.S.; Agbli, K.S.; Fofana, S.; Hissel, D. Optimal sizing of a wind, fuel cell, electrolyzer, battery and supercapacitor system for off-grid applications. Int. J. Hydrogen Energy 2020, 45, 5512–5525. [Google Scholar] [CrossRef]
- Alsharif, M.; Nordin, R.; Ismail, M. Energy optimisation of hybrid off-grid system for remote telecommunication base station deployment in Malaysia. EURASIP J. Wirel. Commun. Netw. 2015, 64, 1–15. [Google Scholar] [CrossRef] [Green Version]
- Aris, A.M.; Shabani, B. Sustainable Power Supply Solutions for Off-Grid Base Stations. Energy 2015, 8, 10904–10941. [Google Scholar] [CrossRef] [Green Version]
- Rajanna, S.; Saini, R.P. Development of optimal integrated renewable energy model with battery storage for a remote Indian area. Energy 2016, 111, 803–817. [Google Scholar] [CrossRef]
- Samy, M.M.; Elkhouly, H.I.; Barakat, S. Multi-objective optimization of hybrid renewable energy system based on biomass and fuel cells. Int. J. Energy Res. 2020, 45, 8214–8230. [Google Scholar] [CrossRef]
- Rosso-Cerón, A.M.; Kafarov, V.; Latorre-Bayona, G.; Quijano-Hurtado, R. A novel hybrid approach based on fuzzy multi-criteria decision-making tools for assessing sustainable alternatives of power generation in San Andrés Island. Renew. Sustain. Energy Rev. 2019, 110, 159–173. [Google Scholar] [CrossRef]
- Mytilinou, V.; Kolios, A.J. Techno-economic optimisation of offshore wind farms based on life cycle cost analysis on the UK. Renew. Energy 2019, 132, 439–454. [Google Scholar] [CrossRef]
- Ould Amrouche, S.; Rekioua, D.; Rekioua, T.; Bacha, S. Overview of energy storage in renewable energy systems. Int. J. Hydrogen Energy 2016, 41, 20914–20927. [Google Scholar] [CrossRef]
- Nordin, N.D.; Rahman, H.A. Comparison of optimum design, sizing, and economic analysis of standalone photovoltaic/battery without and with Hydrogen production systems. Renew. Energy 2019, 141, 107–123. [Google Scholar] [CrossRef]
- Available online: tradingeconomics.com (accessed on 21 March 2021).
- Borowski, P.F. Significance and Directions of Energy Development in African Countries. Energy 2021, 14, 4479. [Google Scholar] [CrossRef]
- Borowski, P.F. Adaptation strategy on regulated markets of power companies in Poland. Energy Environ. 2019, 30, 3–26. [Google Scholar] [CrossRef]
- Bakhtiari, H.; Zhong, J.; Alvarez, M. Predicting the stochastic behavior of uncertainty sources in planning a stand-alone renewable energy-based microgrid using Metropolis–coupled Markov chain Monte Carlo simulation. Appl. Energy 2021, 290, 116719. [Google Scholar] [CrossRef]
- Bouchekara, H.R.E.-H.; Javaid, M.S.; Shaaban, Y.A.; Shahriar, M.S.; Ramli, M.A.M.; Latreche, Y. Decomposition based multiobjective evolutionary algorithm for PV/Wind/Diesel Hybrid Microgrid System design considering load uncertainty. Energy Rep. 2021, 7, 52–69. [Google Scholar] [CrossRef]
- Blazquez, J.; Nezamuddin, N.; Zamrik, T. Economic policy instruments and market uncertainty: Exploring the impact on renewables adoption. Renew. Sustain. Energy Rev. 2018, 94, 224–233. [Google Scholar] [CrossRef]
- Ebrahimi, J.; Abedini, M.; Rezaei, M.M.; Nasri, M. Optimum design of a multi-form energy in the presence of electric vehicle charging station and renewable resources considering uncertainty. Sustain. Energy Grids Netw. 2020, 23, 100375. [Google Scholar] [CrossRef]
- Li, J.; Huang, S.; Abedinia, O. Investigation in Economic Analysis of Microgrids based on Renewable Energy Uncertainty and Demand Response in the Electricity Market. Energy 2021, 225, 120247. [Google Scholar]
- Barati, F.; Jadid, S.; Zangeneh, A. Private investor-based distributed generation expansion planning considering uncertainties of renewable generations. Energy 2019, 173, 1078–1091. [Google Scholar] [CrossRef]
- Mirzamohammadi, S.; Jabarzadeh, A.; Shahrabi, M.S. Long-term planning of supplying energy for greenhouses using renewable resources under uncertainty. J. Clean. Prod. 2020, 264, 121611. [Google Scholar] [CrossRef]
- Liu, B.; Lund, J.R.; Liao, S.; Jin, X.; Liu, L.; Cheng, C. Optimal power peak shaving using hydropower to complement wind and solar power uncertainty. Energy Convers. Manag. 2020, 209, 112628. [Google Scholar] [CrossRef]
- Li, Y.; Zhang, F.; Li, Y.; Wang, Y. An improved two-stage robust optimization model for CCHP-P2G microgrid system considering multi-energy operation under wind power outputs uncertainties. Energy 2021, 223, 120048. [Google Scholar] [CrossRef]
- Tan, Q.; Wen, X.; Sun, Y.; Lei, X.; Wang, Z.; Qin, G. Evaluation of the risk and benefit of the complementary operation of the large wind-photovoltaic-hydropower system considering forecast uncertainty. Appl. Energy 2021, 285, 116442. [Google Scholar] [CrossRef]
- Ezbakhe, F.; Pérez-Foguet, A. Decision analysis for sustainable development: The case of renewable energy planning under uncertainty. Eur. J. Oper. Res. 2021, 291, 601–613. [Google Scholar] [CrossRef]
- Fitiwi, D.Z.; Lynch, M.; Bertsch, V. Power system impacts of community acceptance policies for renewable energy deployment under storage cost uncertainty. Renew. Energy 2020, 156, 893–912. [Google Scholar] [CrossRef]
- Scott, I.J.; Botterud, A.; Carvalho, P.M.S.; Silva, C.A.S. Renewable energy support policy evaluation: The role of long-term uncertainty in market modelling. Appl. Energy 2020, 278, 115643. [Google Scholar] [CrossRef]
- Tsao, Y.-C.; Thanh, V.-V. Toward blockchain-based renewable energy microgrid design considering default risk and demand uncertainty. Renew. Energy 2021, 163, 870–881. [Google Scholar] [CrossRef]
- Yang, J.; Su, C. Robust optimization of microgrid based on renewable distributed power generation and load demand uncertainty. Energy 2021, 223, 120043. [Google Scholar] [CrossRef]
- Wang, C.; Zhang, Z.; Abedinia, O.; Farkoush, S.G. Modeling and analysis of a microgrid considering the uncertainty in renewable energy resources, energy storage systems and demand management in electrical retail market. J. Energy Storage 2021, 33, 102111. [Google Scholar] [CrossRef]
- Xu, H.; Meng, Z.; Wang, Y. Economic dispatching of microgrid considering renewable energy uncertainty and demand side response. Energy Rep. 2020, 6, 196–204. [Google Scholar] [CrossRef]
- Yuan, W.; Liu, Z.; Su, C.; Wang, X. Photovoltaic capacity optimization of small and medium-sized hydro-photovoltaic hybrid energy systems considering multiple uncertainties. J. Clean. Prod. 2020, 276, 124170. [Google Scholar] [CrossRef]
- Zhang, H.; Hu, X.; Cheng, H.; Zhang, S.; Hong, S.; Gu, Q. Coordinated scheduling of generators and tie lines in multi-area power systems under wind energy uncertainty. Energy 2021, 222, 119929. [Google Scholar] [CrossRef]
- Zhang, Y.; Gu, C.; Yan, X.; Li, F. Cournot oligopoly game-based local energy trading considering renewable energy uncertainty costs. Renew. Energy 2020, 159, 1117–1127. [Google Scholar] [CrossRef]
- Zhang, Z.; Qin, H.; Li, J.; Liu, Y.; Yao, L.; Wang, Y.; Wang, C.; Pei, S.; Zhou, J. Short-term optimal operation of wind-solar-hydro hybrid system considering uncertainties. Energy Convers. Manag. 2020, 205, 112405. [Google Scholar] [CrossRef]
- Zhu, F.; Zhong, P.A.; Xu, B.; Liu, W.; Wang, W.; Sun, Y.; Chen, J.; Li, J. Short-term stochastic optimization of a hydro-wind-photovoltaic hybrid system under multiple uncertainties. Energy Convers. Manag. 2020, 214, 112902. [Google Scholar] [CrossRef]
- Olatomiwa, L.; Mekhilef, S.; Huda, A.S.N.; Ohunakin, O.S. Economic evaluation of hybrid energy systems for rural electrification in six geo-political zones of Nigeria. Renew. Energy 2015, 83, 435–446. [Google Scholar] [CrossRef]
- Olatomiwa, L.; Mekhilef, S.; Huda, A.S.N.; Sanusi, K. Techno-economic analysis of hybrid PV–diesel–battery and PV–wind–diesel–battery power systems for mobile BTS: The way forward for rural development. Energy Sci. Eng. 2015, 3, 271–285. [Google Scholar] [CrossRef]
- Brenna, M.; Foiadelli, F.; Longo, M.; Abegaz, T.D. Integration and Optimization of Renewables and Storages for Rural Electrification. Sustainability 2016, 8, 982. [Google Scholar] [CrossRef] [Green Version]
- Isa, N.M.; Das, H.S.; Tan, C.W.; Yatim, A.H.M.; Lau, K.Y. A techno-economic assessment of a combined heat and power photovoltaic/fuel cell/battery energy system in Malaysia hospital. Energy 2016, 112, 75–90. [Google Scholar] [CrossRef]
- Singh, A.; Baredar, P. Techno-economic assessment of a solar PV, fuel cell, and biomass gasifier hybrid energy system. Energy Rep. 2016, 2, 254–260. [Google Scholar] [CrossRef] [Green Version]
- Singh, S.; Singh, M.; Kaushik, S.C. Feasibility study of an islanded microgrid in rural area consisting of PV, wind, biomass and battery energy storage system. Energy Convers. Manag. 2016, 128, 178–190. [Google Scholar] [CrossRef]
- Das, B.K.; Hoque, N.; Mandal, S.; Pal, T.K.; Raihan, M.A. A techno-economic feasibility of a stand-alone hybrid power generation for remote area application in Bangladesh. Energy 2017, 134, 775–788. [Google Scholar] [CrossRef]
- Das, H.S.; Tan, C.W.; Yatim, A.H.M.; Lau, K.Y. Feasibility analysis of hybrid photovoltaic/battery/fuel cell energy system for an indigenous residence in East Malaysia. Renew. Sustain. Energy Rev. 2017, 76, 1332–1347. [Google Scholar] [CrossRef]
- Khemariya, M.; Mittal, A.; Baredar, P.; Singh, A. Cost and size optimization of solar photovoltaic and fuel cell based integrated energy system for un-electrified village. J. Energy Storage 2017, 14, 62–70. [Google Scholar] [CrossRef]
- Rajbongshi, R.; Borgohain, D.; Mahapatra, S. Optimization of PV-biomass-diesel and grid base hybrid energy systems for rural electrification by using HOMER. Energy 2017, 126, 461–474. [Google Scholar] [CrossRef]
- Shahzad, M.K.; Zahid, A.; ur Rashid, T.; Rehan, M.A.; Ali, M.; Ahmad, M. Techno-economic feasibility analysis of a solar-biomass off grid system for the electrification of remote rural areas in Pakistan using HOMER software. Renew. Energy 2017, 106, 264–273. [Google Scholar] [CrossRef]
- Ahmad, J.; Imran, M.; Khalid, A.; Iqbal, W.; Ashraf, S.R.; Adnan, M.; Ali, S.F.; Khokhar, K.S. Techno economic analysis of a wind-photovoltaic-biomass hybrid renewable energy system for rural electrification: A case study of Kallar Kahar. Energy 2018, 148, 208–234. [Google Scholar] [CrossRef]
- Duman, A.C.; Güler, Ö. Techno-economic analysis of off-grid PV/wind/fuel cell hybrid system combinations with a comparison of regularly and seasonally occupied households. Sustain. Cities Soc. 2018, 42, 107–126. [Google Scholar] [CrossRef]
- Dursun, B.; Aykut, E. An investigation on wind/PV/fuel cell/battery hybrid renewable energy system for nursing home in Istanbul. Proc. Inst. Mech. Eng. Part A J. Power Energy 2019, 233, 616–625. [Google Scholar] [CrossRef]
- Gebrehiwot, K.; Mondal, M.A.H.; Ringler, C.; Gebremeskel, A.G. Optimization and cost-benefit assessment of hybrid power systems for off-grid rural electrification in Ethiopia. Energy 2019, 177, 234–246. [Google Scholar] [CrossRef]
- Groppi, D.; Astiaso Garcia, D.; Lo Basso, G.; Cumo, F.; De Santoli, L. Analysing economic and environmental sustainability related to the use of battery and Hydrogen energy storages for increasing the energy independence of small islands. Energy Convers. Manag. 2018, 177, 64–76. [Google Scholar] [CrossRef]
- Karmaker, A.K.; Ahmed, M.R.; Hossain, M.A.; Sikder, M.M. Feasibility assessment & design of hybrid renewable energy based electric vehicle charging station in Bangladesh. Sustain. Cities Soc. 2018, 39, 189–202. [Google Scholar]
- Khare, V.; Nema, S.; Baredar, P. Optimisation of the hybrid renewable energy system by HOMER, PSO and CPSO for the study area. Int. J. Sustain. Energy 2017, 36, 326–343. [Google Scholar] [CrossRef]
- Pavan Kumar, Y.V.; Bhimasingu, R. Renewable energy based microgrid system sizing and energy management for green buildings. J. Mod. Power Syst. Clean Energy 2015, 3, 1–13. [Google Scholar] [CrossRef] [Green Version]
- Baneshi, M.; Hadianfard, F. Techno-economic feasibility of hybrid diesel/PV/wind/battery electricity generation systems for non-residential large electricity consumers under southern Iran climate conditions. Energy Convers. Manag. 2016, 127, 233–244. [Google Scholar] [CrossRef]
- Li, C.; Zhou, D.; Zheng, Y. Techno-economic comparative study of grid-connected PV power systems in five climate zones, China. Energy 2018, 165, 1352–1369. [Google Scholar] [CrossRef]
- Mandal, S.; Das, B.K.; Hoque, N. Optimum sizing of a stand-alone hybrid energy system for rural electrification in Bangladesh. J. Clean. Prod. 2018, 200, 12–27. [Google Scholar] [CrossRef]
- Olatomiwa, L.; Blanchard, R.; Mekhilef, S.; Akinyele, D. Hybrid renewable energy supply for rural healthcare facilities: An approach to quality healthcare delivery. Sustain. Energy Technol. Assess. 2018, 30, 121–138. [Google Scholar] [CrossRef] [Green Version]
- Oulis Rousis, A.; Tzelepis, D.; Konstantelos, I.; Booth, C.; Strbac, G. Design of a Hybrid AC/DC Microgrid Using HOMER Pro: Case Study on an Islanded Residential Application. Invention 2018, 3, 55. [Google Scholar] [CrossRef] [Green Version]
- Robert, F.C.; Gopalan, S. Low cost, highly reliable rural electrification through a combination of grid extension and local renewable energy generation. Sustain. Cities Soc. 2018, 42, 344–354. [Google Scholar] [CrossRef]
- Abdin, Z.; Mérida, W. Hybrid energy systems for off-grid power supply and Hydrogen production based on renewable energy: A techno-economic analysis. Energy Convers. Manag. 2019, 196, 1068–1079. [Google Scholar] [CrossRef]
- Abnavi, M.D.; Mohammadshafie, N.; Rosen, M.A.; Dabbaghian, A.; Fazelpour, F. Techno-economic feasibility analysis of stand-alone hybrid wind/photovoltaic/diesel/battery system for the electrification of remote rural areas: Case study Persian Gulf Coast-Iran. Environ. Prog. Sustain. Energy 2019, 38, 13172. [Google Scholar] [CrossRef]
- Das, B.K.; Al-Abdeli, Y.M.; Woolridge, M. Effects of battery technology and load scalability on stand-alone PV/ICE hybrid micro-grid system performance. Energy 2019, 168, 57–69. [Google Scholar] [CrossRef]
- Kumar, K.; Alam, M.; Dutta, V. Techno-economic analysis of metal hydride-based energy storage system in microgrid. Energy Storage 2019, 1, e62. [Google Scholar] [CrossRef] [Green Version]
- Li, C. Techno-economic study of off-grid hybrid photovoltaic/battery and photovoltaic/battery/fuel cell power systems in Kunming, China. Energy Sources Part A Recovery Util. Environ. Eff. 2019, 41, 1588–1604. [Google Scholar] [CrossRef]
- Li, C.; Zhou, D.; Wang, H.; Cheng, H.; Li, D. Feasibility assessment of a hybrid PV/diesel/battery power system for a housing estate in the severe cold zone—A case study of Harbin, China. Energy 2019, 185, 671–681. [Google Scholar] [CrossRef]
- Luta, D.N.; Raji, A.K. Optimal sizing of hybrid fuel cell-supercapacitor storage system for off-grid renewable applications. Energy 2019, 166, 530–540. [Google Scholar] [CrossRef]
- Marino, C.; Nucara, A.; Panzera, M.F.; Pietrafesa, M.; Varano, V. Energetic and economic analysis of a stand alone photovoltaic system with Hydrogen storage. Renew. Energy 2019, 142, 316–329. [Google Scholar] [CrossRef]
- Muh, E.; Tabet, F. Comparative analysis of hybrid renewable energy systems for off-grid applications in Southern Cameroons. Renew. Energy 2019, 135, 41–54. [Google Scholar] [CrossRef]
- Murugaperumal, K.; Ajay DVimal Raj, P. Feasibility design and techno-economic analysis of hybrid renewable energy system for rural electrification. Sol. Energy 2019, 188, 1068–1083. [Google Scholar] [CrossRef]
- Razmjoo, A.; Davarpanah, A. Developing various hybrid energy systems for residential application as an appropriate and reliable way to achieve Energy sustainability. Energy Sources Part A Recovery Util. Environ. Eff. 2019, 41, 1180–1193. [Google Scholar] [CrossRef]
- Tiwary, A.; Spasova, S.; Williams, I.D. A community-scale hybrid energy system integrating biomass for localised solid waste and renewable energy solution: Evaluations in UK and Bulgaria. Renew. Energy 2019, 139, 960–967. [Google Scholar] [CrossRef]
- Arévalo, P.; Benavides, D.; Lata-García, J.; Jurado, F. Energy control and size optimization of a hybrid system (photovoltaic-hidrokinetic) using various storage technologies. Sustain. Cities Soc. 2020, 52, 101773. [Google Scholar] [CrossRef]
- Azerefegn, T.M.; Bhandari, R.; Ramayya, A.V. Techno-economic analysis of grid-integrated PV/wind systems for electricity reliability enhancement in Ethiopian industrial park. Sustain. Cities Soc. 2020, 53, 101915. [Google Scholar] [CrossRef]
- Temiz, M.; Javani, N. Design and analysis of a combined floating photovoltaic system for electricity and Hydrogen production. Int. J. Hydrogen Energy 2020, 45, 3457–3469. [Google Scholar] [CrossRef]
- Vendoti, S.; Muralidhar, M.; Kiranmayi, R. Techno-economic analysis of off-grid solar/wind/biogas/biomass/fuel cell/battery system for electrification in a cluster of villages by HOMER software. Environ. Dev. Sustain. 2020, 23, 351–372. [Google Scholar] [CrossRef]
- Available online: Wikipedia.com (accessed on 11 February 2021).
- Available online: www.amar.org.ir (accessed on 19 February 2021).
- Sinha, S.; Chandel, S.S. Review of software tools for hybrid renewable energy systems. Renew. Sustain. Energy Rev. 2014, 32, 192–205. [Google Scholar] [CrossRef]
- Vaziri Rad, M.A.; Ghasempour, R.; Rahdan, P.; Mousavi, S.; Arastounia, M. Techno-economic analysis of a hybrid power system based on the cost-effective Hydrogen production method for rural electrification, a case study in Iran. Energy 2020, 190, 116421. [Google Scholar]
- Razmjoo, A.; Gakenia Kaigutha, L.; Vaziri Rad, M.A.; Marzband, M.; Davarpanah, A.; Denai, M.A. Technical analysis investigating energy sustainability utilizing reliable renewable energy sources to reduce CO2 emissions in a high potential area. Renew. Energy 2021, 164, 46–57. [Google Scholar] [CrossRef]
- Yimen, N.; Hamandjoda, O.; Meva’a, L.; Ndzana, B.; Nganhou, J. Analyzing of a Photovoltaic/Wind/Biogas/Pumped-Hydro Off-Grid Hybrid System for Rural Electrification in Sub-Saharan Africa—Case Study of Djoundé in Northern Cameroon. Energy 2018, 11, 2644. [Google Scholar] [CrossRef] [Green Version]
- Kasaeian, A.; Rahdan, P.; Rad, M.A.V.; Yan, W.-M. Optimal design and technical analysis of a grid-connected hybrid photovoltaic/diesel/biogas under different economic conditions: A case study. Energy Convers. Manag. 2019, 198, 111810. [Google Scholar] [CrossRef]
- HOMER. The HOMER Pro® Microgrid Software. Available online: http://www.homerenergy.com (accessed on 16 December 2020).
- Akhtari, M.R.; Baneshi, M. Techno-economic assessment and optimization of a hybrid renewable co-supply of electricity, heat and Hydrogen system to enhance performance by recovering excess electricity for a large energy consumer. Energy Convers. Manag. 2019, 188, 131–141. [Google Scholar] [CrossRef]
- Rezaei, M.; Naghdi-Khozani, N.; Jafari, N. Wind energy utilization for Hydrogen production in an underdeveloped country: An economic investigation. Renew. Energy 2020, 147, 1044–1057. [Google Scholar] [CrossRef]
- Rezaei, M.; Khalilpour, K.R.; Jahangiri, M. Multi-criteria location identification for wind/solar based Hydrogen generation: The case of capital cities of a developing country. Int. J. Hydrogen Energy 2020, 45, 33151–33168. [Google Scholar] [CrossRef]
- Singh, A.; Baredar, P.; Gupta, B. Techno-economic feasibility analysis of Hydrogen fuel cell and solar photovoltaic hybrid renewable energy system for academic research building. Energy Convers. Manag. 2017, 145, 398–414. [Google Scholar] [CrossRef]
- Krishnan, K.J.; Kalam, A.; Zayegh, A. Experimental Investigation of H2 Generator and PEM Fuel Cell as a Remote Area Back-Up Power. Procedia Eng. 2012, 49, 66–73. [Google Scholar] [CrossRef]
- Chong, L.W.; Wong, Y.W.; Rajkumar, R.K.; Rajkumar, R.K.; Isa, D. Hybrid energy storage systems and control strategies for stand-alone renewable energy power systems. Renew. Sustain. Energy Rev. 2016, 66, 174–189. [Google Scholar] [CrossRef]
- Ghenai, C.; Bettayeb, M. Modelling and performance analysis of a stand-alone hybrid solar PV/Fuel Cell/Diesel Generator power system for university building. Energy 2019, 171, 180–189. [Google Scholar] [CrossRef]
- Bicer, Y.; Dincer, I. Clean fuel options with Hydrogen for sea transportation: A life cycle approach. Int. J. Hydrogen Energy 2018, 43, 1179–1193. [Google Scholar] [CrossRef]
- Gupta, A.; Saini, R.P.; Sharma, M.P. Steady-state modelling of hybrid energy system for off grid electrification of cluster of villages. Renew. Energy 2010, 35, 520–535. [Google Scholar] [CrossRef]
- Cano, A.; Arévalo, P.; Jurado, F. Energy analysis and techno-economic assessment of a hybrid PV/HKT/BAT system using biomass gasifier: Cuenca-Ecuador case study. Energy 2020, 202, 117727. [Google Scholar] [CrossRef]
- Cumalioglu, I.; Ma, Y.; Ertas, A.; Maxwell, T. High Pressure Hydrogen Storage Tank: A Parametric Design Study. J. Press. Vessel. Technol. 2006, 129, 216–222. [Google Scholar] [CrossRef]
- Lau, K.Y.; Tan, C.W.; Yatim, A.H.M. Photovoltaic systems for Malaysian islands: Effects of interest rates, diesel prices and load sizes. Energy 2015, 83, 204–216. [Google Scholar] [CrossRef]
- Gökçek, M.; Kale, C. Techno-economical evaluation of a Hydrogen refuelling station powered by Wind-PV hybrid power system: A case study for İzmir-Çeşme. Int. J. Hydrogen Energy 2018, 43, 10615–10625. [Google Scholar] [CrossRef]


| Component | Model (Abbreviation) | Technical Specifications | Capital Cost | Replacement Cost | Operation and Maintenance Cost | Ref. for Costs |
|---|---|---|---|---|---|---|
| PV | Fronius Symo 4.5-3-S (Fron4.5) | Rated capacity: 4.4 kW Lifetime: 25 yr Electrical bus: AC Derating factor: 96% Temperature coefficient: −0.41%/°C Operating temperature: 45 °C Efficiency at standard test conditions: 17.3% Ground reflectance: 20% Tracking system: no tacking Panel type: flat plate | 2000 ($/kW) | 2000 ($/kW) | 10 ($/kW.yr) | [97] |
| WT | Bergey Excel 6 (XL6) | Rated capacity: 6 kW Lifetime: 20 yr Electrical bus: AC Hub height: 30 m Rotor diameter: 6.2 m Cut-in wind speed: 2.5 m/s Cut-out wind speed: none | 2000 ($/kW) | 1600 ($/kW) | 50 ($/#.yr) | [62] |
| BMG | Generic Biogas Genset (Bio) | Size: 20 kW Lifetime: 20,000 h Electrical bus: AC Fuel type: animal manure LHV = 19 MJ/kg Gasification ratio: 0.047 kg/kg Density of biogas: 1.15 kg/m3 Carbon content: 44% Daily available biomass: 2000 kg Biogas fuel price: 0 $/kg | 2300 ($/kW) | 1500 ($/kW) | 0.01 ($/op.h) | [53] |
| FC | Generic Fuel Cell (FC) | Size: 20 kW Lifetime: 50,000 h Electrical bus: DC Heat recover ratio: 60% Minimum runtime: 20 min Fuel type: stored hydrogen LHV = 120 MJ/kg Carbon content: 0 Stored hydrogen price: 0 $/kg | 2000 ($/kW) | 1860 ($/kW) | 0.01 ($/op.h) | [92] |
| TLC | Generic thermal load controller (TLC) | Size: 100 kW Lifetime: 20 yr Electrical bus: DC and AC | 54 ($/kW) | 54 ($/kW) | 0 ($/kW) | [97] |
| Boiler | Generic boiler | Efficiency: 85% Fuel type 1: stored hydrogen LHV= 120 MJ/kg Carbon content: 0 Stored hydrogen price: 0 $/kg Fuel type 2: natural gas LHV = 45 MJ/kg Density: 0.79 kg/m3 Carbon content: 67% Natural gas price: 0.3 $/m3 | - | - | - | - |
| Converter | Leonics S-219Cp 5 kW (Leon5) | Lifetime: 10 yr Rectifier efficiency: 94% Rectifier relative capacity: 80% Inverter efficiency: 96% | 550 ($/kW) | 550 ($/kW) | 10 ($/kW/yr) | [108] |
| Electrolyzer | Generic Electrolyzer | Size: specified in model Lifetime: 15 yr Electrical bus: DC Efficiency: 85% | 2000 ($/kW) | 2000 ($/kW) | 50 ($/kW/yr) | [93] |
| H2 Tank | Generic hydrogen tank (H2Tank) | Initial tank level: 0 | 600 ($/kg) | 600 ($/kg) | 10 ($/yr) | [109] |
| Model | PV (kW) | WT (#) | FC (kW) | BMG (kW) | Electrolyzer (kW) | TLC (kW) | H2 Tank (kg) | Converter (kW) | TNPC ($) | LCOE ($) | Salvage Value ($) |
|---|---|---|---|---|---|---|---|---|---|---|---|
| No. 1 | 33.8 | 14 | 20 * | - | 40 * | 100 * | 10 * | 48.7 | 647,708 | 0.33 | −177,219 |
| No. 2 | 28.4 | 9 | 20 * | - | 20 * | 100 * | 10 * | 28.8 | 548,906 | 0.248 | −139,048 |
| No. 3 | 43 | 8 | - | 20 * | 30 * | 100 * | 10 * | 37.1 | 488,878 | 0.313 | −131,344 |
| Model No. 1 | Model No. 2 | Model No. 3 | |
|---|---|---|---|
| Total electricity production (kWh/yr) | 241,422 | 180,162 | 181,722 |
| The share of PV (%) | 25.6 | 29 | 40.9 |
| The share of WT (%) | 65.9 | 56.7 | 50 |
| The share of FC (%) | 8.5 | 14.3 | - |
| The share of BMG (%) | - | - | 9.1 |
| Excess electricity (kWh/yr) | 30,773 | 27,869 | 15,719 |
| Unmet electric load (%) | 0.051 | 0.065 | 20.5 |
| Renewable fraction | 43.9 | 41.7 | 53.3 |
| Total thermal energy production (kWh/yr) | 85,234 | 80,134 | 71,153 |
| The share of boiler (%) | 63.9 | 65.2 | 77.9 |
| The share of excess electricity (%) | 36.1 | 34.8 | 22.1 |
| Excess thermal energy (kWh/yr) | 25,655 | 20,556 | 11,574 |
| H2 consumption by FC (kg/yr) | 618 | 771 | - |
| Capacity factor of FC (%) | 11.7 | 14.7 | - |
| Biomass consumption by BMG (tonnes/yr) | - | - | 730 |
| Capacity factor of BMG (%) | - | - | 9.5 |
| Total renewable production divided by load (%) | 109 | 105 | 114 |
| Capacity factor of PV (%) | 20.9 | 21 | 19.7 |
| Capacity factor of WT (%) | 21.6 | 21.6 | 21.6 |
| H2 consumption by boiler (kg/yr) | 1922 | - | 1956 |
| NG consumption by boiler (m3/yr) | - | 6905 | - |
| Total H2 generation by electrolyzer (kg/yr) | 2759 | 1575 | 2167 |
| Capacity factor of electrolyzer (%) | 36.5 | 41.7 | 38.3 |
| CO2 emission (kg/yr) | 0 | 11,535 | 1175 |
Publisher’s Note: MDPI stays neutral with regard to jurisdictional claims in published maps and institutional affiliations. |
© 2021 by the authors. Licensee MDPI, Basel, Switzerland. This article is an open access article distributed under the terms and conditions of the Creative Commons Attribution (CC BY) license (https://creativecommons.org/licenses/by/4.0/).
Share and Cite
Rezaei, M.; Dampage, U.; Das, B.K.; Nasif, O.; Borowski, P.F.; Mohamed, M.A. Investigating the Impact of Economic Uncertainty on Optimal Sizing of Grid-Independent Hybrid Renewable Energy Systems. Processes 2021, 9, 1468. https://doi.org/10.3390/pr9081468
Rezaei M, Dampage U, Das BK, Nasif O, Borowski PF, Mohamed MA. Investigating the Impact of Economic Uncertainty on Optimal Sizing of Grid-Independent Hybrid Renewable Energy Systems. Processes. 2021; 9(8):1468. https://doi.org/10.3390/pr9081468
Chicago/Turabian StyleRezaei, Mostafa, Udaya Dampage, Barun K. Das, Omaima Nasif, Piotr F. Borowski, and Mohamed A. Mohamed. 2021. "Investigating the Impact of Economic Uncertainty on Optimal Sizing of Grid-Independent Hybrid Renewable Energy Systems" Processes 9, no. 8: 1468. https://doi.org/10.3390/pr9081468
APA StyleRezaei, M., Dampage, U., Das, B. K., Nasif, O., Borowski, P. F., & Mohamed, M. A. (2021). Investigating the Impact of Economic Uncertainty on Optimal Sizing of Grid-Independent Hybrid Renewable Energy Systems. Processes, 9(8), 1468. https://doi.org/10.3390/pr9081468