Article

Synthesis and Physicochemical Characteristics of Chitosan-Based Polyurethane Flexible Foams

by
Agnieszka Piotrowska-Kirschling
1,*,
Adam Olszewski
2,
Jakub Karczewski
3,4,
Łukasz Piszczyk
2 and
Joanna Brzeska
1,*
1
Department of Industrial Product Quality and Chemistry, Faculty of Management and Quality Science, Gdynia Maritime University, Morska Street 81-87, 81-225 Gdynia, Poland
2
Department of Polymers Technology, Chemical Faculty, Gdańsk University of Technology, Narutowicza Street 11-12, 80-223 Gdańsk, Poland
3
Advanced Materials Center, Gdańsk University of Technology, Narutowicza Street 11-12, 80-223 Gdańsk, Poland
4
Faculty of Applied Physics and Mathematics, Institute of Nanotechnology and Materials Engineering, Gdańsk University of Technology, Narutowicza Street 11-12, 80-223 Gdańsk, Poland
*
Authors to whom correspondence should be addressed.
Processes 2021, 9(8), 1394; https://doi.org/10.3390/pr9081394
Submission received: 3 August 2021 / Revised: 8 August 2021 / Accepted: 10 August 2021 / Published: 12 August 2021
(This article belongs to the Special Issue Technological Processes for Chemical and Related Industries)

Abstract

:
The use of shrimp waste to obtain chitosan (Ch) is an essential issue, considering a circular economy, waste management, and its application to environmentally friendly materials. In this study, northern prawn shells were utilized to obtain Ch, which could then be used for synthesizing chitosan-based polyurethane (PUR+Ch) foams with different Ch concentration. The chemical structure, morphology, hardness, thermal properties, viscoelastic properties, and sorption properties in relation to oil and water of these materials were determined. The results present that the addition of Ch into PUR influences the physicochemical characteristics and properties of the tested materials. PUR+Ch foams with 1–3 wt% Ch had more open cells and were softer than neat PUR. PUR+Ch1 had the best thermal properties. PUR+Ch2 foam with 2 wt% Ch as a whole was characterized as having the highest water sorption. The PUR+Ch1 foam with 1 wt% Ch had the best oil sorption. This paper shows that the modification of PUR by Ch is a very promising solution, and PUR+Ch foams can be applied in the water treatment of oil spills, which can be dangerous to the water environment.

1. Introduction

Water is one of the nonsubstitutable resources of limited quantity and is necessary for the existence of life on Earth, the life of people, and the functioning of industry. Water waste and misuse are widespread because people do not know and understand multiple important values of water. In the last 100 years, global water consumption has increased 6 times [1]. It continues to grow steadily. The increase is approximately 1% per year. The UNESCO report confirms that increasing global water use combined with climate change can cause water scarcity [1]. Around the world, water is contaminated with various chemical pollutants [1,2].
Widespread application of petrochemicals often leads to their accidental release in water environments [3,4]. Crude oil has many benefits for humankind but at the same time is extremely dangerous to the environment because it destroys marine ecosystems. For many years, oil spills have been a danger to aquatic life—flora and fauna [5,6]. Absorption is a universal method among techniques for the removal of oil spills. Amorim et al. [3] distinguished other several methods [7,8,9,10,11,12,13] which have many disadvantages, e.g., a longer cleaning period or lower efficiency [3]. According to sustainable development, the search for new sorption materials for water treatment, which will also be green materials that degrade at the end of their life cycle in the environment, is necessary.
Synthetic materials were previously used to remove oil spills from water. This practice continued until it was discovered that dispersants such as Corexit could contaminate water. This resulted in a search for alternative materials, namely more efficient and sustainable sorbents for the treatment of water contaminated by oil pollutants [5,14]. Sorbents, modified by compounds of natural origin, are known in the literature for oil removal [15,16]. It has been found that the combination of natural organic and inorganic sorbents enhances the hydrophobicity of the materials used for oil sorption [16].
Dawodu’s group prepared a feldspar–banana peel biochar composite [15]. The synthesized material can be an efficient inorganic–organic composite sorbent with increased hydrophobicity for the sorption of crude oil. Sanguanwong et al. made foams based on cellulose nanofibers and fibrous clay sepiolite [16]. The absorbency and mechanical properties of the foams improved after the addition of sepiolite. The foams showed excellent oil sorption properties in view of their exceptionally low density/high porosity.
Furthermore, the use of materials that are mixtures of raw materials derived from natural sources and synthetic polymers, as well as only natural materials, is being tested for their applications in water treatment [14,17].
Materials with the most widespread natural polymer, cellulose, are known in the literature [2,17]. Dong’s group found that the combination of cellulose and carbon materials resulted in better specific surface area and porosity. Young’s modulus and tensile strength of these materials were also better. The cellulose–carbon materials were characterized by better sorption properties and a better degradation rate of pollutants.
Peng’s group investigated the sorption capacity of corn stalk pith after its modification by laccase–TEMPO. This material may be a simple and cost-effective material for the treatment of water contaminated by oil spills [14].
Polyurethane (PUR) foam is a synthetic polymer [18]. PUR can provide protection and insulation of materials against temperature, moisture, abrasion, or impact. In 2016, PUR foams constituted 67% of global PUR consumption [19]. PUR foams are commonly formed by the reaction of diisocyanate or polyisocyanate with polyol. These foams may occur in several forms, e.g., flexible or rigid foams and in a spray. The global PUR market was characterized by moderate growth during 2015–2020 [20]. According to the Global Polyurethane Foam Market Report, published on January 2020 by BCC Publishing, the global PUR foam market may increase by USD 9.8 billion between 2019 and 2024 [21].
PUR foams for oil sorption are known in the literature [3,22,23]. These foams have also been modified by natural components, for example, acerola and bagasse malt residues [3], Australian palm residues (PR) [22], or chitosan (Ch) from northern prawn shrimp waste [23].
The results confirmed that higher PR contents decreased the environmental impact of foams based on physicochemical analysis and life-cycle assessment (LCA) of PUR foams. They recognized these materials as perfectly able to sorb spilled crude oil in marine accidents [22].
The PUR foam with 20 wt% bagasse residues showed worse efficiency than PUR foam with 20 wt% acerola residues in a PUR matrix based on castor oil [3]. The authors found that the PUR foam with acerola was also a better sorbent for organic solvents and oil than other sorbents, which are known in the literature.
The PUR foam synthesized by the two-step method with the addition of 1.5 wt% Ch also had a good oil sorption property [22]. The observations of strengths–weaknesses–opportunities–threats (SWOT) analysis showed the advantages of the tested material as an innovative product with potentially significant pro-ecological values. These observations are important in the sustainable consumption of resources and sustainable production in the materials sector of industry. The literature reports that chitosan-based materials will have promising properties [23,24].
In this study, the shrimp waste of northern prawn shells was used to obtain Ch. This application is an example of waste production in a circular economy idea. Ch was then used for the modification of PUR based on typical substrates. The synthesis of PUR+Ch foams was conducted via the one-step method, and the samples had various Ch concentrations. The chemical structure, morphology, hardness, thermal properties, viscoelastic properties, and sorption properties in relation to water and oil of PUR and PUR+Ch foams were determined. The objective of the study is to define the influence of the addition of different concentrations of Ch to PUR+Ch foams on their properties.

2. Materials and Methods

2.1. Materials

The carapace shells from the cephalothorax and abdominal segments of northern prawns (Pandalus borealis) were separated from shrimp waste. Then, chitin was extracted from the selected shrimp shells and transformed into Ch, as described in the literature [23]. Figure 1 presents the scheme of chemical structure of chitin and Ch. After the chemical deacetylation of chitin into Ch, the acetylglucose groups are partially converted into aminoglucose groups, which changes the properties of these polysaccharides.
PUR+Ch foams were synthesized by the single-step method known in the literature [25]. The molar ratio of isocyanate NCO to hydroxyl OH groups was 1:1 (isocyanate index was equal to 1). Component A consisted of Rokopol V700 polyol (molecular weight 700 g/mol and hydroxyl value 225–250 mg KOH/g, PCC Group, Brzeg Dolny, Poland), the filler was Ch biopolymer (1–3 wt%, deacetylation degree of Ch DD was equal to 75%, value of molecular weight was 41,056 Da), the silicone surfactant was TEGOSTAB B 8465 (Evonik, Essen, Germany), and the blowing agent was n-pentane (S. WITKO CHS, Łódź, Poland). Component A was mixed with component B, which was polymeric methylene diphenyl diisocyanate (pMDI, BorsodChem, Kazincbarcika, Hungary). This reaction was catalyzed by three catalysts: 75 wt% 1,4-diazabicyclo[2.2.2]octane solution in diethylene, DABCO K-15 (Air Products, Allentown, PA, USA); dibutyltin dilaurate (DBTDL, Sigma-Aldrich, Poznań, Poland); and 33 wt% solution of 1,4-diazabicyclo[2.2.2]octane in dipropylene, DABCO 33-LV (Sigma-Aldrich, Saint Louis, MO, USA).
For comparison, a polyurethane foam without Ch (PUR) was also synthesized. Composition of PUR and PUR+Ch foams is shown in Table 1.

2.2. Methods

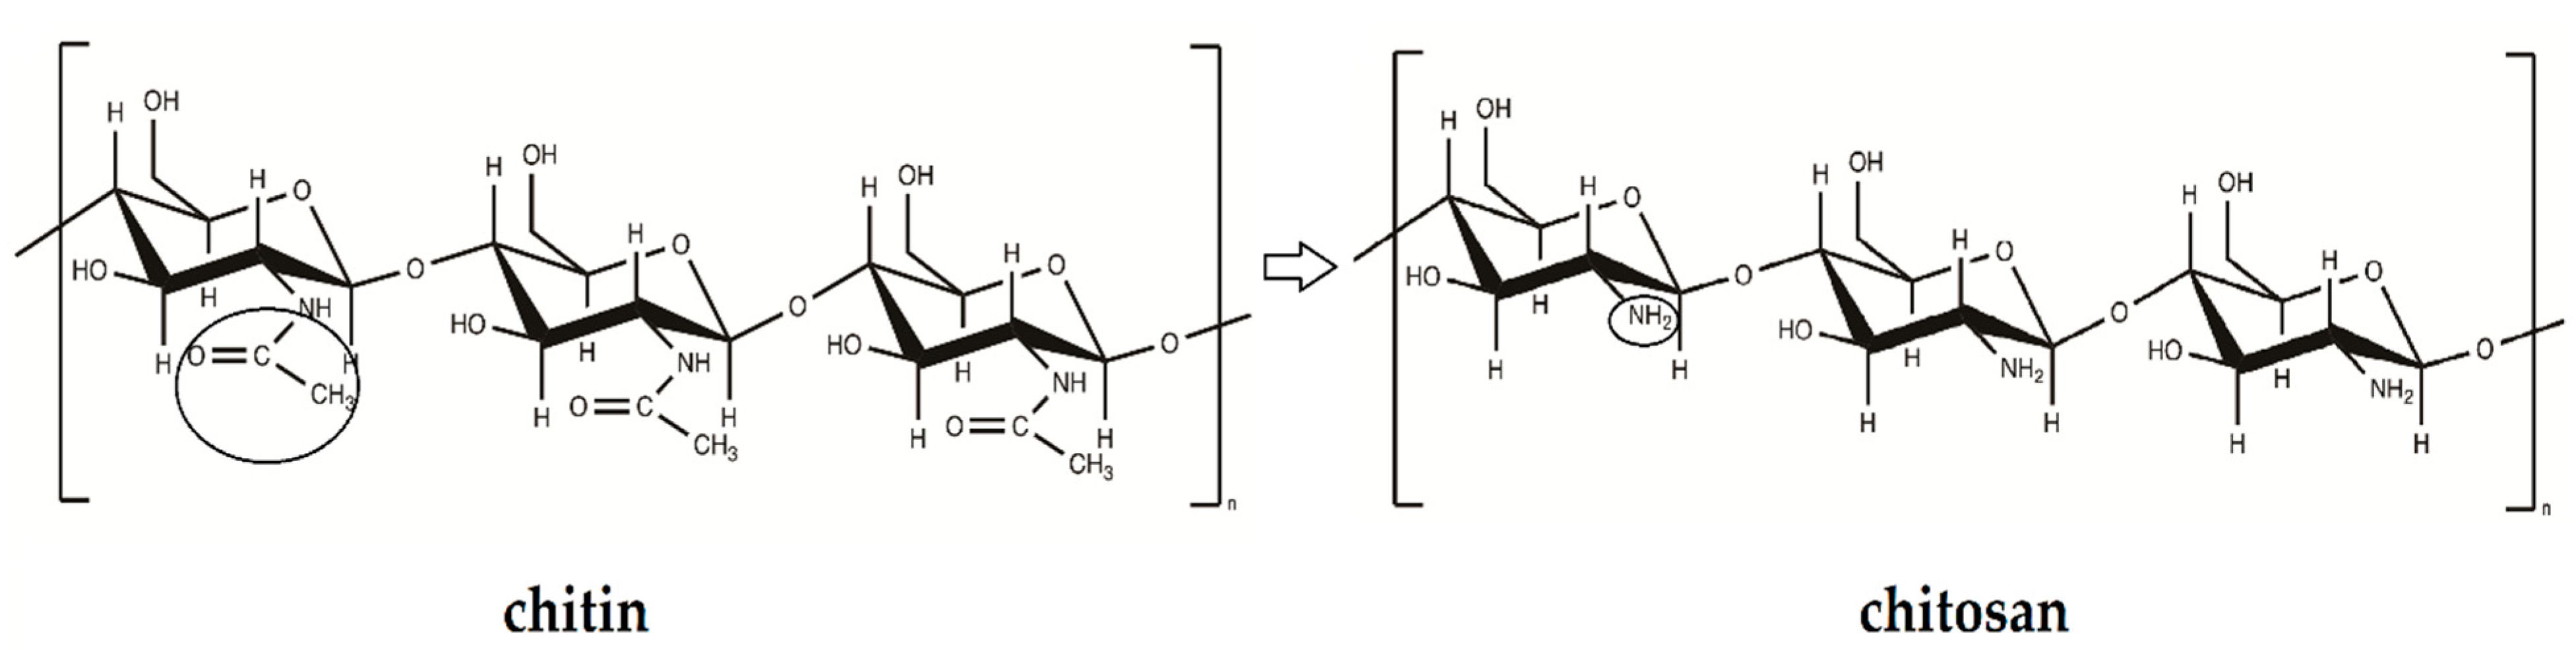
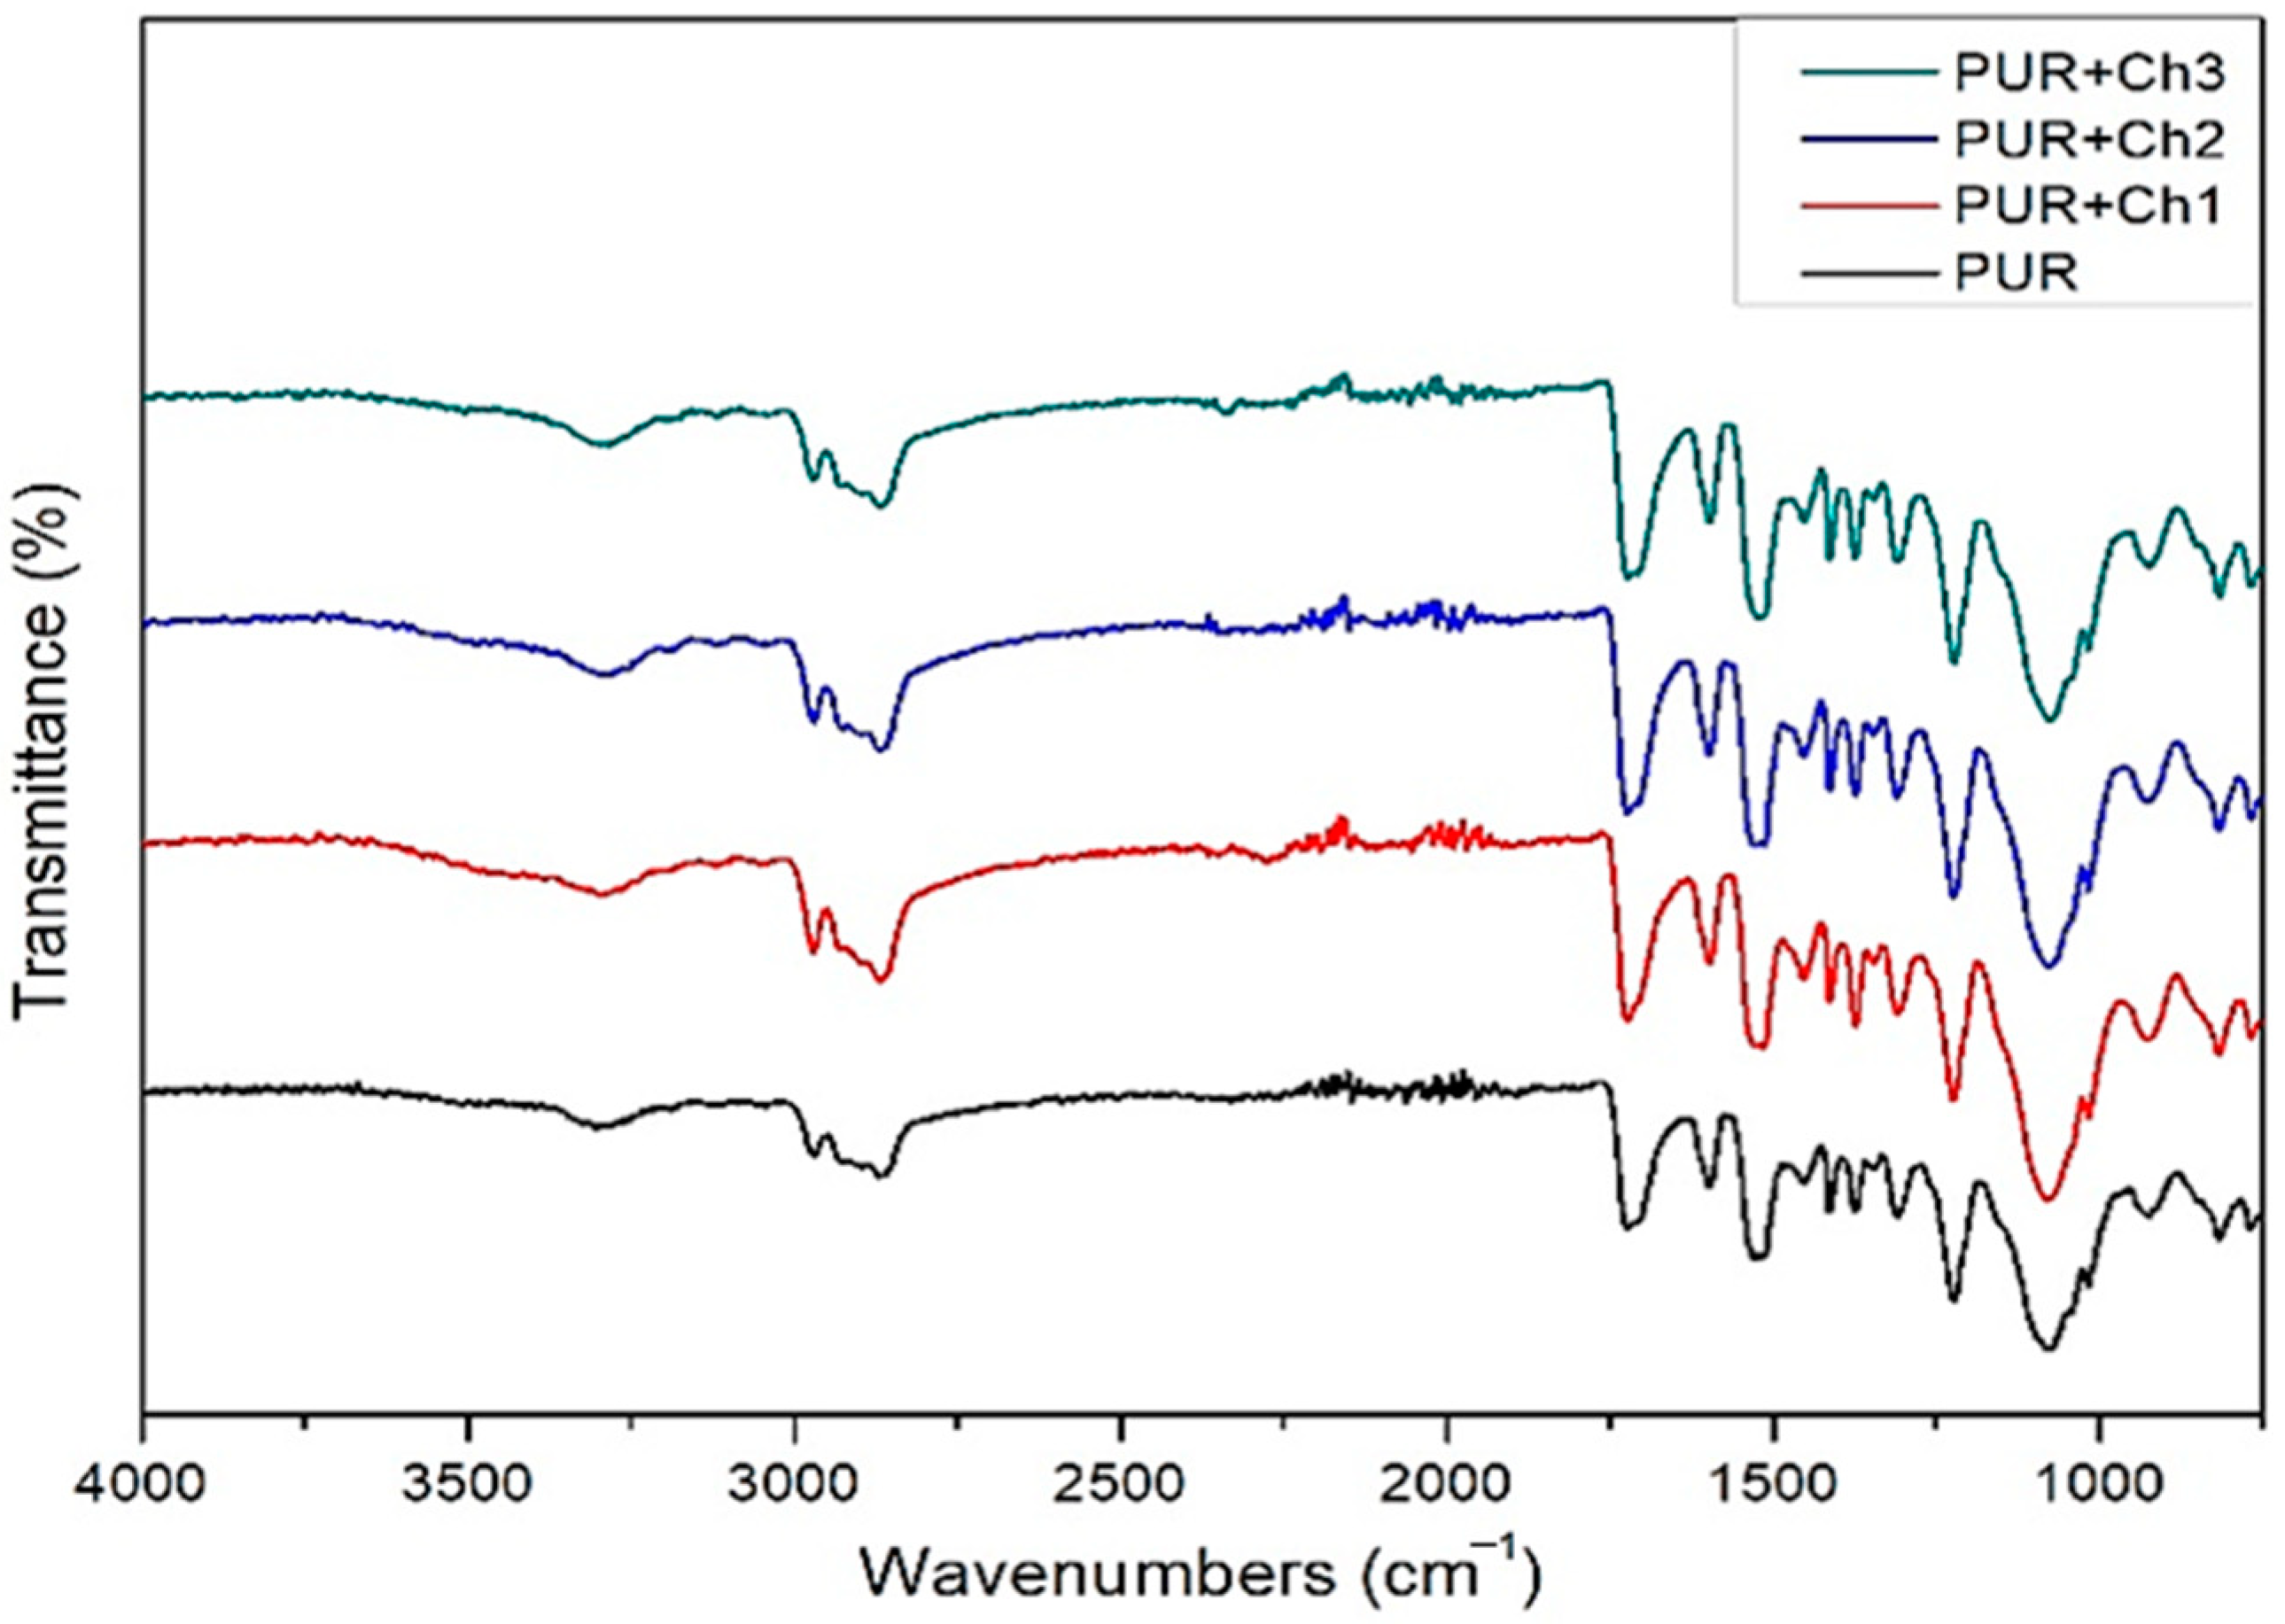
2.2.1. Chemical Structure

The chemical structures of the tested foams were investigated by attenuated total Reflectance Fourier transform infrared spectroscopy (ATR-FTIR). ATR-FTIR is known to determine the characteristic groups of Ch and PUR [23,26]. FTIR spectra were recorded on a Nicolet 380 FTIR spectrometer (Thermo Scientific, Madison, WI, USA) that was equipped with a diamond cell. The spectrometer also had an attachment attenuated total reflection (ATR Smart Orbit Accessory, Thermo Scientific). Measurement parameters were consistent with the method described in the literature [23].

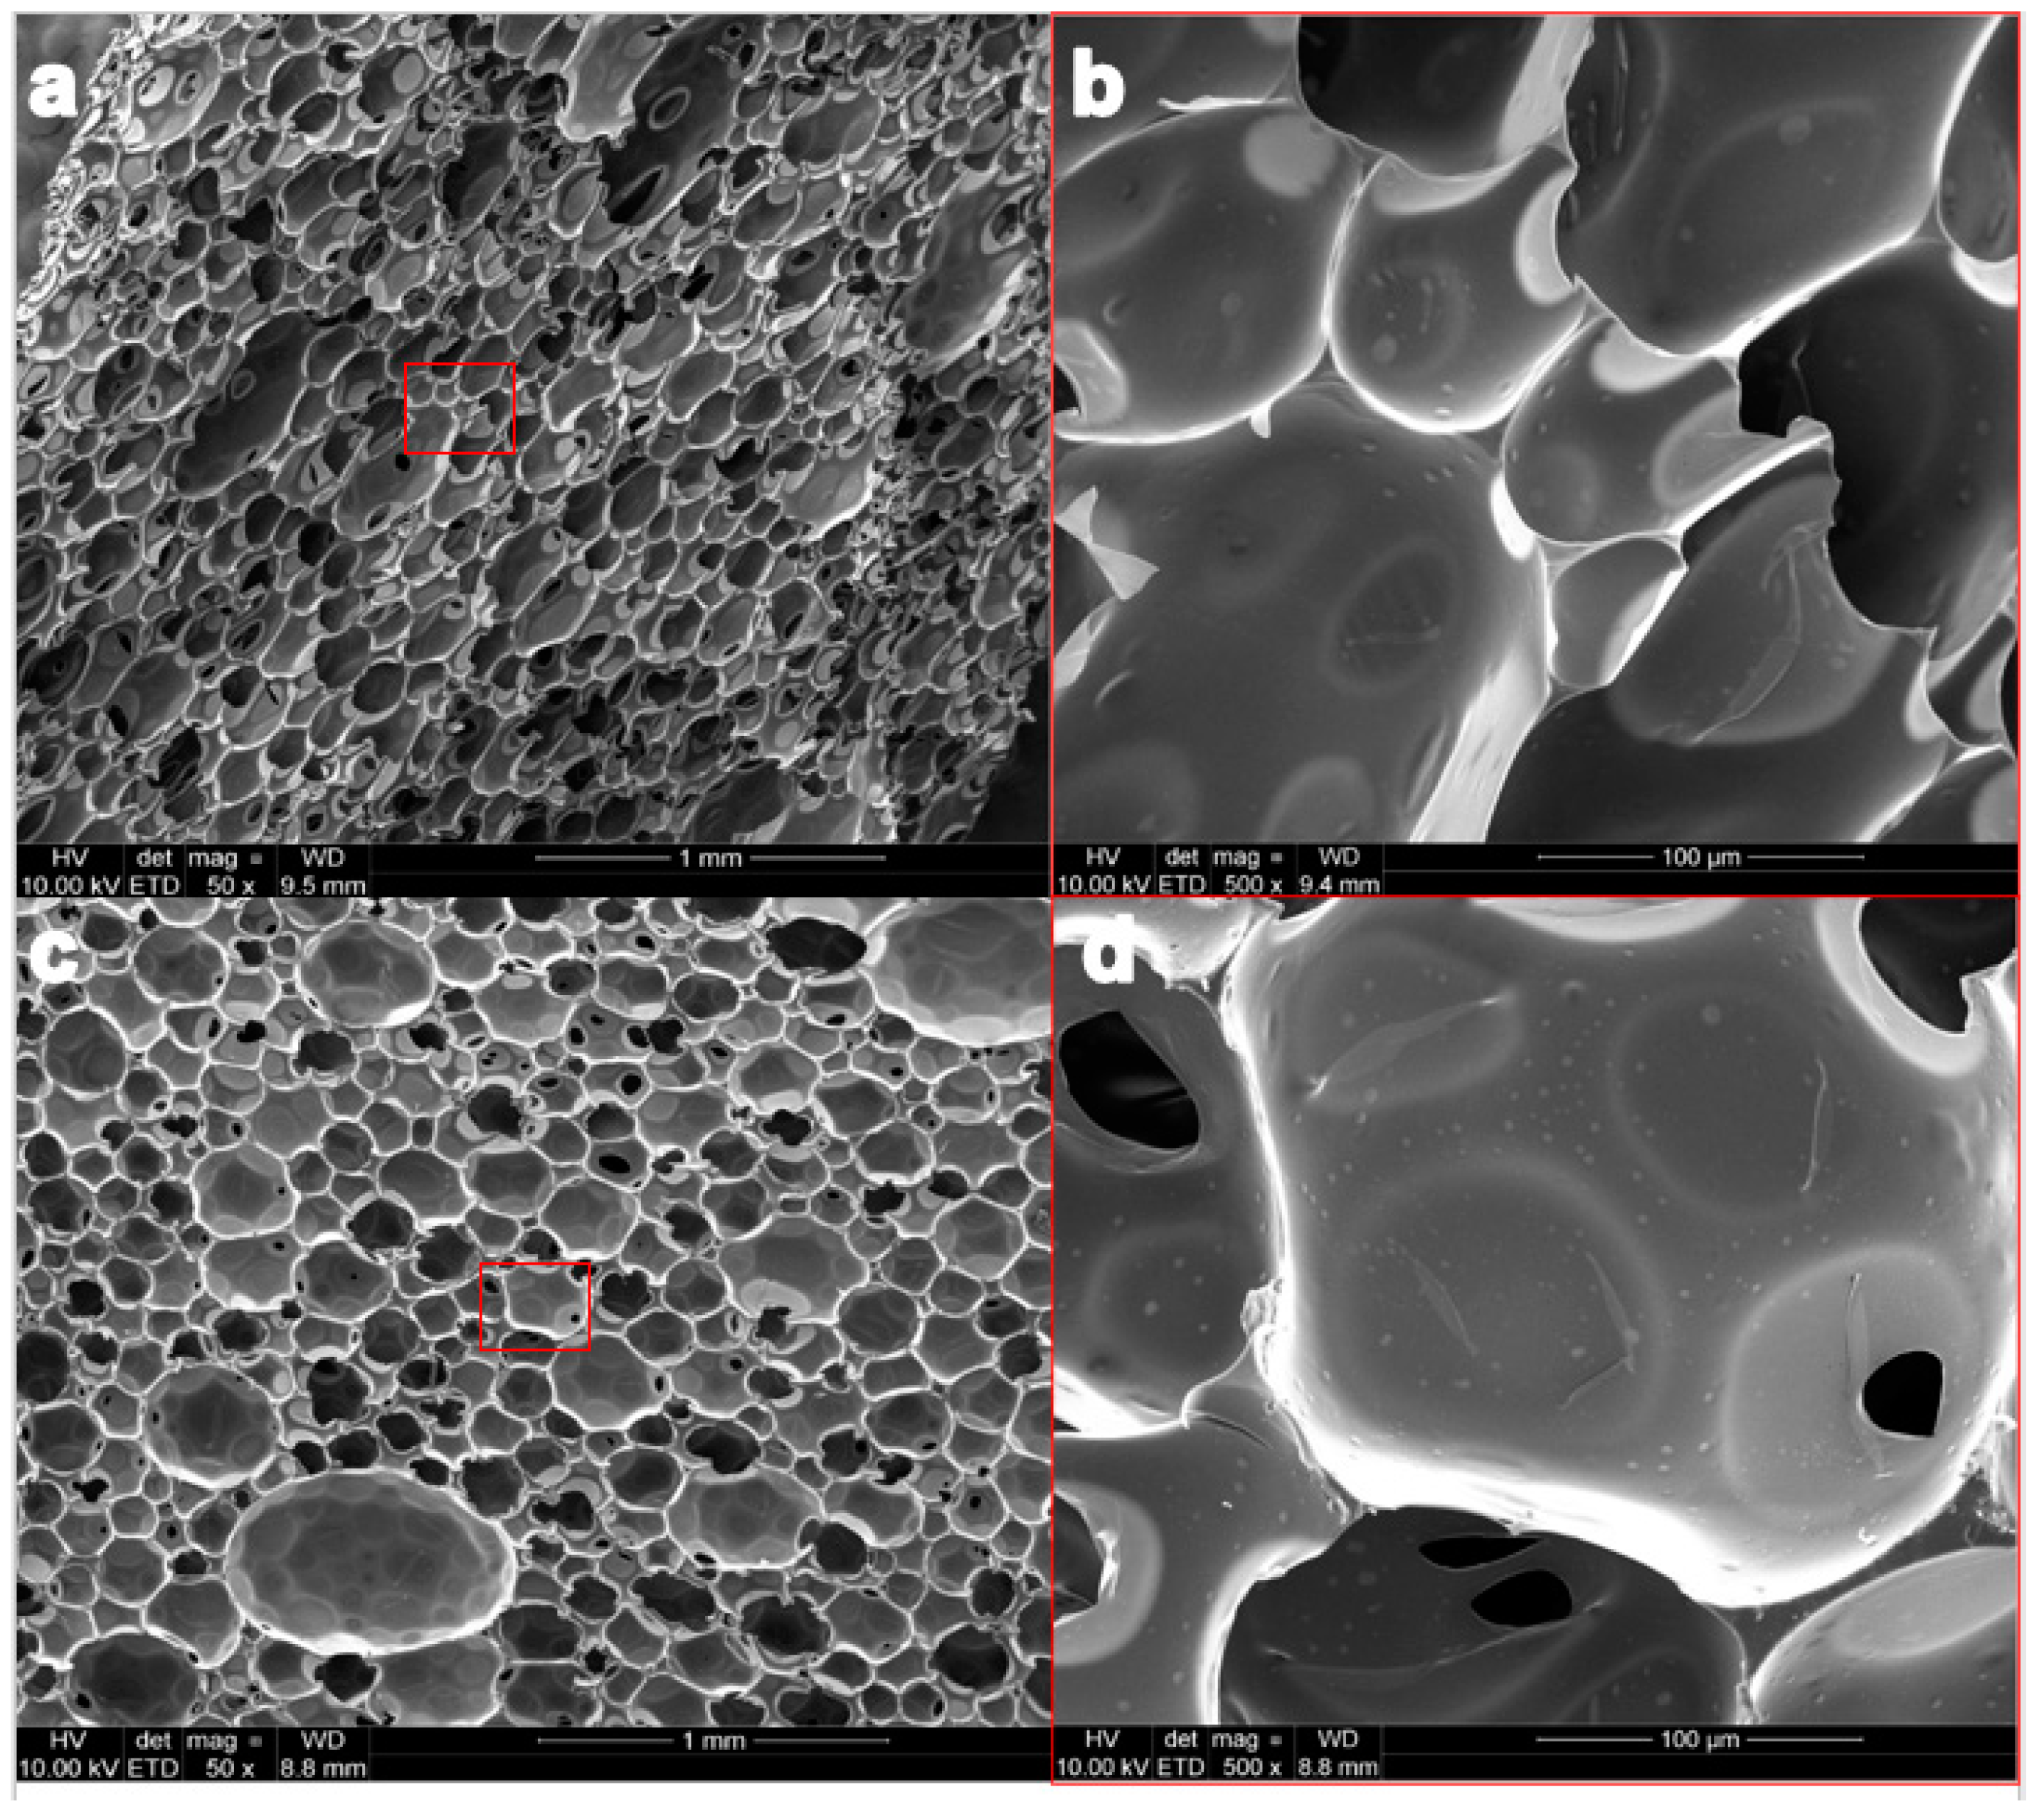
2.2.2. Structure Morphology and Characterization of Pore Structure

A scanning electron microscope (SEM) is commonly used to investigate the structure and morphology of materials [27]. Sample surfaces were analyzed by a Quanta FEG 250 (FEI) SEM. The SEM was equipped with an ET secondary electron detector. The images were taken at the sample cross-section in multiple places to confirm sample uniformity. The acceleration voltage was kept at 10 kV during the measurements and was constant.
The content of open cells in PUR and PUR+Ch foams was determined using an Ultrapyc 5000 Foam gas pycnometer from Anton Paar (Graz, Austria) [28]. The following measurement settings were applied: gas—helium; preparation mode—flow; time of gas flow—0.5 min; target pressure—3.0 psi; foam mode—on; measurement type—uncorrected; flow direction—sample first; temperature control—on; target temperature—20.0 °C.; flow mode—monolith; and cell size—small. Five runs were performed for each sample.

2.2.3. Hardness

The hardness of PUR and PUR+Ch foams was investigated using a digital hardness tester HD0 100-1 with Shore Hardness Scale 0, which is for foams and sponges (Sauter GmbH, Balingen, Germany). Hardness measurements were repeated five times for each foam.

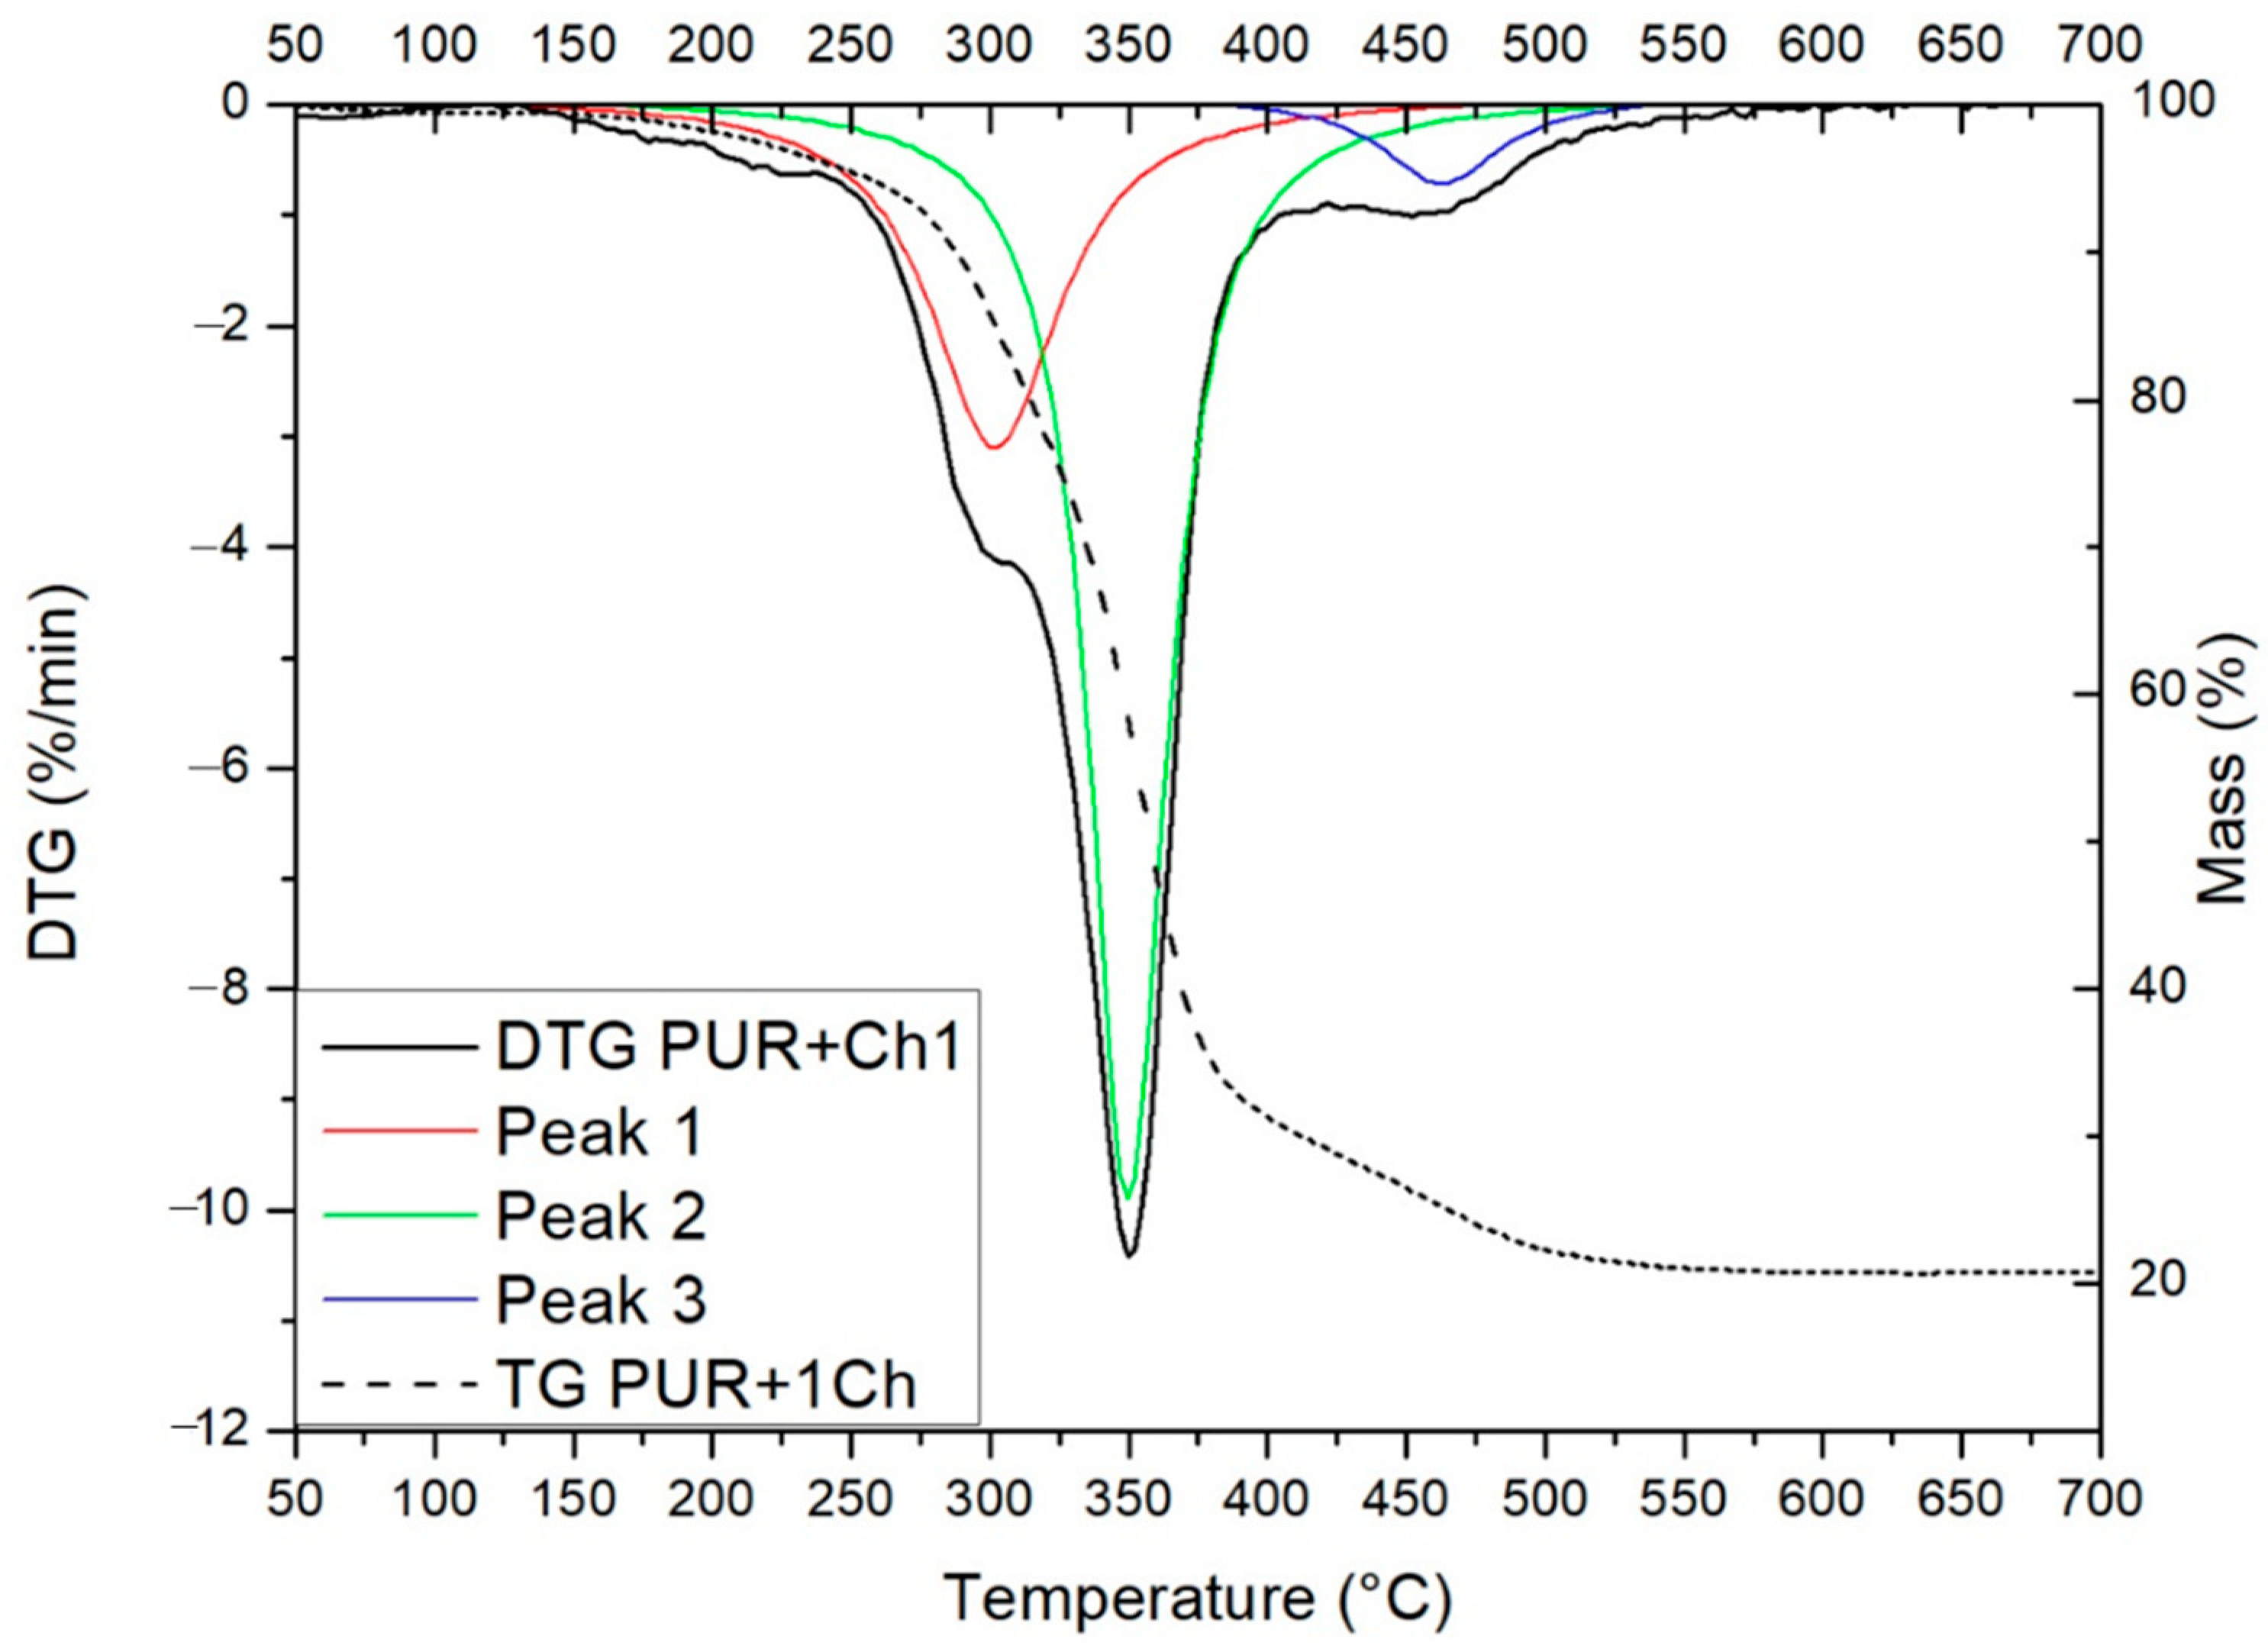
2.2.4. Thermal Properties

Thermal properties of PUR and PUR+Ch materials were determined using differential scanning calorimetry (DSC) and thermogravimetric analysis (TGA).
DSC analysis was conducted with a Setaram thermal analyzer (Setaram, Caluire, France). Indium and lead were used for calibration. Specimens (with mass of about 8 mg) were sealed in aluminum pans and scanned from 20 to 200 °C, with the heating rate of 10 °C/min. All experiments were carried out in a dry flow of N2.
TGA was used to evaluate the thermal stability of PUR foams with and without the addition of Ch. Approximately 10 mg samples were analyzed using the NETZSCH TG 209 F3 apparatus (NETZSCH, Selb, Germany). The measurements were carried out in the temperature range from 30 to 800 °C at a heating rate of 10 °C/min under a nitrogen atmosphere.

2.2.5. Viscoelastic Properties

Heat deflection temperature (HDT) was performed using a Q800 DMA instrument from TA Instruments (New Castle, USA) at a heating rate of 5 °C/min and the temperature range of −60 to 200 °C in the DMA controlled force mode. Cylindrical-shaped samples had dimensions of 10 × 12 mm2. The investigation was performed in the compression mode with a static force of 0.1 N.

2.2.6. Sorption Properties

The sorption properties of PUR and PUR+Ch foams for oil and water were determined in accordance with ASTMF 726-99: Standard Test Method for Sorbent Performance of Adsorbents [29]. This research was performed as described in the literature [23]. For each foam, 3 cube samples of foam with a base area of about 1 cm2 were cut. Next, the samples were dried to a constant weight. The samples were immersed in the appropriate medium. In case of water sorption, the sample weight measurements were performed after 20 min, 24 h, 4 days, 7 days, and 14 days incubation in a distilled water. For mineral diesel engine oil sorption, the changes in sample weight were investigated after 20 min and 1 day of incubation. The measurements were taken at room temperature. To check the efficiency of the regeneration of the samples, foams were again subjected to oil sorption after drying (to dry weight). The washing and sorption cycles were repeated twice (second and third cycles).
Sorption was calculated (using the gravimetric method) from the weight after incubation (wi) and the initial weight (w0) by the equation described in the literature [23].

3. Results and Discussion

Macroscopic evaluation of the foams showed that the foams with Ch content of 0–3 wt% were well-formed, flexible, and springy; they were light yellow in color.

3.1. Chemical Structure

The chemical structure of Ch, PUR and PUR+Ch foams were evaluated on the basis of the ATR-FTIR analysis. The spectrum of Ch was consistent with the literature [23,30,31]. It was possible to observe a broad band in the range of 3600–3100 cm−1 wavenumbers, which is characteristic of the stretching vibrations of the N–H and O–H bonds. Moreover, the bands visible at the wavenumbers 1652.6, 1582.2, and 1315.8 cm−1, were assigned to the amide I, amide II, and amide III bands, respectively. This confirmed that Ch was the only product of partial deacetylation of chitin [32].
Since the bands characteristic for Ch were overlapping bands of urethane groups, it cannot be determined whether the chitosan was present on the foam surface or was stuck to the polyurethane chains. The FTIR spectra of all tested polyurethanes are almost identical (Figure 2). No bands were found to develop or disappear after the addition of Ch, nor were large differences found in the intensity of the bands and their wavelengths.
The absence of the band corresponding to the -NCO groups (2237 cm−1) in the polyurethane’s spectrum indicated the complete reaction (Figure 2). The presence of bands confirming the formation of the urethane group (-NHCOO-) was found in the ATR-FTIR spectra of all tested materials. The additional oxygen in the structure of the urethane group compared to amides causes different wavenumber values of the amide bands compared to those of the chitosan-containing acetamide groups [33]. For PUR foams, the bands of amide II (δ NH, ν CN) and amide III (ν CN, δ CO, δ NH) were 1526 cm−1 and 1223 cm−1, respectively, whereas the stretching vibration of the C=O group (amide I) was at 1722.3 cm−1, and the N-H group was at 3303.3 cm−1. The spectra show that the characteristics of the chemical structure of PUR foams were preserved after the addition of Ch particles. Only a discrete shift of -N-H bands of PUR+Ch foams towards lower wavenumber values in comparison to neat PUR (up to 3289.4 cm−1) may indicate engaging of the -OH groups of Ch in the formation of hydrogen bonds with the urethane group of the hard segments of PUR+Ch foams. The bands corresponding to the urethane carbonyl groups practically did not shift after the addition of chitosan. It is known that amide band II shifts towards higher frequencies when a hydrogen bond is formed between the urethane and ether oxygen (from the soft segments) [34]. Thus, the reduction in the wavenumber of this band after the introduction of Ch into the PUR structure (from 1526 to 1514 cm−1 for PUR+Ch1 and PUR+Ch2 or to 1511 cm−1 for PUR+Ch3) indicated that the Ch particles influenced the interaction of PUR chains.

3.2. Structure Morphology and Characterization of Pore Structure

SEM images in Figure 3 show the structure of PUR and the exemplary PUR+Ch foam. Pore size in the neat PUR foam varied widely, and their diameters ranged from 0.09 to 0.76 mm. The introduction of Ch resulted in a decrease in the uniformity of the pore diameter (ranged from 0.01 to 0.92 mm). On the contrary, the shape of the pores was slightly more regular. The shape of PUR+Ch2 foam was the most homogenous. The PUR+Ch3 foam was characterized by a greater pore size dispersion. The presence of a larger amount of Ch particles resulted in a less uniform pore formation in the foaming process and a more compact structure of the foam structure.
The observation of the images shows that there were small holes in the pore walls of the PUR+Ch. Thus, the surface of interaction of the foam was increased, which might improve its sorption capacity.
The tested foams had high open cell content, which is known in the literature [35,36,37]. Table 2 presents values of the open cell content in the tested materials. Incorporation of Ch into the PUR matrix influenced the content of open cells in the synthesized foams. Incorporation of Ch (1–3 wt%) into the PUR resulted in a noticeable increase in open cell content (from 84.3% to 93.4–95.8%), which was associated with differences in density between the matrix of PUR and Ch as filler. Furthermore, Husainie et al. stated that the adding of Ch filler resulted in an increase in the number of open pores [38]. The slight decrease in the open cell content after increasing the amount of filler was probably due to some agglomeration of the particles.

3.3. Hardness

In Table 3, the hardness values of the tested materials are presented. Incorporation of Ch (1–3 wt%) into the PUR foams resulted in a noticeable decrease in hardness (from 9.3 Shore H0 to 6.0–8.8 Shore H0). The softest foam is PUR+Ch1. Chitosan-based polyurethane foams were more flexible and plastic than unmodified PUR foam. Additionally, these foams deformed to a greater extent. This is in line with the results of the open pore content of the foam. The higher their number, the softer the foam was. It can be seen that adding 3 wt% Ch resulted in a marked increase in hardness that was almost as high as that of pure PUR. Thus, the volume of added Ch particles was in this case so large that open pores were formed to a lesser extent, and the particles began to act as a typical filler, increasing the hardness of the foam. The same was observed by Husainie et al. by testing PUR foam with natural fillers, including Ch [38].
In comparison with PUR+Ch1, PUR foam synthesized by the two-step method with the addition of 1.5 wt% Ch was harder (18 Shore H0) [23]. All the tested foams had a lower hardness than this foam.

3.4. Thermal and Viscoelastic Properties

The glass transition temperature (Tg) of Ch was 143.6 °C. Sakurai’s group observed that the Tg of Ch was 203 °C [39]. This difference may be due to the source of chitin and the methods of obtaining Ch. They claimed that knowledge of the Tg is important in determining the miscibility of Ch with other polymers. This is a prerequisite for the use of Ch in polymer materials with improved properties.
Two endothermic peaks connected to the PUR’s structure transformation were observed on DSC thermograms of all tested foams (Table 4). The first peak (Tm1) was related to the melting of the crystalline phase of the soft segments of PUR. For PUR+Ch foams, Tm1 increased after Ch was introduced into the PUR matrix. At the same time, however, the melting enthalpy decreased. Therefore, the resulting crystallites were probably larger and better formed (hence the shift of Tm1 towards higher values), but there were fewer of them (ΔH1 decreased). The second peak at 160.6–221.3 °C (Tm2) was related to the hard phase transformation that related to the change of order–disorder in the hard phase of polyurethane [40]. During heating, the hydrogen bonds dissociated in the hard phase. The enthalpy of this transformation (ΔH2) of the PUR+Ch2 and PUR+Ch3 foams containing Ch was much higher than that in the case of pure PUR. On this basis, it can be assumed that the observed differences in the enthalpy value of this transformation result from a different number of bonds formed in these materials, which is consistent with the observation of ATR-FTIR spectra. Moreover, the HDT results, presented in Table 4, show that HDT decreased after 1 wt% addition of Ch into PUR matrix. However, the greater addition of Ch increased this parameter. This might indicate the reinforcing effect of Ch. This was consistent with the observation of the results of the number of open pores and the hardness of the foams obtained.
The effect of the Ch addition on the thermal properties of flexible polyurethane foam was determined using TGA. The weight loss (TG) and weight loss rate (DTG) curves of the synthesized PUR+Ch1 are presented in Figure 4. Char residues, temperature of the fastest degradation (Tmax), and different percentages of mass loss in temperature are presented in Table 5.
By the analysis of the DTA curve, the three-step degradation process of the sample can be noticed. No significant correlation was observed between the degradation of samples with and without addition of chitosan. The char residue after the test fluctuated around 20% for all samples. The DTG curve of PUR+Ch1 was deconvoluted using a Gaussian profile to show the three-step decomposition process more clearly. The calculated curves agreed very well with the original DTG. The area of the resulting peaks after deconvolution can be correlated with the intensity of each stage of thermal degradation. The area under the peaks and the ratio of the individual stages of decomposition are shown in Table 5 [41]. The first significant stage of the degradation process occurred around 300 °C and could be assigned to the decomposition of hard segments. This step includes the dissociation of allophanate, biuret, and urethane bonds, which leads to the formation of amines (primary and secondary), isocyanates, polyols, and carbon dioxide [42]. The second degradation step with a maximum degradation rate at 350 °C could be associated with the thermal degradation of the soft segments composed of petrochemical polyol [43]. The final degradation peak occurred around 455 °C and could be associated with thermolysis of degradation products that were generated during the previous degradation stages [44].

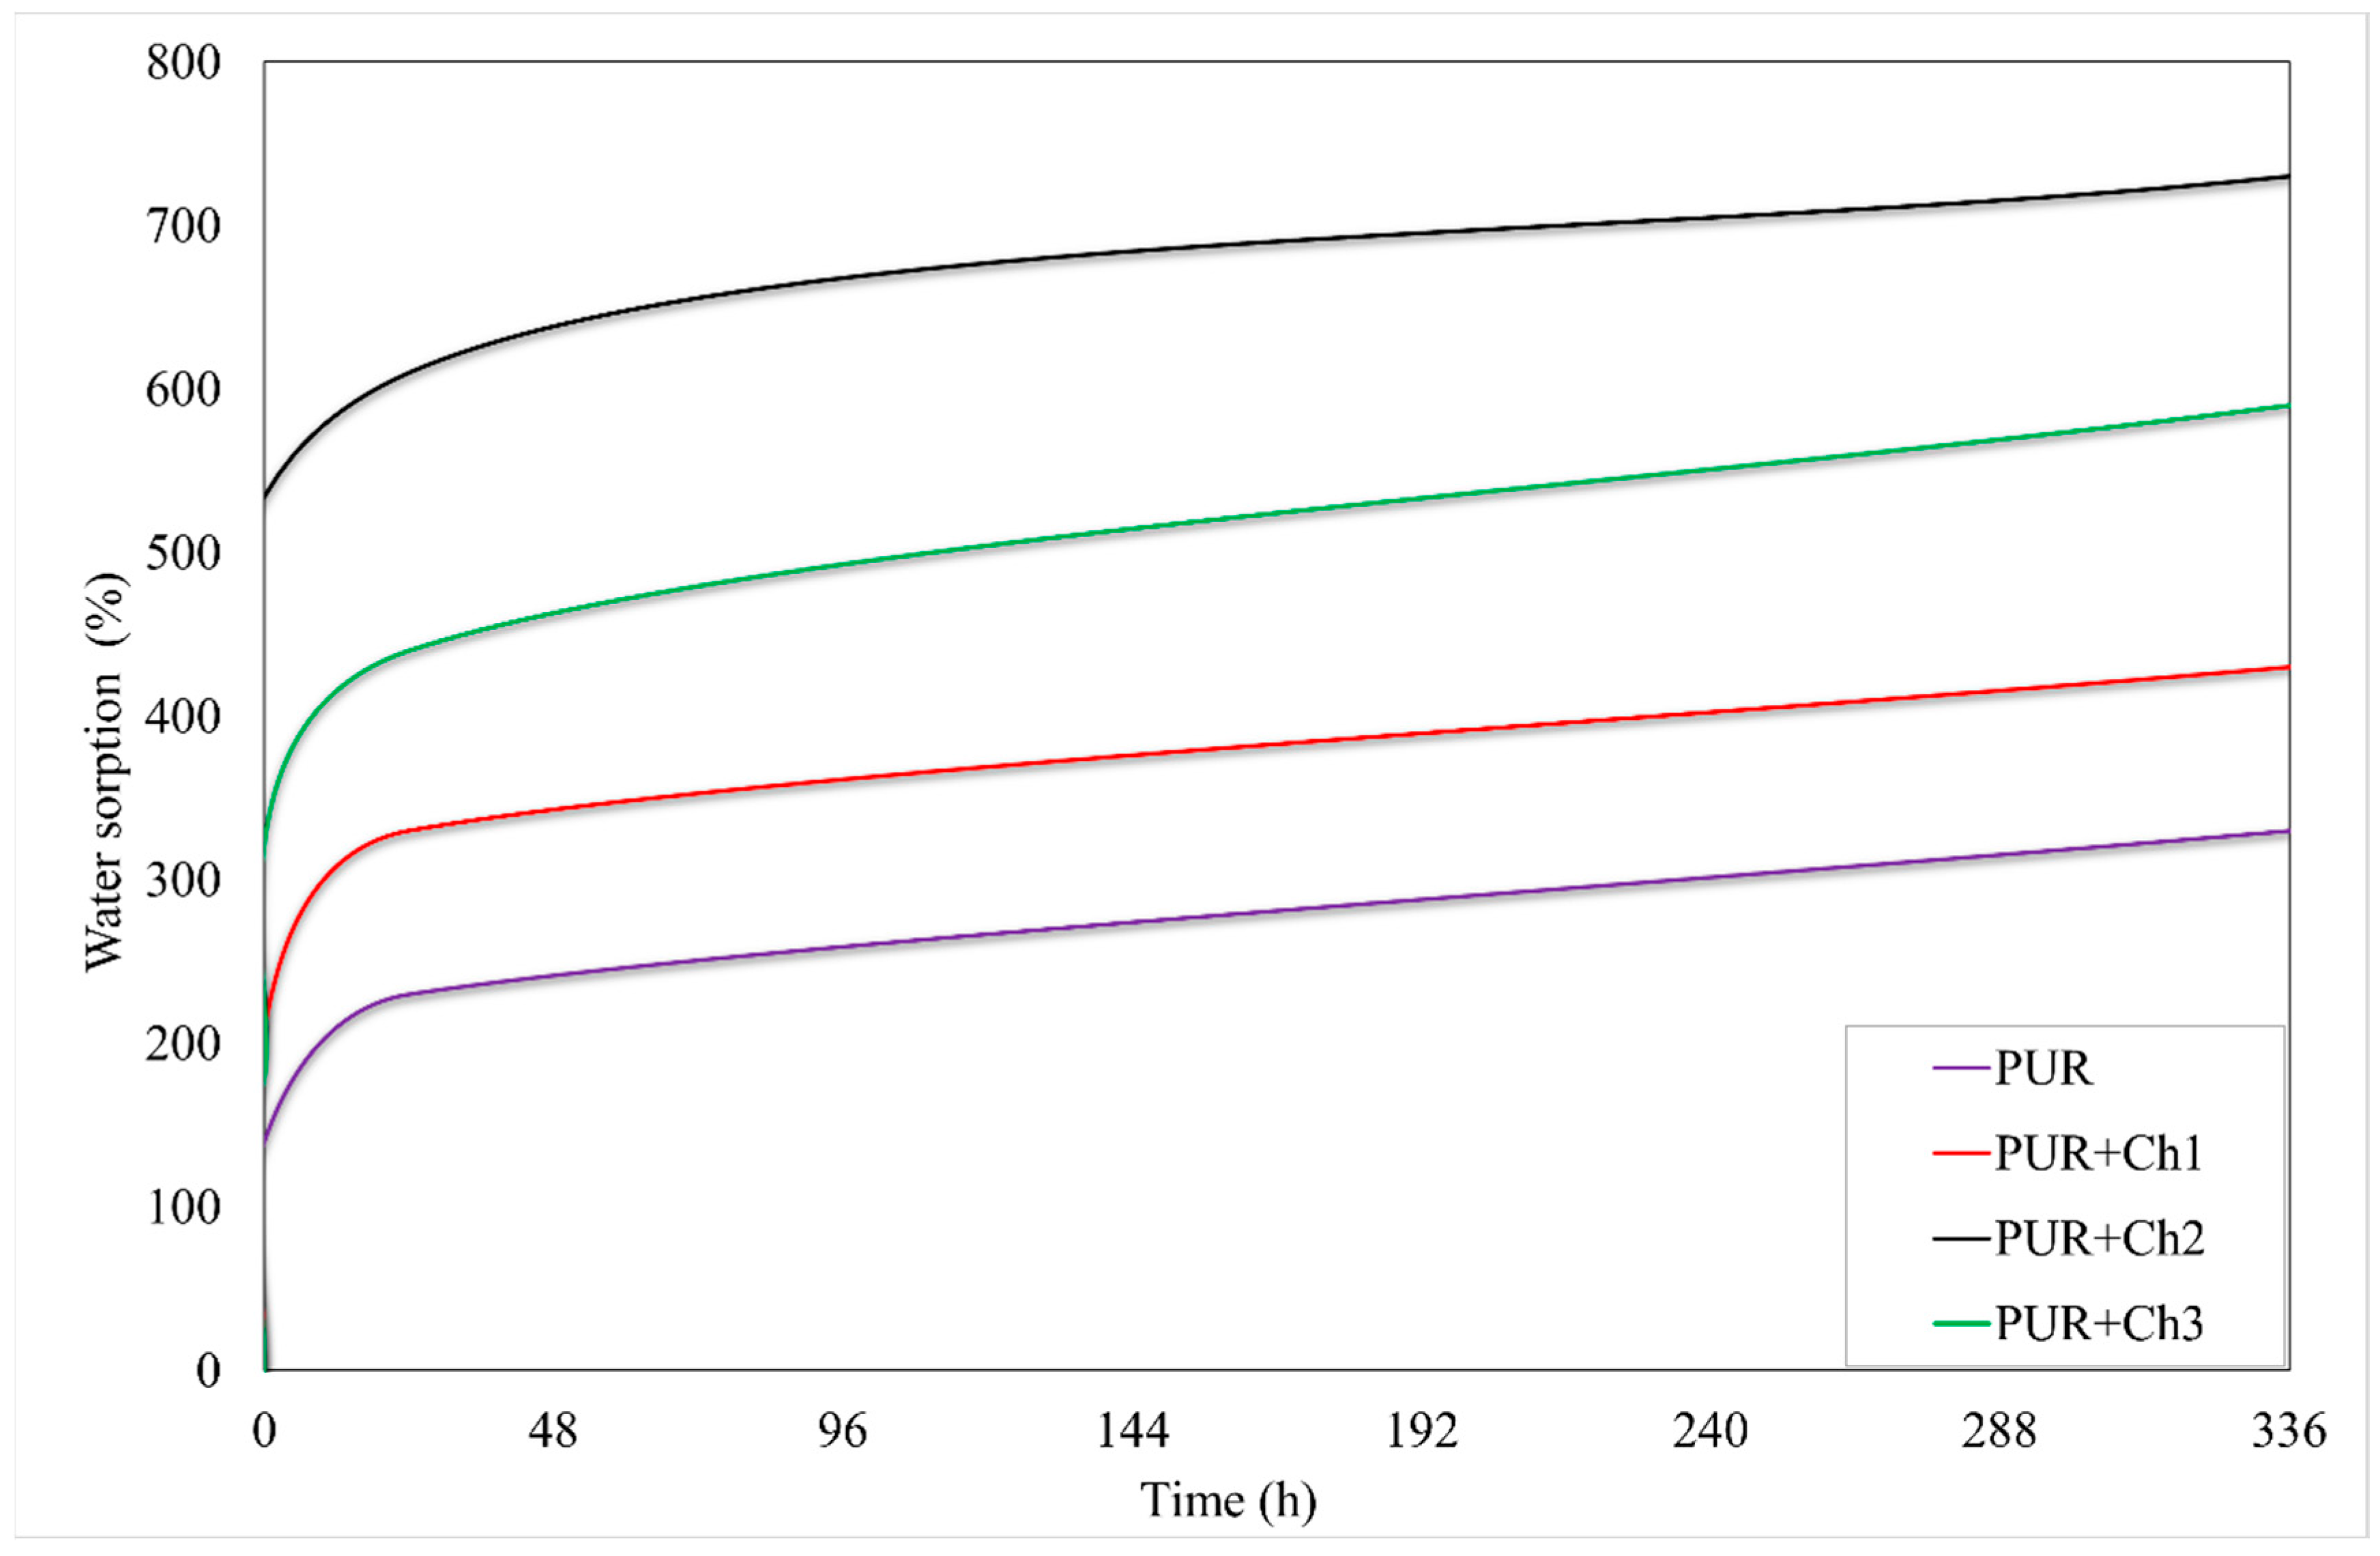
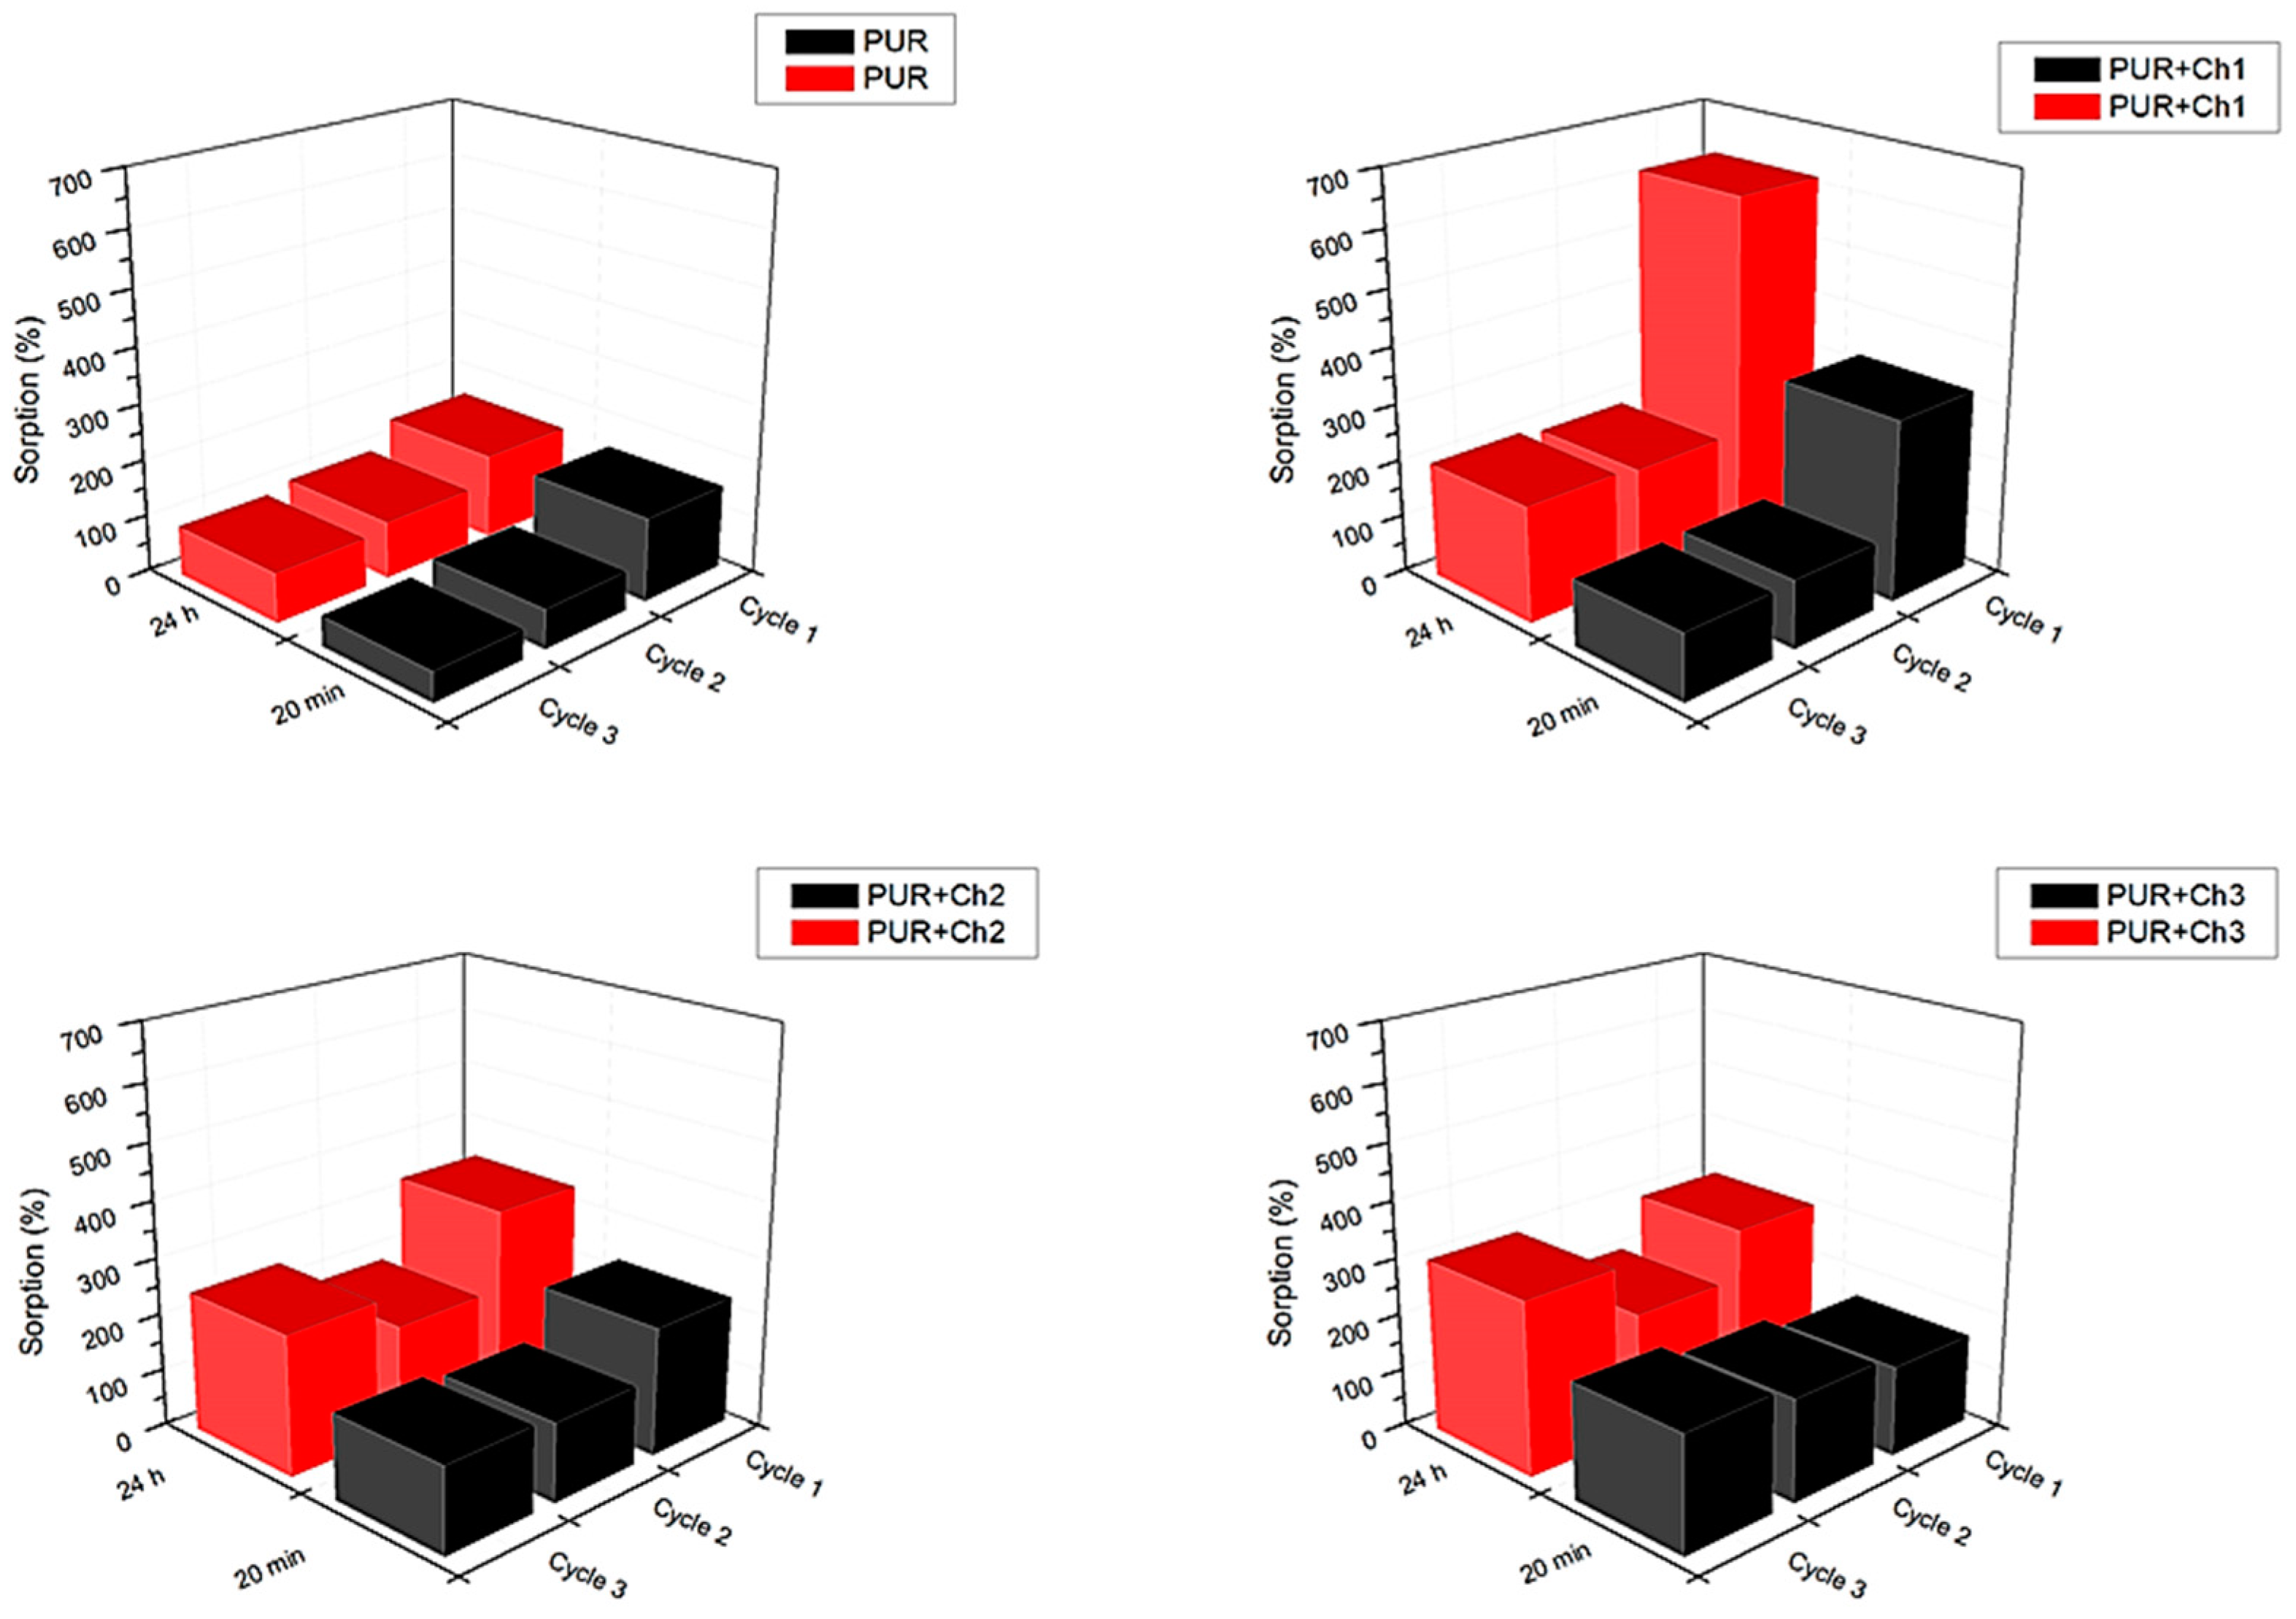
3.5. Sorption Properties

The results of water sorption properties of PUR and PUR+Ch foams are presented in Figure 5. The PUR+Ch foams with 1–3 wt% Ch absorbed much more water than unmodified PUR. This may suggest that the addition of Ch as a filler caused an increase in the hydrophilic nature of the foams. However, although the time of incubation of samples in water was long (up to 14 days), equilibrium sorption was not obtained. Most of the open pores allow water to be absorbed gradually. Moreover, the ability of the polyurethane chains to move and arrange themselves under the influence of the surrounding environment caused hydrophilic fragments to migrate to the surface of the sample, thus increasing the affinity of the foams for water.
The difference in the water sorption of the foams was already visible in the initial stage of the study. Maximum sorption after 20 min of incubation in water decreased in the order of PUR+Ch1 (210%) > PUR+Ch2 (190%) > PUR+Ch3 (180%) > PUR (140%). However, looking at the entire time the samples were incubated in the water, PUR+Ch2 with 2 wt% Ch generally had the best water sorption property. The addition of 3% by weight Ch to the PUR matrix made the foam more compact and denser, as evidenced by the hardness and HDT results. Such a structure makes it difficult for water to penetrate deep into the foam; hence, the PUR+Ch3 foam had lower sorption than PUR+Ch2.
PUR foams synthesized using different substrates but with similar amount of Ch (1.5 wt%) also had the best water sorption property (212%) among other foams differing in Ch content [23]. However, in this study, PUR+Ch2 with 2 wt% Ch had even better this property related to the chemical structure of different PURs.
The results of the oil sorption properties of PUR and PUR+Ch foams are presented in Figure 6. PUR+Ch foams with 1–3 wt% Ch absorbed more oil than unmodified PUR in each cycle.
In the first cycle of oil sorption, the maximum foam sorption capacity after 20 min of incubation decreased in the order of PUR+Ch1 (319%) > PUR+Ch2 (225%) > PUR+Ch3 (156%) > PUR (147%). In this case, PUR+Ch1 also had the best oil sorption properties in the first cycle. Estimation of oil sorption on the reused foams confirmed that the amount of sorption oil gradually increased during the subsequent sorption cycles (after 1 day), which could indicate the migration of hydrophobic hard segments on the PUR surface under the influence of the oily medium. In the literature, higher oil sorption capacity was associated with lower sample density [45]. The greater expansion of the polymer may result in the formation of smaller pores that may break when the oil is sorbed, resulting in higher sorption of the oil. The lowest hardness and lowest density of the PUR+Ch1 foam resulted in its highest oil sorption. The subsequent use of foams, after washing them with hexane, reduced their sorption capacity toward oil. However, the amount of oil absorbed in the second and third cycles by the chitosan foams was still higher than that for neat PUR. For all PUR+Ch foams, the sorption was higher after the second wash than after the first wash, which indicated that changes in the chemical structure of the PUR occurred because of prolonged exposure to the oil. Presumably, the hydrophobic chains of the rigid segments migrated to the surface, increasing the affinity of the foams for the oil medium.
Comparing the results of the water and oil sorption of individual samples after 20 min of incubation, it can be concluded that, in general, these samples have a much higher affinity for oil than for water. Although the foam density and the number of pores formed are of great importance, as can be seen from the high oil sorption of PUR with 0–3 wt% Ch foams, the hydrophobic nature of polyurethane determines the high oil sorption.
Thus, depending on the nature of the contaminant in the water, i.e., whether it is hydrophobic or water-soluble, the foams will be able to adjust their character accordingly.

4. Conclusions

The goal of the presented research paper was to determine the influence of the addition of different concentrations of Ch to PUR foams on the chemical structure, morphology, hardness, thermal properties, and sorption properties of PUR foams. The results prove that the addition of chitosan to the polyurethane matrix may improve its properties. The chitosan-based polyurethane foams modified with 1–2 wt% Ch (PUR+Ch1 and PUR+Ch2) had the best properties. These materials may be recommended as adsorbents for the environmental treatment of oil spills.

Author Contributions

Conceptualization, A.P.-K., A.O., Ł.P. and J.B.; methodology, A.P.-K., A.O., J.K., Ł.P. and J.B.; investigation, A.P.-K., A.O., J.K., Ł.P. and J.B.; writing—original draft preparation, A.P.-K.; writing—review and editing, A.P.-K., A.O., J.K., Ł.P. and J.B.; supervision, Ł.P. and J.B.; funding acquisition, Ł.P. and J.B. All authors have read and agreed to the published version of the manuscript.

Funding

This study was funded by UMG Research Project, grant number WZNJ/2021/PZ/02.

Institutional Review Board Statement

Not applicable.

Informed Consent Statement

Not applicable.

Data Availability Statement

Data available upon request.

Acknowledgments

Authors would like to thank PPH SAS Choszczno, Poland, for kindly delivering the shrimp waste.

Conflicts of Interest

The authors declare no conflict of interest.

References

  1. UNESCO—World Water Development Report 2020—Water and Climate Change. Available online: https://en.unesco.org/themes/water-security/wwap/wwdr/2020 (accessed on 26 May 2021).
  2. Piotrowska-Kirschling, A.; Brzeska, J. Environmental management through example of polysaccharide materials using in water treatment. Polish J. Commod. Sci. 2020, 4, 60–75. [Google Scholar]
  3. Amorim, F.V.; Padilha, R.J.R.; Vinhas, G.M.; Luiz, M.R.; de Souza, N.C.; de Almeida, Y.M.B. Development of hydrophobic polyurethane/castor oil biocomposites with agroindustrial residues for sorption of oils and organic solvents. J. Colloid Interface Sci. 2021, 581, 442–454. [Google Scholar] [CrossRef] [PubMed]
  4. Deng, D.; Prendergast, D.P.; MacFarlane, J.; Bagatin, R.; Stellacci, F.; Gschwend, P.M. Hydrophobic meshes for oil spill recovery devices. ASC Appl. Mater. Interfaces 2013, 5, 774–781. [Google Scholar] [CrossRef] [PubMed]
  5. Ani, J.U.; Akpomie, K.G.; Okoro, U.C.; Aneke, L.E.; Onukwuli, O.D.; Ujam, O.T. Potentials of activated carbon produced from biomass, materials for the sequestration of dyes, heavy metals and crude oil components from aqueous environment. Appl. Water Sci. 2020, 10, 69. [Google Scholar] [CrossRef] [Green Version]
  6. Wang, Z.; Ma, H.; Chu, B.; Hsiao, B.S. Super-hydrophobic modification of porous natural polymer “luffa sponge” for oil absorption. Polymer 2017, 126, 470–476. [Google Scholar] [CrossRef]
  7. Beshkar, F.; Amiri, O.; Salehi, Z. Synthesis of ZnSnO3 nanostructures by using novel gelling agents and their application in degradation of textile dye. Sep. Purif. Technol. 2017, 184, 66–71. [Google Scholar] [CrossRef]
  8. Najafian, H.; Manteghi, F.; Beshkar, F.; Salavati-Niasari, M. Fabrication of nanocomposite photocatalyst CuBi2O4/Bi3ClO4 for removal of acid brown 14 as water pollutant under visible light irradiation. J. Hazard. Mater. 2019, 361, 210–220. [Google Scholar] [CrossRef]
  9. Speight, J.G.; El-Gendy, N.S. Chapter 11—Bioremediation of marine oil spills. In Introduction to Petroleum Biotechnology; Speight, J.G., El-Gendy, N.S., Eds.; Gulf Professional Publishing: Houston, TX, USA, 2018; Volume 1, pp. 419–470. [Google Scholar] [CrossRef]
  10. Muttin, F.; Campbell, R. 2—Oil spill containment in open areas: Four Atlantic and Mediterranean experiments. In Oil Spill Studies Healing the Ocean, Biomarking, and the Law; Muttin, F., Ed.; Elsevier: Amsterdam, The Netherlands, 2018; Volume 1, pp. 19–43. [Google Scholar] [CrossRef]
  11. Shah, M.U.H.; Moniruzzaman, M.; Sivapragasam, M.; Talukder, M.M.R.; Yusup, S.B.; Goto, M. A binary mixture of a biosurfactant and an ionic liquid surfactant as a green dispersant for oil spill remediation. J. Mol. Liq. 2019, 280, 111–119. [Google Scholar] [CrossRef]
  12. Kong, D.; He, X.; Khan, F.; Chen, G.; Ping, P.; Yang, H.; Peng, R. Small scale experiment study on burning characteristics for in-situ burning of crude oil on open water. J. Loss Prev. Process Ind. 2019, 60, 46–52. [Google Scholar] [CrossRef]
  13. Lu, J.; Xu, Z.; Xu, S.; Xie, S.; Wu, H.; Yang, Z.; Liu, X. Experimental and numerical investigations on reliability of air barrier on oil containment in flowing water. Mar. Pollut. Bull. 2015, 95, 200–206. [Google Scholar] [CrossRef]
  14. Peng, D.; Li, H.; Li, W.J.; Zheng, L. Biosorbent with superhydrophobicity and superoleophilicity for spilled oil removal. Ecotoxicol. Environ. Saf. 2021, 209, 111803. [Google Scholar] [CrossRef]
  15. Dawodu, F.A.; Abonyi, C.J.; Akpomie, K.G. Feldspar-banana peel composite adsorbent for efficient crude oil removal from solution. Appl. Water Sci. 2021, 11, 3. [Google Scholar] [CrossRef]
  16. Sanguanwong, A.; Flood, A.E.; Ogawa, M.; Martin-Sampedro, R.; Darder, M.; Wicklein, B.; Aranda, P.; Ruiz-Hitzky, E. Hydrophobic composite foams based on nanocellulose-sepiolite for oil sorption applications. J. Hazard. Mater. 2021, 417, 126068. [Google Scholar] [CrossRef]
  17. Dong, Y.D.; Zhang, H.; Zhong, G.J.; Yao, G.; Lai, B. Cellulose/carbon composites and their applications in water treatment—A review. Chem. Eng. J. 2021, 405, 126980. [Google Scholar] [CrossRef]
  18. Gama, N.V.; Ferreira, A.; Barros-Timmons, A. Polyurethane foams: Past, present, and future. Materials 2018, 11, 1841. [Google Scholar] [CrossRef] [Green Version]
  19. Plastics Insight—Polyurethane Production, Pricing and Market Demand. Available online: https://www.plasticsinsight.com/resin-intelligence/resin-prices/polyurethane/ (accessed on 26 May 2021).
  20. Research and Markets—Polyurethane (PU) Foam Market: Global Industry Trends, Share, Size, Growth, Opportunity and Forecast 2021–2026. Available online: https://www.researchandmarkets.com (accessed on 26 May 2021).
  21. BCC Publishing—Global Polyurethane Foam Market. Available online: https://www.bccresearch.com/market-research/plastics/polyurethane-foam-market-report.html#toc (accessed on 26 May 2021).
  22. Martins, L.S.; Zanini, N.C.; Maia, L.S.; Souza, A.G.; Barbosa, R.F.S.; Rosa, D.S.; Mulinari, D.R. Crude oil and S500 diesel removal from seawater by polyurethane composites reinforced with palm fiber residues. Chemosphere 2021, 267, 129288. [Google Scholar] [CrossRef]
  23. Piotrowska-Kirschling, A.; Szelągowska-Rudzka, K.; Karczewski, J.; Brzeska, J. Application of shrimp waste for the synthesis of polyurethane–chitosan materials with potential use in sorption of oil micro-spills in water treatment. Sustainability 2021, 13, 5098. [Google Scholar] [CrossRef]
  24. Jin, T.; Liu, T.; Lam, E.; Moores, A. Chitin and chitosan on the nanoscale. Nanoscale Horiz. 2021, 6, 505–542. [Google Scholar] [CrossRef] [PubMed]
  25. Akindoyo, J.O.; Beg, M.D.H.; Ghazali, S.; Islam, M.R.; Jeyaratnam, N.; Yuvaraj, A.R. Polyurethane types, synthesis and applications—A review. RSC Adv. 2016, 6, 114453–114482. [Google Scholar] [CrossRef] [Green Version]
  26. Brzeska, J.; Elert, A.M.; Morawska, M.; Sikorska, W.; Kowalczuk, M.; Rutkowska, M. Branched polyurethanes based on synthetic polyhydroxybutyrate with tunable structure and properties. Polymers 2018, 10, 826. [Google Scholar] [CrossRef] [PubMed] [Green Version]
  27. Piotrowska-Kirschling, A.; Brzeska, J. The effect of chitosan on the chemical structure, morphology, and selected properties of polyurethane/chitosan composites. Polymers 2020, 12, 1205. [Google Scholar] [CrossRef]
  28. Hejna, A.; Olszewski, A.; Zedler, Ł.; Kosmela, P.; Formela, K. The impact of ground tire rubber oxidation with H2O2 and KMnO4 on the structure and performance of flexible polyurethane/ground tire rubber composite foams. Materials 2021, 14, 499. [Google Scholar] [CrossRef]
  29. Li, H.; Liu, L.; Yang, F. Oleophilic polyurethane foams for oil spill cleanup. Procedia Environ. Sci. 2013, 18, 528–533. [Google Scholar] [CrossRef] [Green Version]
  30. Kwon, O.J.; Oh, S.T.; Lee, S.D.; Lee, N.R.; Shin, C.H.; Park, J.S. Hydrophilic and flexible polyurethane foams using sodium alginate as polyol: Effects of PEG molecular weight and cross-linking agent content on water absorbency. Fiber. Polym. 2007, 8, 347–355. [Google Scholar] [CrossRef]
  31. Queiroz, M.F.; Melo, K.R.T.; Sabry, D.A.; Sassaki, G.L.; Rocha, H.A.O. Does the use of chitosan contribute to oxalate kidney stone formation? Mar. Drugs 2015, 13, 141–158. [Google Scholar] [CrossRef] [PubMed]
  32. Kumirska, J.; Czerwicka, M.; Kaczyński, Z.; Bychowska, A.; Brzozowski, K.; Thöming, J.; Stepnowski, P. Application of spectroscopic methods for structural analysis of chitin and chitosan. Mar. Drugs 2010, 8, 1567–1636. [Google Scholar] [CrossRef] [Green Version]
  33. Suchkova, G.G.; Maklakov, L.I. Amide bands in the IR spectra of urethanes. Vib. Spectrosc. 2009, 51, 333–339. [Google Scholar] [CrossRef]
  34. Zhang, C.; Ren, Z.; Yin, Z.; Qian, H.; Ma, D. Amide II and amide III bands in polyurethane model soft and hard segments. Polym. Bull. 2008, 60, 97–101. [Google Scholar] [CrossRef]
  35. Elliott, J.A.; Windle, A.H.; Hobdell, J.R.; Eeckhaut, G.; Oldman, R.J.; Ludwig, W.; Boller, E.; Cloetens, P.; Baruchel, J. In-situ deformation of an open-cell flexible polyurethane foam characterised by 3D computed microtomography. J. Mater. Sci. 2002, 37, 1547–1555. [Google Scholar] [CrossRef]
  36. Koumlis, S.; Lamberson, L. Strain rate dependent compressive response of open cell polyurethane foam. Exp. Mech. 2019, 59, 1087–1103. [Google Scholar] [CrossRef]
  37. Wu, J.W.; Sung, W.F.; Chu, H.S. Thermal conductivity of polyurethane foams. Int. J. Heat Mass Transf. 1999, 42, 2211–2217. [Google Scholar] [CrossRef]
  38. Husainie, S.M.; Khattak, S.U.; Robinson, J.; Naguib, H.E. A comparative study on the mechanical properties of different natural fiber reinforced free-rise polyurethane foam composites. Ind. Eng. Chem. Res. 2020, 59, 21745–21755. [Google Scholar] [CrossRef]
  39. Sakurai, K.; Maegawa, T.; Takahashi, T. Glass transition temperature of chitosan and miscibility of chitosan/poly(N-vinyl pyrrolidone) blends. Polymer 2000, 41, 7051–7056. [Google Scholar] [CrossRef]
  40. Ryszkowska, J.; Leszczyńska, M.; Auguścik, M.; Bryśkiewicz, A.; Półka, M.; Kukfisz, B.; Wierzbicki, Ł.; Aleksandrowicz, J.; Szczepkowski, L.; Oliwa, R. Rdzenie konstrukcji kompozytowych z pianek półsztywnych do zastosowań w tarczach ochronnych dla strażaków (in Polish). Polimery 2018, 63, 125–133. [Google Scholar] [CrossRef]
  41. Filip, D.; Macocinschi, D.; Vlad, S. Thermogravimetric study por polyurethane materials for biomedical applications. Compos. B Eng. 2011, 42, 1474–1479. [Google Scholar] [CrossRef]
  42. Chattopadhyay, D.K.; Webster, D.C. Thermal stability and flame retardancy of polyurethanes. Prog. Polym. Sci. 2009, 34, 1068–1133. [Google Scholar] [CrossRef]
  43. Hejna, A.; Kosmela, P.; Kirpluks, M.; Cabulis, U.; Klein, M.; Haponiuk, J.; Piszczyk, Ł. Structure, mechanical, thermal and fire behavior assessments of environmentally friendly crude glycerol-based rigid polyisocyanurate foams. J. Polym. Environ. 2018, 26, 1854–1868. [Google Scholar] [CrossRef] [Green Version]
  44. Olszewski, A.; Nowak, P.; Kosmela, P.; Piszczyk, Ł. Characterization of highly filled glass fiber/carbon fiber polyurethane composites with the addition of bio-polyol obtained through biomass liquefaction. Materials 2021, 14, 1391. [Google Scholar] [CrossRef]
  45. Santos, O.S.H.; da Silva, M.C.; Silva, V.R.; Mussel, W.N.; Yoshida, M.I. Polyurethane foam impregnated with lignin as a filler for the removal of crude oil from contaminated water. J. Hazard. Mater. 2017, 324, 406–413. [Google Scholar] [CrossRef]
Figure 1. Scheme of the chemical deacetylation of chitin to chitosan.
Processes 09 01394 g001
Figure 2. ATR-FTIR spectra.
Processes 09 01394 g002
Figure 3. SEM images of PUR ((a,b), where (b) shows the fragment from the red selection of image (a)) and PUR+Ch2 foam ((c,d), where (d) shows the fragment from the red selection of image (c)).
Processes 09 01394 g003
Figure 4. TGA and DTA curves of PUR+Ch1.
Processes 09 01394 g004
Figure 5. Water sorption of PUR and PUR+Ch foams.
Processes 09 01394 g005
Figure 6. Oil sorption of PUR and PUR+Ch foams.
Processes 09 01394 g006
Table 1. Composition of PUR and PUR+Ch foams.
FoamQuantitative Composition of Foams (wt%)
Rokopol V700 TEGOSTAB B8465DABCO K-15DABCO 33-LVDBTDLn-pentanepMDICh
PUR49.71.61.31.20.810.734.70.0
PUR+Ch149.81.71.31.20.810.633.61.0
PUR+Ch249.21.91.31.30.810.632.82.1
PUR+Ch351.11.91.21.20.810.230.63.0
Table 2. Open cell content (with standard deviation SD) of PUR and PUR+Ch foams.
FoamOpen Cell Content ± SD (%)
PUR 84.3   ± 1.58
PUR+Ch1 95.8   ± 0.82
PUR+Ch2 94.9   ± 0.42
PUR+Ch3 93.4   ± 0.34
Table 3. Hardness (with standard deviation SD) of PUR and PUR+Ch foams.
FoamHardness ± SD (Shore H0)
PUR 9.3   ± 1.09
PUR+Ch1 6.0   ± 2.21
PUR+Ch2 6.5   ± 2.17
PUR+Ch3 8.8   ± 1.57
Table 4. Melting temperature and enthalpy of soft (Tm1, ΔH1) and hard (Tm2, ΔH2) segments and heat deflection temperature (HDT) of PUR and PUR+Ch foams.
Foamwt% ChTm1 (°C)ΔH1 (J/g)Tm2 (°C)ΔH2 (J/g)HDT (°C)
Ch-80.3145.3---
PUR044.973.9159.762.4185.8
PUR+Ch1150.529.4221.310.5166.5
PUR+Ch2250.29.6160.686.4172.5
PUR+Ch3347.816.2161.386.1177.8
Table 5. Results of TGA analysis.
SampleDifferent % Mass Loss
in Temperature (°C)
Tmax (°C)Char Residue after Test (%)
2%5%50%
PUR211.5241.5353.5346.419.34
PUR+Ch1208.0250.7353.9350.621.20
PUR+Ch2208.4242.1351.6346.920.72
PUR+Ch3213.6249.4352.4345.718.95
Temperature (°C)Area under curveRatio of individual stagesof decomposition
Peak 13022421
Peak 23534801.99
Peak 3547550.23
Publisher’s Note: MDPI stays neutral with regard to jurisdictional claims in published maps and institutional affiliations.

