
Effect of Closure Characteristics of Annular Jet Mixed Zone on Inspiratory Performance and Bubble System


Abstract
:1. Introduction
2. Test Device and Numerical Model
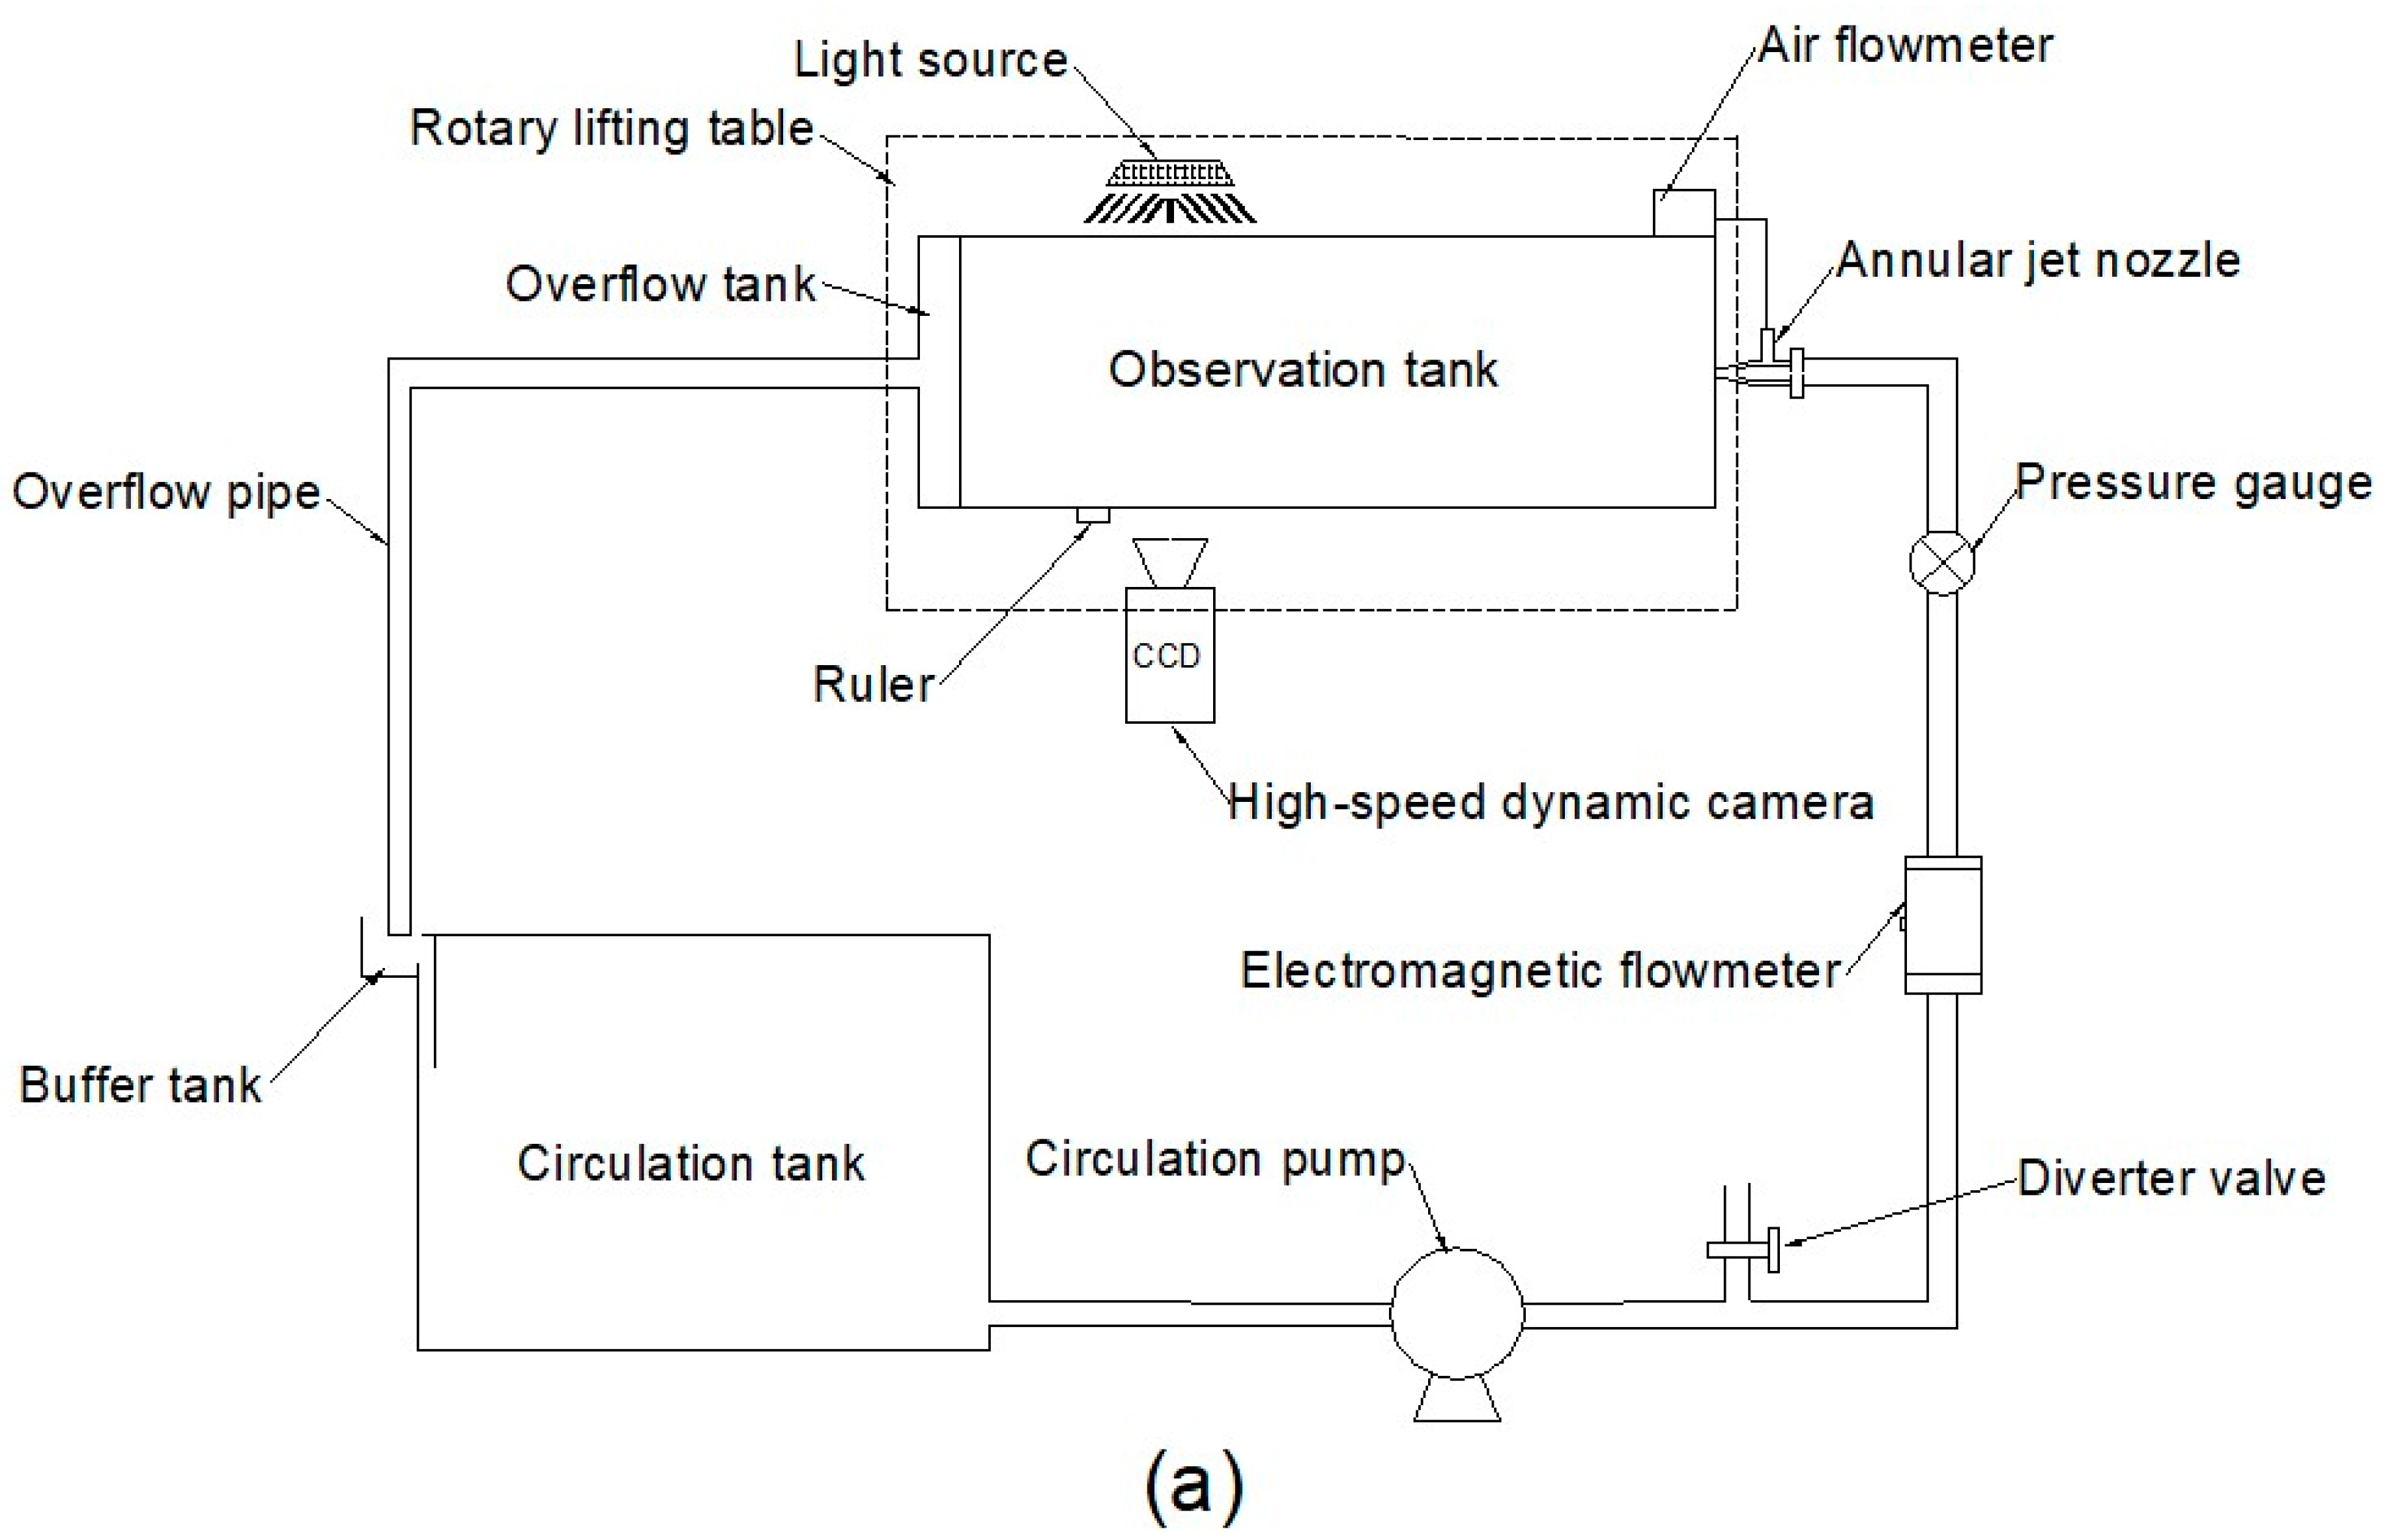
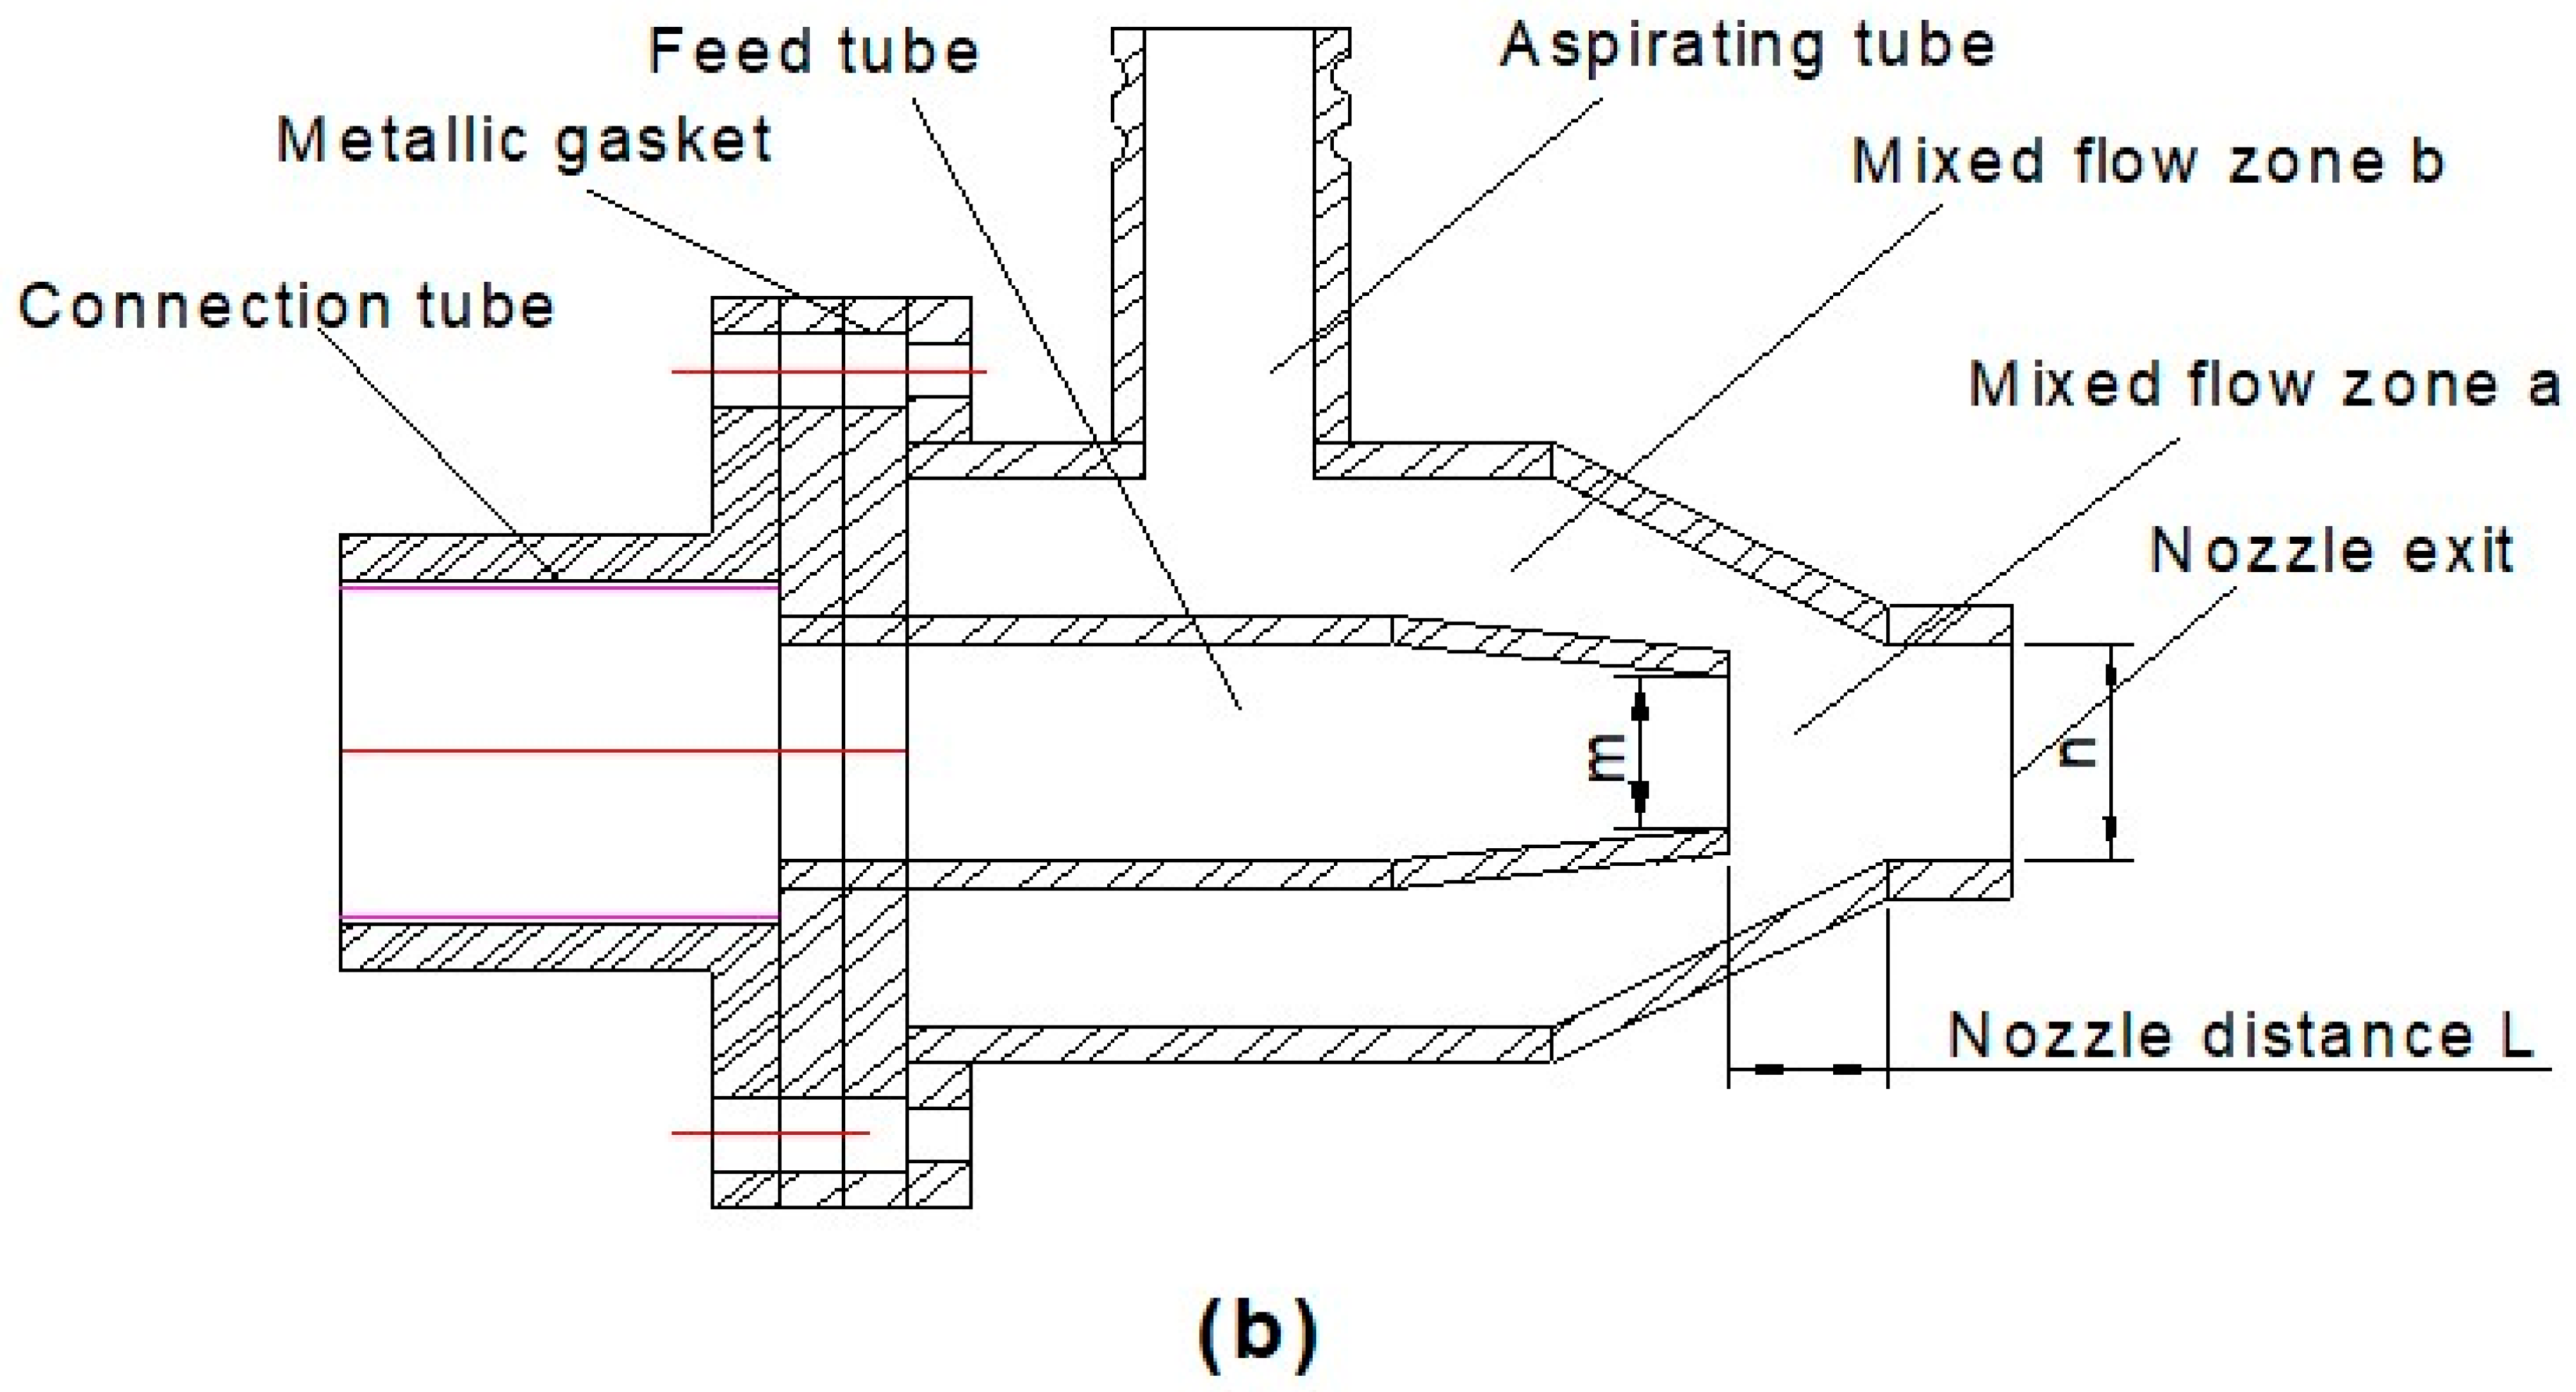
2.1. Test Device
2.2. Test Process
2.3. Reagents
3. Numerical Model
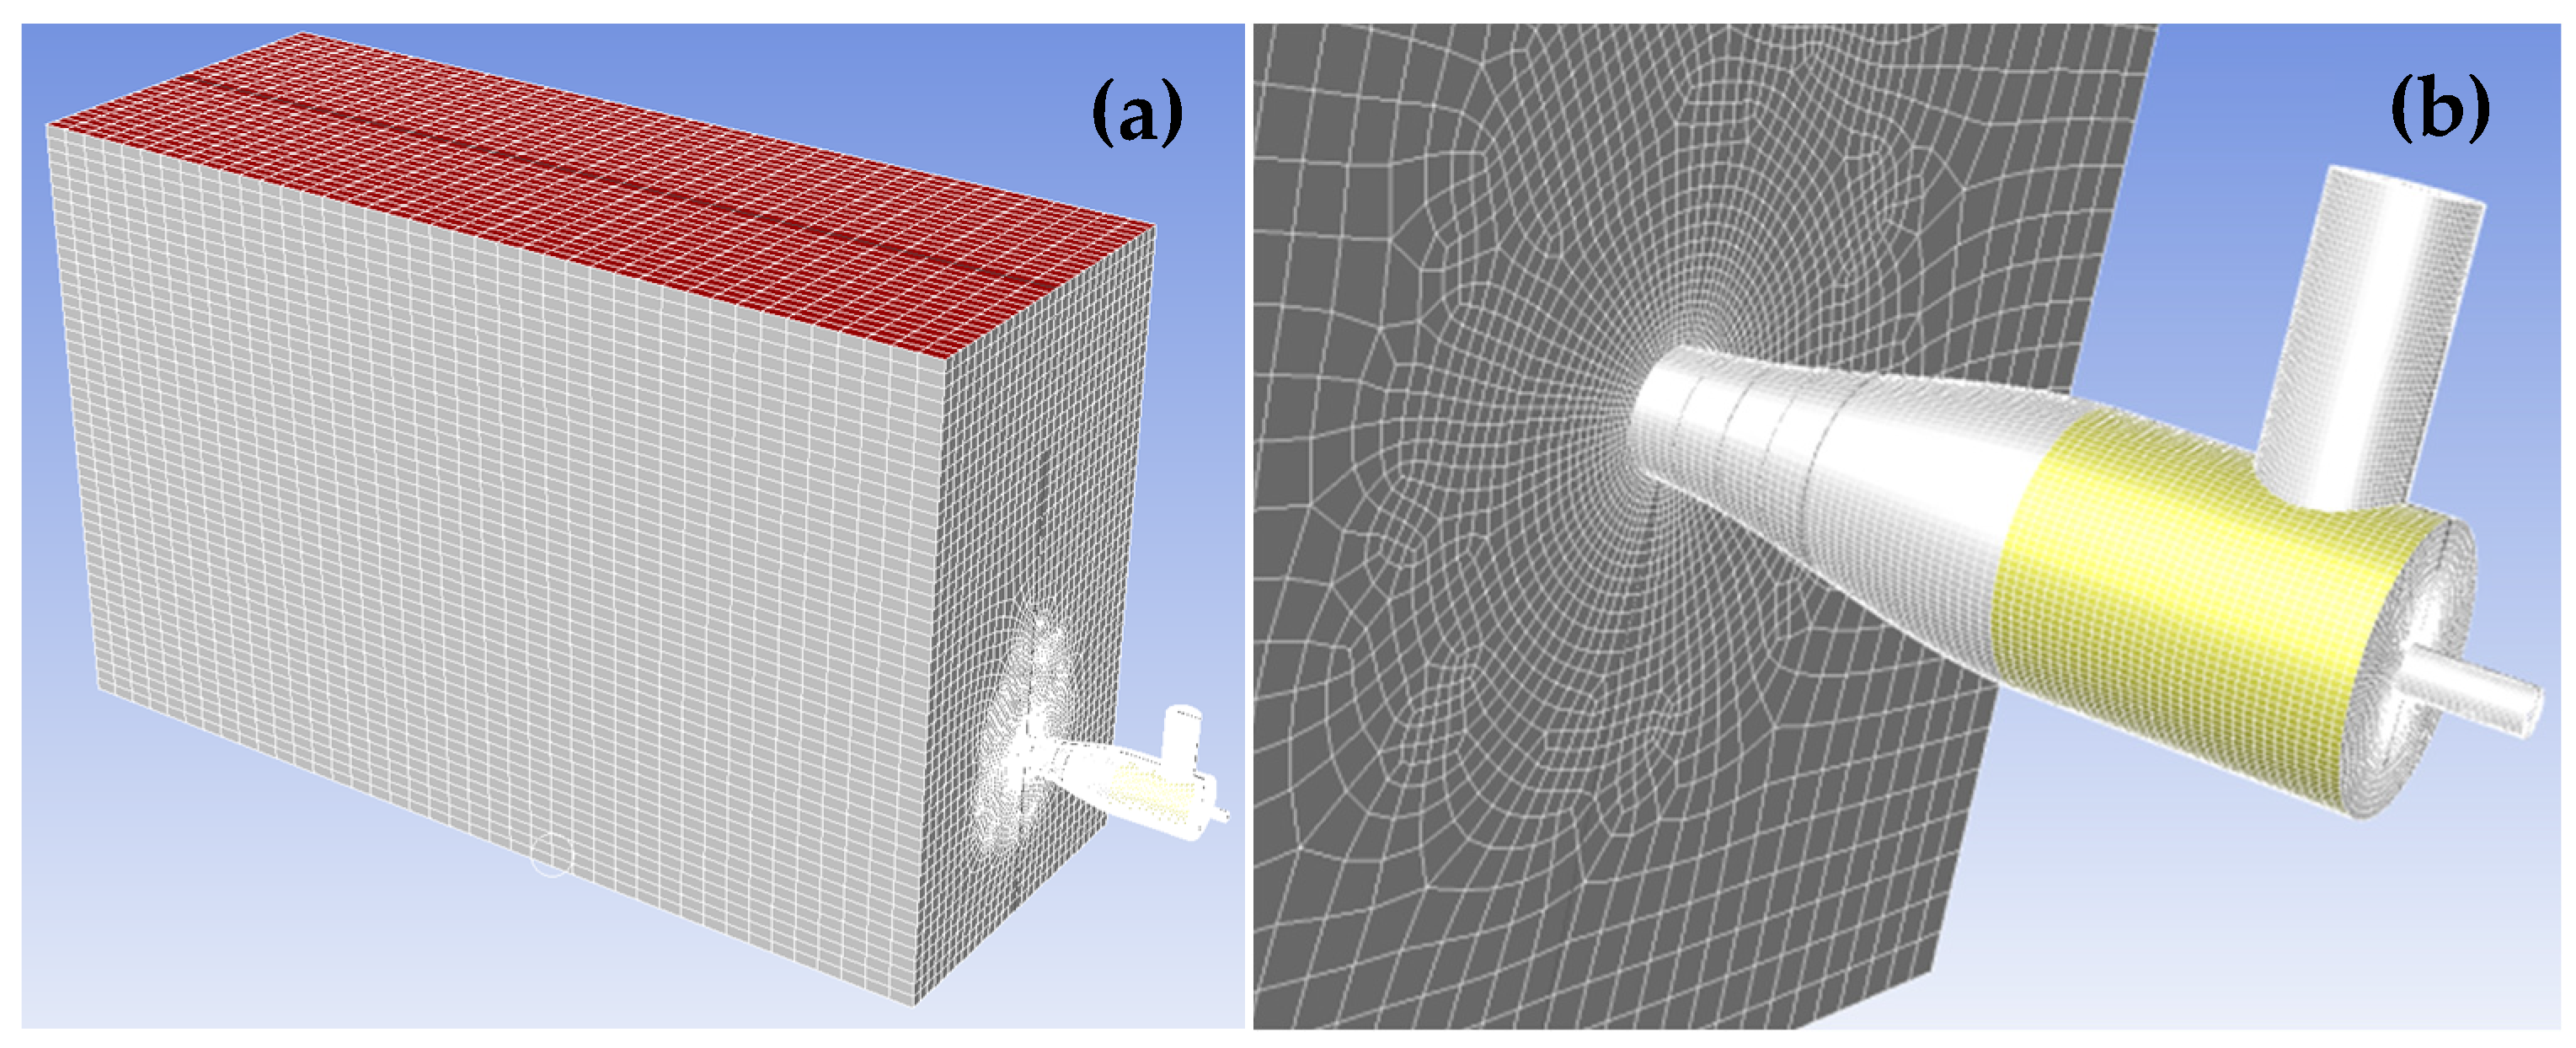
Model Establishment
4. Analysis of Results
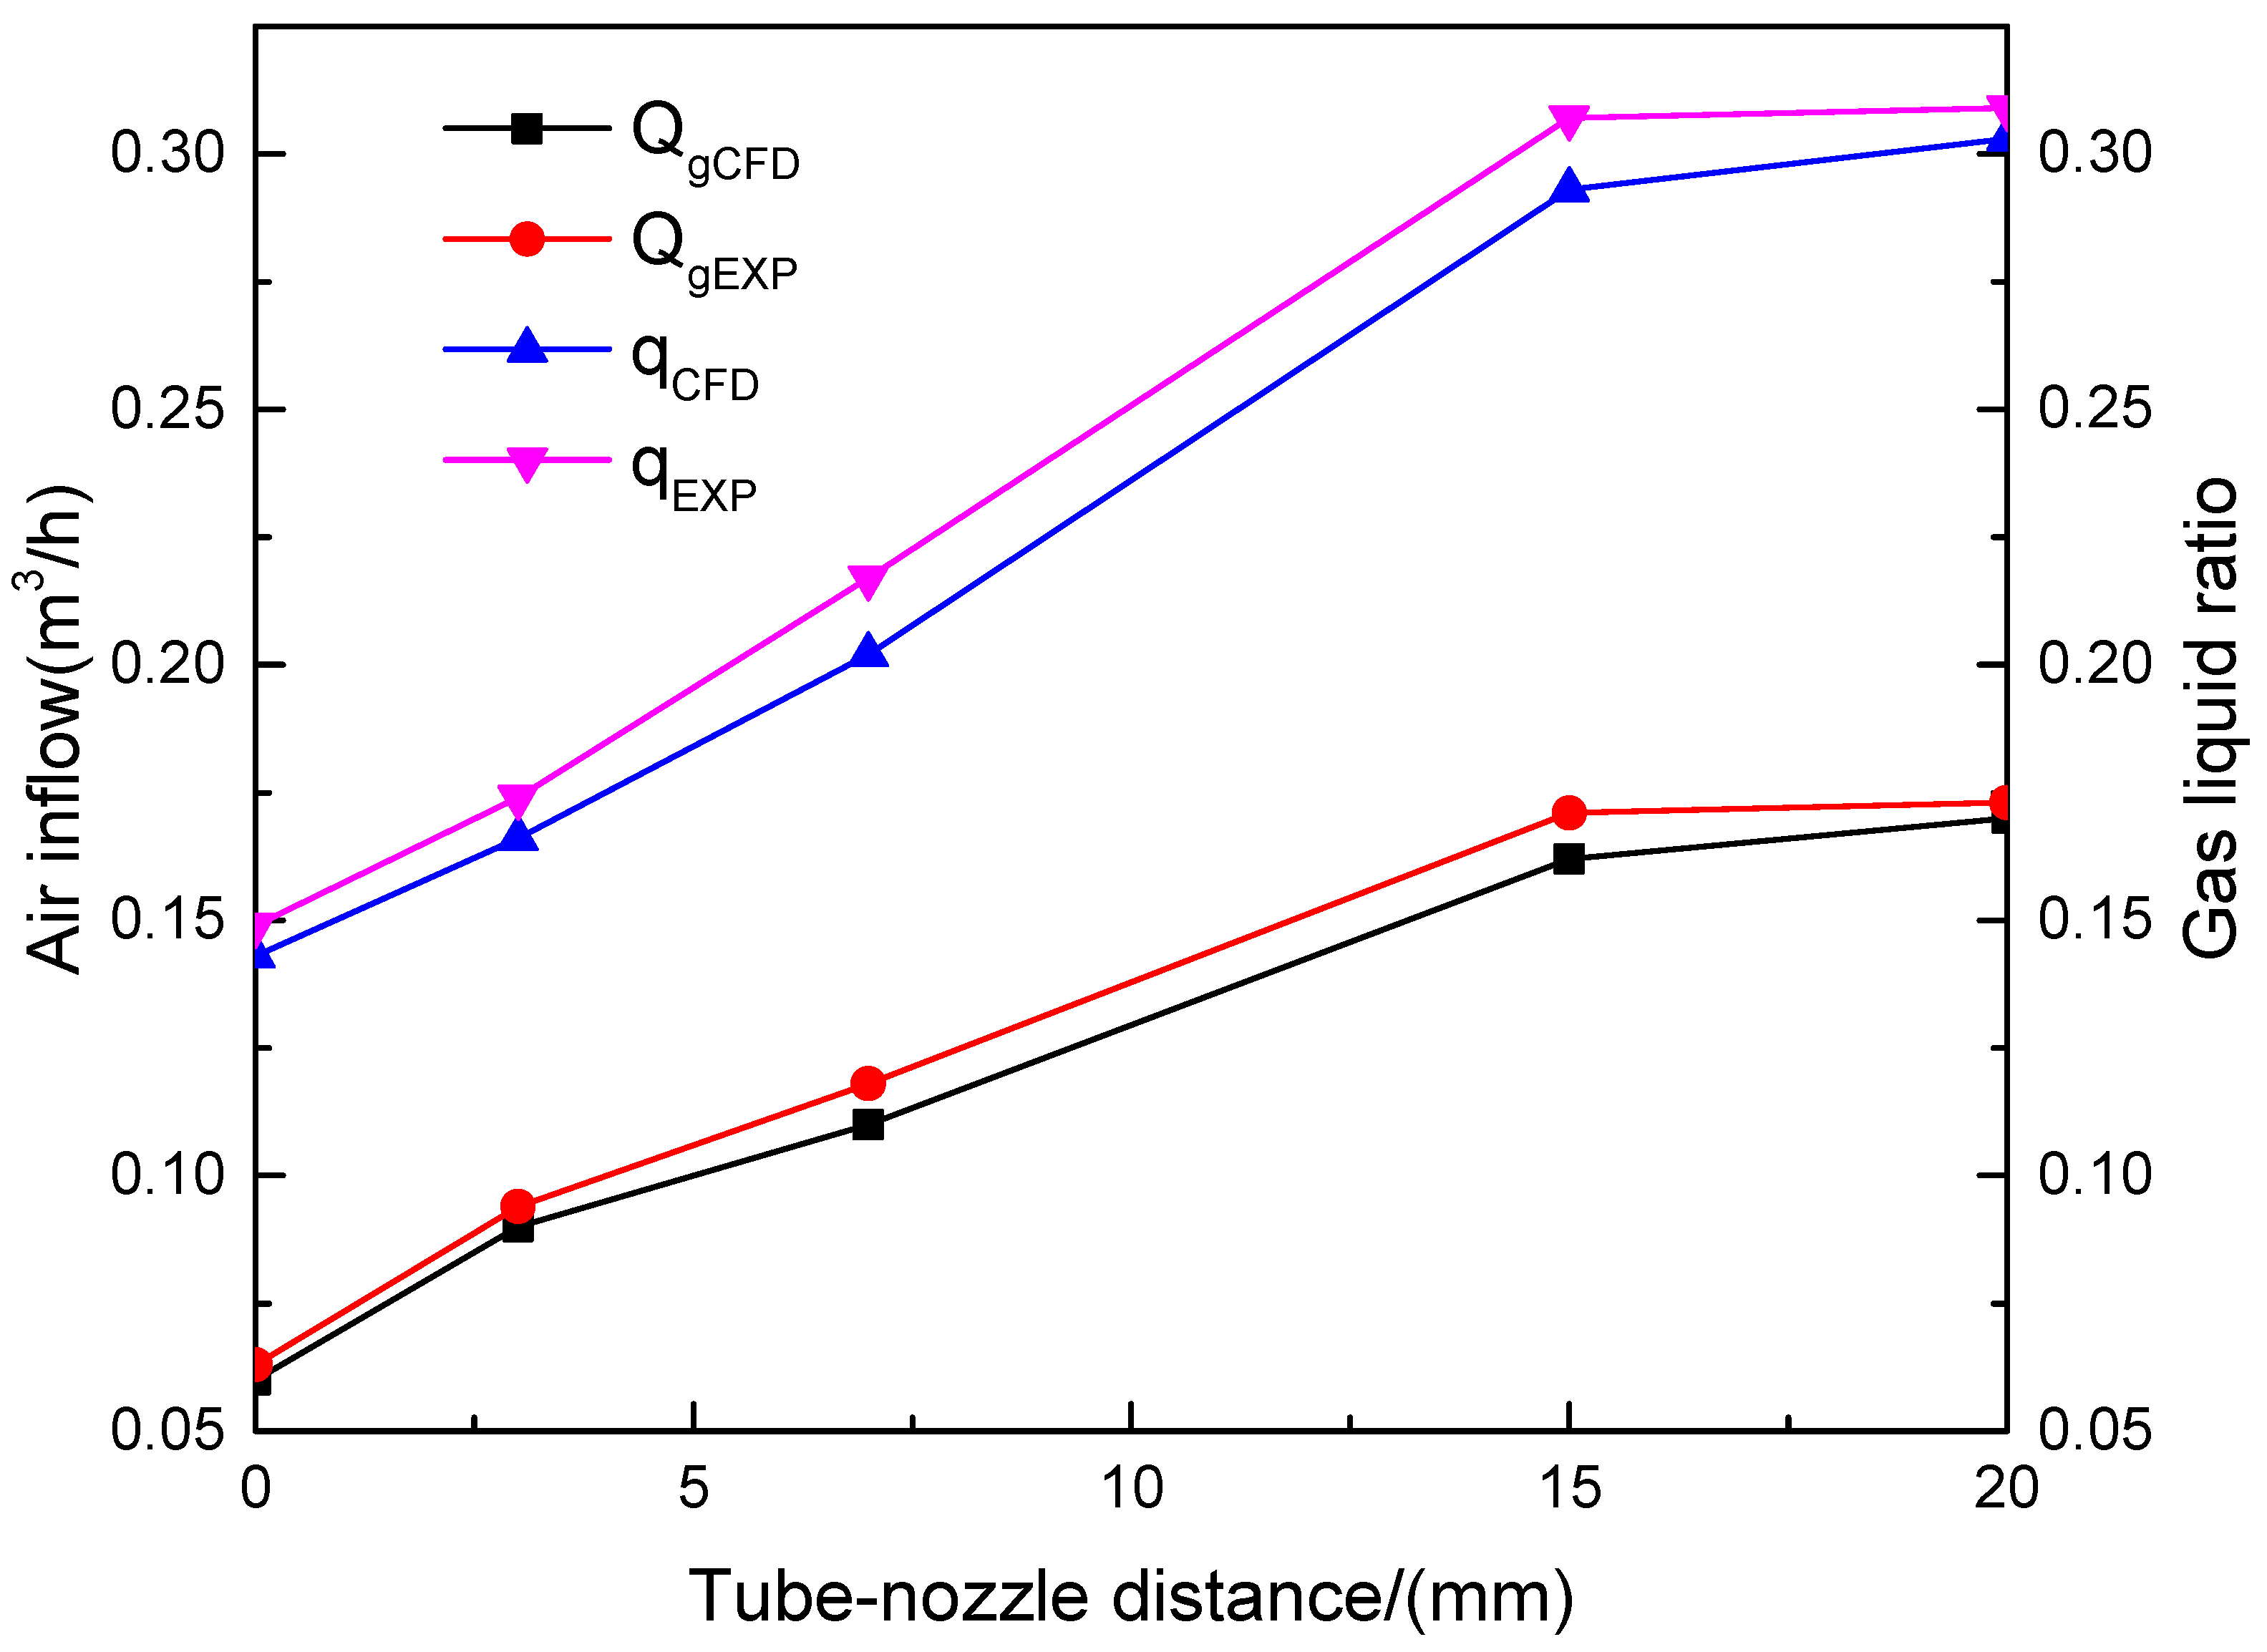
4.1. Evaluating the Reliability of Numerical Simulation
4.2. Analysis of Internal Flow Field
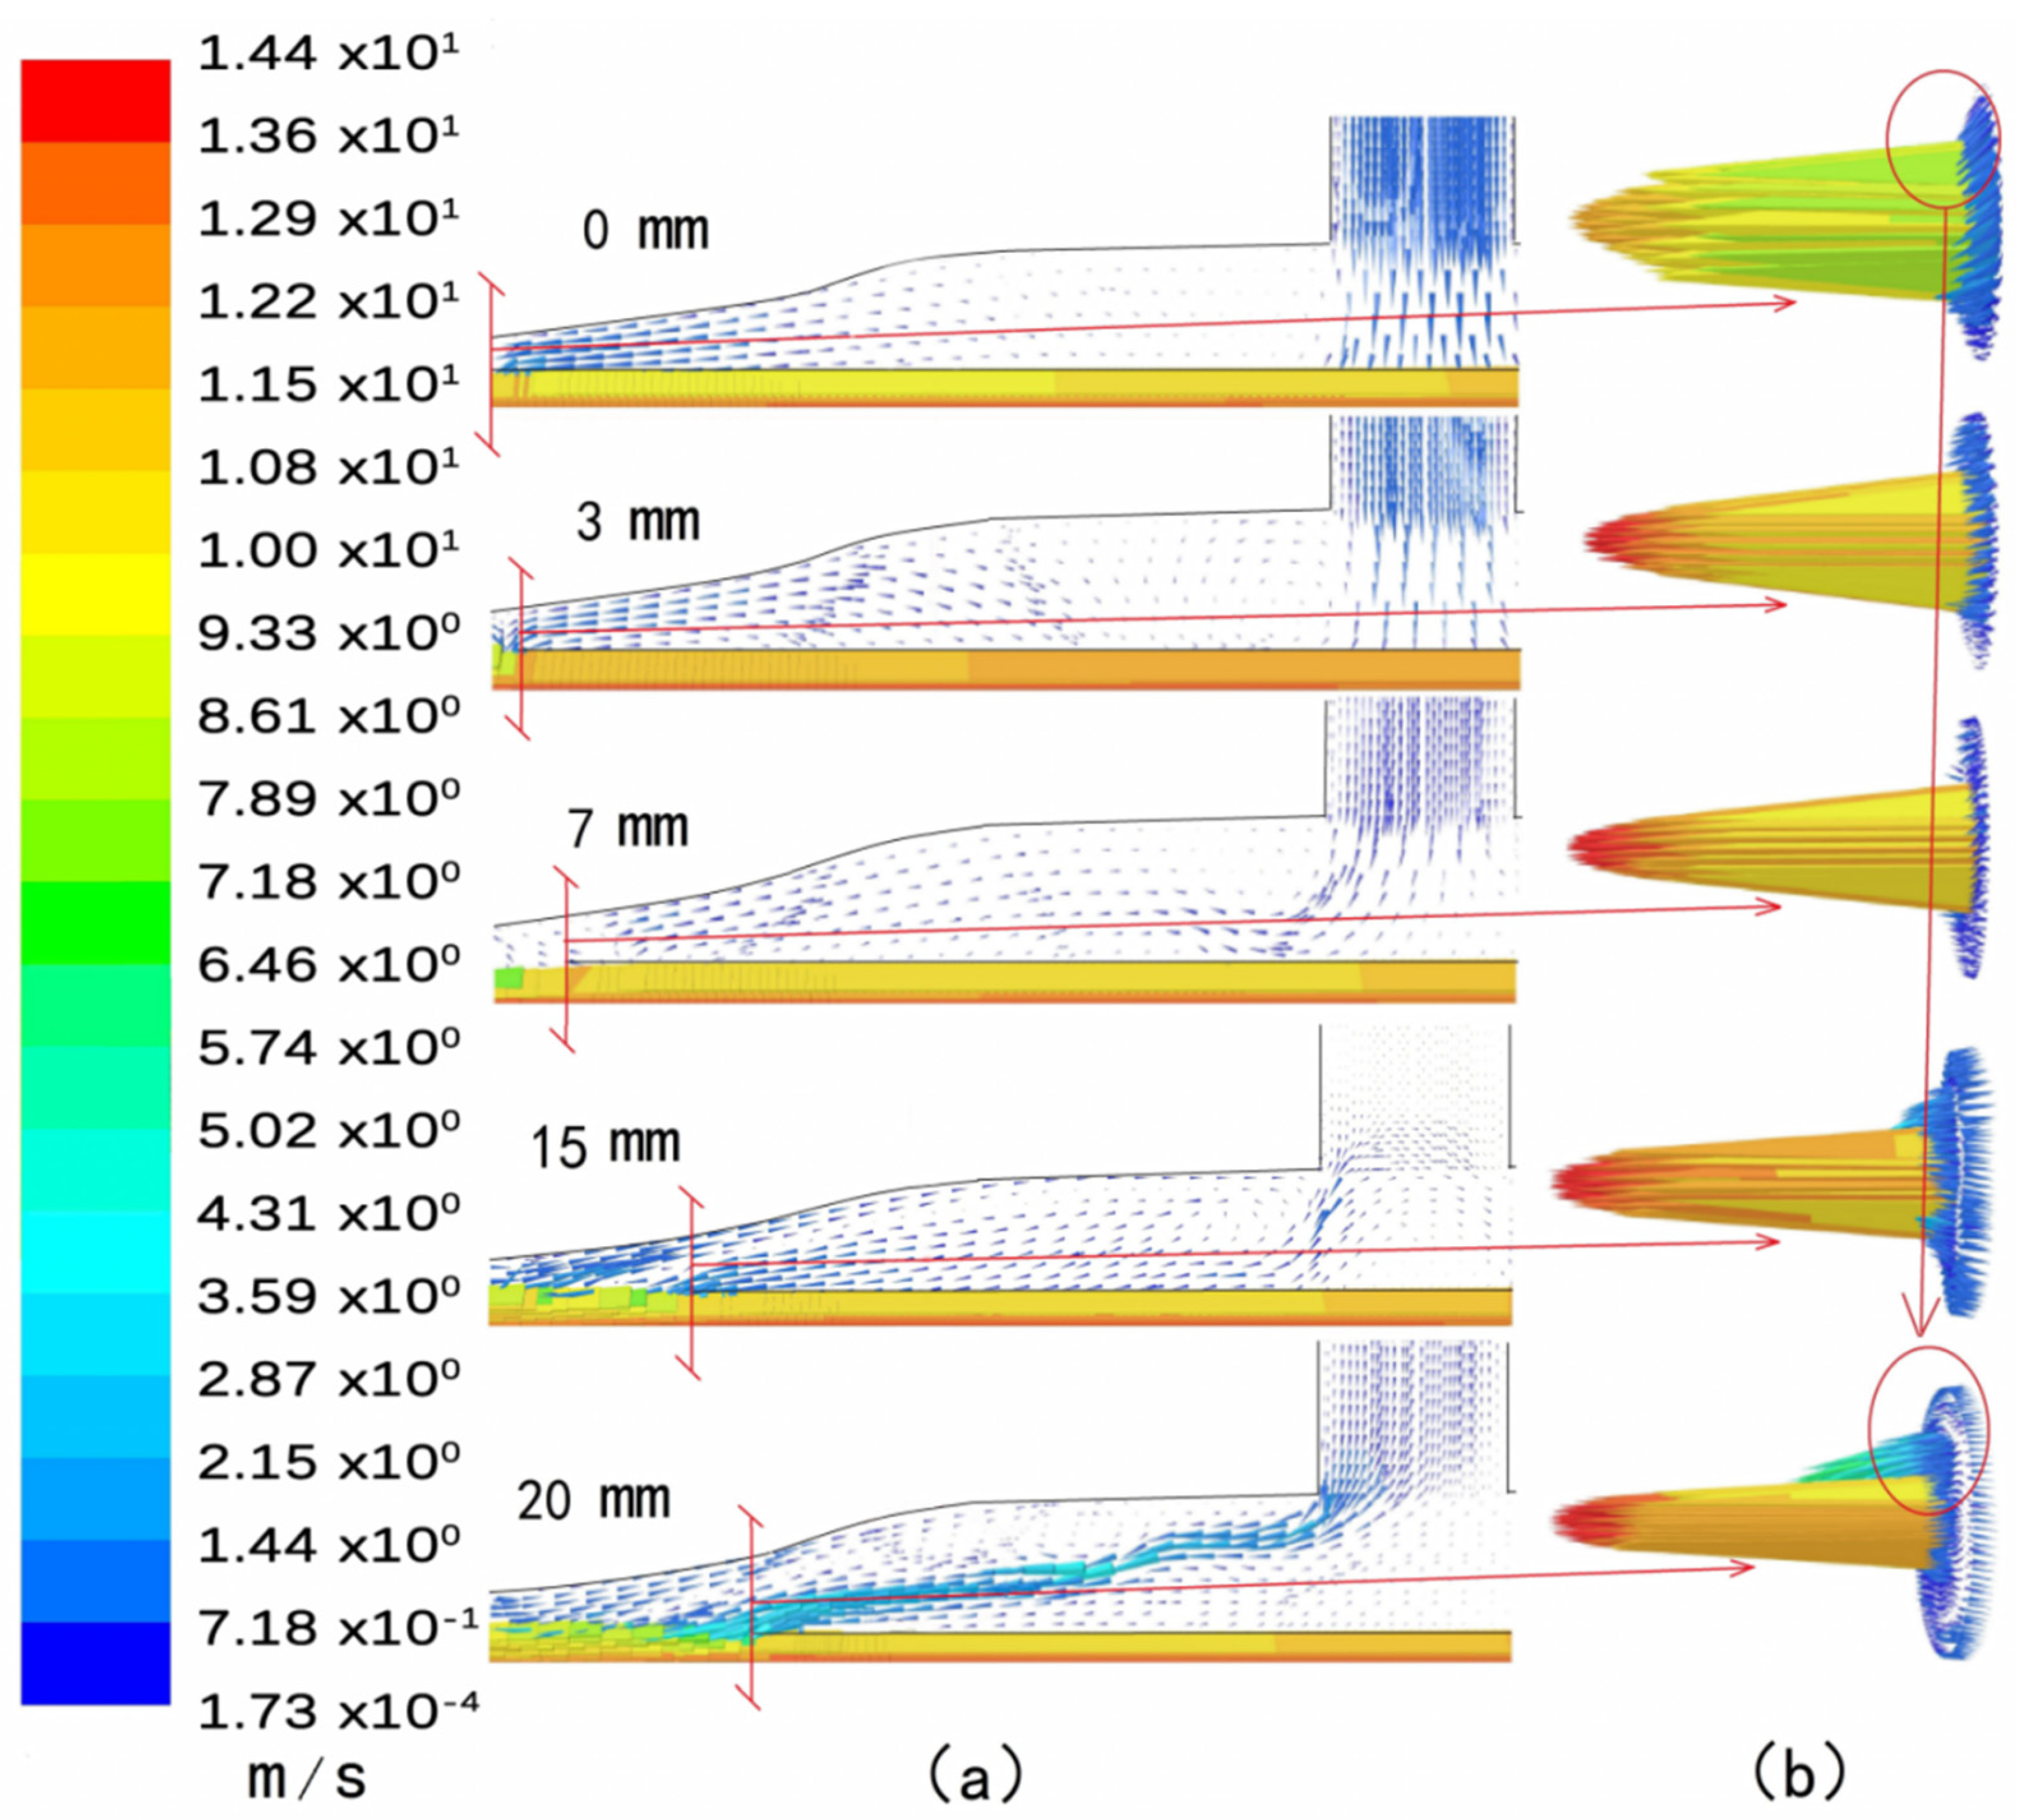
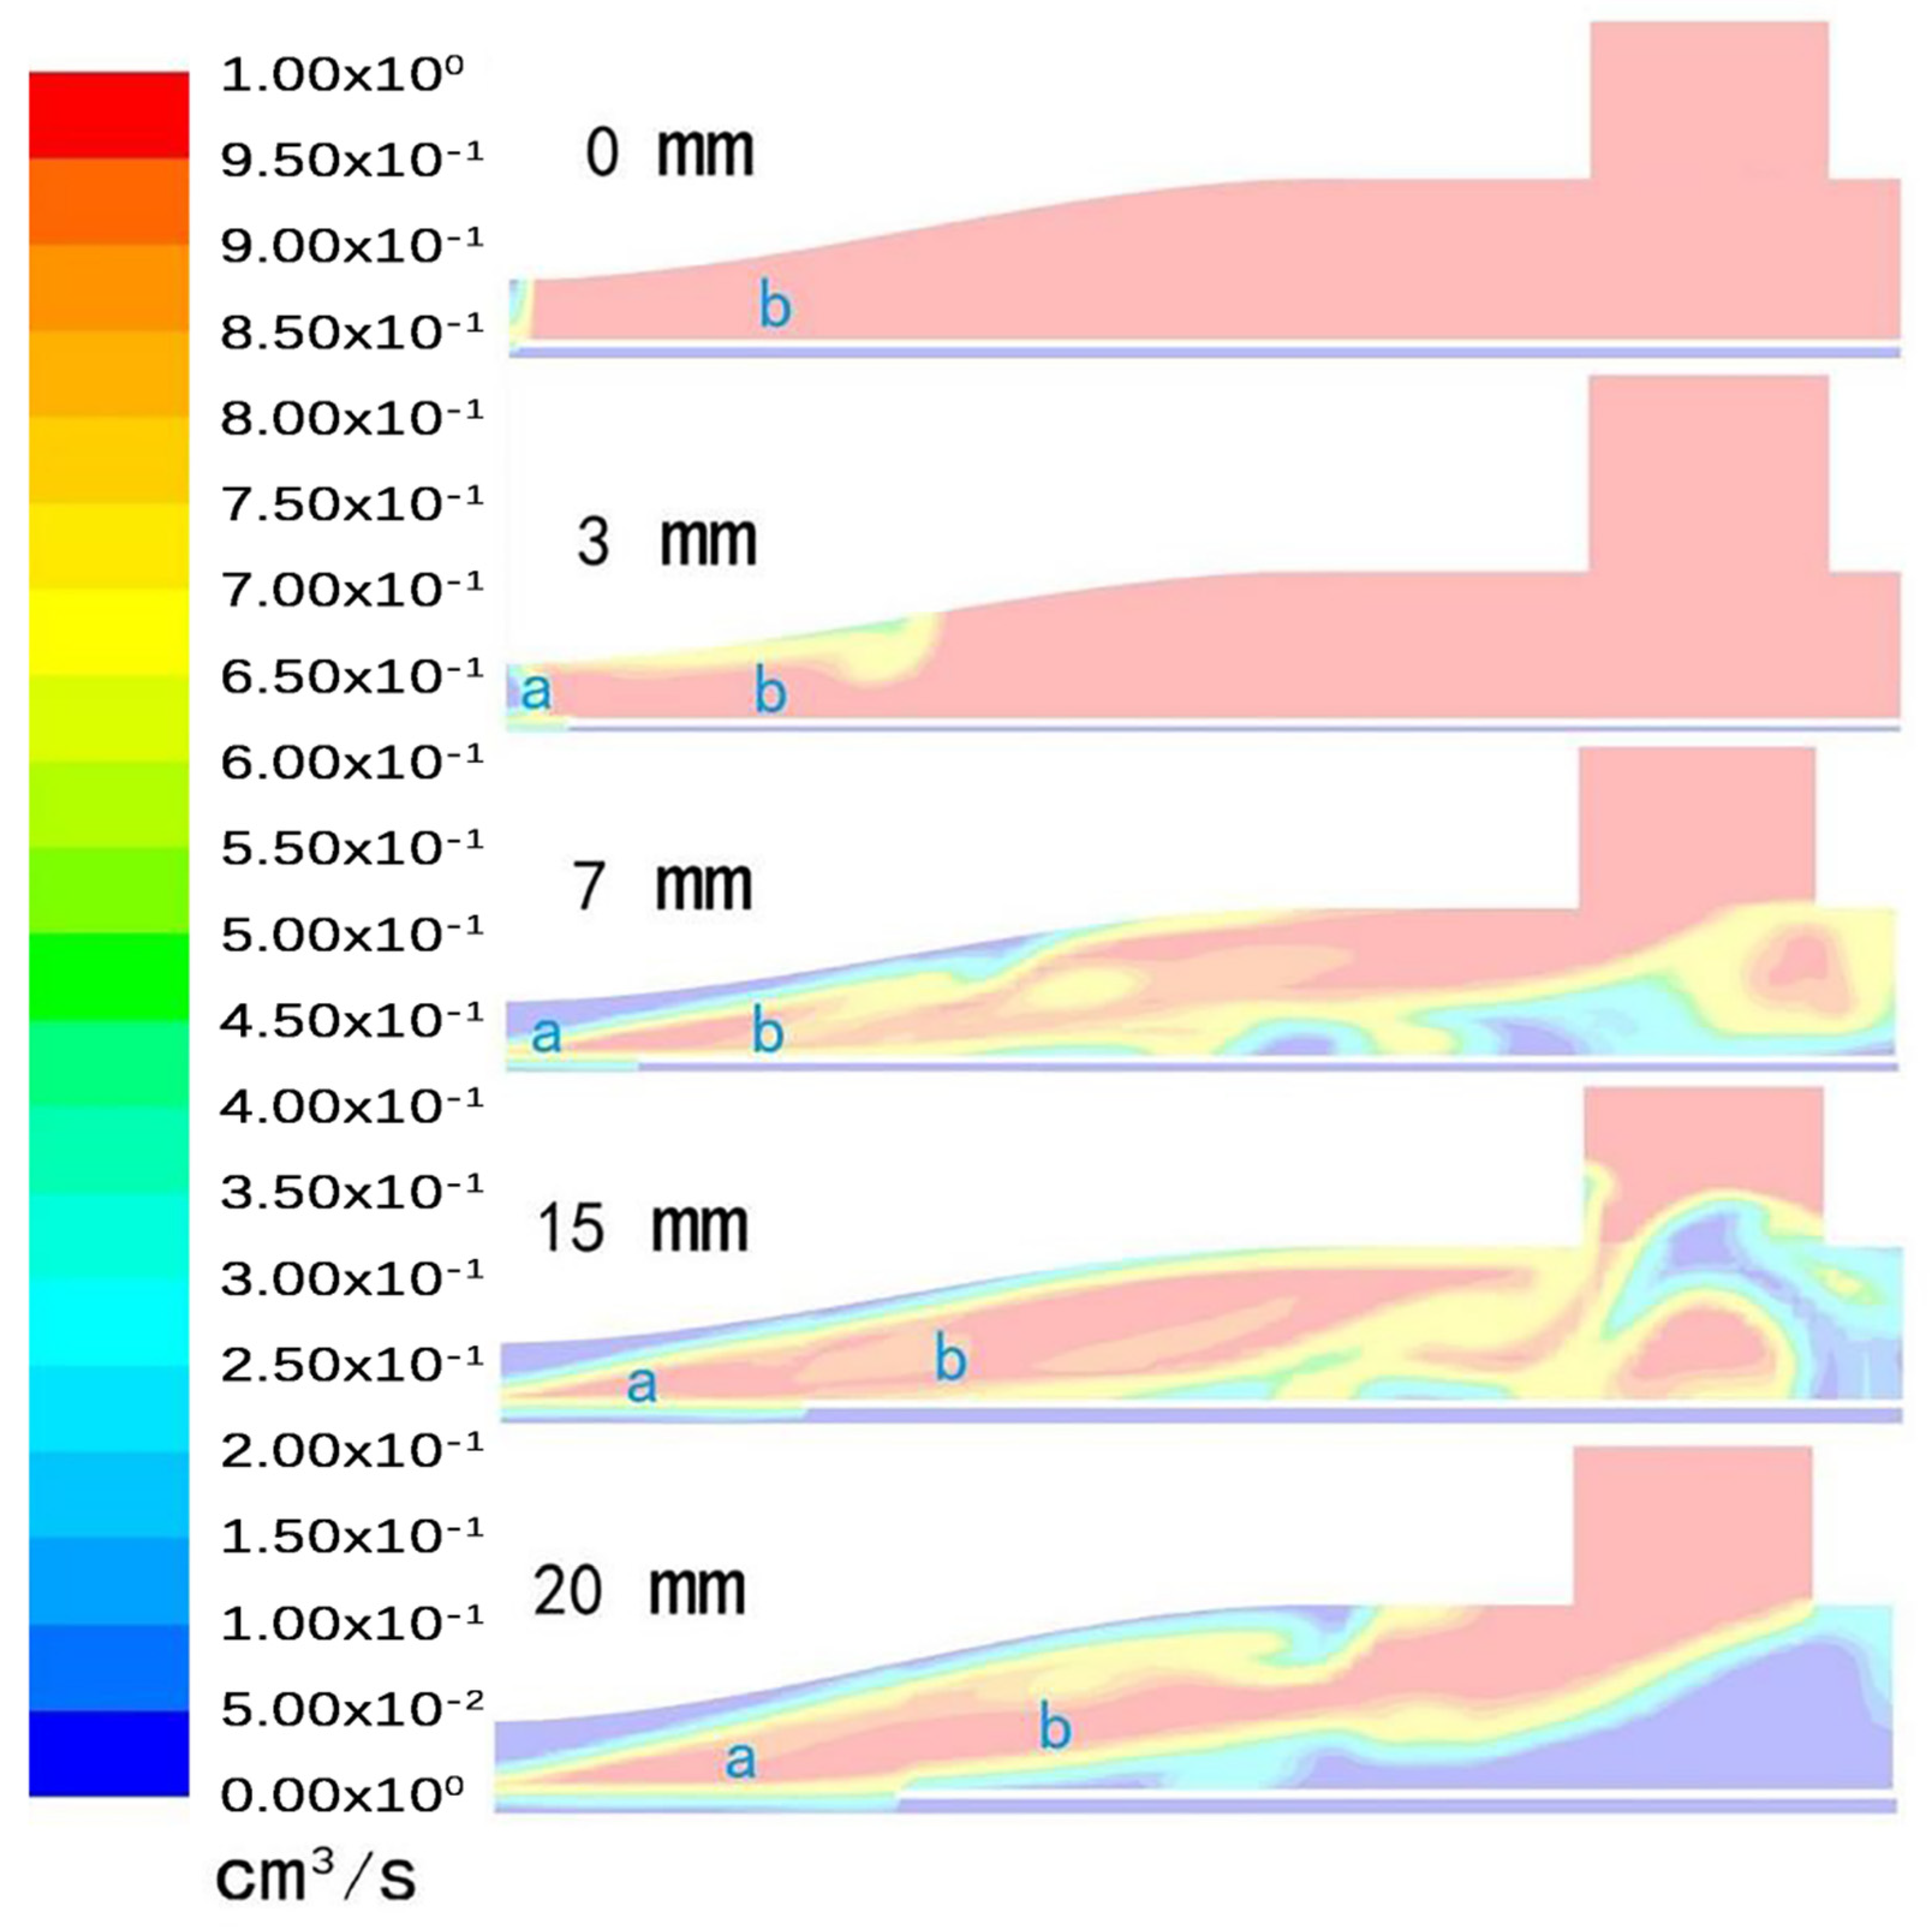
4.2.1. Variation Characteristics of Velocity Field under Different Tube-Nozzle Distances
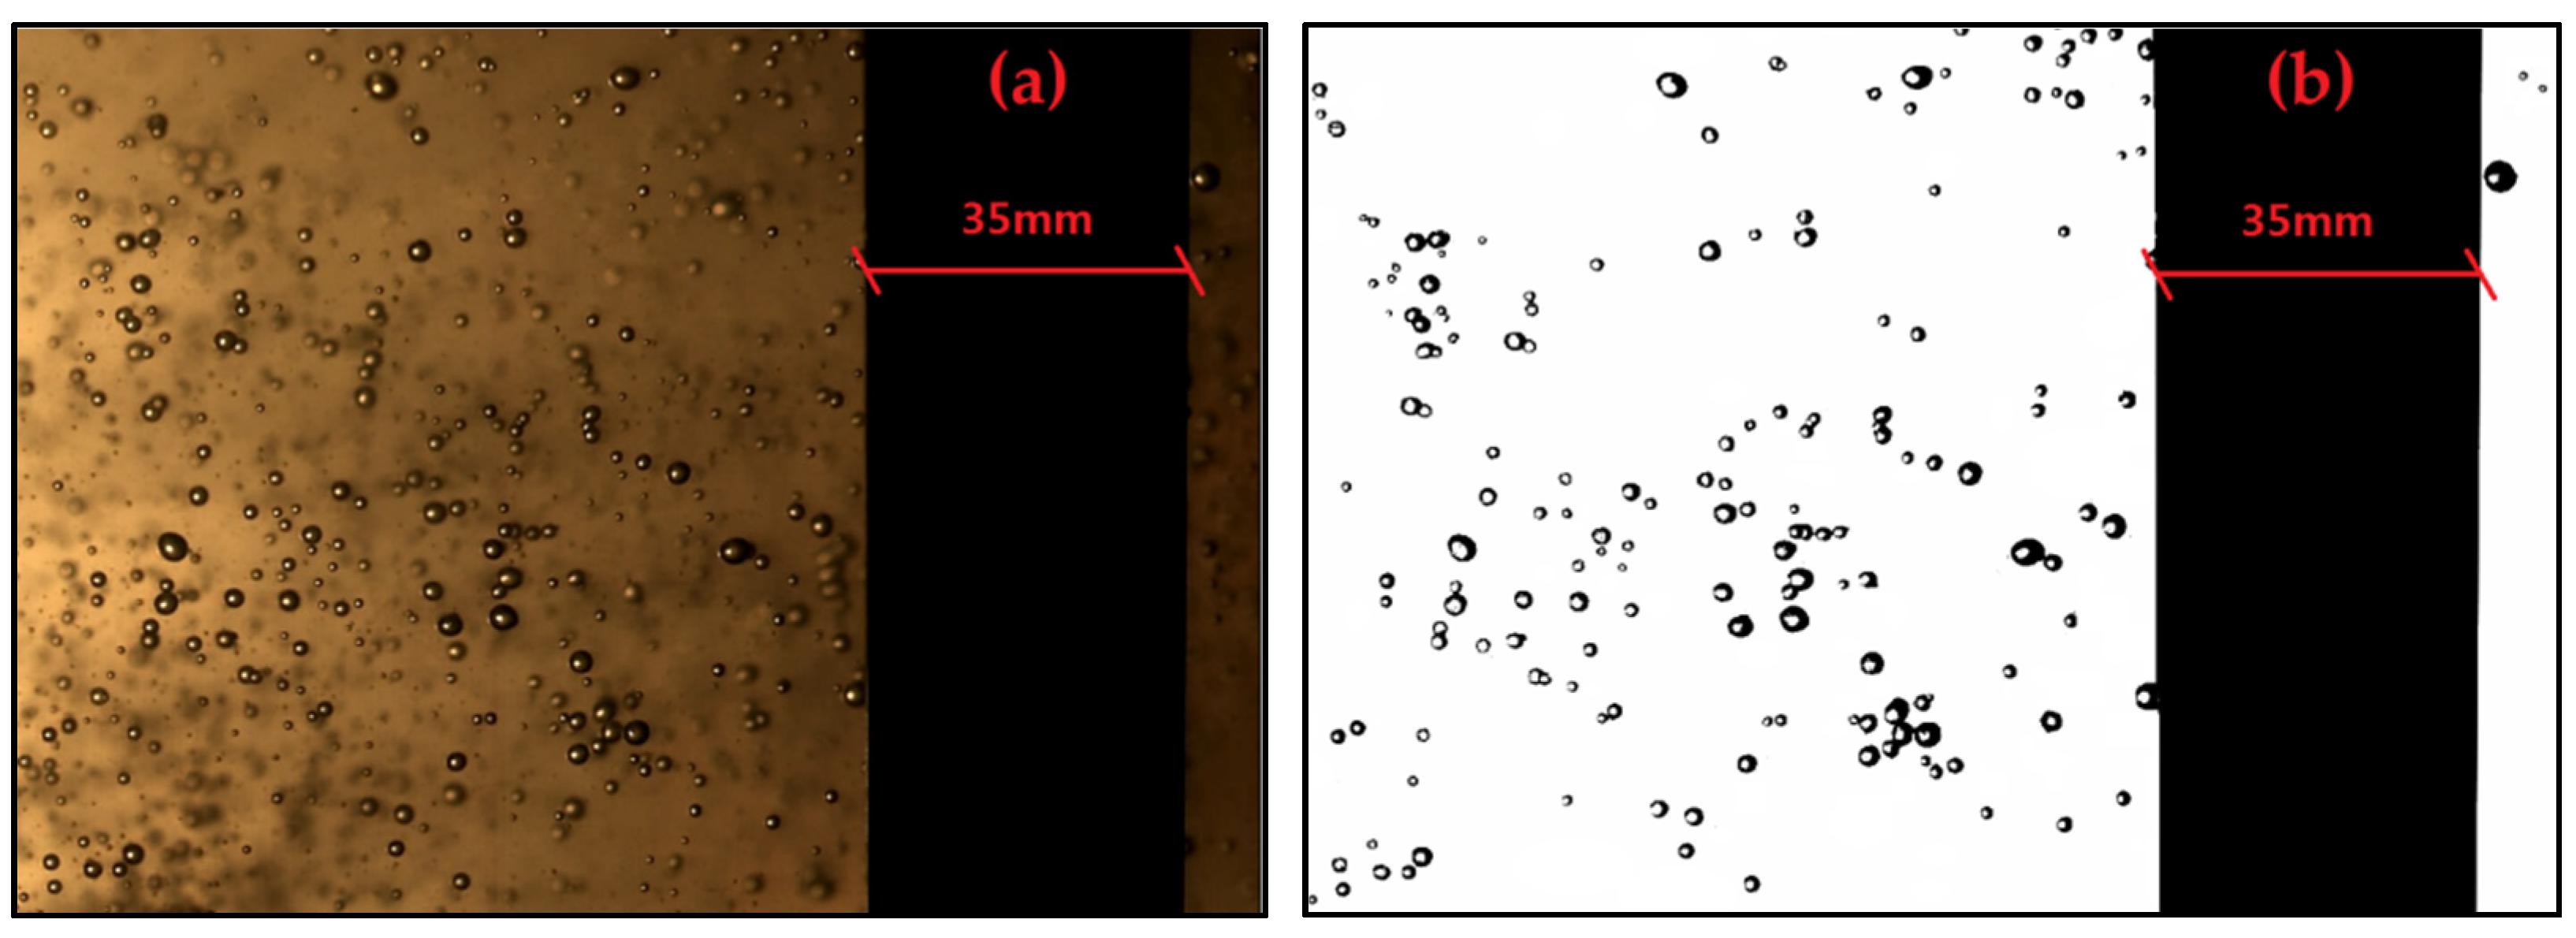
4.2.2. Influence of Inflow Pressure on Bubble Size Distribution
5. Effect of Tube-Nozzle Distances on Bubble Motion Characteristics
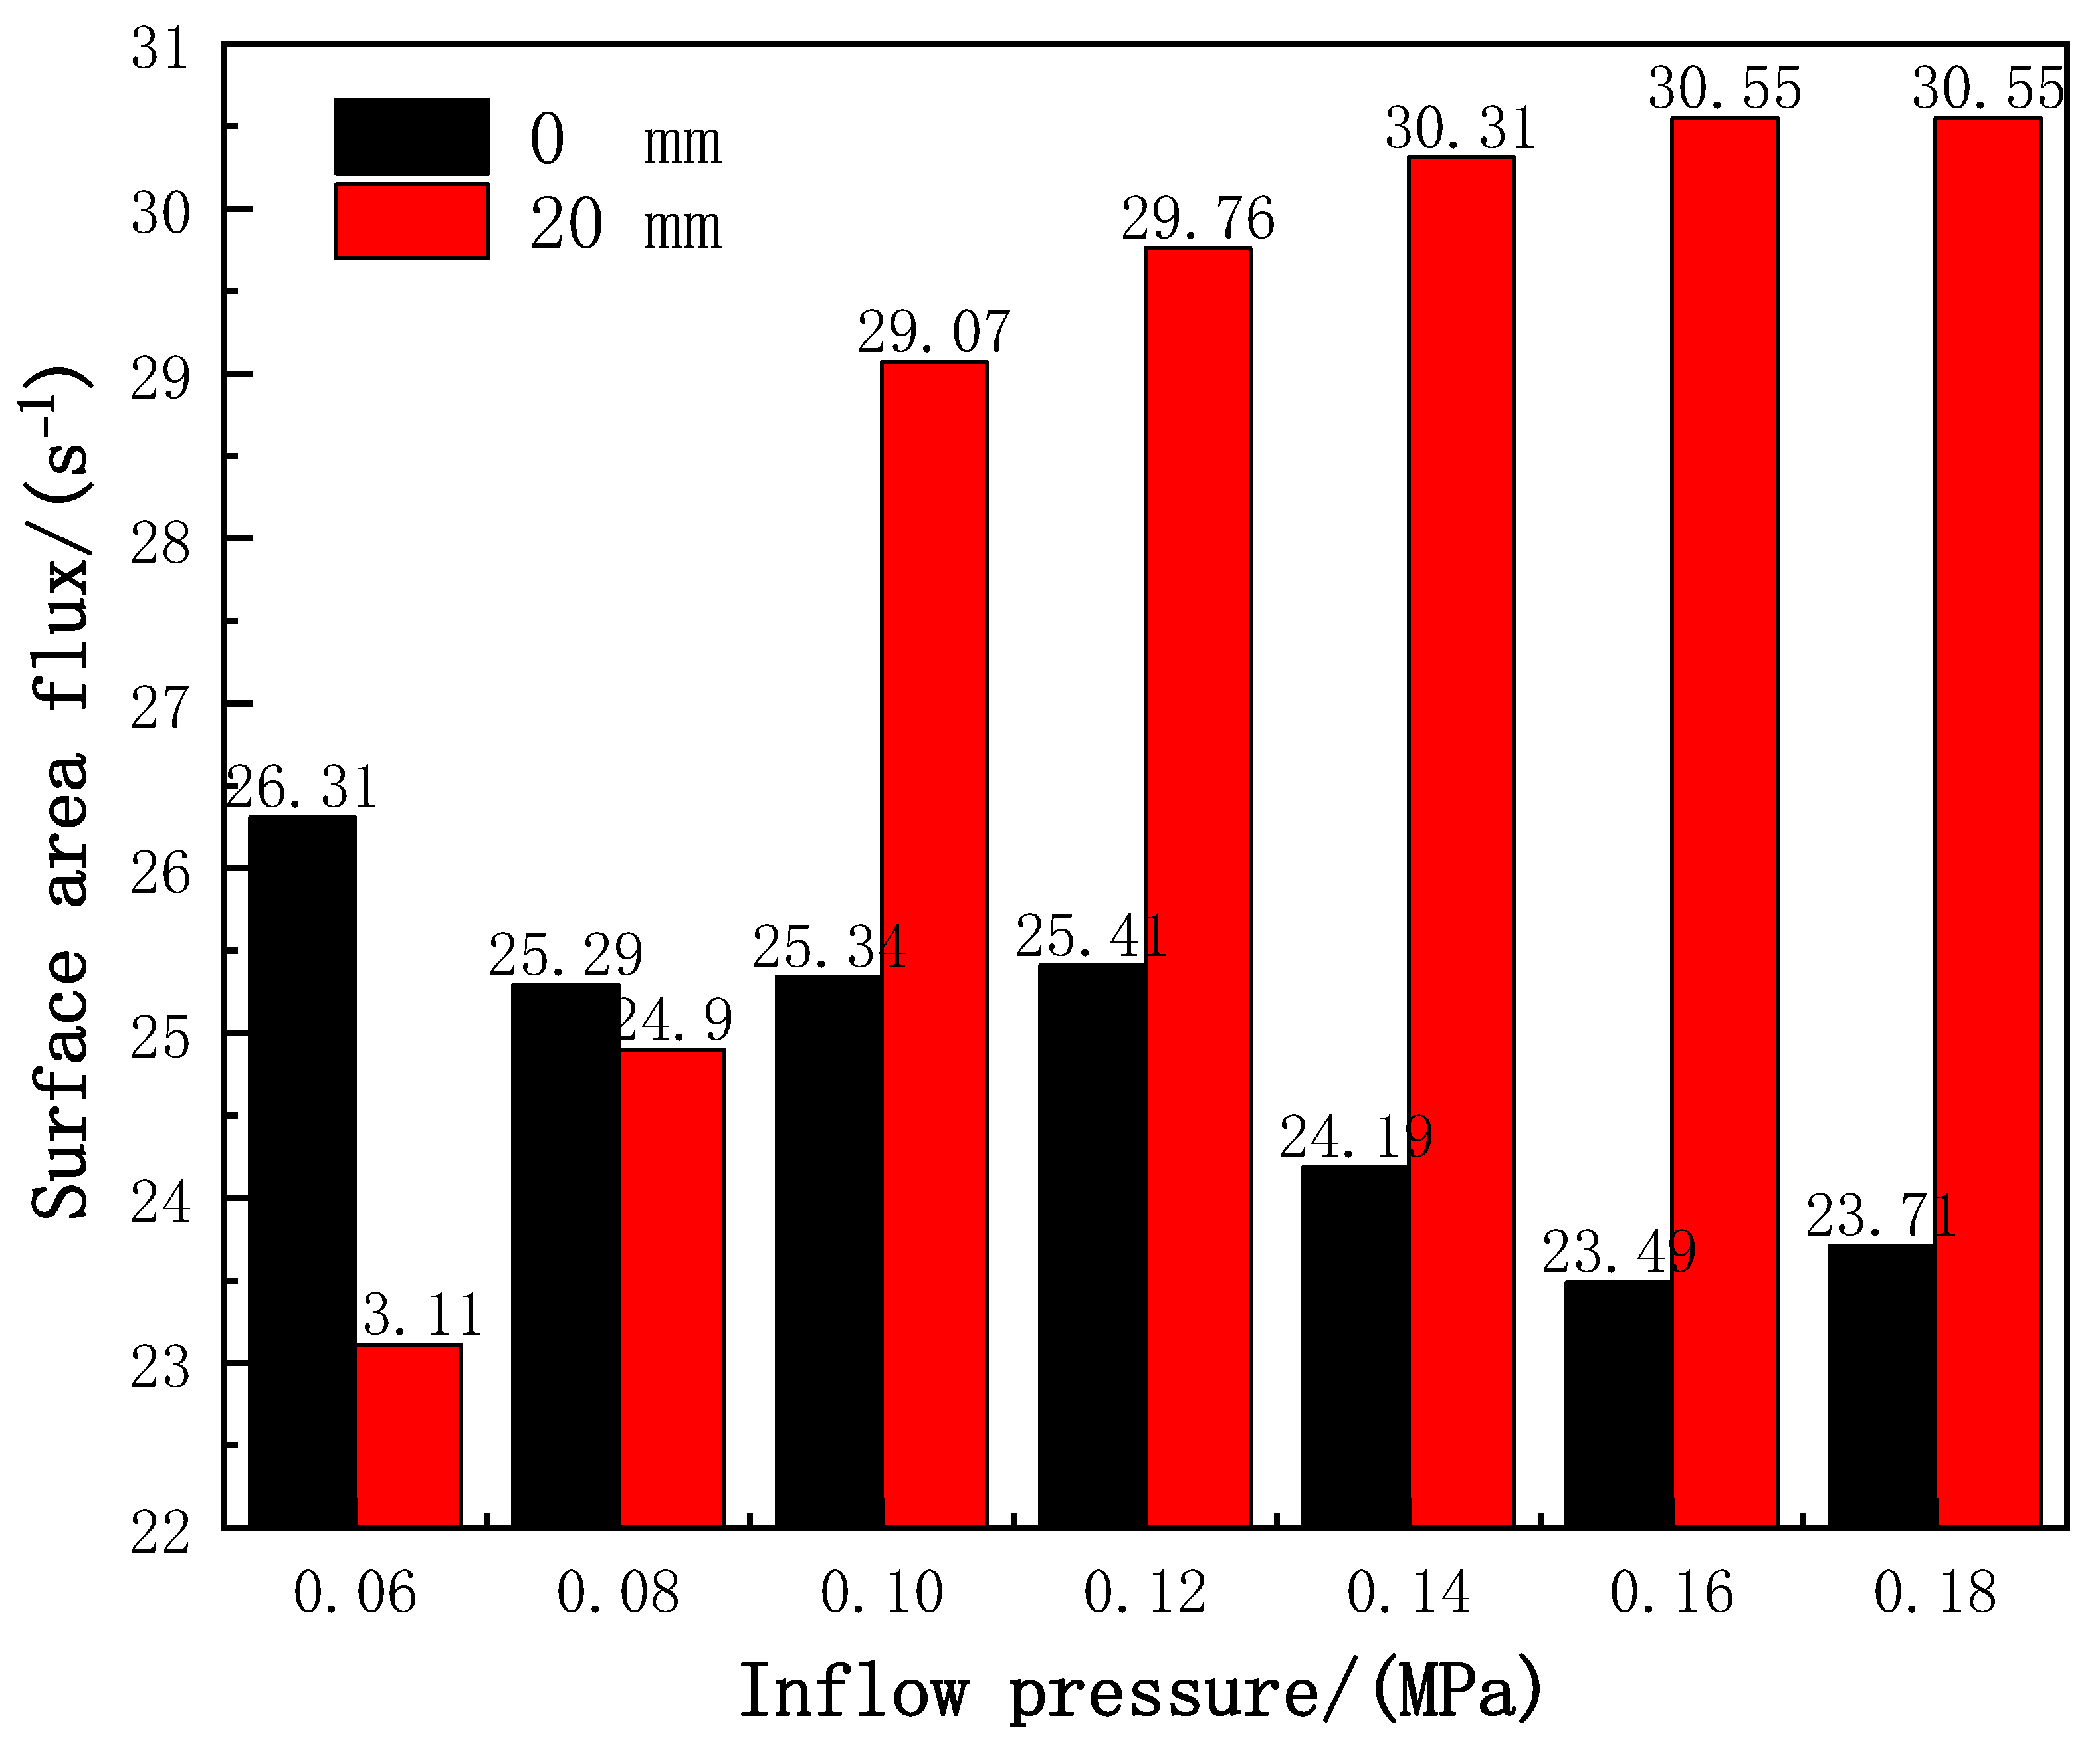
6. Analysis of the Effect of Bubble Surface Area Flux
7. Conclusions
- From the velocity vector diagram of the flow field in the nozzle and the gas-liquid two-phase volume distribution diagram, the following could be seen: the feed stream in the submerged jet state; the core water velocity along the radial direction gradually spread; the closure of the nozzle outlet degree improved; the pressure difference at the junction of mixing zone a and mixing zone b also gradually increased. Furthermore, the suction performance, suction volume, and gas-liquid ratio were boosted.
- The influence on the characteristics of the bubble system was also reflected in the degree of confinement of the inlet flow to the mixing zone. The greater the degree of confinement, the stronger the effect of entrainment and shear action in the mixing zone. Subsequently, the bubble size shrank and the particle size distribution was also more uniform.
- Changing different tube-nozzle distances can effectively alter the suction performance and shear strength of the mixed flow area, and then the movement characteristics of the bubble can be adjusted. With a longer tube-nozzle distance, the nozzle outlet closure was enhanced, the bubble aspect ratio gradually increased, and the bubble rise speed gradually decreased. These aspects were conducive to improving the air content of the slurry. By studying the effect of different tube-nozzle distances on the bubble surface area flux, it can be concluded that a higher degree of closure helped to increase the bubble surface area flux.
Author Contributions
Funding
Institutional Review Board Statement
Informed Consent Statement
Data Availability Statement
Conflicts of Interest
References
- Zhu, H.; Valdivieso, A.L.; Zhu, J.; Song, S.; Min, F.; Arroyo, M.A.C. A study of bubble size evolution in Jameson flotation cell. Chem. Eng. Res. Des. 2018, 137, 461–466. [Google Scholar] [CrossRef]
- Miettinen, T.; Ralston, J.; Fornasiero, D. The limits of fine particle flotation. Miner. Eng. 2010, 23, 420–437. [Google Scholar] [CrossRef]
- Sahoo, S.K.; Suresh, N. Recovery of coal values from the refuse pond coal slurry using flotation. Energy Sources Part A Recover. Util. Environ. Eff. 2018, 40, 1250–1256. [Google Scholar] [CrossRef]
- Yu, Y.; Ma, L.; Cao, M.; Liu, Q. Slime coatings in froth flotation: A review. Miner. Eng. 2017, 114, 26–36. [Google Scholar] [CrossRef]
- Wang, S.; Tao, X. Comparison of flotation performances of low rank coal in air and oily bubble processes. Powder Technol. 2017, 320, 37–42. [Google Scholar] [CrossRef]
- Xing, Y.; Gui, X.; Pan, L.; Pinchasik, B.E.; Cao, Y.; Liu, J.; Kappl, M.; Butt, H.J. Recent experi-mental advances for understanding bubble-particle attachment in flotation. Adv. Colloid. Interfac. 2017, 246, 105–132. [Google Scholar] [CrossRef] [PubMed]
- Vinnett, L.; Contreras, F.; Yianatos, J. Gas dispersion pattern in mechanical flotation cells. Miner. Eng. 2012, 26, 80–85. [Google Scholar] [CrossRef]
- Wang, G.; Ge, L.; Mitra, S.; Evans, G.M.; Joshi, J.; Chen, S. A review of CFD modelling studies on the flotation process. Miner. Eng. 2018, 127, 153–177. [Google Scholar] [CrossRef]
- Schubert, H. On the optimization of hydrodynamics in fine particle flotation. Miner. Eng. 2008, 21, 930–936. [Google Scholar] [CrossRef]
- Zhang, W. Evaluation of effect of viscosity changes on bubble size in a mechanical flotation cell. Trans. Nonferrous Met. Soc. China 2014, 24, 2964–2968. [Google Scholar] [CrossRef]
- Karagüzel, C.; Çobanoğlu, G. Stage-wise flotation for the removal of colored minerals from feld-spathic slimes using laboratory scale Jameson cell. Sep. Purif. Technol. 2010, 74, 100–107. [Google Scholar] [CrossRef]
- Han, Y.; Zhu, J.; Shen, L.; Zhou, W.; Ling, Y.; Yang, X.; Wang, S.; Dong, Q. Bubble Size Distribution Characteristics of a Jet-Stirring Coupling Flotation Device. Minerals 2019, 9, 369. [Google Scholar] [CrossRef] [Green Version]
- Li, H.; Li, R.; Wang, M.; Li, J.; Fu, Y.; Zhu, B. Method for the adsorption of surfactants by lignite in a dry condition using mechanical mixing. Miner. Eng. 2020, 157, 106538. [Google Scholar] [CrossRef]
- Yianatos, J.; Vallejos, P.; Matamoros, C.; Díaz, F. Froth liquid transport in a two-dimensional flotation cell. Miner. Eng. 2018, 122, 227–232. [Google Scholar] [CrossRef]
- Laskowski, J.; Tlhone, T.; Williams, P.; Ding, K. Fundamental properties of the polyoxypropylene alkyl ether flotation frothers. Int. J. Miner. Process. 2003, 72, 289–299. [Google Scholar] [CrossRef]
- Kracht, W.; Rebolledo, H. Study of the local critical coalescence concentration (l-CCC) of alcohols and salts at bubble formation in two-phase systems. Miner. Eng. 2013, 50–51, 77–82. [Google Scholar] [CrossRef]
- Tomiyama, A.; Celata, G.P.; Hosokawa, S.; Yoshida, S. Terminal velocity of single bubbles in surface tension force dominant regime. Int. J. Multiphas. Flow. 2002, 28, 1497–1519. [Google Scholar] [CrossRef]
- Krzan, M.; Zawala, J.; Malysa, K. Development of steady state adsorption distribution over interface of a bubble rising in solutions of n-alkanols (C5, C8) and n-alkyltrimethylammonium bromides (C8, C12, C16). Colloids Surfaces A Physicochem. Eng. Asp. 2007, 298, 42–51. [Google Scholar] [CrossRef]
- Zhu, H.; Valdivieso, A.L.; Zhu, J.; Min, F.; Song, S.; Huang, D.; Shao, S. Effect of dodecylamine-frother blend on bubble rising characteristics. Powder.Technol. 2018, 338, 586–590. [Google Scholar] [CrossRef]
- Yang, Y.; Karvounis, N.; Walther, J.H.; Ding, H.; Wen, C. Effect of area ratio of the primary nozzle on steam ejector performance considering nonequilibrium condensations. Energy 2021, 237, 121483. [Google Scholar] [CrossRef]
- Dafsari, R.A.; Yu, S.; Choi, Y.; Lee, J. Effect of geometrical parameters of air-induction nozzles on droplet characteristics and behaviour. Biosyst. Eng. 2021, 209, 14–29. [Google Scholar] [CrossRef]
- Bodys, J.; Smolka, J.; Palacz, M.; Haida, M.; Banasiak, K.; Nowak, A.J. Experimental and numerical study on the R744 ejector with a suction nozzle bypass. Appl. Therm. Eng. 2021, 194, 117015. [Google Scholar] [CrossRef]
- Bodys, J.; Smolka, J.; Banasiak, K.; Palacz, M.; Haida, M.; Nowak, A.J. Performance improvement of the R744 two-phase ejector with an implemented suction nozzle bypass. Int. J. Refrig. 2018, 90, 216–228. [Google Scholar] [CrossRef] [Green Version]
- Hu, L.; Xu, H.; Li, M.; Liu, W.; Chen, W.; Xie, H.; Fu, X. Liquid jet formation during a suspended liquid suction process. Exp. Therm. Fluid Sci. 2020, 114, 109952. [Google Scholar] [CrossRef]
- Vanierschot, M.; Persoons, T.; Van den Bulck, E. A new method for annular jet control based on cross-flow injection. Phys. Fluids 2009, 21, 025103. [Google Scholar] [CrossRef]
- Trávníček, Z.; Tesař, V.; Broučková, Z.; Peszynski, K. Annular Impinging Jet Controlled by Radial Synthetic Jets. Heat Transf. Eng. 2014, 35, 1450–1461. [Google Scholar] [CrossRef]
- Gordiychuk, A.; Svanera, M.; Benini, S.; Poesio, P. Size distribution and Sauter mean diameter of micro bubbles for a Venturi type bubble generator. Exp. Therm. Fluid Sci. 2016, 70, 51–60. [Google Scholar] [CrossRef]
- Sriveerakul, T.; Aphornratana, S.; Chunnanond, K. Performance prediction of steam ejector using computational fluid dynamics: Part Validation of the CFD results. Int. J. Therm. Sci. 2007, 46, 812–822. [Google Scholar] [CrossRef]
- Zheng, H.; Su, Y.; Zheng, L.; Ke, H. Numerical simulation of CO2 and dye separation for supercritical fluid in separator. Sep. Purif. Technol. 2020, 236, 116246. [Google Scholar] [CrossRef]
- Akhlaghi, M.; Mohammadi, V.; Nouri, N.M.; Taherkhani, M.; Karimi, M. Multi-Fluid VoF model assessment to simulate the horizontal air–water intermittent flow. Chem. Eng. Res. Des. 2019, 152, 48–59. [Google Scholar] [CrossRef]
- Chen, J.; Orozovic, O.; Williams, K.; Meng, J.; Li, C. A coupled DEM-SPH model for moisture migration in unsaturated granular material under oscillation. Int. J. Mech. Sci. 2020, 169, 105313. [Google Scholar] [CrossRef]
- Chen, J.; Wang, P.; Li, M.; Shen, J.; Howes, T.; Wang, G. Rupture distance and shape of the liquid bridge with rough surface. Miner. Eng. 2021, 167, 106888. [Google Scholar] [CrossRef]
- Sarhan, A.; Naser, J.; Brooks, G. CFD model simulation of bubble surface area flux in flotation column reactor in presence of minerals. Int. J. Min. Sci. Technol. 2018, 28, 999–1007. [Google Scholar] [CrossRef]


| 0.10 MPa (EXP) | 0.10 MPa (CFD) | |||||||||
|---|---|---|---|---|---|---|---|---|---|---|
| 0 | 3 | 7 | 15 | 20 | 0 | 3 | 7 | 15 | 20 | |
| Qg (m3/h) | 0.063 | 0.094 | 0.118 | 0.171 | 0.173 | 0.060 | 0.090 | 0.110 | 0.162 | 0.170 |
| Ql (m3/h) | 0.422 | 0.541 | 0.543 | 0.557 | 0.559 | 0.421 | 0.542 | 0.544 | 0.553 | 0.561 |
| q | 0.149 | 0.174 | 0.217 | 0.307 | 0.309 | 0.143 | 0.166 | 0.202 | 0.293 | 0.303 |
Publisher’s Note: MDPI stays neutral with regard to jurisdictional claims in published maps and institutional affiliations. |
© 2021 by the authors. Licensee MDPI, Basel, Switzerland. This article is an open access article distributed under the terms and conditions of the Creative Commons Attribution (CC BY) license (https://creativecommons.org/licenses/by/4.0/).
Share and Cite
Wang, C.; Wang, C.; Yu, A.; Zheng, M.; Khan, M.S. Effect of Closure Characteristics of Annular Jet Mixed Zone on Inspiratory Performance and Bubble System. Processes 2021, 9, 1392. https://doi.org/10.3390/pr9081392
Wang C, Wang C, Yu A, Zheng M, Khan MS. Effect of Closure Characteristics of Annular Jet Mixed Zone on Inspiratory Performance and Bubble System. Processes. 2021; 9(8):1392. https://doi.org/10.3390/pr9081392
Chicago/Turabian StyleWang, Chao, Chuanzhen Wang, Anghong Yu, Mingdong Zheng, and Md. Shakhaoath Khan. 2021. "Effect of Closure Characteristics of Annular Jet Mixed Zone on Inspiratory Performance and Bubble System" Processes 9, no. 8: 1392. https://doi.org/10.3390/pr9081392
APA StyleWang, C., Wang, C., Yu, A., Zheng, M., & Khan, M. S. (2021). Effect of Closure Characteristics of Annular Jet Mixed Zone on Inspiratory Performance and Bubble System. Processes, 9(8), 1392. https://doi.org/10.3390/pr9081392