Article

Evaluation of the Performance of Mining Processes after the Strategic Innovation for Sustainable Development

Institute of Earth Resources, Technical University of Košice, 04200 Košice, Slovakia
*
Author to whom correspondence should be addressed.
Processes 2021, 9(8), 1374; https://doi.org/10.3390/pr9081374
Submission received: 24 May 2021 / Revised: 13 July 2021 / Accepted: 4 August 2021 / Published: 6 August 2021
(This article belongs to the Special Issue Sustainable Development Processes for Renewable Energy Technology)

Abstract

:
The article summarizes the arguments within the scientific discussion about performance management in mining companies and their significance for obtaining competitiveness in the market of mining companies in the direction of sustainable development and economic growth. The main goal of the paper is to evaluate the performance indicators of mining processes after the implementation of strategic innovation—a new layout of the mining area focused on a combination of stationary and mobile mining equipment and their influence on the environment in a selected mining company in Slovakia in area of mining of limestone. Methods of research were focused on using economic indicators for the valuation of the efficiency and functionality of the mining processes. We used Pareto analysis for evaluation that points to critical mining processes and their significance in the financial area with orientation to costs, revenues. This research was used economic analysis with direction to efficiency, an indicator of cost and profit. Those indicators create a base for effective business in the mining area. The research empirically confirms that the new innovation of layout of mining place brings improvement of mining processes and indicators point to effective (over limit 0.70) and functional (over limit 0.90) mining processes in the year 2020. Pareto analysis showed the best processes (mining, expedition, transport, sorting) for financial benefits, the volume of production, demand, the satisfaction of customers, the cover needs of industries but at the same they are processes with high costs. Strategic innovation brought improvement too in the area of the environment. The results of the research can be useful for other mining companies in performance management and achievement mining market position.

Graphical Abstract

1. Introduction

Management of mining processes and monitoring of their performance is a basic prerequisite for continual improvement, elimination of waste, the introduction of innovations in mining, gaining competitive advantages, and application in the competitive environment of the mining industry by the view of sustainable development and economic growth. Jiskani et al. (2020) support the argument that improving the competitiveness of the mining industry aids in the promotion of its sustainable development by the SWOT analysis for the mining industry. Jiskani et al. (2021) [1] comment that the performance indicators are evaluated in smart mining, but it is important to the importance of performance indicators framework should be highlighted. Cehlár et al. (2019) [2] stated that the new mining machines mean improving mining operations, more efficiently boosting productivity and employee safety, and opportunities for future use of earth resources and new technologies in the mining industry [3]. Optimization of the mining area and its layout means competitiveness in the market of mining industries (quality management). Jiskani et al. (2020) described the importance of mine optimization, safety, and green mining strategy as an essential pathway to achieving sustainable mining. The role of mining safety and green mining for sustainable mining is the base idea for future mining [4]. Krupnik et al. (2020) stated that process and operation management and mining process improvement represent an approach that enables to ensure the maximum performance of mining processes, to fill in the strategic goals of the mining companies, and to ensure the competitiveness on the mining industry market [5]. Sutoová et al. (2018) stated that the achievement of the performance in mining processes means focusing on innovation, developing knowledge, improving internal processes, eliminating waste, minimizing costs, improving technology, and using production factors effectively [6]. Zhou et al. (2020) stated the concept of green mining is to improve the mining industry in a holistic way so that it is safe, efficient, and environmentally sustainable. They created an evaluation index system of green surface mining based on the theory of green grades. The evaluation model is comprised of three attributes (safety, efficiency, and environment), nine criteria, and 35 indicators [7]. Chen et al. (2020) presented the idea of green mining was proposed as a practical approach to making the mining industry more sustainable than before. Green mining is a contemporary mining model centered on the sustainability of resources, environment, and socio-economic benefits. Its purpose is to develop and apply technologies and processes that increase environmental performance, while maintaining competitiveness throughout the entire mining cycle from exploration to post-closure [
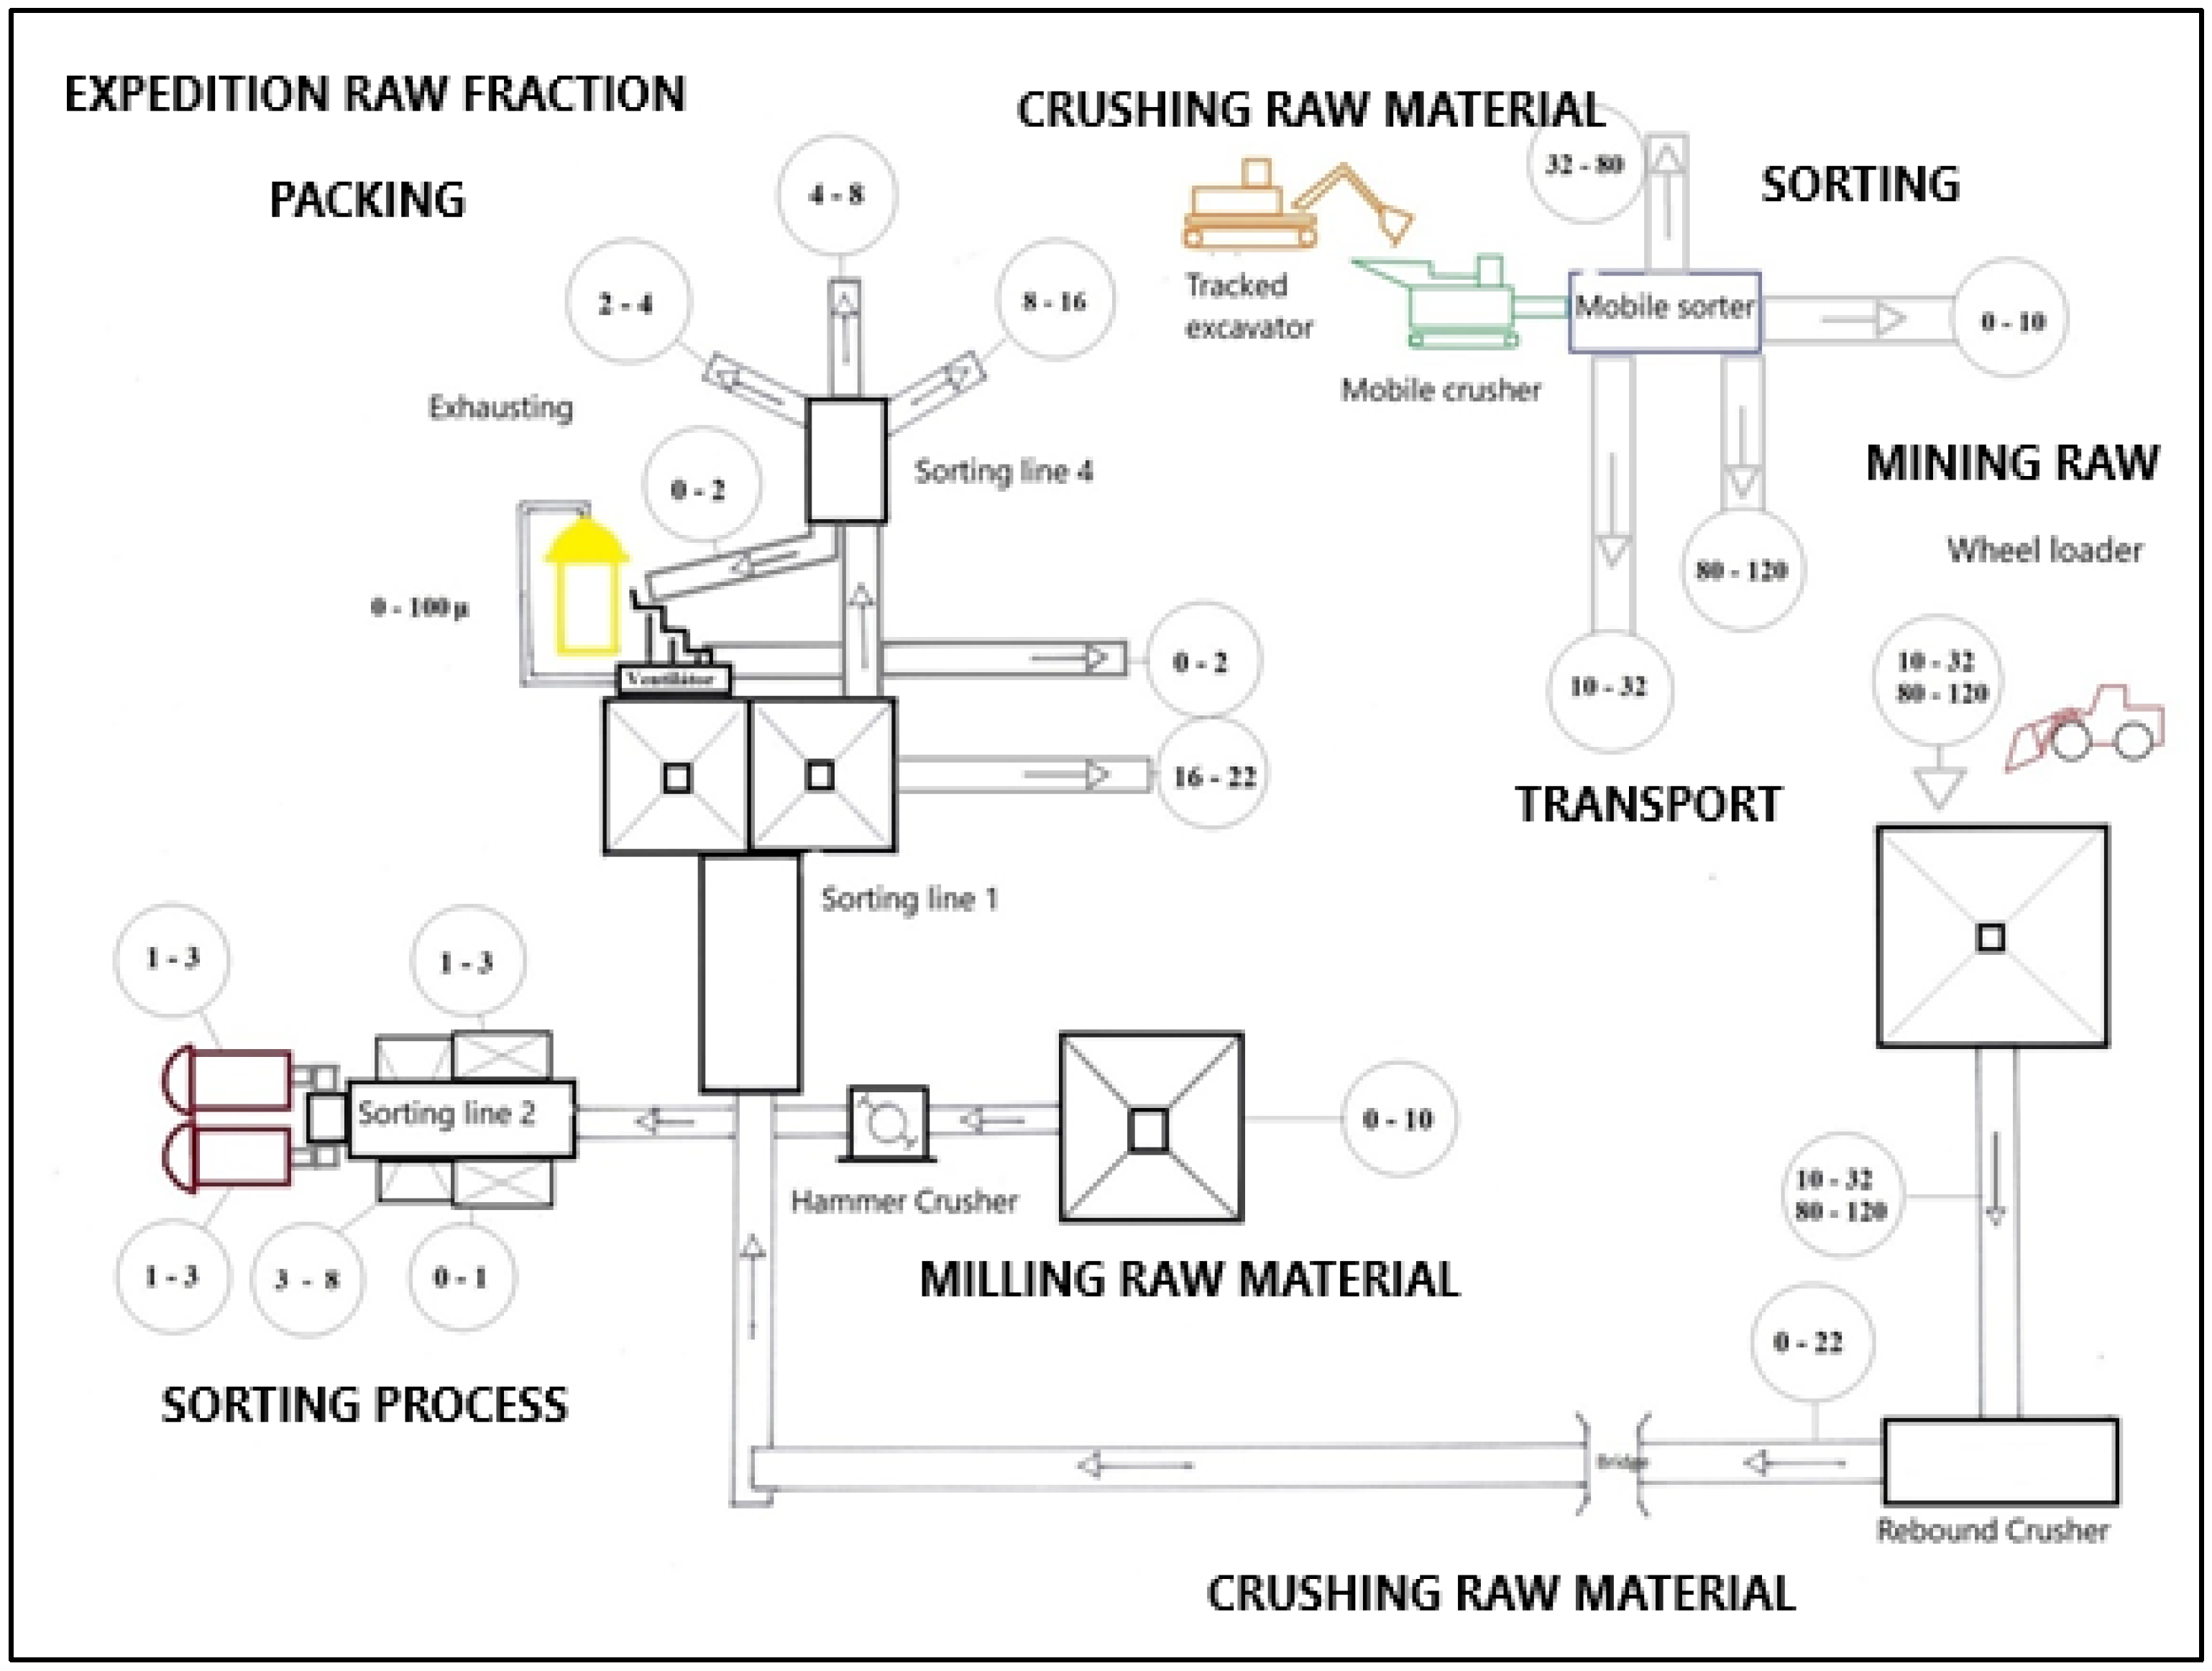
8]. The main goal of the paper was to evaluate the performance indicators of mining processes after the implementation of strategic innovation—a new layout of the mining area focused on a combination of stationary and mobile mining equipment. Mining processes relate to negative environmental impacts (environmental management) and high energy consumption (energy management). Mirmozaffari et al. (2020) stated that it is important continually to evaluate ecological efficiency affected by CO2 consumption that is one part of the performance of mining processes [9]. Negative impacts of mining processes to the adjacent territories create a base for evaluation. The contamination of territories is developed by active seepage of liquid waste of mining (waste management). Menshikova et al. (2020) commented particularly important is to evaluate water balance in the mining processes and a significant amount of wastewater (water management). The results of performance indicators are to substantiate the need to manage the seepage discharge process by means of enclosing dams to ensure environmentally safe operation of the tailings dump [
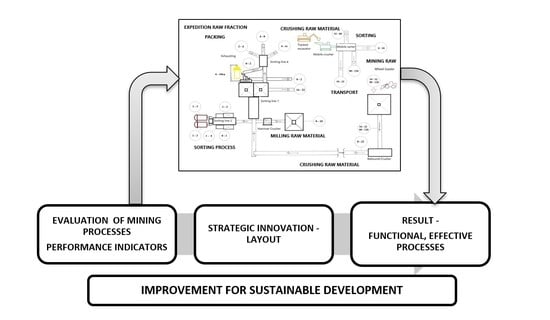
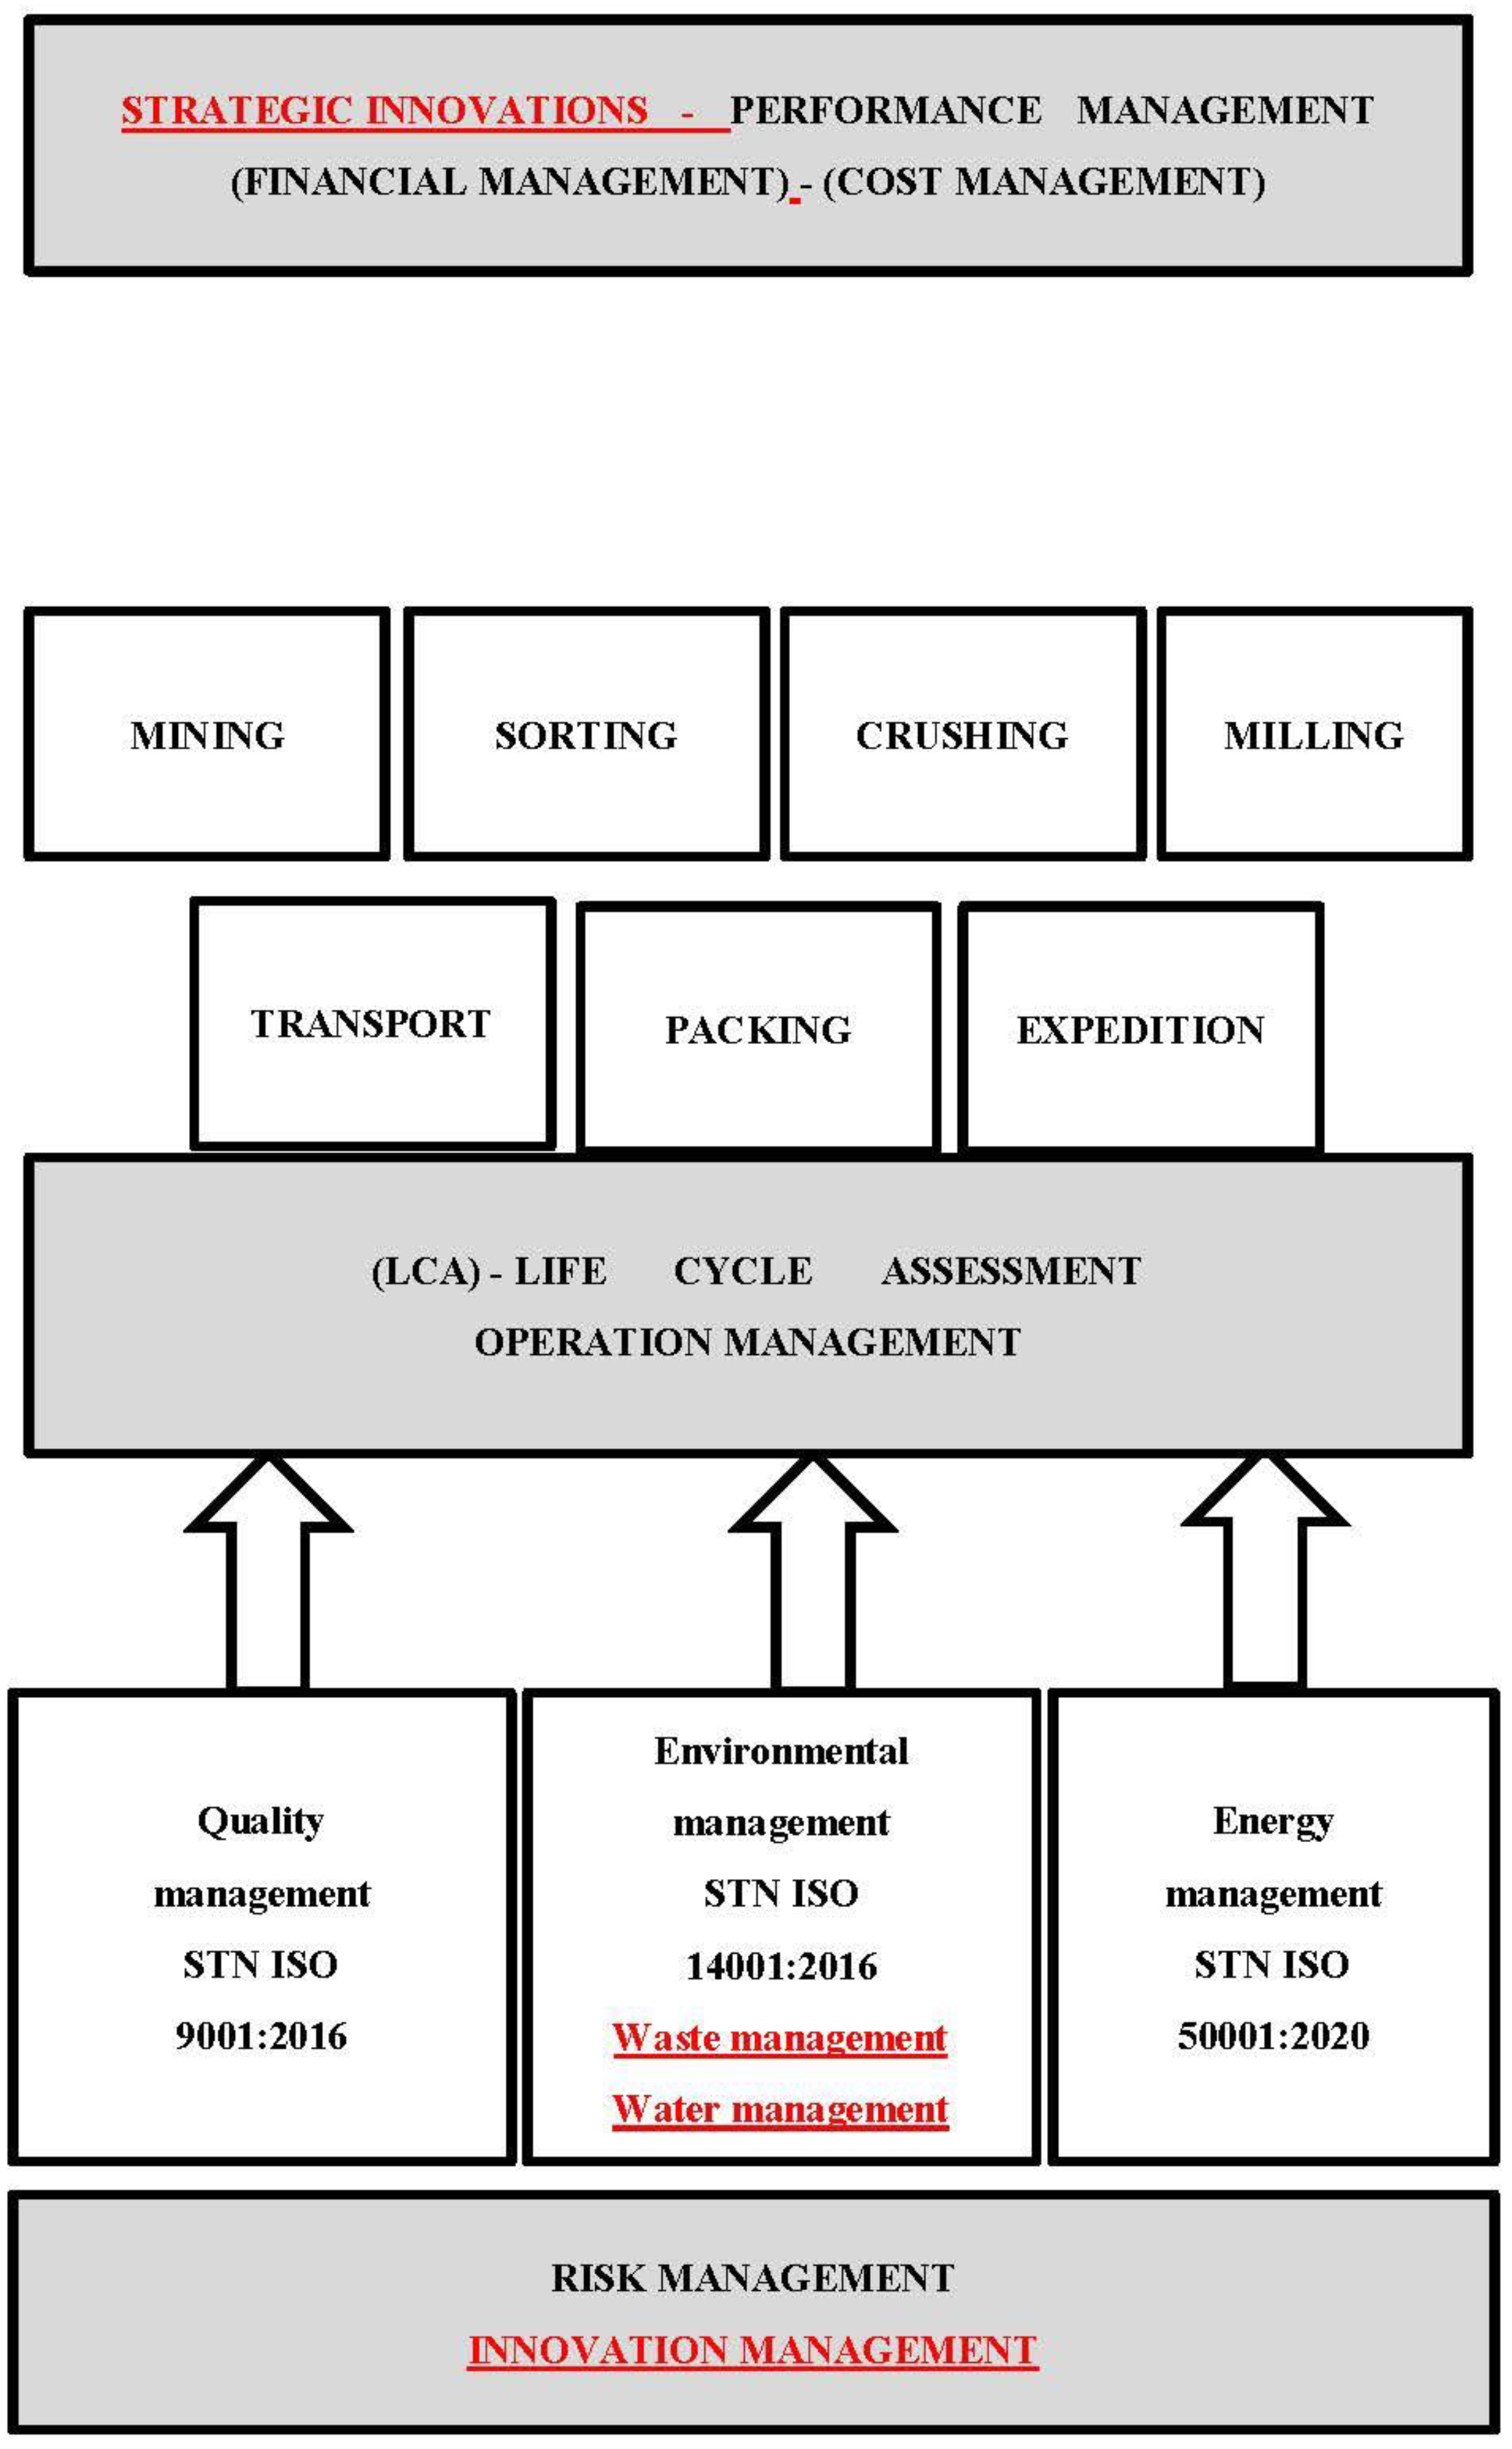
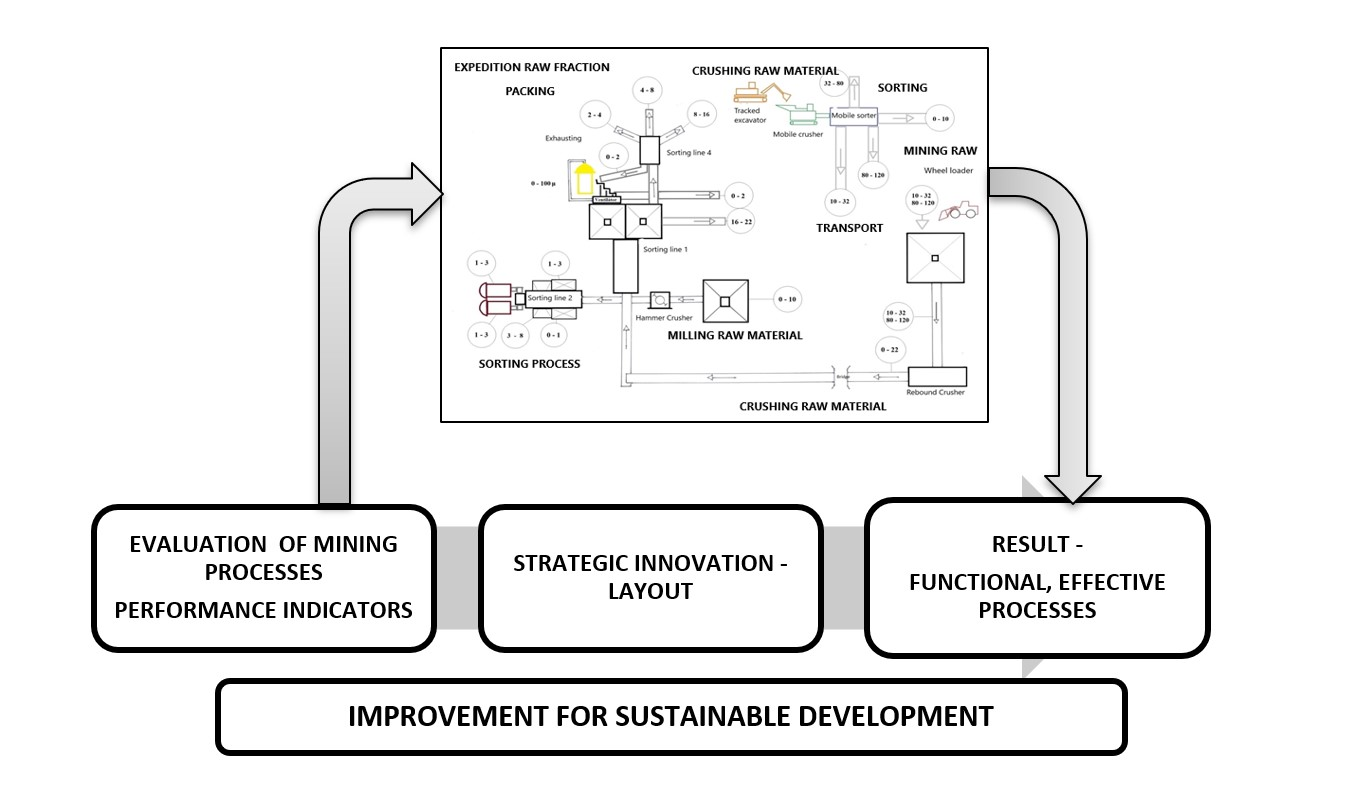
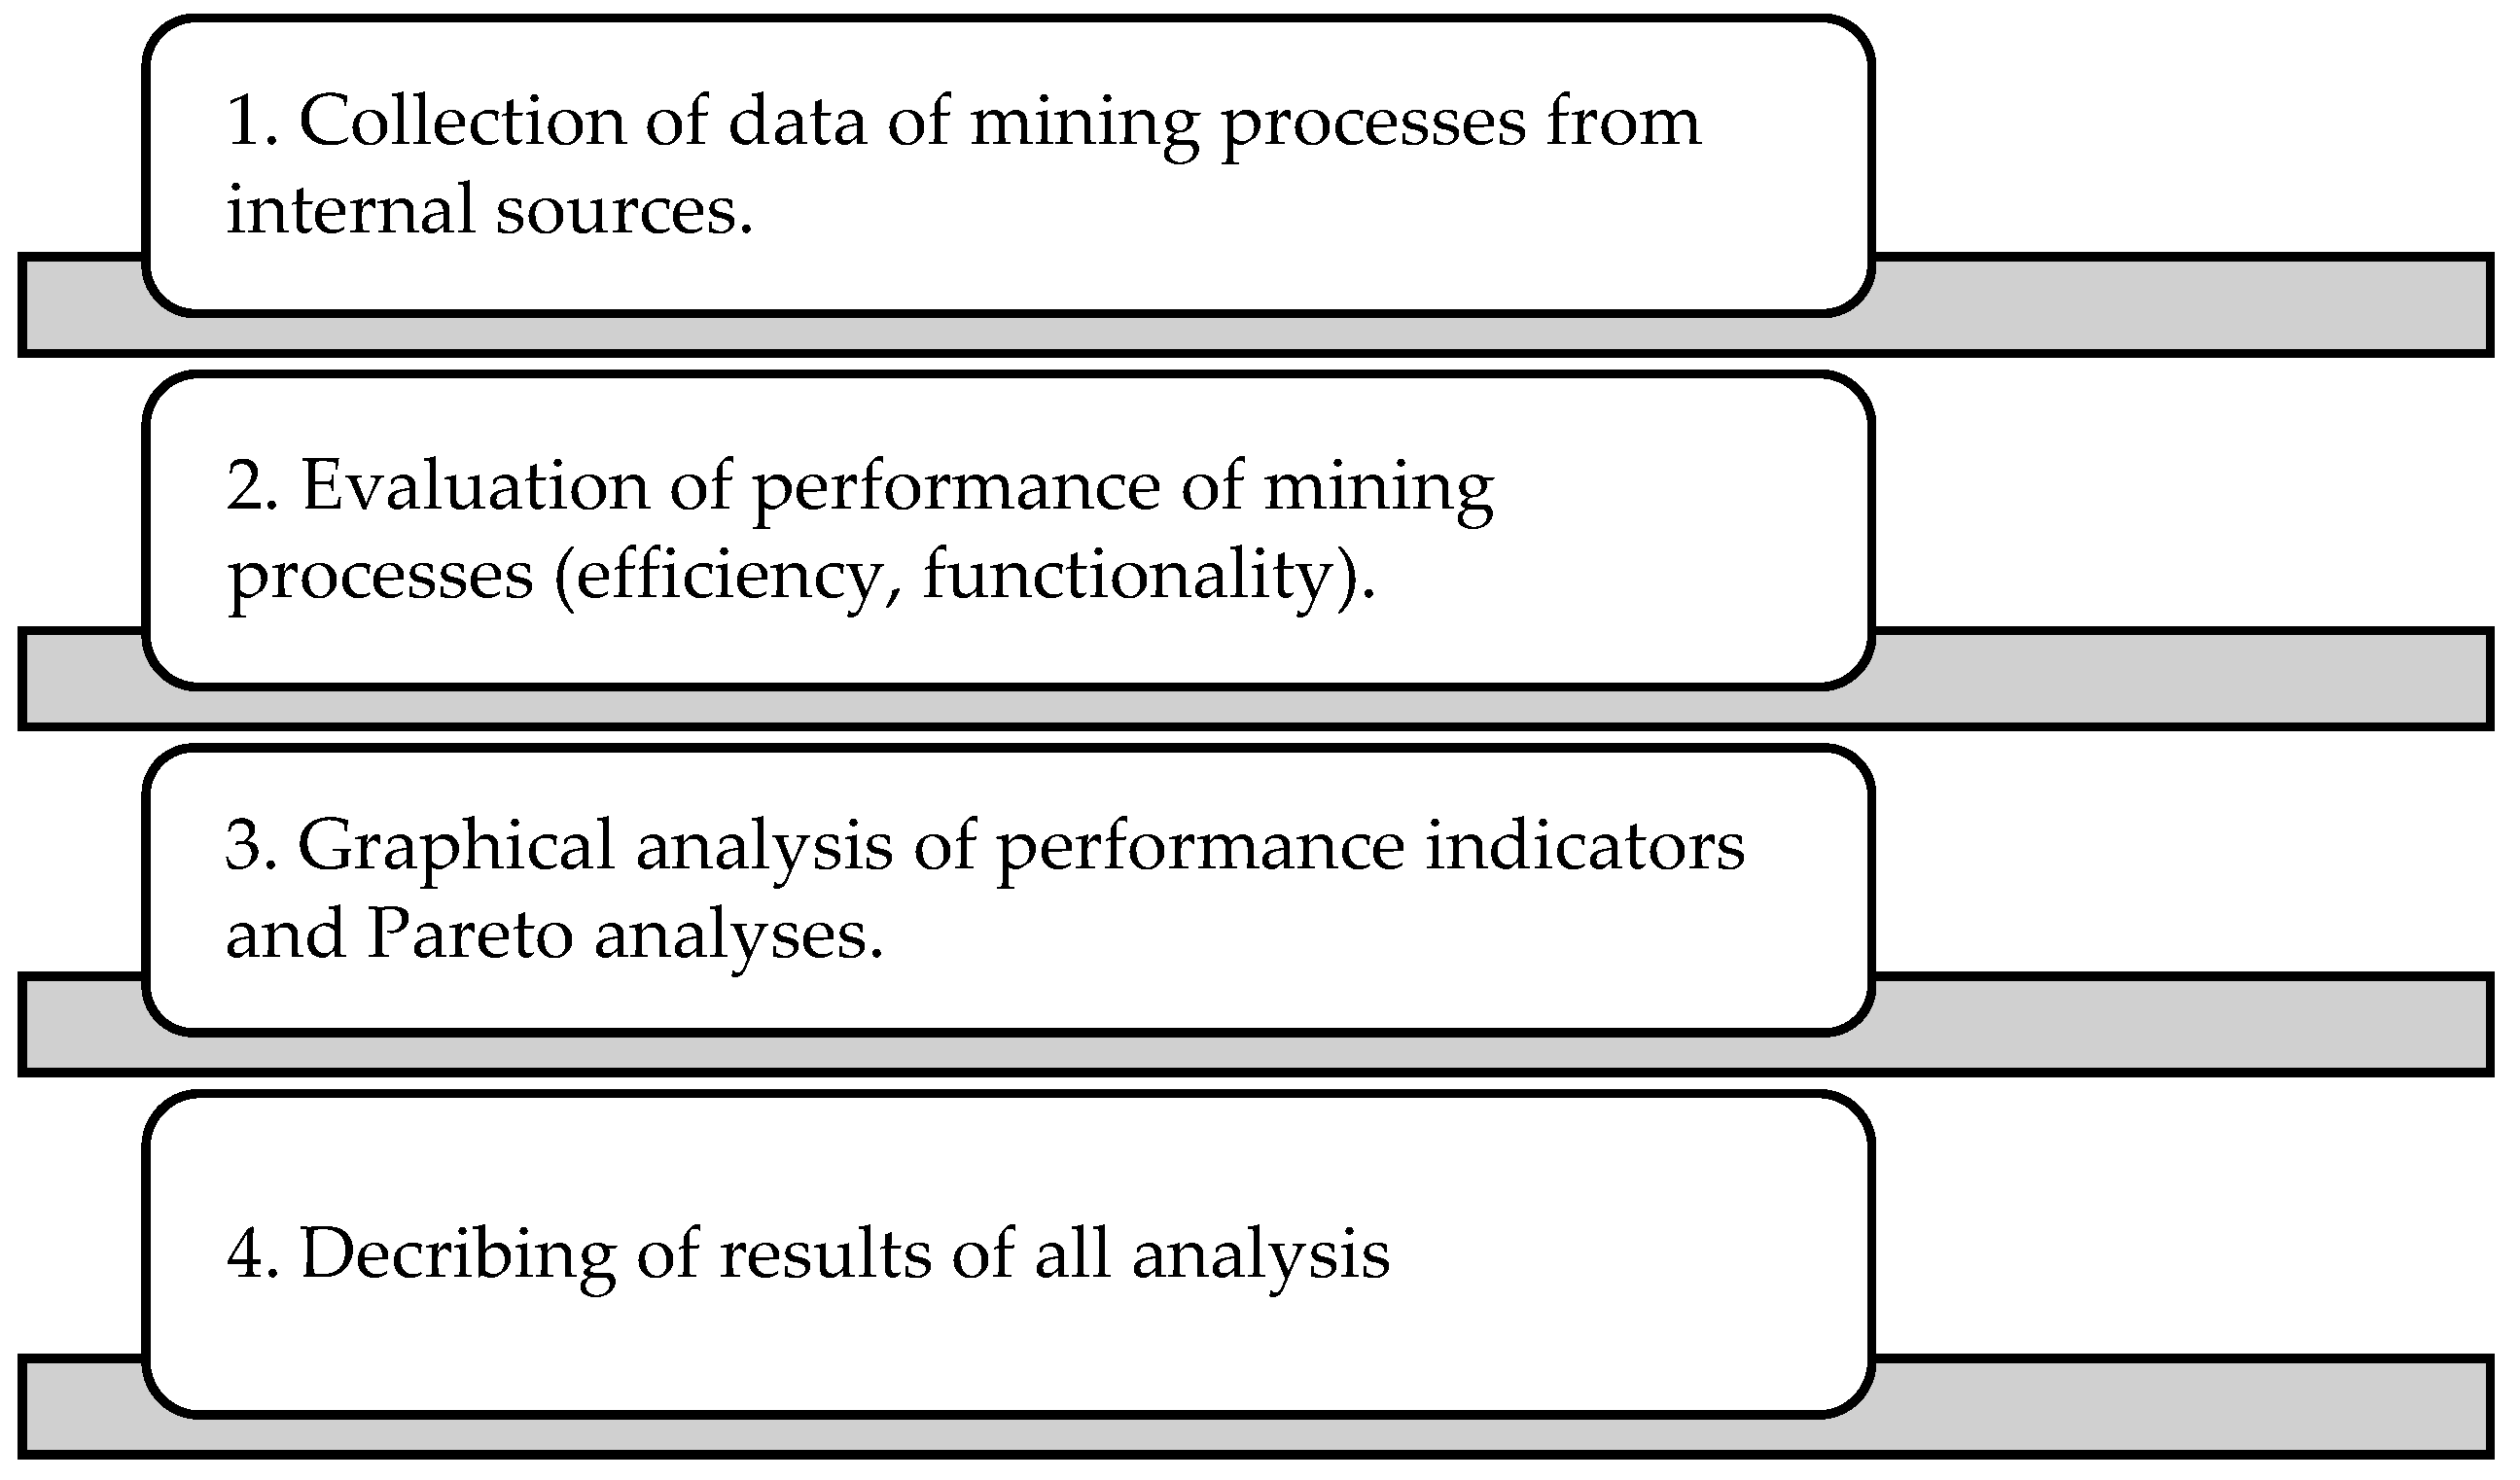
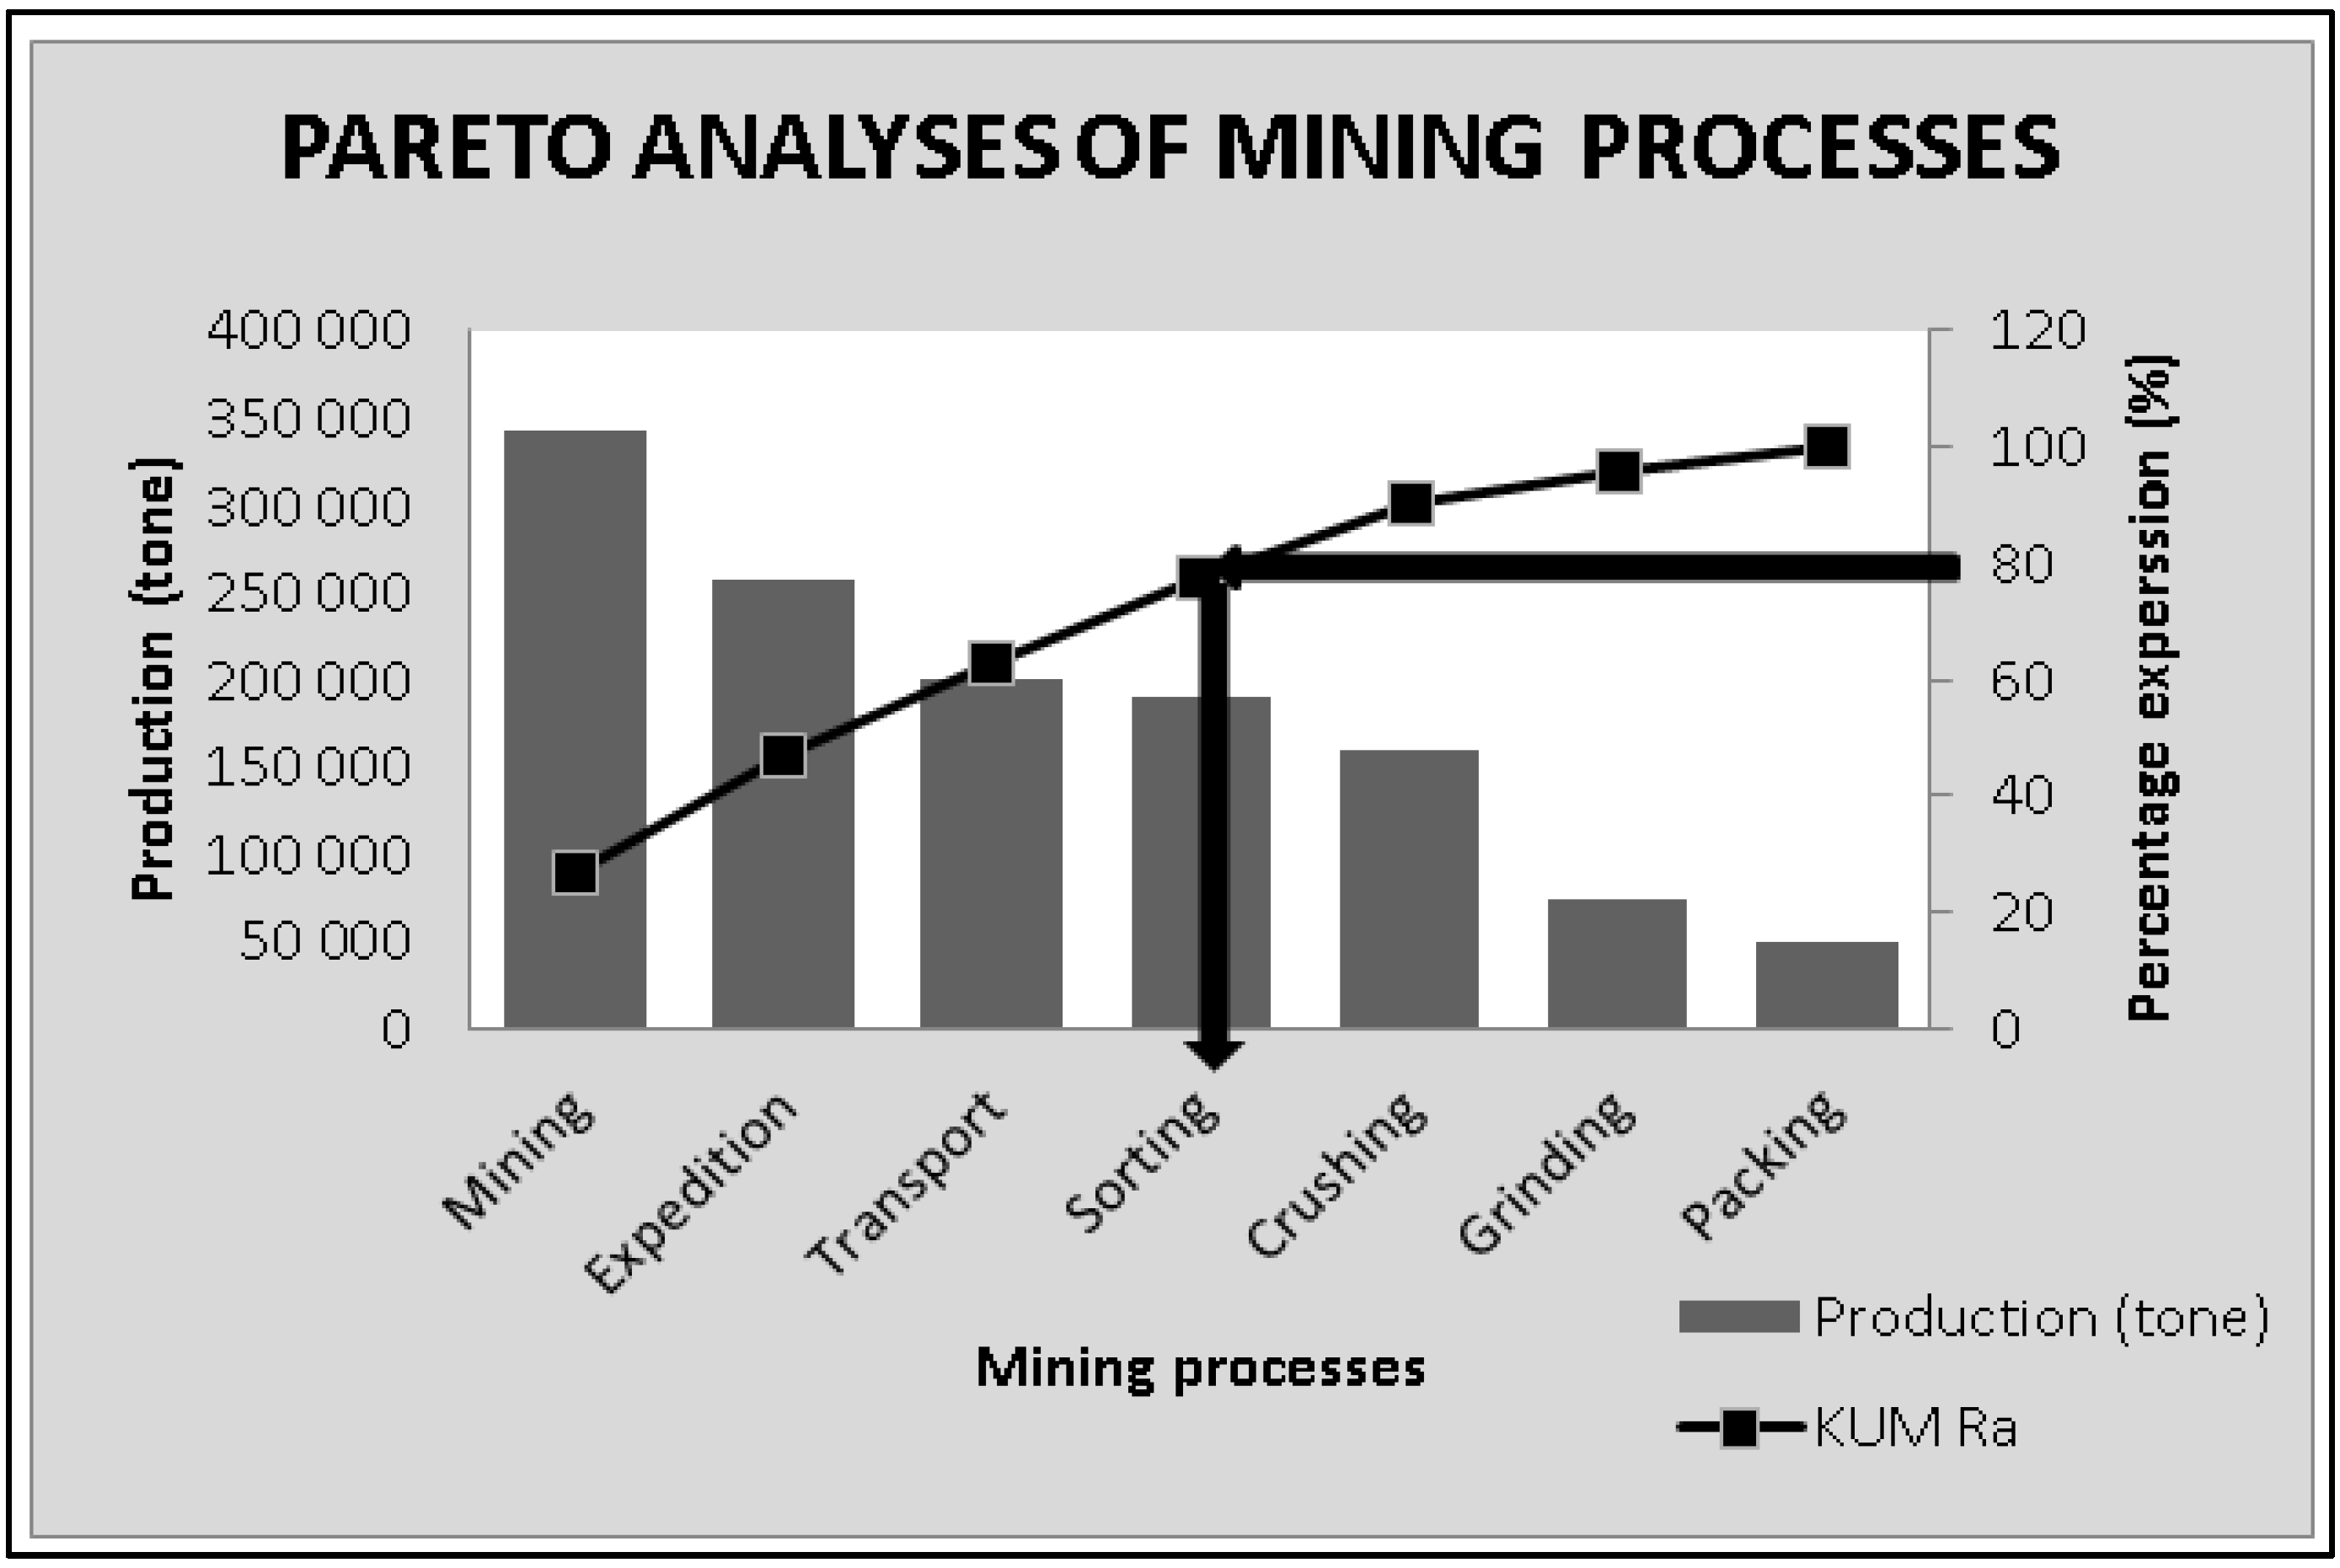
10]. The growing availability of information and data analysis capabilities provides new opportunities for improving the performance of mining operations. By using real-time measurements and artificial intelligence, it is possible to respond faster to changing conditions, while accurate and timely information permits rapid evaluation of changes and fast business improvement decisions (operation management). The base of the blueprint is a performance framework (Figure 1) with a system of key performance indicators for mining control.
The synergy of all various forms of management creates the base of improvement in mining companies. Visser et al. (2020) commented that the introduction of the blueprint for operations management enables mines to leverage the developments in information and analysis capabilities to improve the performance of operations and prevention of risks (risk management) [11]. An important part of performance evaluation in mining companies is effective risk management in mining. Jiskani et al. (2020) stated that the significance of risk identification, risk analysis, and risk management for sustainable development in the mining industry must be highlighted. Sustainability has always been a core concern in the mining industry because the exploitation of mineral resources poses adverse impacts on the environment and society. As a result, the industry is seeking spectacular progress to foster sustainable mining practices that can enable it to be financially viable, environmentally friendly, and socially responsible. Since mining is inevitably endemic with risks, risk assessment could enable the industry to deal with the risks that have significant impacts on its sustainable development [12]. Risk needs to be properly identified before it may be estimated and later responded to adequately. Tworek et al. (2018) stated that prerequisite is an effective system of risk management in mining [13]. One part of risk management in the mining area is the health and safety management system. Health risk management depends on mining technologies, mining areas, and mining processes (Risk management) [14]. The best important part of management is financial and cost management in mining companies. Typical responses by mining companies are to cut costs or increase production what is presented as financial indicators—profit, revenues, and costs. Hall et al. (2003) stated that economic risk is important to know in mining companies. Most mineral deposits respond to increased production rates. Many mine failures can be prevented by a close examination of the tonnage grade curve and an understanding of how margins, net cash flows, and resulting business risk change with cut-off grades and rates of production. The synergy effect of cost and financial management is a base for improvement in mining companies [15]. The economic situation of mining companies entails a strategic approach to cost reduction planning. The slowdown of the economy forces the business sector to restructure and reduction of cost, proceeding to rationalization processes which leads to optimization of mining processes, increasing of machine utilization, the use of materials, and people. Domaracká et al. (2013) commented that for the right decision-making it is necessary to have information about the financial situation and about critical areas in the mining process during risk management [16]. Puzder et al. (2017) commented that one of the risks in mining companies is an economic indicator—cost ratio. The cost ratio indicator is the fundamental performance indicator of the mining companies and it is important to create a cost model for its evaluation orientated to minimize mining costs [17]. The next problem for evaluation of the performance of mining is sustainable development and is it attracting new investment. Solving it requires access to international capital markets and preparing financial statements with international requirements based on the data generated by the accounting system. Tyuleneneva (2017) stated that the framework of international financial reporting standards is important to base for new investment in mining companies [18]. Evaluation of the performance of mining must be introduced through the life cycle assessment (LCA). The mining industry is a potential field where sustainability and LCA can be implemented due to intense energy requirements and equipment utilization [19]. LCA is beginning with the mining process. The rationalization of the transportation of raw material in a mining company creates a base for other processes for example sorting, milling, and crushing. The application of generally applicable logistics principles may result in the increased efficiency of the transportation process. The main input of the rationalization proposal is the analysis of technical parameters of belt conveyors and following their optimization [20]. All mining processes would have to be managed effectively. Strategic development in mining companies is orientated to vertical integration. It means using outsourcing for the specific needs of the basic mining company during the IPO chain. The integration process may concern mining, processing, or mining–processing–metallurgical operations [21]. Bye (2007) stated that in the frame of strategic development is important to evaluate mining areas not only for grade and tonnage predictions but also for predictions of rock mass quality. The development of 3D multi-parametric models facilitates the provision of resource information well in advance of the mining. This information can be used for overall mine planning and evaluation, costing, mining optimization, and slope design. This allows the full range of mining activities to be interconnected, thereby lowering costs and improving efficiencies [22]. Mining companies using simulation modeling as an integral component in their development to determine which combination of infra-structure options, operating performance, and operating rules best achieve the goals of the mining process [23]. Except for simulation, models are used, namely, the technical–economic model for calculating a suitable mining method with accepted technical and economic factors [24]. The conventional discontinuity survey process in the mining industry to be a time-consuming one and it is technically challenging due to the limited accessibility of fresh rock exposures. A rapid and robust rock mass property quantification system is desirable for rock structure design during mining operations. An image-based and fully automatic rock mass geological strength index (GSI) rating system is used in praxis. The GSI system includes both structure rating (SR) and joint condition digital imaging (JCDI) to represent the bulk rock and discontinuity surface conditions of the rock mass [25]. Information management is today part of mining processes. The raw material policy is focused on the performance of all mining processes. Performance indicators of mining processes show to efficiency and functionality of mining processes. In developed countries, support tools for process optimization are increasingly used, which ultimately affects the quality of the final product [
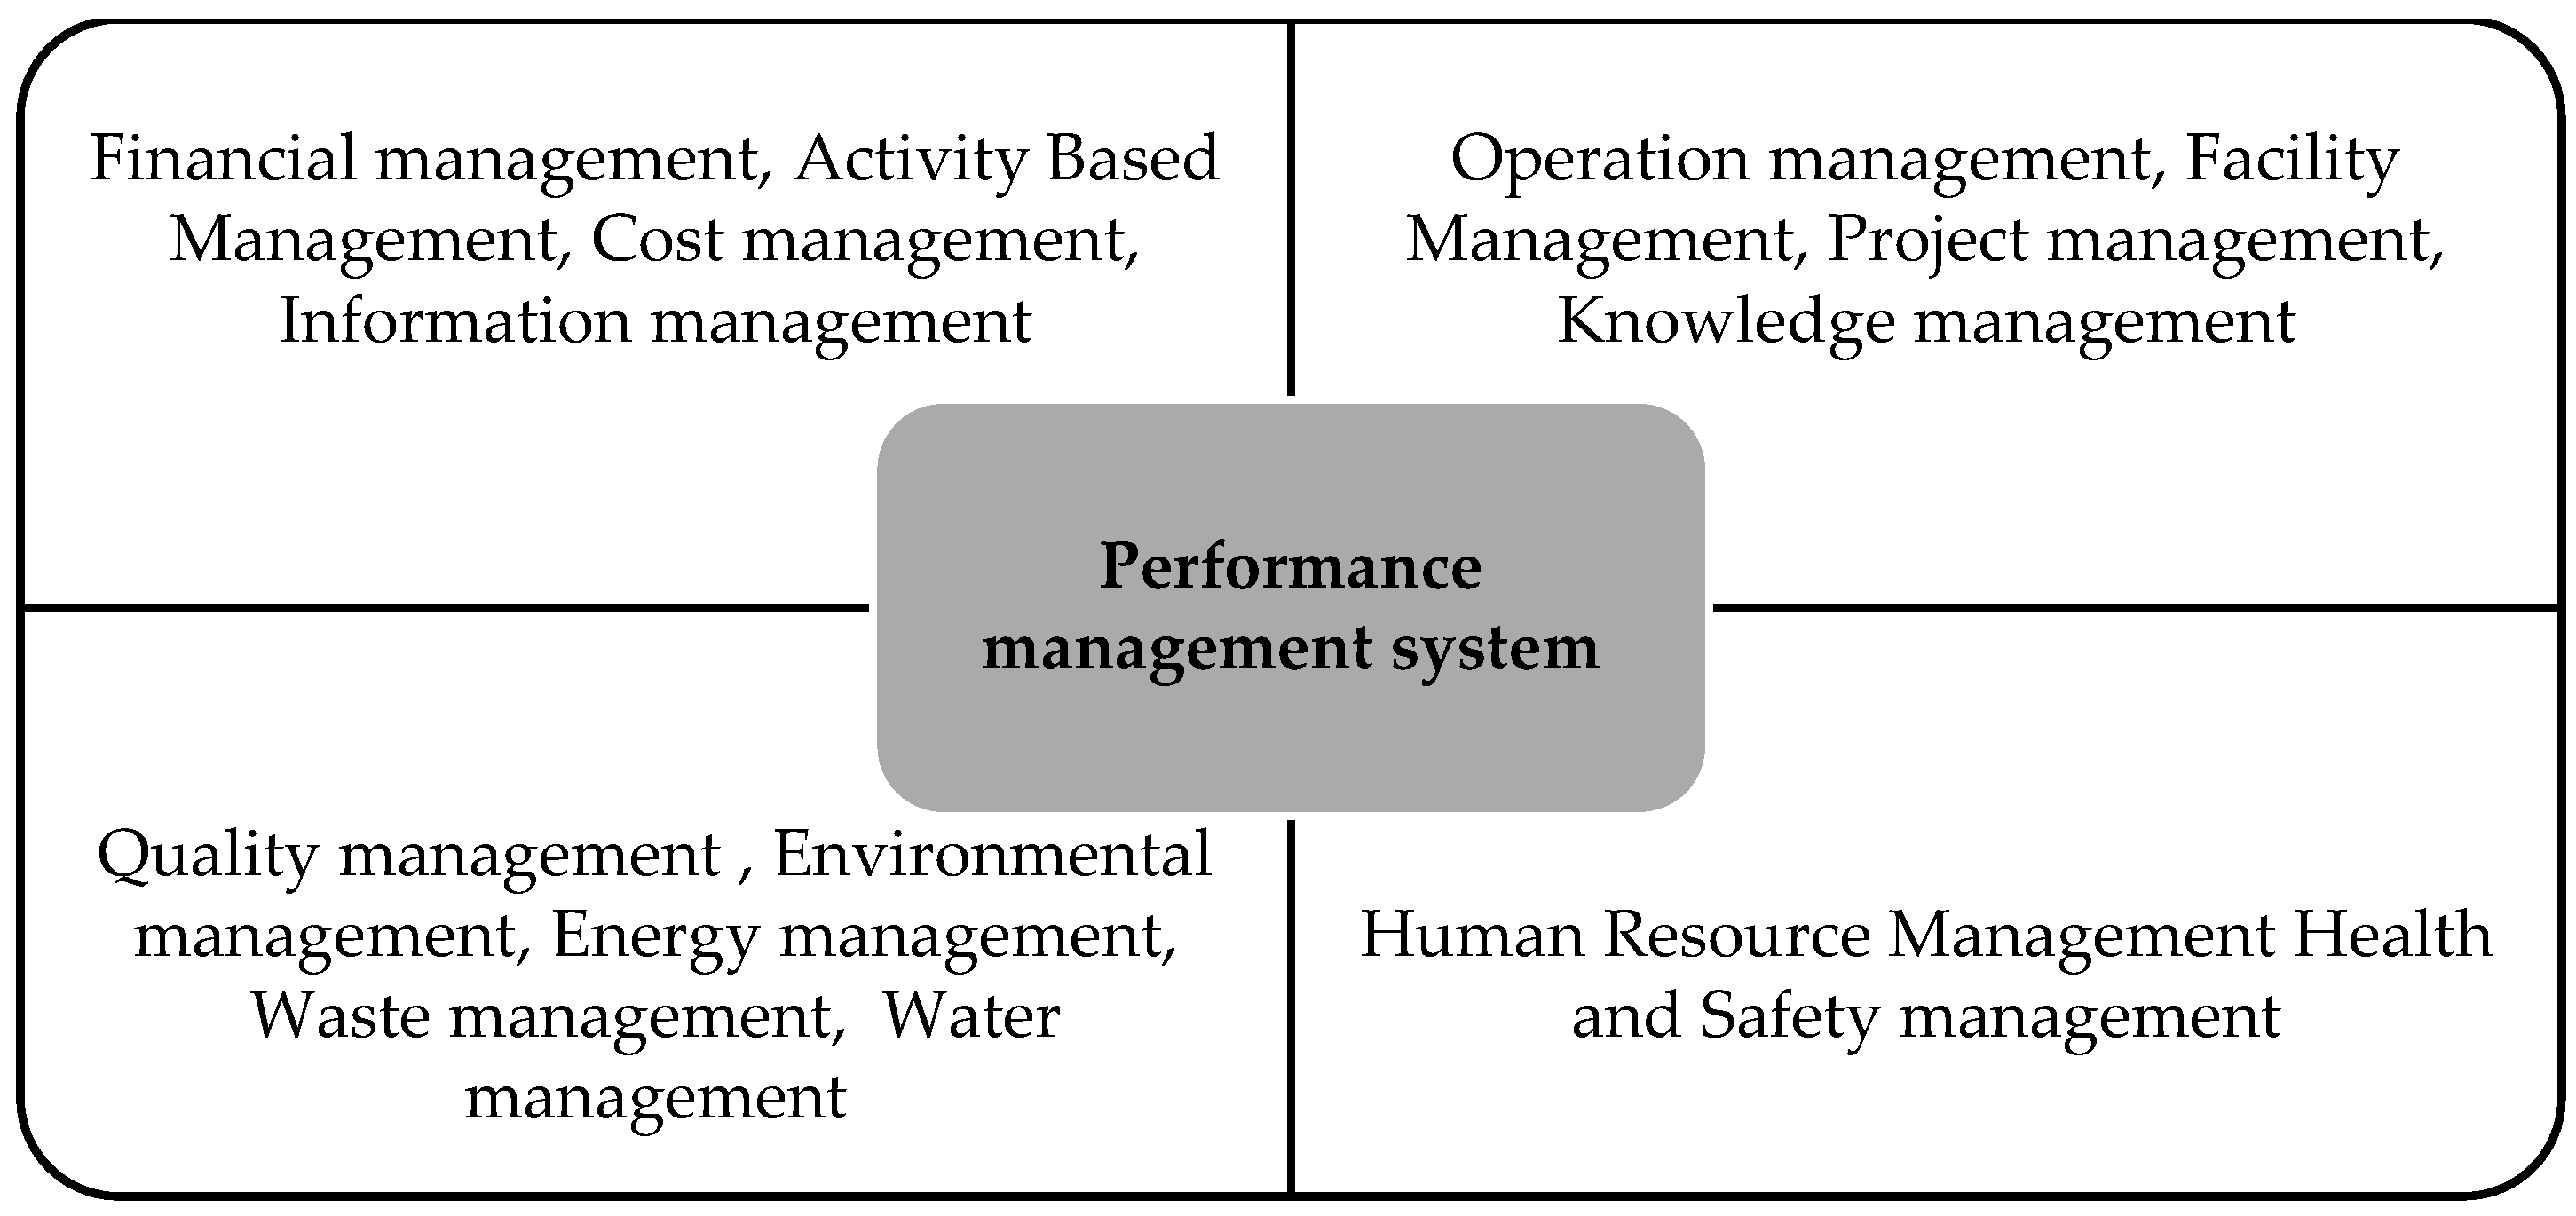
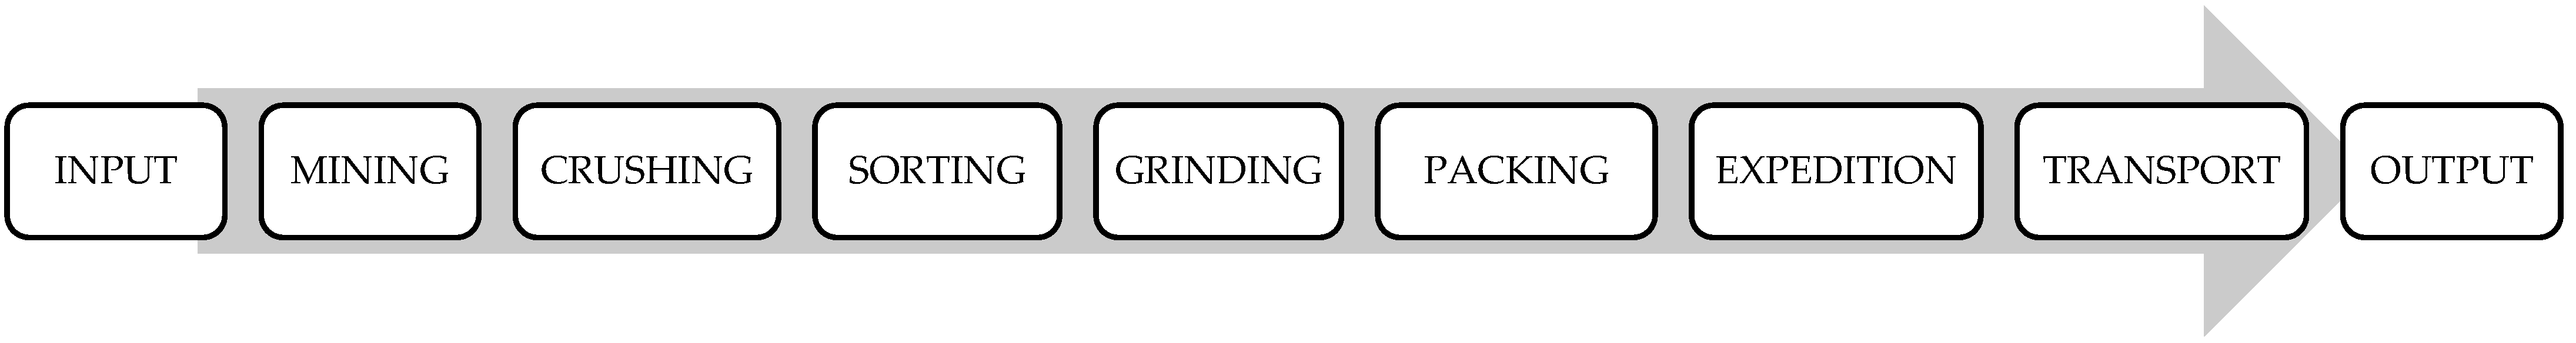
26]. Process management can be provided by managerial approaches (Figure 2), which are focused on special areas of management.
In this paper, we used instruments of various forms of management and we showed how important a synergy of forms of management is in the mining companies. The main goal of the paper was to evaluate the performance indicators of mining processes after the implementation of strategic innovation—a new layout of the mining area focused on a combination of stationary and mobile mining equipment and their influence on the environment in a selected mining company in Slovakia in area of mining for limestone.
The most frequently implemented management approaches in mining companies include: facility management (FM), activity-based management (ABM), project management (PM), and human resource management (HRM), alongside other forms of management that are presented in Figure 1 and Figure 2. These managerial approaches focus on mining processes to shorten the time of product implementation, utilization of input resources in a particular process, sensitivity to the interconnection of activities in the process, risk documentation, and consistency and completeness in filling reports, records, and processed documentation. The orientation of process management is focused on measuring key performance indicators of mining processes, which are in the synergy of other management approaches.

2. Materials and Methods

In this article, we evaluated mining processes after the implementation of strategic innovation—a new layout of machines in the mining area. The complex process of research was done by a research algorithm (Figure 3). The object of research was the chosen mining company in Slovakia that deals with the mining of raw material, limestone.
We evaluated performance indicators of processes in mining. The base processes in the IPO chain (input, process, output) (Figure 4) are processes in the mining company such as mining, crushing, sorting, grinding, packing, expedition, and transport. These processes create a base of the IPO chain and are the main processes in mining. These processes were evaluated. In the first step, we collected data of mining processes from internal documents of the mining company in the financial accounting and financial statements. We collected data through a personal visit to the mining company, and at the economic department we obtained outputs from the company’s internal databases and double-entry bookkeeping. Data named “plan” are information of budgeting which was prepared last time period. The budgeting used plan method was based on percentual increasing of data. Data named “reality” are information of accounting statement which was prepared at the end of the year. Information creates data from two years—one year before implementation of the new layout, and after the implementation of the new layout.
We collected data for economic analyses for performance indicators in mining processes in the selected mining company in Slovakia. Table 1 contains data of various industry areas where the mining company sells raw material and products of raw material -limestone. Data are expressed volume unit (tone) for two the period years 2019 and 2020. Data are introduced for reality (current period) and plan (budgeting) of production of raw material.
Table 2 contains data of mining processes in the mining company. Data were expressed as volume unit (ton) for two period years, 2019 and 2020. Data were introduced for reality (current period) and plan (budgeting) of production of raw material.
In the second step, we analyzed performance indicators—coefficient of efficiency, index of functionality—for each process because these are two basic indicators of process evaluation according to ISO standard 9001 in the field of process management. We evaluated each area of industry where the mining company sold raw material, limestone.
Coefficient of efficiency (K) expresses the degree of fulfillment of the plan of the given process. It can be calculated by various parameters (production, revenue, failures, number of contracts, costs). Results of the coefficient evaluation are compared by limit values (Table 3). Formula for coefficient of efficiency (K), where (Xs) = value for reality, (Xp) = value for plan. This formula is based on the essence of process management:
K = X s X p
The index of functionality (I) expresses the degree of trend (development) of the given process through the coefficient of efficiency for two continual time’s period. It can be calculated by various parameters (production, revenue, failures, number of contracts, costs). Results of the index of functionality evaluation were compared by limit values (Table 4). The formula index of functionality (I), where K1 = value of coefficient of efficiency for current period, K0 = value of coefficient of efficiency for base period:
I = K 1 K 0
The limit of the effective process and limit of the functionality of process are values established by long-term theories from the quality guru Deming and are used today in the quality management system. For those indicators, the ISO norm 10,014: economic of quality exists. The coefficient of efficiency and index of functionality are important indicators for assessing the business environment and the functioning of mining processes in mining companies around the world. These indicators significantly affect the functioning of mining processes, the demand for extracted raw material, interest in processed raw materials, the use of the machinery park, and complex influence on the financial situation in the mining area [27].
We also used Pareto analysis to research the performance of mining processes. Pareto analysis is named after the Italian economist Vilfredo Pareto, who at the end of the 19th century found that 80% of the wealth was owned by 20% of people. The Pareto rule also applies in business processes, e.g., 80% of the company’s revenues come from 20% of customers, 20% of products generate 80% of profit, and 20% of possible causes generate 80% of problem situations in production.
The Pareto analysis procedure is employed for the following reasons:
  • To identify the causes in the monitored process (complaints, errors, costs, injuries, failures);
  • To arrange the causes in descending order (MAX-MIN), from the largest to the smallest values;
  • To determine the relative abundance (%);
  • To determine the cumulative relative abundance (%);
  • To construct a bar graph of causes from the largest value to the smallest value;
  • To construct a Lorenz curve (line graph) of cumulative frequencies of observed causes by means of a secondary axis in the graph;
  • To draw the ratio 80/20—80% on the cumulative number of the perpendicular to the Lorenz curve, from the point of intersection of the Lorenz curve perpendicular to the x-axis (20%). From point 0 to point 20%, the area of causes is decisive for the implementation of changes, after 20%, the area of causes is insignificant.
Relative abundance (%) expresses the share of the part in the whole in percentage expression, where Xi = economic value (production, profit, revenue, costs, number of employees) and KUM Ra means cumulating of percentage expression:
R a = X i S U M   X i 100 ( % )
The Pareto analysis creates one of the models for a production system that describes failures in the mining machines area. This model is based on filling business strategy goals in the area of machines park of a mining company [28].
Process performance indicators also include financial indicators. In this area, we evaluated the indicator of economic efficiency (e), economic result (P), and cost ratio indicator (n).
The modern way of evaluating performance is based on the assumption that a company is efficient if it is able to achieve defined strategic goals. The efficiency of the company is a prerequisite for the company’s competitiveness. The Global Competitiveness Report (BCI) assesses business-level competitiveness on the basis of indicators of performance. For economic analyses, we needed data of financial accounting as revenues, costs. Table 5 contains data of revenue for various industry areas (construction, steel, chemical, glass industry, agriculture). Data were expressed value units (euro) for two period years, 2019 and 2020. Data were present for actuality.
Table 6 contains data of costs for various industry areas (construction, steel, chemical, glass industry, agriculture). Data were expressed value units (euro) for two period years, 2019 and 2020. Data were present for actuality.
Economic indicators present those formulas:
Formula efficiency (e) is where X = value of revenue (€), Y = value of cost (€):
e = X Y
Efficiency (e) expresses the index between revenue and costs. The value of the coefficient (e) should be above level e > 1.
Formula profit (P) is where X = value of revenue (€), Y = value of cost (€):
P = X Y   ( )
Profit (P) expresses the difference between revenue and costs. The value of the profit (P) should be positive.
Formula cost ratio (n) is where X = value of revenue (€), Y = value of cost (€):
n = Y X
Cost ratio (n) expresses the index between costs and revenue. The value of the cost ratio (n) should be level n < 1.
Financial indicators create the base of performance. The dissatisfaction with financial indicators led to a focus on areas of performance measurement such as a balanced scorecard, environmental indicators, quality indicators, and technic indicators. Moreover, many recent studies have focused on the sustainability concept and performance measurement interconnection. This approach is important for mining companies and evaluation mining processes [29].

3. Results

The research was orientated to process evaluation in mining. The object of research was chosen mining company in Slovakia that deals with the mining of raw material, limestone. In the selected mining company, we evaluated all processes in the IPO chain. Processes were evaluated after the implementation of strategic innovation, a new layout of machines in the mining area (Figure 5). The mining machines were placed in the workplace in another place. This change was done for the efficiency of the mining process.
After the new layout of mining machines in the mining area, the mining processes were optimized. Based on the change of the working space, we evaluated the performance of the processes before the change and after the change of the mining layout area. The results of the evaluation of the efficiency indicator (Table 7) and functionality indicator (Table 8) of mining processes are presented in tables. The coefficient and index were calculated by formula 1 and formula 2. The results of the evaluation of the efficiency of mining processes point to critical mining process—transport in a mining company in the year 2019 at the level under limit e < 0.70. This means that this process is ineffective. The other processes are higher as limit level. The main goal of this indicator is to plan new changes in the area of internal transport in a mining company. This problem was in the year 2020 solved by implementing a new layout. The coefficient of efficiency was changed on the over-limit level on value K = 0.93.
The positive benefits we evaluated in this research through the coefficient of efficiency and index of functionality were recorded in the year 2020 because the coefficient of efficiency for transport was increased over a limit level K > 0.70 and the index of functionality for the year 2020 was recorded value over a limit level I >1 because its value was I = 1.5. All mining processes were effective. It means that each mining process was plan filling, and the mining, crushing, and grinding increased from the year 2019 after the new innovation strategy layout. For the mining company, the new innovation means new opportunities, meeting customer requirements, process efficiency, cost reduction, and downtimes.
The results of the evaluation of the efficiency (Table 9) and functionality (Table 10) orientated on the industry area where the mining company sells raw material and fractions of raw material we evaluated. In both years, mining processes were effective for all industry areas because the value of coefficient of efficiency in both 2019 and 2020 achieved over-limit level K < 0.70—for ineffective process. The lower results were recorded by area of construction (0–8), chemical industry, and agriculture.
In all areas, all purchasers recorded positive indicators of efficiency over-limit levels. The mining company fills the requirements of customers in the various areas—construction, chemical industry, glass industry, steel industry, and agriculture. This state is very important to the sustainability of mining market.
Index of functionality (Table 10) recorded nonfunctional mining processes in two areas—construction (0–8) and construction (8–32). These areas did not fulfill the requirements of customers. The other areas were fulfilled. This means that the trend during the two years recorded caused some problems in the mining processes as internal transport and downtimes at mining place. This problem was solved by a new layout at the mining place. In the new layout new mobile machines and other mobile crushers were used. The change of machines park brings the efficiency of mining processes, including crushing, grinding, and transport. This fact was described in values of functionality over the limit level. Managing and improving business processes increases business performance. There are several perspectives on managing and improving business processes such as productivity, efficiency, performance, time, cost, accuracy, flexibility, and output quality. Performance is the ability of a company to achieve the set goals and bring effect to all stakeholders. This represents a high probability of success in competing with other companies [31].
In the second step of algorithm of research, we prepared the Pareto analysis (Table 11). In the second step of the algorithm of research, we prepared a Pareto analysis. This analysis stated which processes were critical. Rules 20/80 mean that 20% mining processes create 80% operational costs (Figure 6). This analysis points to minimize costs in mining processes, including mining, expedition, transport, and sorting. Transport and sorting were solved by the new layout of the mining space.
Results of Pareto analysis point to critical processes in the mining company but at the same to processes that bring high revenues to satisfy the demand of raw material of various industry sections. Lorenz curve explains relation 20/80. It means only 20% of mining processes (mining, expedition, transport, sorting) create high production 80%. At the same time, this Lorenz curve explains 20% of mining processes create 80% operational costs. At last Lorenz curve explains 20% of mining processes create 80% revenues, which are important for the financial stability of the mining company. The process of mining contains a lot of various processes, but only some processes create a high level of costs. Those processes are important to solve and optimize costs.
We investigated the financial stability of the mining company through economic indicators (Table 12) as economic efficiency (e), cost ratio (n), and economic result (P). For economic analysis, we used data from the years 2019 and 2020 and we calculated economic indicators by formula 4, 5, 6. Indicator of efficiency (e) expresses the index between revenue and costs. The value of the coefficient (e) should be above level e > 1. In the mining company, this indicator is higher as (1) in the year 2019, 2020. It means that the mining company fulfills the goals of production and demand, and it uses all production factors optimal. The indicator economic result (P) in the mining company recorded high value in the years 2019 and 2020 means profit, not loss, which is important for the financial stability and for new investment. The high profit was recorded in the area for construction in the year 2019, and for the steel industry in the year 2020.
The cost ratio indicator (n) expresses the index between costs and revenue. The value of the cost ratio (n) should be level n < 1. This indicator informs the mining company about operational costs to one unit of revenue. In the year 2019 was this indicator the lowest in the construction area of industry and in the year 2020 was this indicator the lowest in the agriculture area. The structure of this indicator runs from 0.6 to 0.99. It means the risk for mining companies because costs directly to the value of revenue, which means a loss in the future period. Comparison analysis for economic efficiency and cost ratio (Figure 7) express through a limit level—value (1). Efficiency must be over this limit level and cost ratio must be under this limit level.
Comparison analysis points to economic efficiency over-limit level (1), where the cost ration indicator is under limit level (1). Both indicators showed a positive trend, but in the future they will be important to monitor.

4. Discussion

In this paper, we dealt with strategic innovation and its impact on performance indicators in mining companies for all mining processes. It is important to state that various innovations change performance indicators and bring improvement and increasing of profit of the mining company. Green mining is based on safety, environment, employees, results of the company, requirements of customers, and the end to achieve market position. The evaluation of the performance (Figure 8) of mining processes is connected with the strategic innovations that mining companies plan on the basis of the achieved results in the area of process efficiency and functionality.
Innovations are also part of the goals of the business strategy, which must be achieved and fulfilled in the set time [32]. Based on the implemented strategic innovation in the mining company, the performance indicators improved. The processes were evaluated as functional and efficient. The change in layout caused a reduction in time downtime by transporting the raw material to the crushing and grinding process. Mobile crushers were introduced and belt conveyors were moved. Sorting lines were added for each shredder, as well as mobile sorting lines. The change in in-house transport has reduced the operating costs of equipment, transport costs, and raw material storage costs. The use of mining equipment was in line with the technical capacity of the machines at the level of 85%. All these measures brought the mining company better results in the performance of mining processes. In praxis managerial instruments were used such as TQM, Kaizen, Six Sigma, Controlling, 5S, Kanban, and JIT, which could ensure that the customers’ needs are met and thus contribute to the higher performance of the mining companies [33]. Using quality management instruments and methods, businesses can increase their productivity and efficiency, decrease risks, reduces the unwanted variability in the processes, and associated non-productive costs for increasing the production quality and customer satisfaction [34]. Potkany et al. (2020) presented the results of the research that indicate dependence between the business size, capital structure, and use of quality management instruments. The enterprises applying at least one of the quality management instruments achieved higher performance measured by indicator ROE (above 7.5%) [35]. Using a new approach as outsourcing or facility management is one direction for improvement in mining companies. The search for the potential for cost savings, gaining more time for the core business in mining companies, but also increasing the quality of outsourced activities is offered through coordinated management of facility management support processes. Facility management is a vital part of successfully operating companies because joins people, processes, the building, and technology and brings benefits for companies [36]. All the instruments of various management areas (quality, energy, environmental, financial, cost, human resource, risks, information, and operation management) brought improvements for the mining processes and for mining companies. The significant change was the layout of the mining area, using alternative energy—solar energy, using mobile machines, and others.

5. Conclusions

The universal tool for measuring performance in mining companies is the subject of research in many countries around the world. Achieving a competitive advantage and gaining a foothold in the mining companies’ market provides a basic impetus for evaluating the performance of mining processes in the direction of sustainable development with orientation on green mining. Achieving performance in mining companies means focusing on innovation, developing knowledge, improving mining processes, using alternative resources, and protecting the environment. The right strategic move for mining companies is to focus on innovative strategies. The mining company introduced innovation in the form of the layout of the mining area and thus improved the mining processes and achieved positive results in the financial area, thus ensuring the financial stability of the mining company and satisfies customers in several of the industry. This approach brought improvements in the environment and the use of alternative sources for the achievement of energy. The research empirically confirms that the new innovation of layout of mining place brings improvement of mining processes and indicators point to effective (over limit 0.70) and functional (over limit 0.90) mining processes in the year 2020. The Pareto analysis showed the best processes (mining, expedition, transport, sorting) for financial benefits, the volume of production, demand, the satisfaction of customers, and the cover needs of industries, but at the same they are processes with high costs. The results of the research can be useful for other mining companies in performance management and achievement mining market position. The introduction of new modern tools for measuring performance is a prerequisite for building new performance management models in direction of sustainable development.

Author Contributions

Conceptualization, K.T.; methodology, software, validation, formal analysis, investigation, resources, data curation, writing—original draft preparation, writing—review and editing, visualization, supervision, project administration, funding acquisition, K.T., S.K., M.B. and J.R. All authors have read and agreed to the published version of the manuscript.

Funding

This research was funded by VEGA 1/0317/19, “Research and development of new smart solutions based on the principles of Industry 4.0, logistic, 3D modelling and simulation for streamlining production in the mining and building industry” and VEGA 1/0797/20, “Quantification of Environmental burden impacts of the Slovak regions on health, social and economic system of the Slovak republic.

Conflicts of Interest

The authors declare no conflict of interest.

References

  1. Jiskani, I.M.; Shah, S.A.A.; Qingxiang, C.; Zhou, W.; Lu, X. A multi-criteria based SWOT analysis of sustainable planning for mining and mineral industry in Pakistan. Arab. J. Geosci. 2020, 13, 1–16. [Google Scholar] [CrossRef]
  2. Jiskani, I.M.; Cai, Q.; Zhou, W.; Shah, S.A.A. Green and climate-smart mining: A framework to analyze open-pit mines for cleaner mineral production. Resour. Policy 2021, 71, 102007. [Google Scholar] [CrossRef]
  3. Cehlár, M.; Čulková, K.; Pavolová, H.; Khouri, S. Sustainability of Business with Earth Sources in V4. In Proceedings of the 4th International Innovative Mining Symposium; E3S Web of Conferences; Edition Diffusion Presse Sciences: Bristol, UK, 2019; Volume 105, pp. 1–7. [Google Scholar] [CrossRef]
  4. Jiskani, I.M.; Cai, Q.; Zhou, W.; Chang, Z.; Chalgri, S.R.; Manda, E.; Lu, X. Distinctive model of mine safety for sustainable mining in Pakistan. Min. Metall. Explor. 2020, 37, 1023–1037. [Google Scholar] [CrossRef]
  5. Krupnik, L.; Yelemessov, K.; Beisenov, B.; Baskanbayeva, D. Substantiation and process design to manufacture polymer-concrete transfer cases for mining machines. Min. Miner. Deposit. 2020, 14, 103–109. [Google Scholar] [CrossRef]
  6. Sütőová, A.; Zgodavová, K.; Lajczyková, M. Quality and effectiveness evaluation of the geological services using CEDAC method. Acta Montanistica. Slovaca 2018, 23, 18–25. [Google Scholar]
  7. Zhou, Y.; Zhou, W.; Lu, X.; Jiskani, I.M.; Cai, Q.; Liu, P.; Li, L. Evaluation index system of green surface mining in China. Min. Metall. Explor. 2020, 37, 1093–1103. [Google Scholar] [CrossRef]
  8. Chen, J.; Jiskani, I.M.; Jinliang, C.; Yan, H. Evaluation and future framework of green mine construction in China based on the DPSIR model. Sustain. Environ. Res. 2020, 30, 1–10. [Google Scholar] [CrossRef]
  9. Mirmozaffari, M.; Shadkam, E.; Khalili, S.M.; Kabirifar, K.; Yazdani, R.; Gashteroodkhani, T.A. A novel artificial intelligent approach: Comparison of machine learning tools and algorithms based on optimization DEA Malmquist productivity index for eco-efficiency evaluation. Int. J. Energy Sect. Manag. 2020, 2, 1–15. [Google Scholar]
  10. Menshikova, E.; Fetisov, V.; Karavaeva, T.; Blinov, S.; Belkon, P.; Vaganov, S. Reducing the negative technogenic impact of the mining enterprise on the environment through management of the water balance. Minerals 2020, 10, 1145. [Google Scholar] [CrossRef]
  11. Visser, W.F. A blueprint for Performance—Driven Operations Management. Min. Metall. Explor. 2020, 37, 823–831. [Google Scholar] [CrossRef]
  12. Jiskani, I.M.; Cai, Q.; Zhou, W.; Lu, X. Assessment of risks impeding sustainable mining in Pakistan using fuzzy synthetic evaluation. Resour. Policy 2020, 69, 101820. [Google Scholar] [CrossRef]
  13. Tworek, P.; Tchorzewski, S.; Valouch, P. Risk Management in coal mines methodical proposal for Polish and Czech hard coal mining industry. Acta Montan. Slovaca 2018, 23, 72–80. [Google Scholar]
  14. Hancock, M.G. Evaluation of risk management systems for non-occupational disease and illness in the workforce of Papua New Guinean mining operations. Australas. Inst. Min. Metall. Publ. Ser. 2007, 2, 111–118. [Google Scholar]
  15. Hall, B.E.; Vries, J.C. Quantifying the economic risk of suboptimal mine plans and strategies. Min. Risk Manag. Conf. 2003, 15, 59–69. [Google Scholar]
  16. Domaracká, L.; Muchová, M.; Gonos, J. Evaluation of innovative aspects in mining company. In Proceedings of the 13th International Geoconference on Science and Technologiesin Geology—SGEM, Albena, Bulgaria, 16–22 June 2013; pp. 463–468. [Google Scholar]
  17. Puzder, M.; Pavlik, T.; Molokač, M.; Hlavňová, B.; Vaverčák, N.; Samaneh, I.B.A. Cost ratio model proposal and consequential evaluation of model solutions of manufacturing process in mining company. Acta Montan. Slovaca 2017, 22, 270–277. [Google Scholar]
  18. Tyuleneva, T. The prospects of accounting at mining enterprises as a factor of ensuring their sustainable development. In Proceedings of the 2nd International Innovative Mining Symposium, E3S Web of Conferences, Russia, Kemerovo, Russia, 20–22 November 2017; Volume 21, pp. 4009–4015. [Google Scholar] [CrossRef] [Green Version]
  19. Demirel, N.; Erkayaoglu, M. Sustainability comparison of mining industries by life cycle assessment for Turkey and European Union. In Proceedings of the SWEMP 2016, 16th International Symposium on Environmental Issues and Waste Management in Energy and Mineral Production, Istanbul, Turkey, 5–7 October 2016. [Google Scholar]
  20. Ambrisko, L.; Marasová, D.; Grendel, P.; Lukáč, S. Application of logistics principles when designing the process of transportation of raw materials. Acta Montan. Slovaca 2015, 20, 141–147. [Google Scholar]
  21. Kudelko, J. Economic evaluation of backward vertical integration in mining industry. In Proceedings of the 12th International Multidisciplinary Scientific Geoconference, SGEM, Albena, Bulgaria, 17–23 June 2012; Volume 1, pp. 547–554. [Google Scholar]
  22. Bye, A. The application of multi-parametric block models to the mining process. J. South. Afr. Inst. Min. Metall. 2007, 107, 51–58. [Google Scholar]
  23. Hoare, R. The role of simulation modelling in project evaluation. Australas. Inst. Min. Metall. Publ. Ser. 2007, 4, 121–126. [Google Scholar]
  24. Aghababaei, S.; Jalalifar, H.; Hosseini, A. Applyiing a technical-economic approach to calculate a suitable panel width for longwall mining method. J. Min. Environ. 2021, 12, 113–126. [Google Scholar]
  25. Yang, S.; Liu, S.M.; Zhang, N.; Li, G.C.; Zhang, J. A fully automatic image based approach to quantifying the geological strength index of underground rock mass. Int. J. Rock Mech. Min. Sci. 2021, 140, 104585. [Google Scholar] [CrossRef]
  26. Pavolová, H.; Šimková, Z.; Seňová, A.; Wittenberger, G. Macroeconomic indicators of raw material policy in Slovakia. In Proceedings of the First Interregional Conference Sustainable Development of Eurasian Mining Regions, Kemerovo, Russia, 25–27 November 2019; Edition Diffusion Presser Sciences: London, UK, 2019; pp. 1–12. [Google Scholar]
  27. Dvorský, J.; Gavurová, B.; Čepel, M.; Červinka, M. Impact of selected economic factors on the business environment: The case of selected East European Countries. Pol. J. Manag. Stud. 2020, 22, 96–110. [Google Scholar] [CrossRef]
  28. Gomes, J.G.C.; Okano, M.T.; Otola, I. Creation of indicators for classification of business models and business strategies in production systems. Pol. J. Manag. Stud. 2020, 22, 142–157. [Google Scholar] [CrossRef]
  29. Rajnoha, R.; Lesníková, P.; Krajčík, V. Influence of business performance measurement systems and corporate sustainability concept to overall business performance: Save the planet and keep your performance. Econ. Manag. 2017, 1, 111–128. [Google Scholar] [CrossRef]
  30. Teplicka, K.; Straka, M. Sustainability of extraction of raw material by a combination of mobile and stationary mining machines and optimization of machine life cycle. Sustainability 2020, 12, 24. [Google Scholar] [CrossRef]
  31. Ruzekova, V.; Kittová, Z.; Steinhauser, D. Export Performance as a Measurement of Competitiveness. J. Compet. 2020, 12, 145–160. [Google Scholar] [CrossRef]
  32. Stojanovic, A.; Milosevic, I.; Arsic, S.; Urosevic, S.; Mihaljovic, I. Corporate Social Responsibility as a Determinant of Employee Loyalty and Business Performance. J. Compet. 2020, 12, 149–166. [Google Scholar] [CrossRef]
  33. Alglawe, A.; Schiffauerova, A.; Kuzgunkaya, O. Analysing the cost of quality within a supply chain using system dynamics approach. Total. Qual. Manag. Bus. Excell. 2019, 30, 1630–1653. [Google Scholar] [CrossRef]
  34. Pattanayak, A.K.; Prakash, A.; Mohanty, R.P. Risk analysis of estimates for cost of quality in supply chain: A case study. Prod. Plan. Control. 2019, 30, 299–314. [Google Scholar] [CrossRef]
  35. Potkany, M.; Gejdos, P.; Lesnikova, P.; Schmidtova, J. Influence of quality management practices on the Business performance of Slovak manufacturiong eterprises. Acta Polytech. Hung. 2020, 17, 161–180. [Google Scholar] [CrossRef]
  36. Kamodyova, P.; Potkany, M.; Kajanova, J. Facility management—trend for management of supporting business processes and increasing of competitiveness. AD Alta J. Interdiscip. Res. 2020, 10, 122–127. [Google Scholar]
Figure 1. Performance framework for evaluation mining processes. Source: own source.
Processes 09 01374 g001
Figure 2. The synergy of various forms of management as a base for the performance management system. Source: own source.
Processes 09 01374 g002
Figure 3. Algorithm of research in the mining company. Source: own source.
Processes 09 01374 g003
Figure 4. IPO chain of mining processes in the mining company.
Processes 09 01374 g004
Figure 5. Layout in mining company after implementation new strategic innovation. Source: [30].
Processes 09 01374 g005
Figure 6. Pareto analyses and Lorenz curve. Source: own source.
Processes 09 01374 g006
Figure 7. Economic analyses. Source: own source.
Processes 09 01374 g007
Figure 8. Dashboarding of performance of mining processes. Source: own source.
Processes 09 01374 g008
Table 1. Production volume of raw material—limestone for various industries.
Type of Industry (Tone)2019 (Plan)2019 (Reality)2020 (Plan)2020 (Reality)
Construction (0–8)32,00035,30034,00030,500
Construction (8–32)4500520014,60015,100
Construction (32–63)52,36054,60065,82087,650
Steel industry7900820018,50020,400
Steel industry15,60017,50090,000156,000
Chemical industry18,60020,70032,00030,200
Glass industry1400150016501700
Agriculture2500210021001900
Source: Internal document of the mining.
Table 2. Production volume of raw material, limestone, for mining processes.
Mining Processes (Tone)2019 (Plan)2019 (Reality)2020 (Plan)2020 (Reality)
Mining134,860145,100258,270343,450
Transport125,60078,500215,600200,700
Crushing75,86074,650154,600158,750
Sorting128,900131,200185,600189,600
Grinding45,60043,50074,65074,800
Packing33,45031,53048,50049,650
Expedition115,600120,630225,450256,700
Source: Internal document of the mining.
Table 3. Limit of effective process [27].
Coefficient of Efficiency (K)Limit
EffectiveK ≥ 0.85
Mostly effective0.85 > K ≥ 0.70
IneffectiveK < 0.70
Table 4. Limit of functionality of process [27].
Index of FunctionalityLimit
FunctionalI ≥ 1
Mostly functional1 > I ≥ 0.90
NonfunctionalI < 0.90
Table 5. Revenue of raw material, limestone.
Type of Industry2019 (Reality) (€)2020 (Reality) (€)
Construction546,6001,034,600
Steel industry175,8001,920,500
Chemical industry150,000210,560
Glass industry97,00095,000
Agriculture75,20087,400
Source: Internal document of the mining.
Table 6. Costs of raw material, limestone.
Type of Industry2019 (Reality) (€)2020 (Reality) (€)
Construction339,1201,025,700
Steel industry125,6001,758,000
Chemical industry149,800207,560
Glass industry85,60085,700
Agriculture68,52065,700
Source: Internal document of the mining.
Table 7. Coefficient of efficiency (K).
Mining Processes (Tone)K(0) 2019K(1) 2020
Mining1.0751.32
Transport0.620.93
Crushing0.981.03
Sorting1.011.02
Grinding0.951.002
Packing0.941.02
Expedition1.041.13
Source: own calculation.
Table 8. Index of functionality (I).
Mining Processes (Tone)I
Mining1.22
Transport1.5
Crushing1.05
Sorting1.009
Grinding1.05
Packing1.08
Expedition1.09
Source: own calculation.
Table 9. Coefficient of efficiency (K) for type of industry.
Type of Industry (Tone)K(0) 2019K(1) 2020
Construction (0–8)1.100.89
Construction (8–32)1.151.03
Construction (32–63)1.041.33
Steel industry1.031.10
Steel industry1.121.73
Chemical industry0.990.94
Glass industry1.071.03
Agriculture0.840.90
Source: own calculation.
Table 10. Index of functionality (I) for type of industry.
Type of Industry (Tone)I
Construction (0–8)0.80
Construction (8–32)0.89
Construction (32–63)1.27
Steel industry1.067
Steel industry1.54
Chemical industry0.94
Glass industry0.96
Agriculture1.07
Source: own calculation.
Table 11. Pareto analyses for mining processes.
Mining ProcessesProduction (Tone)Ra (%)KUM Ra (%)
Mining343,4502727
Expedition256,7002047
Transport200,7001663
Sorting189,6001578
Crushing158,7501290
Grinding74,800696
Packing49,6504100
Source: own source.
Table 12. Economic analyses.
Type of Industry2019 (e)2020 (e)(P) (€) 2019(P) (€) 20202019 (n)2020 (n)
Construction1.61.01207,48089000.60.99
Steel industry1.41.150,200162,5000.70.9
Chemical industry1.0011.0120030000.9990.99
Glass industry1.11.111,40093000.90.9
Agriculture1.11.3668021,7000.90.8
Source: own source.
Publisher’s Note: MDPI stays neutral with regard to jurisdictional claims in published maps and institutional affiliations.

