Article

Introducing Oxygen Vacancies in Li4Ti5O12 via Hydrogen Reduction for High-Power Lithium-Ion Batteries

School of Materials and Energy, University of Electronic Science and Technology of China, Chengdu 610054, China
*
Authors to whom correspondence should be addressed.
Processes 2021, 9(9), 1655; https://doi.org/10.3390/pr9091655
Submission received: 21 July 2021 / Revised: 6 September 2021 / Accepted: 8 September 2021 / Published: 14 September 2021
(This article belongs to the Special Issue Sustainable Development Processes for Renewable Energy Technology)

Abstract

:
Li4Ti5O12 (LTO), known as a zero-strain material, is widely studied as the anode material for lithium-ion batteries owing to its high safety and long cycling stability. However, its low electronic conductivity and Li diffusion coefficient significantly deteriorate its high-rate performance. In this work, we proposed a facile approach to introduce oxygen vacancies into the commercialized LTO via thermal treatment under Ar/H2 (5%). The oxygen vacancy-containing LTO demonstrates much better performance than the sample before H2 treatment, especially at high current rates. Density functional theory calculation results suggest that increasing oxygen vacancy concentration could enhance the electronic conductivity and lower the diffusion barrier of Li+, giving rise to a fast electrochemical kinetic process and thus improved high-rate performance.

1. Introduction

Lithium-ion batteries (LIBs), as the dominant energy storage device, have been widely applied in portable electronic devices and electric vehicles [1,2,3,4]. Even though graphite could be considered as the most successful anode material for LIBs [5,6,7], it still suffers from large volume expansion, poor rate capability arising from its low Li+ diffusion coefficient, and also dendrite formation which would cause severe safety problems [8,9]. As a result, graphite may not be suitable for applications where safety and low-frequency maintenance are the primary concerns, such as batteries for buses or large-scale power plants.
Recently, spinel Li4Ti5O12 (LTO) has attracted a lot of attention as a deintercalation/intercalation anode material due to its high safety and long cycling stability, which is associated with its negligible volume variation (also known as “zero strain”) during the Li+ insertion/extraction process through the three-dimensional diffusion channels [10,11,12]. Meanwhile, LTO possesses a high operation voltage (1.55 V vs. Li/Li+) that can, to some extent, avoid the formation of the solid electrolyte interphase (SEI) and Li dendrites. However, the intrinsically low electronic conductivity (10−13 S cm−1) and limited lithium diffusion coefficient (10−9–10−13 cm2 s−1) [13,14,15] of LTO, originating from the absence of electrons in the Ti 3d orbitals, leads to its large band gap (2 eV), thus preventing its more intensive applications.
To address these drawbacks, metal atom doping could be quite effective, such as Cr, Na, Gd and W, which would have a positive impact on the structure and stability of LTO during lithium intercalation and de-intercalation [16,17,18,19]. On the other hand, several works have indicated that the electrochemical properties of LTO could also be improved by the introduction of oxygen vacancies (OVs), which can narrow the band gap by creating defeats, thus enhancing the electrical conductivity of different materials [20,21,22,23,24] such as TiO2, Co3O4 and LTO. The OVs are usually generated by treating the materials under reducing atmosphere (i.e., H2), argon or vacuum [25], reacting with metal or hydride, hydrothermal reactions and plasma treatments [24,26]. Even though it has been demonstrated that plasma treatments under reducing atmospheres could be efficient in generating OVs in LTOs which led to the reduction of Ti4+ to Ti3+ while at the same time enhancing lithium storage performance [20,21,24], this method might not be commercially feasible at a large scale due to its high cost and complicated operation process.
Herein, we facilely treated commercialized LTO under a reduced atmosphere of Ar/H2 (5%) for the successful generation of OVs in LTO. As demonstrated by density functional theory calculations, the increasing concentration of OVs could lead to a tuned electronic structure and a low interaction of Li+ and LTO surface. As a result, the H2-treated LTO demonstrated much better high-rate performance and long-term cycling stability than the untreated pristine LTO. Both the theoretical and experimental analysis confirmed that the current H2 treatment was highly efficient and cost-effective in introducing OVs into LTO, leading to greatly enhanced lithium storage properties, thus demonstrating great potential for large-scale high-power applications.

2. Materials and Methods

2.1. Modification of LTO

0.5 g commercial LTO (Tianjiao Technology Development Co., Kuiyong Town, China) was put into a porcelain boat with a size of 60 cm in length and 30 cm in width and treated in a tube furnace (OTF-1200X) by annealing under Ar/H2 (5%) atmosphere and the size of tube was 8 cm in diameter and 1 m in length. In particular, the rate of heat rate was 2 °C min−1 with a 50 mL min−1 of gas flow rate and the temperature of 450 °C for 1 h.

2.2. Material Characterization

The crystallographic phases of all samples were investigated by X-ray diffraction (XRD Bruker, D8 Advancer; Using Cu Kα radiation in the range of 2θ = 10–80° with 50 kV 30 mA, λ = 1.54 Å). The morphologies of HLTO and LTO were characterized via transmission electron microscope (TEM; JEM2010F; FEI Talos-s, 200 kV accelerator voltage), selected area electron diffraction (SAED) and field emission scanning electron microscope (FSEM; FEI Inspect F50, Thermo Fisher Scientific, Waltham, MA, USA). X-ray photoelectron spectroscopy (XPS, Thermo Fisher Scientific Escalab 250Xi; Al Kα hv = 1486.6 eV; working voltage 12 kV and filament current 6 mA, Thermo Fisher Scientific, Waltham, MA, USA) measurements were carried out to determine the chemical state of samples. Raman spectroscopy tests were performed on a Thermo Fisher Scientific DXR Raman spectrometer with an excitation wavelength of 532 nm. The specific surface area of LTO and HTLO was acquired by N2 adsorption−desorption Brunauer−Emmett−Teller (BET) measurement using a Kubo X1000. The OVs were tested without pretreatment through Electron Paramagnetic Resonance (EPR) (power: 20 db, modulation amplitude: 3, center field: 3510 G, range: 100 gauss). Volume resistance of LTO and HLTO was obtained using DC resistance measurements (Malvern Mastersizer 2000, ACL Staticide, Chicago, IL, USA) at the pressure of 3 MPa.

2.3. Electrochemical Measurement

The electrochemical performance of materials were tested using CR2032 coin-type cells (Duoduo Technology Co., Guangdong, China) assembled in an Ar-filled glove box (SG1200/750TS). The electrodes were prepared by mixing active material, Super P carbon (Aiweixin Chemical Technology Co., Shenzhen, China) black and polyvinylidene difluoride (PVDF) in a weight ratio of 8:1:1 and then hand milling with N-methyl pyrrolidone (NMP) (Tianchenghe Technology Co., Beijing, China) to obtain a homogeneous slurry. Subsequently, the slurry was coated on copper foil and dried at 80 °C for 12 h under vacuum. The loading mass of active materials on the current collector is about 1~1.5 mg cm−2. SEM/EDX results of the LTO and HLTO electrodes (Supplementary Materials Figure S1) confirmed that both electrodes were shown with similar morphology and porosity. A pure lithium metal disc was used as the counter electrode and Celgard 2500 (Tianchenghe Technology Co., Beijing, China) was used as the separator. The electrolyte was obtained by dissolving 1 M LiPF6 in a mixture of ethylene carbonate (EC)/diethyl carbonate (DEC) (Duoduo Technology Co., Guangdong, China) with volume ratio of 1:1.
Galvanostatic charging−discharging profiles were tested on Neware battery tester with a voltage range of 1.0–2.5 V (vs. Li/Li+) at different current densities. Both cyclic voltammetry (CV) and electrochemical impedance spectroscopy (EIS) measurements were carried out on a Bio-logic SP-150 electrochemical workstation. CV was conducted with a voltage rage of 1–2.5 V (vs. Li/Li+) at different scan rates. For EIS, both LTO and HLTO were prepared as anodes following the above-mentioned protocol, and the tests were carried out after charging at the open-circuit potential of approximately 2.7 V (voltage protection is a range from −5 V to 5 V) with a superimposed 5 mV sinusoidal (root-mean-square) perturbation over the frequency range from 0.1 to 105 Hz. At least two cells were tested for each condition, which showed very similar performance. Besides, all the tests were performed using freshly assembled cells to rule out the aging effect. All cells were assembled with a configuration of an Li (counter electrode)/Celgard polymer separator/liquid electrolyte/LTO (or HLTO) anode.

2.4. Density Functional Theory (DFT) Calculations

First-principle calculations were performed via the Density Functional Theory (DFT) method coupled with the Vienna Ab-Initio Simulation Package (VASP, University of Vienna, Austria) [27]. The generalized gradient approximation (GGA) in the formulation of Perdew−Burke−Ernzerhof (PBE) was used to treat the exchange and correlation energy [28]. The cutoff energy of 450 eV was adopted for the wave basis sets. A k-points sampling with 0.04 and 0.08 Å−1 separation was used in the Brillouin zone for geometry optimization and density of states, respectively. The force and energy were converged to 0.02 eV Å−1 and 2.0 × 10⁻⁵ eV, respectively. The cutoff energy of 450 eV was set for the plane wave basis. The (111) plane of LTO was adopted to construct OVs. Moreover, a 2 × 2 supercell was built in this work. The vacuum layer thickness of 20 Å was applied to avoid virtual interaction. The energy barrier was calculated using the Nudged Elastic Band (NEB) method, employing eight images between two end states. The constrained optimization of the transition state was used when the NEB method was inapplicable due to a high computational expense.

3. Results and Discussion

It is clear from Figure 1 that both the pristine and H2-treated samples contain phase-pure Li4Ti5O12 (JCPDS 49-0207) [29]. The bump between 20° and 30° could probably be attributed to the amorphous carbon present in the samples, which was confirmed by Raman spectroscopy (Supplementary Materials Figure S2). Typical Raman vibration bands were observed at 1348 cm−1 and 1588 cm−1, which correspond to the D and G band of carbon. A TGA test (Supplementary Materials Figure S3) was investigated to verify such a claim. Apparently, the initial weight loss of 1.14% below 200 °C could be the evaporation of absorbed moisture content, and the subsequent loss of 2.08% between 400 and 600 °C could be due to the combustion of amorphous carbon. Furthermore, we refined XRD patterns of both samples and calculated their grain size with the Debye−Scherer formula [24,30]:
D = K λ B c o s θ
where the value of K is a constant; λ is the wavelength of X-ray; θ is the diffraction angle; B is the full-width-at-half-maximum. As a result, by calculating the D values based on the diffraction peak at 18.5° (111), the average grain size of HLTO (21.78 nm) is bigger than LTO (16.86 nm), which is most likely caused by the annealing process promoting the growth of crystallites. Moreover, the higher degree of crystallinity of HLTO (60.37%) than LTO (53.44%), which were obtained by the refinement results, also suggested the better crystallinity in the former.
On the other hand, even though both samples contained irregular submicron meter particles (Figure 2a,b), the heating process introduced subtle changes in the morphology of LTO, as HLTO seemed to have slightly larger aggregations with fewer small particles. Such a morphology was further confirmed under TEM (Figure 2c,d), and the high-resolution TEM (HRTEM) images (Figure 2e,f) showed well-defined lattice fringes with an interplanar distance of 0.48 nm, corresponding to the (111) plane of LTO in both samples. The selected-area electron diffraction (SAED) patterns display highly ordered arrangement of diffraction spots, verifying the single crystallinity of both samples. N2 adsorption/desorption measurement was conducted to analyze the surface structure of HLTO and LTO (Supplementary Materials Figure S4). It is clear that both samples presented a typical type III isotherm [2,8] with no apparent hysteresis loop, showing a BET surface area of 10.8 m2 g−1 and 13.1 m2 g−1 for HLTO and LTO, respectively, and a pore size distribution with a well-defined peak at about 4 nm.
To confirm the presence of the OVs, X-ray photoelectron spectroscopy (XPS) was performed to investigate the surface chemical states of both samples (Figure 3a,b and Figure S5). The O 1s spectra could be deconvoluted into three peaks which were located at 533.38 eV, 530.48 eV and 531.68 eV, corresponding to the hydroxyl species of surface-adsorbed water molecules, the Ti−O bonds and the OVs, respectively [8,11,20,24]. It can thus be quantified from the peak area that the content of OVs in HLTO is about 7.69%, which is about two times that of LTO (3.73%), confirming the higher concentration of OVs in the former. Ti 2p spectra for both samples (Figure 3b) showed two peaks at 459.09 eV and 464.78 eV, belonging to Ti4+. The peaks at 458.08 eV and 460.88 eV correspond to Ti3+, and HLTO possessed a higher Ti3+ level of 23.78%, while that of LTO is only 15.38%, also verifying the presence of more OVs in HLTO, suggesting that the H2 treatment could not only introduce OVs in the material, but also effectively adjust the valence state of the Ti atoms in LTO for the overall charge balance [20,24]. The relative concentrations of OVs were further analyzed by Electron Paramagnetic Resonance (EPR) (Figure 3c). Judging by the g-values, there are two high g signals at 2.004 in HLTO and LTO, which are due to the unpaired electrons trapped by OVs, thus confirming the existence of OVs [23,29,31,32,33]. Meanwhile, the higher signal intensity in HLTO than LTO indicates the higher OVs concentration in the former [33,34,35,36], consistent with the above XPS analysis. Raman shift was studied to analyze the functional groups of materials and explore the influence of the OVs on Ti-O bonds (Figure 3d). Typical Raman vibration bands of LTO were observed at 227 cm−1, 417 cm−1 and 668 cm−1, which represents the bending vibration of the O–Ti–O, the stretching–bending vibrations of the Li–O bonds in LiO4 polyhedral and the vibrations of Ti–O bonds in TiO6 octahedra [37,38,39], respectively. After bringing in the OVs, the Ti-O peaks were blue-shifted, which may be caused by the asymmetric vibrations due to the replacement of Ti4+ by Ti3+ [37,38].
As illustrated in Figure 4a, both samples exhibited similar discharge capacity of 166 mAh g1 and 161 mAh g1 for LTO and HLTO at 1 C, respectively, and could be probably attributed to the slightly higher surface area of LTO than HLTO. Generally, such a difference is quite negligible at low current rates; however, HLTO demonstrated significantly higher capacities than LTO as the charge/discharge rate reached 5 C and beyond, further confirming the more efficient charge transfer process in the former [40,41]. Similar trend was also reflected in the cycling stability test at 1 C (Supplementary Materials Figure S6) and 5 C (Figure 4b), where a capacity advantage could be maintained in HLTO at 5 C for 300 cycles, while no noticeable difference could be observed at 1 C. The reason for this phenomenon could be that, at a low current rate, the Li+ insertion/deinsertion and the dual-phase transformation are slow processes, the Li ions in both samples could have enough time to diffuse to the respective vacancy sites, thus producing comparable storage capacities. While testing at higher rates, the interaction between the Li ions and the active materials would be greatly limited, and only the sample with a higher Li diffusion coefficient could allow the efficient intercalation/deintercalation of Li ions within such a short reaction interval [20,24,26]. In the case of HLTO, the OVs could cause an unbalanced charge distribution in the local vicinity, which generated a built-in electric field [36,42], providing an extra driving force to the diffusion of Li+, giving rise to a higher specific capacity at high charge/discharge rate. A long-term stability test at 20 C (Figure 4c) presented a gradual decrease in specific capacity for 1000 cycles with almost 99.3% Coulombic efficiency, which is much higher compared to that of LTO during the course of the test. For anodes, CE is calculated by charge capacity divided by discharge capacity, corresponding to the insertion and disinsertion of Li+ into and from the LTO crystal framework. The initial CEs of LTO and HLTO were 99.8% and 99.6%, respectively and then stabilized at 99.1% and 99.3% after 1000 cycles at 20 C, suggesting that the insertion and deinsertion processes could take place to a similar extent. Even though both samples have similarly high CEs, HLTO delivered much higher capacities than LTO at high rates, suggesting that the diffusion of Li+ was much more efficient in the former as more Li+ could be inserted and deinserted during the charge/discharge process. In order for the complete storage of Li+, an Li metal anode was used to provide an excessive amount of Li+ in order for both samples to uptake as much Li+ as they can store, avoiding any possible difference in the CE values originating from the intrinsic interaction between Li+ and LTO/HLTO, but not from the depletion of Li+ at the electrolyte/electrode interface caused by insufficient Li+. Based on the above analysis, the performance and kinetic properties of HLTO were significantly improved with the introduction of OVs compared with the pristine LTO.
Subsequently, the galvanostatic charge/discharge curves of HLTO and LTO at various rates from 0.5 C to 30 C were investigated to inquire the capacity contributions in both samples (Figure 5a,b). It is apparent that HLTO demonstrated higher specific capacity than LTO at higher rates. Based on the analysis of the difference between the charge/discharge voltage plateaus (Supplementary Materials Figure S7), corresponding to the potential value of the distinct voltage platform from the galvanostatic charge/discharge curves, a much smaller polarization could be observed in HLTO at a high charge/discharge rate than LTO, further confirming the more efficient kinetic diffusion of Li ions. Figure 5c,d compares the discharge curves of HLTO and LTO at 1 C and 10 C, respectively. Each curve could be divided into three phases according to the potential range: the region from the open-cycle potential to ~1.55 V (noted as P1), the discharging platform at ~1.55 V (noted as P2) and a third potential region from ~1.55 V to 1 V (noted as P3) [43,44,45]. These three processes are related to three different reactions during discharge. P1 corresponds to the insertion of Li+ into the LTO solid solution. The dual-phase transformation, where Li4Ti5O12 transforms into Li7Ti5O12 (as shown in Equation (2) below) [46,47], is related to P2. P3 corresponds to the storage of Li+ at solid−liquid and solid−solid interfaces.
Li 4 Ti 5 O 12 + 3 Li + + 3 e     Li 7 Ti 5 O 12
In all cases, the P1 and P3 phases contribute only a relatively small portion of the discharge capacity, and it is also very clear that P2 played the dominant role in delivering the main capacity during discharge (Figure 5e,f). Evidently, both samples demonstrated similar capacity contributions from the three phases at the low current rate of 1 C. When the charge/discharge rate increased to 10 C, the contributions from P1 and P3 remained quite comparable, and the major difference originated from P2; that is to say, the main reason for HLTO having a higher capacity than LTO is because the former had a more efficient dual-phase transformation process than the latter [48,49].
To further study the reaction kinetics of HLTO and LTO, cyclic voltammetry (CV) analysis at different scan rates from 0.2 mV s1 to 5 mV s1 was conducted. The first cycles of LTO and HLTO at 0.2 mV s1 are displayed in Figure 6a,c, where both samples showed a pair of well-defined redox peaks at ~1.5 V/1.65 V (vs. Li/Li+), corresponding to the Li+ insertion/desertion of Li4Ti5O12 [11,12,13]. It should be pointed out that HLTO demonstrated higher peak intensities compared to LTO, suggesting that the presence of OVs would enhance the electrochemical processes during charge and discharge [50,51]. When increasing the scan rate to 5 mV s1, the difference in the peak intensities becomes even more prominent, suggesting a faster kinetic process in HLTO than LTO [52]. Similar to previous measurements, HLTO displayed current peaks with higher intensities than LTO at high scan rates. The relationship between the peak current (i) and the scan rate (v) could be described by an equation of i = avb [53,54,55], which can be transformed into:
log (i) = b log (v) + log (a)
where b represents the charge storage behavior, and its value is usually within a range of 0.5–1. If the b is close to 0.5, the electrochemical process is mastered by ionic diffusion. On the other hand, the process is controlled by faradaic reactions when the value of b is approaching 1 [56]. According to this theory, the b values of anodic and cathodic peaks for LTO are determined to be 0.46 and 0.36 (Figure 6b), respectively, indicating that the electrochemical process of LTO is basically controlled by ionic diffusion. In contrast, the same values of b for HLTO are 0.62 and 0.45, suggesting that there are also faradaic reactions, which could be caused by the introduced OVs in the material [57,58].
Electrochemical impedance measurements (Figure 7) were also performed for both specimens to analyze the resistance properties. The specific frequencies at some data points have been specified (labelled in the figure). The impedance curves were fitted with the equivalent circuit model (inset of Figure 7a), where Rs represents ohmic resistance in the high frequency region and exhibits the internal resistance of electrode and electrolyte in LIBs [59], which could be obtained by the left intersection of the Nyquist plot with the Z’ axis; Rct refers to the charge transfer resistance at the electrolyte/LTO interface, presenting the resistance incurred on the Li ions when they inserted from the electrolyte into the LTO/HLTO crystal structure [11,60,61], which is illustrated by the semicircle in the middle frequency region; CPE corresponds to the double-layer capacitance, which could be probably attributed to the accumulation of charges on the surface of the electrode that were not inserted into the active material. Warburg impedance represents the resistance of the Li+ ions transporting through the active material [50,62]. The diffusion coefficient of Li+ (DLi+) through the active material LTO or HLTO could be calculated using the following equation [63,64]:
D L i + = R 2 T 2 2 A 2 n 4 F 4 C 2 σ 2
where R is the gas constant (value is 8.314 J K−1 mol−1); T is the absolute temperature (298.15 K); A is the surface area of the electrode with a diameter of 12 mm (1.13 × 10⁻⁴ m2); n is 3, which is the number of electrons transferred in the half-reaction for the redox reaction and can be acquired from Formula (2); F is the Faraday constant (96,500 C mol−1); C is the concentration of lithium ions (8.3 × 10⁻³ mol cm−3) [64]; σ is the Warburg factor which can be acquired from the slope of Z’ ~ ω1/2 curves, as shown in Figure 7b, and the related results for both samples are displayed in Table 1. As summarized in Table 1, HLTO exhibited a larger DLi+ than LTO, which could be attributed to the improved conductivity via the introduction of OVs. Other fitting results are also listed in Table 1, and apparently, HLTO had a smaller ohmic resistance and charge transfer resistance than LTO, which was also consistent with its better high-rate performance. Besides, DC resistance measurement also showed that HLTO had a lower resistance of 5720 Ω·m than LTO (16,900 Ω·m).
To discover the mechanism of OVs in improving the lithium storage capability, density functional theory (DFT) calculations were carried out to investigate the electronic conductivity and Li+ diffusion behaviors in LTO lattice. Based on the XPS results, two different models of LTO with a concentration of OVs of 3.9% and 7.8% were constructed, named model I and II, respectively. Considering that the coordinate numbers of Ti atoms will affect the chemical activity of LTO [65], we thus selected the (111) surface of the two models with fivefold-coordinated and fourfold-coordinated Ti atoms, corresponding to LTO with low and high OV content, respectively. The Li+ diffusion path on the two models are displayed in Figure 8a,b, and the corresponding diffusion barriers are shown in Figure 8c. The (111) surface of LTO with high OV content (model II) exhibits a diffusion energy barrier of 0.78 eV, which is much lower than that of the sample with low OV concentration (model I; 1.62 eV), indicating that the Li+ diffusion is faster on the surface with high OV content. This phenomenon could be attributed to the reduced interaction between Li+ and under-coordinated Ti atoms by the OVs, thus facilitating the migration of Li+. The calculated density of stats (DOS) of two models are shown in Figure 8d. At high OV concentration, significant changes can be observed in the DOS of LTO, giving rise to a narrowed band gap of 1.6 eV in model II. Moreover, the corresponding Fermi level exhibited an upshift from the valence band to conduction band, suggesting an enhanced electronic conductivity. These calculation results indicated that increasing oxygen vacancy concentration could enhance the electronic conductivity and lower the diffusion energy barrier of Li+, resulting in a fast electrochemical process and superior high-rate performance.

4. Conclusions

In summary, by facilely treating commercial LTO under H2 atmosphere, OVs could be efficiently introduced into the active material, giving rise to a greatly enhanced electrochemical properties for lithium storage. Specifically, as confirmed by both XPS and EPR measurements, the concentration of OVs in LTO was significantly increased after H2 treatment, and based on density functional theory calculations, the presence of OV would enhance the electronic conductivity and lower the energy barrier of Li+ diffusion. As expected, HLTO with more OVs demonstrated greatly improved high-rate performance than the pristine LTO, with a reversible capacity of 85.1 mAh g1 at a very high charge/discharge rate of 30 C, while that of LTO was only 59.9 mAh g1. For prolonged cycling at 20 C, HLTO also exhibited higher capacities than LTO. These results confirmed that this facile method of introducing OVs into the active material would be highly effective in enhancing the high-rate performance of the electrode, shedding light on the design of high-power anode material for LIBs at an industrial scale.

Supplementary Materials

The following are available online at https://www.mdpi.com/article/10.3390/pr9091655/s1, Figure S1: SEM/EDX images of LTO (a), HLTO (b), Figure S2: Partial Raman spectra of HLTO and LTO, Figure S3: TGA results of commercial LTO, Figure S4: N2 adsorption/desorption curves of HLTO and LTO. The inset shows the pore size distribution of both samples from adsorption branch, Figure S5: XPS spectra of HLTO and LTO, Figure S6: Cycling performance of LTO and HLTO at 1 C, Figure S7: The polarization results of both samples at different rates.

Author Contributions

Conceptualization, Y.Z.; Methodology, Y.Z. and X.L.; Software, S.X.; Formal Analysis, Y.Z. and Z.L.; Investigation, Y.Z., and Z.L.; Data Curation, Y.Z. and S.X.; Writing—Original Draft Preparation, Y.Z. and R.W.; Writing—Review and Editing, Y.Z. and J.C.; Supervision, J.L. and J.C. All authors have read and agreed to the published version of the manuscript.

Funding

This work was financially supported by Fundamental Research Funds for the Central Universities (ZYGX2019J030).

Institutional Review Board Statement

Not applicable.

Informed Consent Statement

Not applicable.

Data Availability Statement

Not applicable.

Conflicts of Interest

The authors declare no conflict of interest.

References

  1. Gangaja, B.; Nair, S.; Santhanagopalan, D. Surface-Engineered Li4Ti5O12 Nanostructures for High-Power Li-Ion Batteries. Nano-Micro Lett. 2020, 12, 30. [Google Scholar] [CrossRef] [PubMed] [Green Version]
  2. He, Y.; Muhetaer, A.; Li, J.; Wang, F.; Liu, C.; Li, Q.; Xu, D. Ultrathin Li4Ti5O12 Nanosheet Based Hierarchical Microspheres for High-Rate and Long-Cycle Life Li-Ion Batteries. Adv. Energy Mater. 2017, 7, 1700950. [Google Scholar] [CrossRef]
  3. Lee, S.H.; Huang, C.; Grant, P.S. Multi-layered composite electrodes of high power Li4Ti5O12 and high capacity SnO2 for smart lithium ion storage. Energy Storage Mater. 2021, 38, 70–79. [Google Scholar] [CrossRef]
  4. Li, Z.; Xiao, S.; Liu, J.; Niu, X.; Xiang, Y.; Li, T.; Chen, J.S. Highly Efficient Na+ Storage in Uniform Thorn Ball-Like α-MnSe/C Nanospheres. Acta Metall. Sin. Engl. Lett. 2021, 34, 373–382. [Google Scholar] [CrossRef]
  5. Sun, J.; Guo, L.; Gao, M.; Sun, X.; Zhang, J.; Liang, L.; Liu, Y.; Hou, L.; Yuan, C. Solid-state template-free fabrication of uniform Mo2C microflowers with lithium storage towards Li-ion batteries. Chin. Chem. Lett. 2020, 31, 1670–1673. [Google Scholar] [CrossRef]
  6. Wei, C.; Fei, H.; Tian, Y.; An, Y.; Tao, Y.; Li, Y.; Feng, J. Scalable construction of SiO/wrinkled MXene composite by a simple electrostatic self-assembly strategy as anode for high-energy lithium-ion batteries. Chin. Chem. Lett. 2020, 31, 980–983. [Google Scholar] [CrossRef]
  7. Zheng, H.; Zhang, H.; Fan, Y.; Ju, G.; Zhao, H.; Fang, J.; Zhang, J.; Xu, J. A novel Mo-based oxide β-SnMoO4 as anode for lithium ion battery. Chin. Chem. Lett. 2020, 31, 210–216. [Google Scholar] [CrossRef]
  8. Liu, Y.; Liu, J.; Hou, M.; Fan, L.; Wang, Y.; Xia, Y. Carbon-coated Li4Ti5O12 nanoparticles with high electrochemical performance as anode material in sodium-ion batteries. J. Mater. Chem. A 2017, 5, 10902–10908. [Google Scholar] [CrossRef]
  9. Piffet, C.; Vertruyen, B.; Caes, S.; Thomassin, J.-M.; Broze, G.; Malherbe, C.; Boschini, F.; Cloots, R.; Mahmoud, A. Aqueous processing of flexible, free-standing Li4Ti5O12 electrodes for Li-ion batteries. Chem. Eng. J. 2020, 397, 125508. [Google Scholar] [CrossRef]
  10. Qi, S.; He, J.; Liu, J.; Wang, H.; Wu, M.; Li, F.; Wu, D.; Li, X.; Ma, J. Phosphonium Bromides Regulating Solid Electrolyte Interphase Components and Optimizing Solvation Sheath Structure for Suppressing Lithium Dendrite Growth. Adv. Funct. Mater. 2020, 31, 2009013. [Google Scholar] [CrossRef]
  11. Wang, D.; Liu, H.; Shan, Z.; Xia, D.; Na, R.; Liu, H.; Wang, B.; Tian, J. Nitrogen, sulfur Co-doped porous graphene boosting Li4Ti5O12 anode performance for high-rate and long-life lithium ion batteries. Energy Storage Mater. 2020, 27, 387–395. [Google Scholar] [CrossRef]
  12. Wang, H.; Wang, L.; Lin, J.; Yang, J.; Wu, F.; Li, L.; Chen, R. Structural and electrochemical characteristics of hierarchical Li4Ti5O12 as high-rate anode material for lithium-ion batteries. Electrochim. Acta 2021, 368, 137470. [Google Scholar] [CrossRef]
  13. Wang, R.; Cao, X.; Zhao, D.; Zhu, L.; Xie, L.; Li, J.; Miao, Y. Enhancing Lithium Storage Performances of the Li4Ti5O12 Anode by Introducing the CuV2O6 Phase. ACS Appl. Mater. Interfaces 2020, 12, 39170–39180. [Google Scholar] [CrossRef] [PubMed]
  14. Wen, K.; Tan, X.; Chen, T.; Chen, S.; Zhang, S. Fast Li-ion transport and uniform Li-ion flux enabled by a double–layered polymer electrolyte for high performance Li metal battery. Energy Storage Mater. 2020, 32, 55–64. [Google Scholar] [CrossRef]
  15. Zhang, L.; Zhang, X.; Tian, G.; Zhang, Q.; Knapp, M.; Ehrenberg, H.; Chen, G.; Shen, Z.; Yang, G.; Gu, L.; et al. Lithium lanthanum titanate perovskite as an anode for lithium ion batteries. Nat. Commun. 2020, 11, 3490. [Google Scholar] [CrossRef]
  16. Gong, S.H.; Lee, J.H.; Chun, D.W.; Bae, J.-H.; Kim, S.-C.; Yu, S.; Nahm, S.; Kim, H.-S. Effects of Cr doping on structural and electrochemical properties of Li4Ti5O12 nanostructure for sodium-ion battery anode. J. Energy. Chem. 2021, 59, 465–472. [Google Scholar] [CrossRef]
  17. Zhang, Q.; Verde, M.G.; Seo, J.K.; Li, X.; Meng, Y.S. Structural and electrochemical properties of Gd-doped Li4Ti5O12 as anode material with improved rate capability for lithium-ion batteries. J. Power Sources 2015, 280, 355–362. [Google Scholar] [CrossRef] [Green Version]
  18. Zhang, Q.; Zhang, C.; Li, B.; Jiang, D.; Kang, S.; Li, X.; Wang, Y. Preparation and characterization of W-doped Li4Ti5O12 anode material for enhancing the high rate performance. Electrochim. Acta 2013, 107, 139–146. [Google Scholar] [CrossRef]
  19. Zhao, F.; Xue, P.; Ge, H.; Li, L.; Wang, B. Na-Doped Li4Ti5O12 as an Anode Material for Sodium-Ion Battery with Superior Rate and Cycling Performance. J. Electrochem. Soc. 2016, 163, A690–A695. [Google Scholar] [CrossRef]
  20. Liang, K.; He, H.; Ren, Y.; Luan, J.; Wang, H.; Ren, Y.; Huang, X. Ti3+ self-doped Li4Ti5O12 with rich oxygen vacancies for advanced lithium-ion batteries. Ionics 2020, 26, 1739–1747. [Google Scholar] [CrossRef]
  21. Lyu, P.; Zhu, J.; Han, C.; Qiang, L.; Zhang, L.; Mei, B.; He, J.; Liu, X.; Bian, Z.; Li, H. Self-Driven Reactive Oxygen Species Generation via Interfacial Oxygen Vacancies on Carbon-Coated TiO2-x with Versatile Applications. ACS Appl. Mater. Interfaces 2021, 13, 2033–2043. [Google Scholar] [CrossRef]
  22. Shin, J.-Y.; Joo, J.H.; Samuelis, D.; Maier, J. Oxygen-Deficient TiO2−δ Nanoparticles via Hydrogen Reduction for High Rate Capability Lithium Batteries. Chem. Mater. 2012, 24, 543–551. [Google Scholar] [CrossRef]
  23. Xiong, T.; Yu, Z.G.; Wu, H.; Du, Y.; Xie, Q.; Chen, J.; Zhang, Y.W.; Pennycook, S.J.; Lee, W.S.V.; Xue, J. Defect Engineering of Oxygen-Deficient Manganese Oxide to Achieve High-Performing Aqueous Zinc Ion Battery. Adv. Energy Mater. 2019, 9, 1803815. [Google Scholar] [CrossRef]
  24. Zhu, J.; Chen, J.; Xu, H.; Sun, S.; Xu, Y.; Zhou, M.; Gao, X.; Sun, Z. Plasma-Introduced Oxygen Defects Confined in Li4Ti5O12 Nanosheets for Boosting Lithium-Ion Diffusion. ACS Appl. Mater. Interfaces 2019, 11, 17384–17392. [Google Scholar] [CrossRef]
  25. Dong, C.; Dong, W.; Lin, X.; Zhao, Y.; Li, R.; Huang, F. Recent progress and perspectives of defective oxide anode materials for advanced lithium ion battery. EnergyChem 2020, 2, 100045. [Google Scholar] [CrossRef]
  26. Liu, Y.; Xiao, R.; Fang, Y.; Zhang, P. Three-Dimensional Oxygen-Deficient Li4Ti5O12 Nanospheres as High-Performance Anode for Lithium Ion Batteries. Electrochim. Acta 2016, 211, 1041–1047. [Google Scholar] [CrossRef]
  27. Blöchl, P.E. Projector augmented-wave method. Phys. Rev. B 1994, 50, 17953–17979. [Google Scholar] [CrossRef] [Green Version]
  28. Perdew, J.P.; Burke, K.; Ernzerhof, M. Generalized Gradient Approximation Made Simple. Phys. Rev. Lett. 1996, 77, 3865–3868. [Google Scholar] [CrossRef] [PubMed] [Green Version]
  29. Wang, H.; Zhang, J.; Hang, X.; Zhang, X.; Xie, J.; Pan, B.; Xie, Y. Half-metallicity in single-layered manganese dioxide nanosheets by defect engineering. Angew. Chem. Int. Edit. 2015, 54, 1195–1199. [Google Scholar] [CrossRef]
  30. Wang, Q.; Chen, S.; Jiang, J.; Liu, J.; Deng, J.; Ping, X.; Wei, Z. Manipulating the surface composition of Pt-Ru bimetallic nanoparticles to control the methanol oxidation reaction pathway. Chem. Commun. 2020, 56, 2419–2422. [Google Scholar] [CrossRef]
  31. Wang, A.; Cao, Z.; Wang, J.; Wang, S.; Li, C.; Li, N.; Xie, L.; Xiang, Y.; Li, T.; Niu, X.; et al. Vacancy defect modulation in hot-casted NiO film for efficient inverted planar perovskite solar cells. J. Energy. Chem. 2020, 48, 426–434. [Google Scholar] [CrossRef]
  32. Ye, J.; Zhai, X.; Chen, L.; Guo, W.; Gu, T.; Shi, Y.; Hou, J.; Han, F.; Liu, Y.; Fan, C.; et al. Oxygen vacancies enriched nickel cobalt based nanoflower cathodes: Mechanism and application of the enhanced energy storage. J. Energy. Chem. 2021, 62, 252–261. [Google Scholar] [CrossRef]
  33. Zhang, J.; Yin, R.; Shao, Q.; Zhu, T.; Huang, X. Oxygen Vacancies in Amorphous InOx Nanoribbons Enhance CO2 Adsorption and Activation for CO2 Electroreduction. Angew. Chem. Int. Edit. 2019, 58, 5609–5613. [Google Scholar] [CrossRef]
  34. Li, J.; Shu, C.; Liu, C.; Chen, X.; Hu, A.; Long, J. Rationalizing the Effect of Oxygen Vacancy on Oxygen Electrocatalysis in Li-O2 Battery. Small 2020, 16, 2001812. [Google Scholar] [CrossRef] [PubMed]
  35. Ni, W.; Liu, Z.; Zhang, Y.; Ma, C.; Deng, H.; Zhang, S.; Wang, S. Electroreduction of Carbon Dioxide Driven by the Intrinsic Defects in the Carbon Plane of a Single Fe-N4 Site. Adv. Mater. 2021, 33, 2003238. [Google Scholar] [CrossRef] [PubMed]
  36. Sadighi, Z.; Huang, J.; Qin, L.; Yao, S.; Cui, J.; Kim, J.-K. Positive role of oxygen vacancy in electrochemical performance of CoMn2O4 cathodes for Li-O2 batteries. J. Power Sources 2017, 365, 134–147. [Google Scholar] [CrossRef]
  37. Guo, M.; Chen, H.; Wang, S.; Dai, S.; Ding, L.-X.; Wang, H. TiN-coated micron-sized tantalum-doped Li4Ti5O12 with enhanced anodic performance for lithium-ion batteries. J. Alloy. Compd. 2016, 687, 746–753. [Google Scholar] [CrossRef]
  38. Liao, J.-Y.; Chabot, V.; Gu, M.; Wang, C.; Xiao, X.; Chen, Z. Dual phase Li4Ti5O12–TiO2 nanowire arrays as integrated anodes for high-rate lithium-ion batteries. Nano Energy 2014, 9, 383–391. [Google Scholar] [CrossRef] [Green Version]
  39. Tang, Y.; Huang, F.; Zhao, W.; Liu, Z.; Wan, D. Synthesis of graphene-supported Li4Ti5O12 nanosheets for high rate battery application. J. Mater. Chem. 2012, 22, 11257. [Google Scholar] [CrossRef]
  40. Luo, S.; Zhang, P.; Yuan, T.; Ruan, J.; Peng, C.; Pang, Y.; Sun, H.; Yang, J.; Zheng, S. Molecular self-assembly of a nanorod N-Li4Ti5O12/TiO2/C anode for superior lithium ion storage. J. Mater. Chem. A 2018, 6, 15755–15761. [Google Scholar] [CrossRef]
  41. Qin, T.; Zhang, X.; Wang, D.; Deng, T.; Wang, H.; Liu, X.; Shi, X.; Li, Z.; Chen, H.; Meng, X.; et al. Oxygen Vacancies Boost delta-Bi2O3 as a High-Performance Electrode for Rechargeable Aqueous Batteries. ACS Appl. Mater. Interfaces 2019, 11, 2103–2111. [Google Scholar] [CrossRef] [PubMed]
  42. Hou, C.; Hou, Y.; Fan, Y.; Zhai, Y.; Wang, Y.; Sun, Z.; Fan, R.; Dang, F.; Wang, J. Oxygen vacancy derived local build-in electric field in mesoporous hollow Co3O4microspheres promotes high-performance Li-ion batteries. J. Mater. Chem. A 2018, 6, 6967–6976. [Google Scholar] [CrossRef]
  43. Wang, S.; Yang, Y.; Quan, W.; Hong, Y.; Zhang, Z.; Tang, Z.; Li, J. Ti3+-free three-phase Li4Ti5O12/TiO2 for high-rate lithium ion batteries: Capacity and conductivity enhancement by phase boundaries. Nano Energy 2017, 32, 294–301. [Google Scholar] [CrossRef]
  44. Xu, G.; Tian, Y.; Wei, X.; Yang, L.; Chu, P.K. Free-standing electrodes composed of carbon-coated Li4Ti5O12 nanosheets and reduced graphene oxide for advanced sodium ion batteries. J. Power Sources 2017, 337, 180–188. [Google Scholar] [CrossRef]
  45. Yang, Z.; Huang, Q.; Li, S.; Mao, J. High-temperature effect on electrochemical performance of Li4Ti5O12 based anode material for Li-ion batteries. J. Alloy. Compd. 2018, 753, 192–202. [Google Scholar] [CrossRef]
  46. Ma, J.; Wei, Y.; Gan, L.; Wang, C.; Xia, H.; Lv, W.; Li, J.; Li, B.; Yang, Q.-H.; Kang, F.; et al. Abundant grain boundaries activate highly efficient lithium ion transportation in high rate Li4Ti5O12 compact microspheres. J. Mater. Chem. A 2019, 7, 1168–1176. [Google Scholar] [CrossRef] [Green Version]
  47. Wu, Q.; Xu, J.; Yang, X.; Lu, F.; He, S.; Yang, J.; Fan, H.J.; Wu, M. Ultrathin Anatase TiO2 Nanosheets Embedded with TiO2-B Nanodomains for Lithium-Ion Storage: Capacity Enhancement by Phase Boundaries. Adv. Energy Mater. 2015, 5. [Google Scholar] [CrossRef]
  48. Chen, C.; Xu, H.; Zhou, T.; Guo, Z.; Chen, L.; Yan, M.; Mai, L.; Hu, P.; Cheng, S.; Huang, Y.; et al. Integrated Intercalation-Based and Interfacial Sodium Storage in Graphene-Wrapped Porous Li4Ti5O12Nanofibers Composite Aerogel. Adv. Energy Mater. 2016, 6, 1600322. [Google Scholar] [CrossRef]
  49. Feng, X.-Y.; Li, X.; Tang, M.; Gan, A.; Hu, Y.-Y. Enhanced rate performance of Li4Ti5O12 anodes with bridged grain boundaries. J. Power Sources 2017, 354, 172–178. [Google Scholar] [CrossRef] [Green Version]
  50. Huang, C.; Zhao, S.-X.; Peng, H.; Lin, Y.-H.; Nan, C.-W.; Cao, G.-Z. Hierarchical porous Li4Ti5O12–TiO2 composite anode materials with pseudocapacitive effect for high-rate and low-temperature applications. J. Mater. Chem. A 2018, 6, 14339–14351. [Google Scholar] [CrossRef]
  51. Li, G.; Blake, G.R.; Palstra, T.T. Vacancies in functional materials for clean energy storage and harvesting: The perfect imperfection. Chem. Soc. Rev. 2017, 46, 1693–1706. [Google Scholar] [CrossRef]
  52. Xu, H.; Chen, J.; Li, Y.; Guo, X.; Shen, Y.; Wang, D.; Zhang, Y.; Wang, Z. Fabrication of Li4Ti5O12-TiO2 Nanosheets with Structural Defects as High-Rate and Long-Life Anodes for Lithium-Ion Batteries. Sci. Rep. 2017, 7, 2960. [Google Scholar] [CrossRef] [PubMed]
  53. Hong, Z.; Zhou, K.; Huang, Z.; Wei, M. Iso-Oriented Anatase TiO2 Mesocages as a High Performance Anode Material for Sodium-Ion Storage. Sci. Rep. 2015, 5, 11960. [Google Scholar] [CrossRef] [PubMed]
  54. Xiao, S.; Li, Z.; Liu, J.; Song, Y.; Li, T.; Xiang, Y.; Chen, J.S.; Yan, Q. SeC Bonding Promoting Fast and Durable Na+ Storage in Yolk-Shell SnSe2 @SeC. Small 2020, 16, 2002486. [Google Scholar] [CrossRef] [PubMed]
  55. Xu, Y.; Zhou, M.; Zhang, C.; Wang, C.; Liang, L.; Fang, Y.; Wu, M.; Cheng, L.; Lei, Y. Oxygen vacancies: Effective strategy to boost sodium storage of amorphous electrode materials. Nano Energy 2017, 38, 304–312. [Google Scholar] [CrossRef]
  56. Jiang, Y.; Song, D.; Wu, J.; Wang, Z.; Huang, S.; Xu, Y.; Chen, Z.; Zhao, B.; Zhang, J. Sandwich-like SnS2/Graphene/SnS2 with Expanded Interlayer Distance as High-Rate Lithium/Sodium-Ion Battery Anode Materials. ACS Nano 2019, 13, 9100–9111. [Google Scholar] [CrossRef]
  57. Deng, X.; Wei, Z.; Cui, C.; Liu, Q.; Wang, C.; Ma, J. Oxygen-deficient anatase TiO2@C nanospindles with pseudocapacitive contribution for enhancing lithium storage. J. Mater. Chem. A 2018, 6, 4013–4022. [Google Scholar] [CrossRef]
  58. Kim, H.S.; Cook, J.B.; Lin, H.; Ko, J.S.; Tolbert, S.H.; Ozolins, V.; Dunn, B. Oxygen vacancies enhance pseudocapacitive charge storage properties of MoO3−x. Nat. Mater. 2017, 16, 454–460. [Google Scholar] [CrossRef]
  59. Yi, T.-F.; Fang, Z.-K.; Deng, L.; Wang, L.; Xie, Y.; Zhu, Y.-R.; Yao, J.-H.; Dai, C. Enhanced electrochemical performance of a novel Li4Ti5O12 composite as anode material for lithium-ion battery in a broad voltage window. Ceram. Int. 2015, 41, 2336–2341. [Google Scholar] [CrossRef]
  60. Wang, C.; Wang, S.; Tang, L.; He, Y.-B.; Gan, L.; Li, J.; Du, H.; Li, B.; Lin, Z.; Kang, F. A robust strategy for crafting monodisperse Li4Ti5O12 nanospheres as superior rate anode for lithium ion batteries. Nano Energy 2016, 21, 133–144. [Google Scholar] [CrossRef]
  61. Ge, H.; Cui, L.; Zhang, B.; Ma, T.-Y.; Song, X.-M. Ag quantum dots promoted Li4Ti5O12/TiO2 nanosheets with ultrahigh reversible capacity and super rate performance for power lithium-ion batteries. J. Mater. Chem. A 2016, 4, 16886–16895. [Google Scholar] [CrossRef]
  62. Yuan, T.; Yu, X.; Cai, R.; Zhou, Y.; Shao, Z. Synthesis of pristine and carbon-coated Li4Ti5O12 and their low-temperature electrochemical performance. J. Power Sources 2010, 195, 4997–5004. [Google Scholar] [CrossRef]
  63. Wang, D.; Shan, Z.; Na, R.; Huang, W.; Tian, J. Solvothermal synthesis of hedgehog-like mesoporous rutile TiO2 with improved lithium storage properties. J. Power Sources 2017, 337, 11–17. [Google Scholar] [CrossRef]
  64. Wang, X.; Hao, H.; Liu, J.; Huang, T.; Yu, A. A novel method for preparation of macroposous lithium nickel manganese oxygen as cathode material for lithium ion batteries. Electrochim. Acta 2011, 56, 4065–4069. [Google Scholar] [CrossRef]
  65. Wang, Y.; Sun, H.; Tan, S.; Feng, H.; Cheng, Z.; Zhao, J.; Zhao, A.; Wang, B.; Luo, Y.; Yang, J.; et al. Role of point defects on the reactivity of reconstructed anatase titanium dioxide (001) surface. Nat. Commun. 2013, 4, 2214. [Google Scholar] [CrossRef] [PubMed]
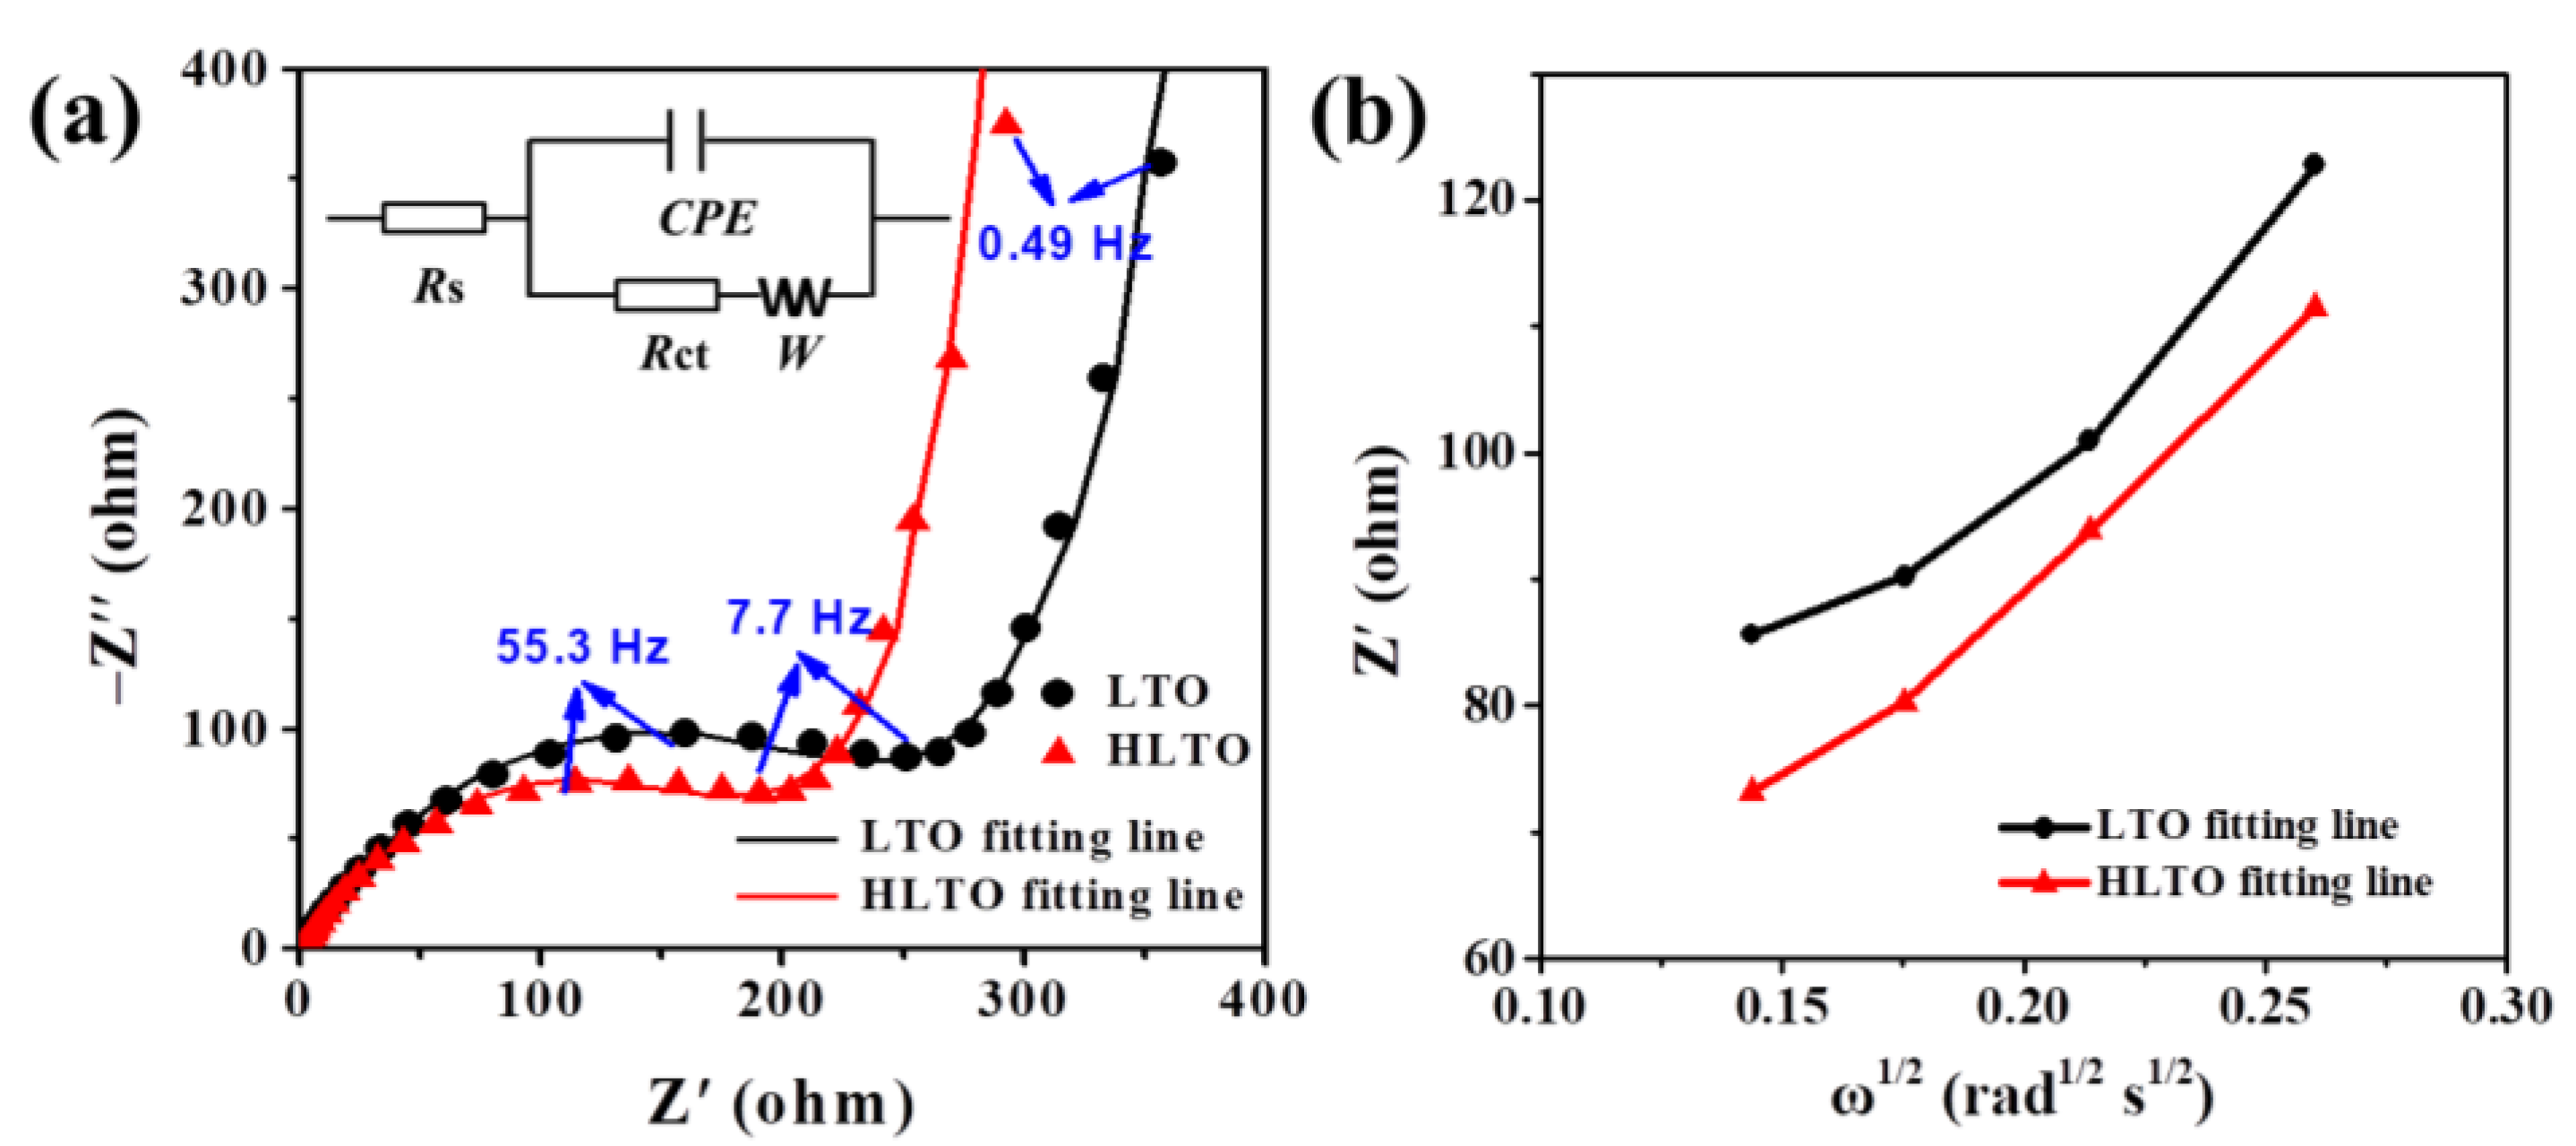
Figure 1. XRD patterns of HLTO and LTO.
Processes 09 01655 g001
Figure 2. SEM images of (a) HLTO and (b) LTO; TEM images of (c) HLTO and (d) LTO; HRTEM images of (e) HLTO and (f) LTO. The insets in (e,f) show the SEAD patterns of the respective sample.
Processes 09 01655 g002
Figure 3. Characterization results of HLTO and LTO: High-resolution XPS spectra of (a) O 1s and (b) Ti 2p; (c) electron paramagnetic resonance (EPR) spectra; (d) Raman scattering spectra.
Processes 09 01655 g003
Figure 4. Electrochemical tests of LTO and HLTO: (a) Rate performance; (b) Cycling performance at 5 C; (c) Long-term cycling stability test at 20 C. All the capacities displayed in this figure are the discharge capacities.
Processes 09 01655 g004
Figure 5. Charge/discharge curves of (a) HLTO and (b) LTO at various rates of 0.5 C, 1 C, 2 C, 5 C, 10 C, 20 C and 30 C; discharge curves at (c) 1 C and (d) 10 C; and the corresponding capacity contribution of different phases for HLTO and LTO at (e) 1 C and (f) 10 C.
Processes 09 01655 g005
Figure 6. Kinetic analysis of the LTO and HLTO anodes: (a) CV curves at different scan rates for LTO and (b) corresponding log i versus log v plot; (c) CV curves at different scan rates for HLTO and (d) corresponding log i versus log v plot.
Processes 09 01655 g006
Figure 7. (a) EIS spectra of LTO and HLTO electrodes; (b) plot curves of Z’ versus ω1/2 of three LTO electrodes in the low-frequency region. The inset in (a) shows the equivalent circuit model.
Processes 09 01655 g007
Figure 8. Li migration paths of (a) model I and (b) model II; (c) corresponding energy barriers and (d) calculated DOS of model I and model II. Model I and II correspond to the (111) surface of LTO with the OVs concentration of 3.9% and 7.8%, respectively.
Processes 09 01655 g008
Table 1. Summary of the EIS fitting results of LTO and HLTO.
ElectrodesRs (Ω cm−2)Rct (Ω cm−2)σDLi+ (cm2 s−1)
LTO1.48314.9373.733.29 × 10−17
HLTO0.87254.3297.585.18 × 10−17
Publisher’s Note: MDPI stays neutral with regard to jurisdictional claims in published maps and institutional affiliations.

