Abstract
This work reports a detailed experimental study that is aimed at investigating the failure mechanisms of highly porous cementitious foams used as heat insulation under triaxial stress states. The designed target dry density of the considered foam mixture was 180 kg/m3 by setting the water-to-cement ratio of the considered cement paste to 0.4. The mechanical experiments were accompanied by thermal tests to observe the effect that specific air void structures have on the resulting insulation properties and by micro-to-meso geometric studies to identify and classify the inner structure of the considered mineralized foams. Unconfined compressive strengths were performed first, obtaining peak stresses of 0.252, 0.283, 0.223, and 0.251 (results in MPa), corresponding to peak strains of 39.0, 28.6, 45.3, and 20.6 (in ×10−3 mm/mm), respectively. Moreover, three triaxial confinement levels of 33%, 66%, and 90% of the mean uniaxial compressive strength (fc) were adopted. The results showed that a 33% confinement may cause a strength increase and an almost perfect elastic–plastic stress–strain behavior. However, higher levels of confinements (i.e., 66% and 90%) produced very unstable behaviors in terms of the final strength and stress–strain response.
1. Introduction
Energy demand for the heating and cooling of the building sector represents a massive share of the total energy consumption around the world. In 2010, the sector used approximately 115 EJ globally, which accounts for 32% of the total global energy demand (24% for residential and 8% for commercial usage) [1]. In the EU, it currently reaches almost half of the total energy consumption [2]. To attenuate this number, building envelopes and the correct choice of thermal insulation systems for constructive elements (i.e., walls, roofs, and floors) have become the most important measure to improve the energy savings of the new and existing building stock. With the introduction of the 2019/21 European Buildings Directive, it has been additionally emphasized that new buildings of the EU States must be designed as “Nearly-Zero-Energy Buildings” [3]. This obligation has been active since 2019 for public and nonresidential buildings, while it will be mandatory for all constructions from the beginning of 2021 onwards. In this regard, the German Energy Saving Regulation (EnEV, 2014) proclaimed 25% stricter requirements for saving energy in its 2016 issue, which affected the set of the most important regulations of new and existing German buildings. In this sense, and in order to comply with the EU targets for energy savings, the German federal government merged all rules that currently apply in parallel (the Energy Saving Act, EnEG; the Energy Saving Regulation, EnEV, and the Renewable Energy Heat Act, EEWärmeG) into a new Building Energy Act (GEG) [4].
These stricter regulations have often led to designing thick layers (sometimes up to 40 cm) of standard insulation systems, mostly attached to the outer surface of the building envelope. In this sense, the efficient and optimized use of porous cementitious systems as a thermal insulation material could help to mitigate these high thicknesses [5]. Particularly, by altering the total amount of air content, porosity, and morphology of the inner micro- and meso-scale structure, an optimized thermal conductivity and specific heat capacity of the medium under consideration can be achieved [6]. It is well-known that air-filled thermal cementitious systems are very good insulators because of their good ratio between thermal conductivity and heat capacity; therefore, lightweight concretes or ultralightweight cementitious foams usually have superior thermal insulation capacities compared with normal-weight concrete [7,8]. Insulating capacities of mineralized foams mainly depend on the amount of binder and aggregates, which form the continuous matrix around the entrapped air. Furthermore, the type of binder and/or eventually additional filler components, such as fibers, rubber particles, etc., can play a role [9,10,11]. Key factors are the size, distribution, and volume fraction of air voids inside the binder matrix, lightweight aggregates, and/or (porous) fillers, which determine the continuous structure of the material. Examples of raw materials used for lightweight aggregates and fillers are (i) natural porous minerals, such as pumice [12], (ii) industrial-expanded minerals such as clays or perlites [13], or (iii) closed pore expanded glass beads or fly ash cenospheres [14]. Employing conventional lightweight concretes for insulating purposes is inefficient because of their relatively high density; the ratio between the solid material and the entrapped air is too high to achieve good insulation properties. Lowering the density of this class of concretes leads to reduced compressive strength and elastic modulus, but it only slightly improves the thermal properties [15]. In addition, lightweight aggregates and fillers are usually much more expensive than normal-weight aggregates by volume. For this reason, and despite the properties that make them difficult to justify in the context of a holistic approach (e.g., flammability, lowly recyclability, and high thickness required), insulation layers are almost always made of extruded and expanded polystyrene (EPS [16] and XPS [17]) or other foam polymers, such as polyisocyanurate (PiS) [18], but they are also of mineral wool (MW) [19] and rock wool (RW) [20], which at least have superior non-flammable properties [21].
In this sense, foam concrete made of cement paste (or mortar), in which a very high number of air voids are entrapped by using a suitable foaming agent, could be an advantageous solution for building insulation systems. Cementitious foams are non-flammable [22,23] and possess a high flowability (suitable for 3D printing), very low specific weight, no aggregates, and excellent thermal insulation properties [24]. On the basis of a rational mix design of foam and binder paste, a wide range of densities can be achieved (90–2000 kg/m3) and different porous distributions can be sharpened. Plenty of experimental [25,26,27,28,29] and several numerical [30,31,32,33,34] studies have already been offered in the literature to investigate the thermal–physical and mechanical response of cementitious-based foam composites. However, most of the published results are difficult to compare because of the broad range of raw densities considered. In addition, these data often show a large experimental scatter, which especially holds for low bulk densities, even when measured with special test setups [35]. Therefore, in the present paper, particular attention was given to precise production in terms of the quality and repeatability of the foam samples. Still, the dry bulk densities achieved showed a scatter within a range of 15% of the targeted design dry bulk density. The same holds for the associated material properties.
It is important to remark that not only does the very good thermal resistance make the concrete foam very attractive, but also the good compressive strength compared with other insulating materials (i.e., XPS) makes the use of cement-based foams in high-quality sandwich constructions an attractive option. Furthermore, the material can be used without adhesives and can generally be easily separated from the base and top layer of the sandwich. However, considering that the current literature lacks mechanical test results for very lightweight mineralized foams, especially under nonconventional stress cases such as the triaxial case condition, this work provides fundamental studies in this direction. In particular, the results of both uniaxial and triaxial compression experiments, considering different confinement levels, are presented, compared, and discussed.
The paper is structured as follows. Section 2 reports the Materials and Methods of the experimental program. Section 3 provides some considerations about the geometric details, the meso-structure, and porous distributions and sizes of the investigated foams. Section 4 outlines the results and main conclusions of the insulation foam properties. Then, in Section 5, the results of the mechanical tests are presented and discussed. Finally, concluding remarks and future developments of this research are addressed in Section 6.
2. Materials and Methods
In this section, the employed components, materials, and test methods for the experimental campaign are presented.
2.1. Components and Mixture
A foam concrete mixture was designed in order to investigate its geometric, physical, thermal, and mechanical properties. The considered water-to-cement (w/c) ratio for the cement paste employed in the foam system was 0.4.
The mineralized foam dry density, ρd, considered the main design parameter, was fixed to 180 kg/m3. This can be equated with the mass of the binder matrix mb in one cubic meter of the mineralized foam. Therefore, the total mass of the cement mc is:
where mc is the cement mass, mb is the mass of the binder matrix, and w/c is the chosen water-to-cement ratio.
The rest of the virtual cubic meter of mineralized foam has to be filled with aqueous foam VF. This volume can be calculated by summarizing the individual volumes of the binder paste components, Vw and Vc, using the respective material densities:
where VF is the volume of the aqueous foam, Vw is the volume of the water in the paste, and Vc is the cement volume.
VF = 1 m3 − Vw − Vc
Thus, the fresh density ρfr of the mineral foam can be a parameter to control the quality of mixing during the production process:
where ρfr is the density of the fresh mineral foam, mF is the mass of the aqueous foam, and mw is the mass of the water in the binder paste.
ρfr = Σ (mF,mw,mc)
The details of the mix design of the concrete foam are summarized in Table 1. Particularly, a commercial locally available cement, namely Cement CEM I 42.5 R (from Heidelberg Cement Group—Mainz plant, Germany) was used for casting the cement paste. In this sense, a three-step procedure was followed. First, the binder paste was produced using a high-performance slurry mixer, which ensured a homogenous cementitious matrix. Next, the aqueous foam made of protein hydrolysate was generated by employing a commercial foaming PANTAPOR FA system [24]. Finally, both components were mixed together in a classical lab mortar mixer. In this regard, it is important to consider that large density differences between the foam and binder paste can often cause obstructions, which may compromise efficient and well-done mixing. Previous tests demonstrated that single-shaft compulsory mixers with a double-helical mixing tool are quite suitable for successfully mixing these two phases. Last, a hardening accelerator (DARASET 304 (BE) [36], according to EN 934-2: T7 [37]) was added to achieve a faster development of structural strength and avoid foam structure decays. Its quantity, which varies from 0.5 to 1.5 kg (mass in 1 m3), has to be adjusted on the basis of the WiB TU Darmstadt experience and can vary and be adjusted mixture-by-mixture.

Table 1.
Standard mix design of the investigated ultralightweight mineralized foam (w/c = 0.4).
The adopted casting procedure has the methodical advantage that all components can be individually admeasured and analyzed in advance before mixing them together. This makes the calculation of the mass flow more transparent, and the interdependencies between the used components/materials can be easily identified and analyzed.
The mix design for obtaining the ultralightweight mineralized foam with a target dry density of 180 kg/m3 is detailed in Table 1. This density can assure, on the one hand, reliable production, and on the other, adequate sensitivity to the boundary conditions of interest. However, in practice, it is almost impossible to cast mineralized foam that has exactly the designed/wished density. In this experimental campaign, the well over 100 test specimens casted had dry densities that varied between approximately 120 kg/m3 and 240 kg/m3.
2.2. Experimental Program
The experimental program was aimed at evaluating physical (e.g., specific weights and dry densities), thermal, and mechanical properties of the considered cementitious foams. The specific weights, dry densities, thermal conductivity (Section 2.2.1), and triaxial mechanical characterization (Section 2.2.2) were performed as schematically shown in Table 2. Then, rheometric tests based on a rotational viscometer were scheduled and shown in Section 2.2.3. Additionally, the poro-structure analyses and meso-geometry evaluations via 3D X-Ray and MIP are discussed and presented in Section 3.
Table 2.
Overview of the experimental program.
2.2.1. Thermal Conductivity Tests
The thermal conductivity was measured through the guarded hot plate method (Figure 1) for the considered mixture on three temperature levels (i.e., 10, 25, and 40 °C). Subsequently, the thermal conductivity of the dry material at 10 °C was extrapolated. The present test was carried out according to both DIN EN 12667:2001 [38] and ISO 8302:1991-08 [39].
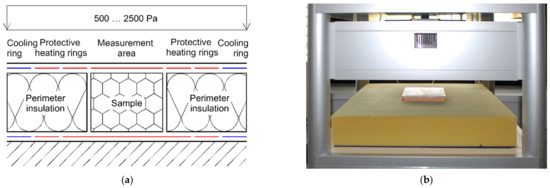
Figure 1.
(a) Hot plate equipment and (b) foam concrete specimen in the measurement device.
Auxiliary heaters (namely hot and cold plates) were placed at the top and bottom of the sample. A user-selectable temperature difference (ΔT) was established between the hot and cold plates. Once the thermal equilibrium was reached, the power input, Q, in the hot plate could be measured.
Thus, the thermal conductivity values under stationary heat transfer could be evaluated as follows:
where Q is the heat flow (measured total power) into the hot plate, d is the sample thickness, A is the measurement area, and ΔT is the mean temperature difference along the sample.
2.2.2. Mechanical Tests
The mechanical behavior was analyzed by performing Uniaxial (UC) and Triaxial (TC) Compression tests on cylindrical samples. For this purpose, a Tritech 50 kN testing machine from Wykeham Farrance (Figure 2a) was used. Tests were performed under displacement control and by adopting a displacement rate of 0.30 mm/min. In the case of the TC tests, uniform water pressure was applied to the samples, which were previously sealed inside a latex impermeable sleeve (Figure 2b,c). After the target confinement pressure was achieved, a uniaxial force was mechanically applied. Piston vertical displacements were obtained through a linear potentiometric transducer, with 25 mm travel placed at the head of the cell, as can be observed in Figure 2a.
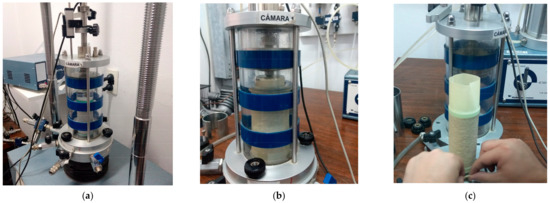
Figure 2.
Triaxial compression: (a) test setup, (b) confinement system, and (c) specimen detail.
The cylindrical specimens were taken from a large trestle of mineralized foam via core drilling. The samples had an average diameter of 49 mm with a nominal height of 100 mm. Slight variations of geometrical properties were detected, which were attributed to the sample preparation.
2.2.3. Rheometric Tests
A rotational viscometer (Figure 3) based on the Searle principle [40] was used to determine specific rheological parameters of the continuous foam phase. All experiments were carried out with the measuring rotor MV1 described in DIN 53019-1 and the corresponding measuring cup [41]. The evaluation of the measurement results was carried out with the software Haake Rheowin, version 4. The tests were carried out after a constant preload with a shear rate-controlled linearly increasing profile. During the production of the viscometrically examined continuous foam phase, the mixing technique for the glue was varied, along with the water-cement value. In addition to the colloidal mixer mentioned above, a high-performance mixer (type Eirich) was also used.
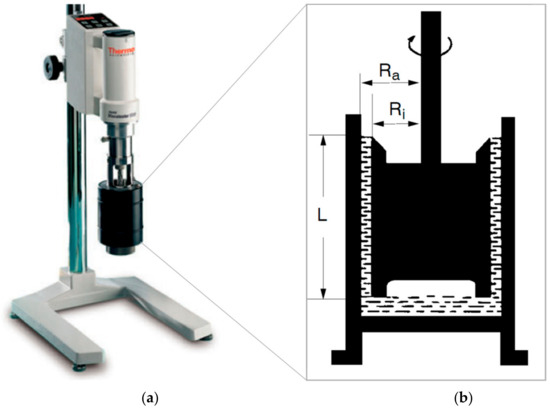
Figure 3.
HAAKE Viscotester 550 employed for the rheometric tests: (a) device and (b) sample details (L = 60 mm, Ri = 20.04 mm, and Ra = Ri + 0.96 mm).
3. Poro-Structure and Meso-Geometry
The study of geometric (micro-, meso-, and macro-) structure allows for the unique identification and classification of solidified mineralized foams. The evaluations of porous structures can be conducted on porous systems at (i) a macroscopic scale (identifying pores visible with the naked eyes, on the order of 1000 μm); (ii) a mesoscopic scale, using microscope data or 3D X-Ray scans (50–1000 μm); and (iii) a. microscopic scale via the Mercury Intrusion Porosimetry (MIP) technique (0–50 μm).
From a macroscopic standpoint, concrete foams can be classified by considering the average maximum bubble diameters, the homogeneity of their sizes and distributions, as well as the robustness of the skeleton lamellae (i.e., the double-layered membrane) that form the morphological framework of a mineralized foam. Poor or too-thin lamellae can result in either a bad bubble size/distribution or a substantial lack of meso-bubbles formed in the foam.
Four foam classes, presented in Figure 4, were recognized in this experimental activity. In this regard, the following observations can be made: foam class A had similar characteristics as B, but with larger maximum bubble diameters (approximately 1.5 mm, see Figure 4b). Foam class B showed a homogenous pattern of uniformly distributed macro-pores with a maximum diameter of approximately 1 mm (Figure 4a).
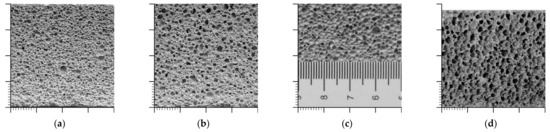
Figure 4.
Foam classes showing different foam morphologies: (a) B-type, (b) A-type, (c) C-type, and (d) D-type. Scale size shown in (c): major ticks represent cm while minor ones represent mm.
Foam class C showed a clear distribution of pores with very fine lamellae, leading to a smaller range of bubbles available in the system, i.e., mostly equally sized bubbles with a maximum diameter of approximately 2 mm (Figure 4c). Finally, foam class D showed similar bubble characteristics as C-type, but with a tendency for the bubble to merge in a later stage of the hydration process, resulting in irregular and larger pores. In addition, an enhanced tendency of bubble collapse could be observed in D foam types (Figure 4d). When considering all the foam classes, it can be seen that there was a clear tendency toward the formation of a polyhedral structure, depending on the bubble size and foam class. The structure was altered from a densely packed formation of spherical bubbles to a polyhedral bubble structure, in which most of the cement paste volume was located in the lamellae instead of being located in the nodes (forming the bulk volume of the continuous phase).
The assignment to the respective groups was only based on the pore pattern. In principle, the proposed class classification does not unconditionally coincide (or is not directly correlated) with the water-to-cement ratio value. The cement used and thus the setting speed was the same in each case. In fact, the mixing energy applied had a more significant effect. For the continuous foam phase of the classes shown, the flow curves were therefore determined in separate tests. The determined sets of curves are approximated in Figure 5 according to Cross [42]. Clear differences in the viscosity levels of the groups can be seen. On this basis, it appears possible to generate a specific pore class under viscosity control.
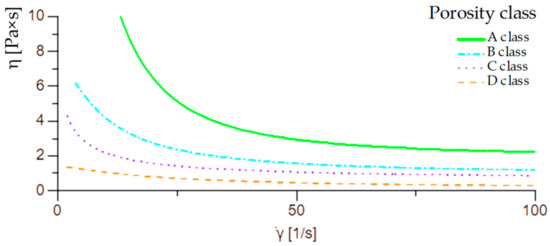
Figure 5.
Dynamic viscosity versus shear rate of the four foam types.
The aforementioned four classes of concrete foams have been also geometrically investigated at both the micro and meso-scale by performing MIP and 2D microscope analysis. The results of the full-range evaluated pore size distribution is provided in Figure 6.
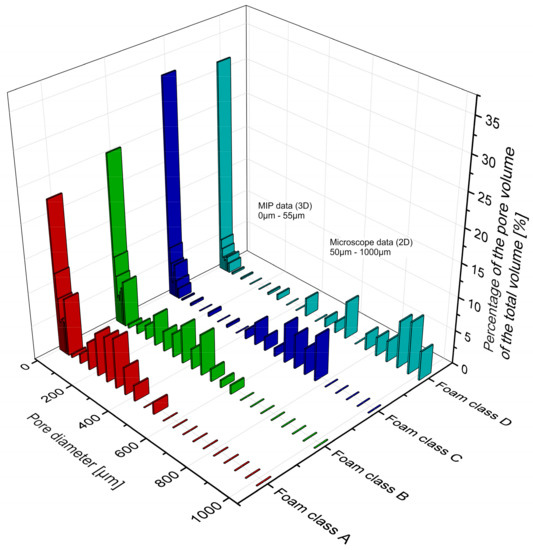
Figure 6.
Pore size distribution for the foam classes A to D (as in Figure 4) ranging from 0 to 1000 µm.
Here, it must be mentioned that the MIP results should be considered critically because of the effect of the pressure required to intrude the mercury into the pores as well as the ink-bottle effect. However, MIP still provided the ability to measure the pores at very small-scale levels, i.e., significantly below the microscopic scale, which also supported the idea to group the results in a meaningful way beforehand. In particular, combining the 3D test results from the MIP with the 2D results obtained from microscopic observation imaging required some computational effort. The computational methodology adopted for this was based on the standard EN 480-11 [43]. Finally, combining the final results of each measurement method was done in terms of relative proportions of the respective specific total pore volume, which also required a conversion with respect to the true solid fraction. The full analyses, discussion, and in-depth details about the geometrical classification and classes can be found in [24].
4. Overview of the Thermal Insulation Properties
The results of the thermal conductivity measurements, performed on 28 different samples, are shown in Figure 7. All experimental tests are performed after drying the specimens to a constant mass at 105 °C. The specimens were then wrapped in a sealing foil to prevent renewed water absorption. Measurements were performed on the sealed specimens, in which the influence of the foil on the thermal conductivity was neglected in the calculation. The measured temperatures corresponded to the normative boundary conditions for calculating the design conductivity value according to the ISO 10,456 standard (i.e., at 10 °C, 23 °C, and 40 °C). Particularly, the value λ10,dry was calculated from a linear regression procedure over three measured thermal conductivities, considering the mentioned temperatures for the boundary condition. The measured thermal conductivities values vs. the dry densities of the cementitious foams are plotted in Figure 7a. It can be observed that, in general, the thermal conductivity was higher for higher densities.
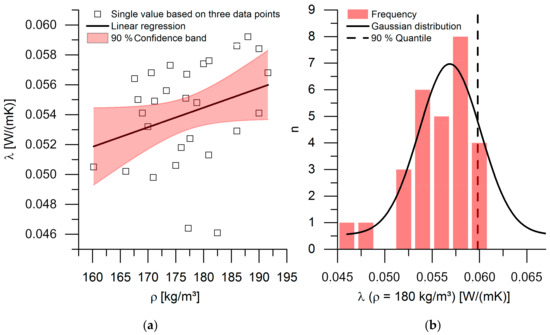
Figure 7.
(a) Measured thermal conductivities (average sample temperature at 10 °C) vs. the density of dried cementitious foams; (b) normal distribution of the parallel shifted values along the regression function.
As widely accepted in the literature, the results showed that the thermal conductivity was strongly affected by the porosity, pore sizes, distributions, and their connections. Particularly, the lightest concrete foams in Figure 7a (with ρ = 160.42 kg/m3) were characterized by λ = 0.0505 W/m × K, while the heaviest one (ρ = 191.55 kg/m3) was characterized by λ = 0.0568 W/m × K. Apart from the experimental scatters caused by the natural meso-porous character of the foams (and possible micro-to-meso cracks), Figure 7a shows a nearly linear dependence of the thermal conductivity against the dry density. In this figure, the linear regression plus the 90% confidence band of the experimental results are also reported. Finally, the characteristic value of 0.0590 W/(m × K) for a mineralized foam with a design density of 180 kg/m3 was calculated from the Gauss distribution shown in Figure 7b.
It is also worth mentioning that the influence of the pore sizes (and/or, indirectly, their distributions) on the heat transfer mechanism also cause the air velocity in the empty pores and/or air bubbles to be affected by convection. However, for pore and/or air void sizes less than 4 mm, the convection mechanisms are mainly neglected [44]. In fact, all concrete foams investigated in this paper had a maximum void size of 2 mm, which is far below the aforementioned threshold, making the influence of a convection mechanism very unlikely.
5. Mechanical Tests
5.1. Mechanical Tests Results
In this section, the results of the uniaxial (UC) and triaxial (TC) compression tests are presented. They refer to a total of 15 tested cylindrical samples.
Four specimens were tested under UC. The obtained stress–strain curves are presented in Figure 8a, where the plots in continuous lines correspond to a displacement rate of 0.30 mm/min, while the dashed line corresponds to a higher rate of 1.00 mm/min. The obtained peak stress results (in MPa) were 0.252, 0.283, 0.223, and 0.251, corresponding to peak strains (in mm/mm × 10−3) of 39.0, 28.6, 45.3, and 20.6, respectively. The mean compressive strength was equal to 0.25 MPa, and the related mean peak strain was 38.4 mm/mm × 10−3. In comparison with standard- and normal-strength concrete (e.g., characterized by strengths of 25/30 MPa), the compressive strength of the analyzed foam material was 1.0% of normal concrete, while the peak strain was almost 15 times that of the typical value of normal concrete.
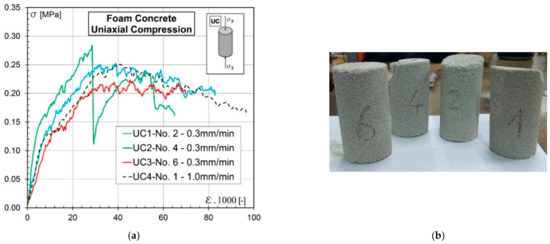
Figure 8.
Uniaxial Compression tests: (a) stress–strain curves and (b) images of failure modes.
Therefore, it can be concluded that mineralized cementitious foams are extremely deformable and present a highly nonlinear behavior, as can be observed in the stress–strain curves in Figure 8a. The images in Figure 8b show the final aspect of the samples after the compression tests. It can be seen that integrity was not lost in any case except in the sample tested under the highest displacement rate. However, the ultimate load was achieved by an asymmetrical deformation, causing an inclination of either the top or the bottom surface of the specimen.
Figure 9, Figure 10, Figure 11 and Figure 12 show the results of the triaxial compression samples. Before performing such tests, preliminary trials were conducted in order to decide the confinement pressures to be imposed. In Figure 9, a sample can be seen that was subjected to a confinement of 0.25 MPa, which represents 100% of the uniaxial compressive strength (i.e., fc). This confinement caused the total disaggregation of the specimen before the application of an increasing compressive load.
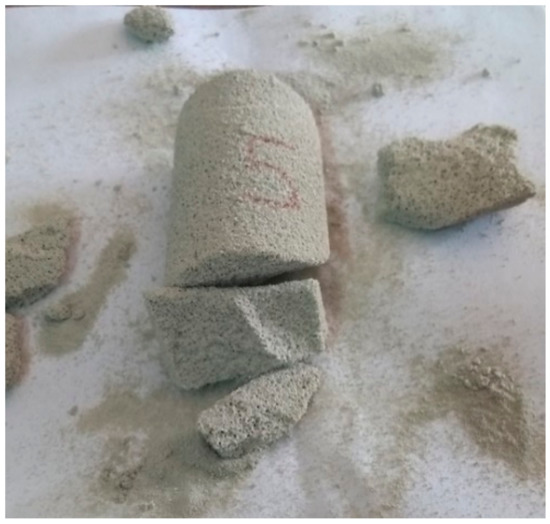
Figure 9.
Triaxial compression tests: sample failure under a confinement equal to mean compression strength.
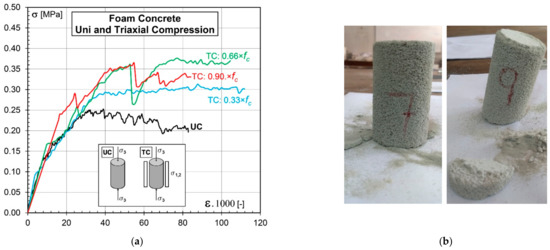
Figure 10.
Triaxial compression tests: (a) stress–strain curves and (b) images of failure modes.
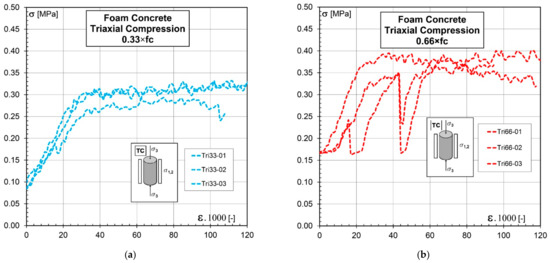
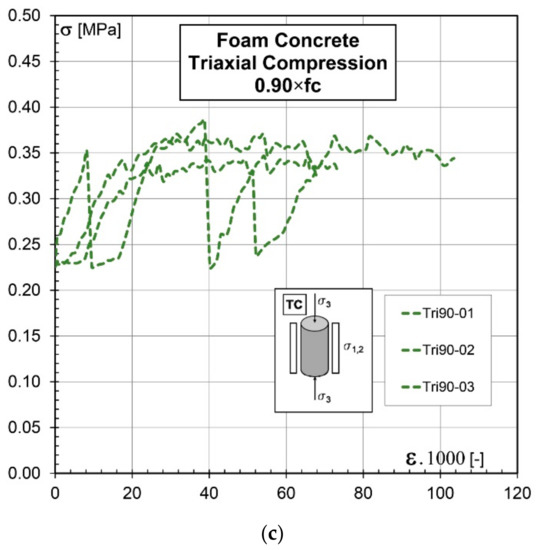
Figure 11.
Stress–strain curves of TC tests: (a) 33% × fc, (b) 66% × f, and (c) 90% × fc.
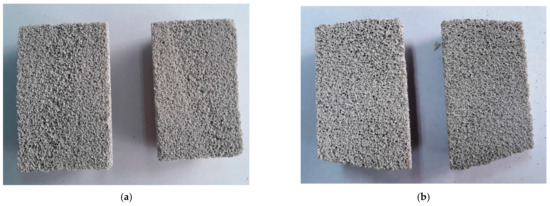
Figure 12.
Triaxial compression tests: view of sawed samples after failure under a confinement level of (a) 0.33 fc and (b) 0.66 fc.
Based on these preliminary tests, three confinement levels of the mean uniaxial compressive strength were adopted: 33% ×, 66% ×, and 90% × fc. Three samples/repetitions were tested in each case; the mean stress–strain curves are plotted in Figure 10a, while all data are presented in Figure 11. It can be observed that a confinement of 33% × fc caused an increase in strength and an almost perfect elastic–plastic behavior of the post-peak response. However, higher levels of confinements, such as 66% × fc and 90% × fc were characterized by very unstable behavior, which can be observed in the irregular mean curves in the stress–strain behavior.
The images in Figure 10b show the final aspect of two samples after the TC test. The photo on the left, corresponding to sample number 7 with a confinement level of 33% × fc, shows that the failure mode was not much different from that corresponding to the UC. However, the image on the right side, corresponding to sample number 9 with a (higher) confinement level of 66% × fc, shows a much more pronounced final inclination of the extreme surfaces of the sample, with an important loss of material in form of dust/powder.
5.2. Failure Mode Observed in the Mechanical Tests
It is interesting to note that (important/macro-) cracks were not observed in any of the analyzed cases. It was evident that the damage and failure process in foam concrete was represented by the disaggregation of the material skeleton. It was also observed that this disaggregation process always occurs in coincidence with the zone where the loads are concentrated. To confirm the latter, the tested samples number 7 and 9 in Figure 10b were cut using a band saw and analyzed. The cut samples are presented in Figure 12, in which it can be observed that damage was not appreciable in the middle of the height but was considerable at the upper and lower extremes of the specimens.
The observations of the tested samples indicate that failure seems to be driven first by a local collapse of the skeleton structure (similar to those in honeycomb compaction processes), namely “pore walls”. This failure is followed by the crushing of the adjacent pores, which in turn produces the overcharging of other pore walls, resulting in their failure. In structural engineering, this failure mechanism is called “progressive collapse”, a term that also appears applicable for describing the failure process of the analyzed highly porous cementitious foams.
Therefore, it can be concluded that the compressive strength of the foam is governed by the local resistance of the “pore wall planes”, which certainly can be influenced by their local slenderness, i.e., the ratio between the effective length and the wall thickness. Once a local failure is reached, a progressive collapse mechanism begins, leading to a global elasto-plastic behavior.
In view of the deformation capacity shown in the experimental tests, the behavior of this material under uniaxial and triaxial compression can be classified as quasi-ductile, with the distinguishing characteristic that it presents almost no lateral strain, and consequently, the volumetric strains are mainly constituted by the axial ones, which explains why confinement cannot substantially improve the compressive strength.
6. Concluding Remarks
This paper reports the results and analysis of an experimental program for investigating the failure mechanisms of highly porous cementitious foams under triaxial stress states. The mechanical experiments were accompanied by thermal tests to observe the effect that air voids have on the resulting insulation properties and by micro-to-meso structural geometric studies to identify and classify the considered mineralized foams.
Based on the results reported in this work, the following concluding comments can be drawn:
- Four foam (porous) classes were recognized in this experimental activity: foam class A, having similar characteristics as B, but with larger maximum bubble diameters (of approximately 1.5 mm); foam class B, with uniformly distributed macro-pores with a maximum diameter of approximately 1 mm; foam class C, with a clear distribution of pores with very fine lamellae and equally sized bubbles with a maximum diameter of approximately 2 mm; and foam class D, with the enhanced tendency of bubble collapse, leading to higher air bubble diameters (larger than 2 mm). In all foam classes, there was a clear tendency toward the formation of a polyhedral structure, depending on the bubble size.
- Conductivity tests showed that the lightest concrete foams, characterized by ρ = 160.42 kg/m3, had a thermal conductivity of λ = 0.0505 W/m×K, while the heaviest ones (i.e., ρ = 191.55 kg/m3) had a thermal conductivity of λ = 0.0568 W/m×K. A quite nearly linear dependence of the thermal conductivity against the dry density could be observed.
- However, the large variance in the values of the thermal conductivity indicates the complex relationships between thermal conductivity, the bulk density, the pore distribution, the water-cement value, and the glue composition of the composites.
- With respect to the mechanical and failure behaviors of the analyzed foam concrete, from the experimental campaign, it can be concluded that under uniaxial compression, the material presents a very low strength in comparison with standard concrete but a quite high ductility.
- Under triaxial compression, if a low confinement level is considered (i.e., on the order of 30% of the compressive strength), improvements in strength and ductility can be observed.
- For the levels of confinement (i.e., higher than 30% of the compressive strength), the damage caused by confinement does not permit further benefits in terms of strength and/or ductility/toughness.
- In all analyzed cases corresponding to uniaxial and triaxial compressions, it was observed that the damage in the foam concrete was represented by the disaggregation of the material skeleton (this failure mechanism was called “progressive collapse”). Moreover, it was also observed that this damage took place often in coincidence with the zone where loads are locally applied.
The proposed experimental results can be considered as a fundamental step toward the development of a meso-scale model to evaluate the local fracture behavior and strength of the inner skeleton behavior of the considered highly porous structure. Particularly, developing a fracture-based model for investigating how the paste strength and related components affect the cracking properties of foam lamellas (representing the skeleton structure of the composite and controlling the so-called “progressive collapse” mechanism) represents a future research direction that will follow from this study.
Author Contributions
Conceptualization, A.C. and A.G.-B.; methodology—materials, methods, and processing, A.G.-B., P.F. and A.M.; data curation, everybody; writing—original draft preparation, A.C.; writing—review and editing, all authors; supervision, A.G.-B. and P.F.; project administration, E.A.B.K. and A.C.; funding acquisition, A.G.-B., E.A.B.K. and A.C. All authors have read and agreed to the published version of the manuscript.
Funding
The authors gratefully acknowledge the financial support of this work by the Universidad de Buenos Aires, UBA (Project UBACyT 2018 No. 20020170200382BA). The support to networking activities provided by the SUPERCONCRETE Project (H2020-MSCA-RISE-2014 n 645704; http://www.superconcrete-h2020.unisa.it/ accessed on 4 August 2021) funded by the EU is gratefully acknowledged. This work represents a preliminary study of the research activities of the NRG-STORAGE project (number 870114, www.nrg-storage.eu accessed on 4 August 2021), financed by the European Union H2020 Framework under the LC-EEB-01-2019 call, H2020-NMBP-ST-IND-2018-2020/H2020-NMBP-EEB-2019, IA type.
Acknowledgments
The authors gratefully acknowledge the valuable contributions of Franco Dios, Marianela Ripani, Eng. Hernan Xargay, and the staff of the Soils Laboratory of FIUBA in the development and execution of the experimental program.
Conflicts of Interest
The authors declare no conflict of interest.
References
- Ürge-Vorsatz, D.; Cabeza, L.F.; Serrano, S.; Barreneche, C.; Petrichenko, K. Heating and cooling energy trends and drivers in buildings. Renew. Sustain. Energy Rev. 2015, 41, 85–98. [Google Scholar] [CrossRef] [Green Version]
- Available online: https://ec.europa.eu/energy/topics/energy-efficiency/heating-and-cooling_en?redir=1 (accessed on 4 August 2021).
- Available online: https://ec.europa.eu/energy/topics/energy-efficiency/energy-efficient-buildings/nearly-zero-energy-buildings_it (accessed on 4 August 2021).
- Available online: https://www.bmwi.de/Redaktion/EN/Dossier/enhancing-energy-efficiency-in-buildings.html (accessed on 4 August 2021).
- Lu, Z.; Hanif, A.; Lu, C.; Liu, K.; Sun, G.; Li, Z. A novel lightweight cementitious composite with enhanced thermal insulation and mechanical properties by extrusion technique. Constr. Build. Mater. 2018, 163, 446–449. [Google Scholar] [CrossRef]
- Batool, F.; Rafi, M.M.; Bindiganavile, V. Microstructure and thermal conductivity of cement-based foam: A Review. J. Build. Eng. 2018, 20, 696–704. [Google Scholar] [CrossRef]
- Wu, Y.; Wang, J.Y.; Monteiro, P.J.; Zhang, M.H. Development of ultra-lightweight cement composites with low thermal conductivity and high specific strength for energy efficient buildings. Constr. Build. Mater. 2015, 87, 100–112. [Google Scholar] [CrossRef]
- Asadi, I.; Shafigh, P.; Hassan, Z.F.B.A.; Mahyuddin, N.B. Thermal conductivity of concrete–A review. J. Build. Eng. 2018, 20, 81–93. [Google Scholar] [CrossRef]
- Cavalline, T.L.; Castrodale, R.W.; Freeman, C.; Wall, J. Impact of lightweight aggregate on concrete thermal properties. ACI Mater. J. 2017, 114, 945–956. [Google Scholar] [CrossRef]
- Hall, M.R.; Najim, K.B.; Hopfe, C.J. Transient thermal behaviour of crumb rubber-modified concrete and implications for thermal response and energy efficiency in buildings. Appl. Therm. Eng. 2012, 33, 77–85. [Google Scholar] [CrossRef] [Green Version]
- Benmansour, N.; Agoudjil, B.; Gherabli, A.; Kareche, A.; Boudenne, A. Thermal and mechanical performance of natural mortar reinforced with date palm fibers for use as insulating materials in building. Energy Build. 2014, 81, 98–104. [Google Scholar] [CrossRef]
- Sariisik, A.; Sariisik, G. New production process for insulation blocks composed of EPS and lightweight concrete containing pumice aggregate. Mater. Struct. 2012, 45, 1345–1357. [Google Scholar] [CrossRef]
- Mo, K.H.; Lee, H.J.; Liu, M.Y.J.; Ling, T.C. Incorporation of expanded vermiculite lightweight aggregate in cement mortar. Constr. Build. Mater. 2018, 179, 302–306. [Google Scholar] [CrossRef]
- Zeng, Q.; Mao, T.; Li, H.; Peng, Y. Thermally insulating lightweight cement-based composites incorporating glass beads and nano-silica aerogels for sustainably energy-saving buildings. Energy Build. 2018, 174, 97–110. [Google Scholar] [CrossRef]
- Weigler, H.; Karl, S. Structural lightweight aggregate concrete with reduced density—lightweight aggregate foamed concrete. Int. J. Cem. Compos. Lightweight Concr. 1980, 2, 101–104. [Google Scholar] [CrossRef]
- Mandilaras, I.; Atsonios, I.; Zannis, G.; Founti, M. Thermal performance of a building envelope incorporating ETICS with vacuum insulation panels and EPS. Energy Build. 2014, 85, 654–665. [Google Scholar] [CrossRef]
- An, W.; Sun, J.; Liew, K.M.; Zhu, G. Effects of building concave structure on flame spread over extruded polystyrene thermal insulation material. Appl. Therm. Eng. 2017, 121, 802–809. [Google Scholar] [CrossRef]
- Bogdan, M.; Hoerter, J.; Moore JR, F.O. Meeting the insulation requirements of the building envelope with polyurethane and polyisocyanurate foam. J. Cell. Plast. 2005, 41, 41–56. [Google Scholar] [CrossRef]
- Sohn, J.L.; Kalbar, P.P.; Banta, G.T.; Birkved, M. Life-cycle based dynamic assessment of mineral wool insulation in a Danish residential building application. J. Clean. Prod. 2017, 142, 3243–3253. [Google Scholar] [CrossRef] [Green Version]
- Siligardi, C.; Miselli, P.; Francia, E.; Gualtieri, M.L. Temperature-induced microstructural changes of fiber-reinforced silica aerogel (FRAB) and rock wool thermal insulation materials: A comparative study. Energy Build. 2017, 138, 80–87. [Google Scholar] [CrossRef]
- Hill, C.; Norton, A.; Dibdiakova, J. A comparison of the environmental impacts of different categories of insulation materials. Energy Build. 2018, 162, 12–20. [Google Scholar] [CrossRef]
- Silva, N.; Mueller, U.; Malaga, K.; Hallingberg, P.; Cederqvist, C. Foam concrete-aerogel composite for thermal insulation in lightweight sandwich facade elements. In Proceedings of the 27th Biennial National Conference of the Concrete Institute of Australia in Conjunction with the 69th RILEM Week, Melbourne, Australia, 30 August–2 September 2015; pp. 1355–1362. [Google Scholar]
- Yu, S.J.; Wang, Y.L.; Duan, B.J.; Zhou, J.W.; Yang, F.; Wang, X.G.; Liang, D.L. Fireproof performance of foam concrete insulation board. In Advanced Materials Research; Trans Tech Publication Ltd.: Baech, Switzerland, 2011; Volume 250, pp. 474–479. [Google Scholar]
- Gilka-Bötzow, A. Stabilität von ultraleichten Schaumbetonen; Springer Fachmedien Wiesbaden: Wiesbaden, Germany, 2016. [Google Scholar]
- Falliano, D.; De Domenico, D.; Ricciardi, G.; Gugliandolo, E. Experimental investigation on the compressive strength of foamed concrete: Effect of curing conditions, cement type, foaming agent and dry density. Constr. Build. Mater. 2018, 165, 735–749. [Google Scholar] [CrossRef]
- Abdullah, M.M.A.B.; Hussin, K.; Bnhussain, M.; Ismail, K.N.; Yahya, Z.; Abdul Razak, R. Fly ash-based geopolymer lightweight concrete using foaming agent. Int. J. Mol. Sci. 2012, 13, 7186–7198. [Google Scholar] [CrossRef]
- He, J.; Gao, Q.; Song, X.; Bu, X.; He, J. Effect of foaming agent on physical and mechanical properties of alkali-activated slag foamed concrete. Constr. Build. Mater. 2019, 226, 280–287. [Google Scholar] [CrossRef]
- Kuzielová, E.; Pach, L.; Palou, M. Effect of activated foaming agent on the foam concrete properties. Constr. Build. Mater. 2016, 125, 998–1004. [Google Scholar] [CrossRef]
- Liu, Y.; Leong, B.S.; Hu, Z.T.; Yang, E.H. Autoclaved aerated concrete incorporating waste aluminum dust as foaming agent. Constr. Build. Mater. 2017, 148, 140–147. [Google Scholar] [CrossRef]
- Schneider, T.; Schober, G.; Greil, P. Numerical modelling of the strength of highly porous aerated autoclaved concrete. In Materials Research Society Symposium Proceedings; Materials Research Society: Cambridge, UK, 1998; Volume 521, pp. 21–26. [Google Scholar]
- Bouguerra, A.; Aït-Mokhtar, A.; Amiri, O.; Diop, M.B. Measurement of thermal conductivity, thermal diffusivity and heat capacity of highly porous building materials using transient plane source technique. Int. Commun. Heat Mass Transf. 2001, 28, 1065–1078. [Google Scholar] [CrossRef]
- Nguyen, T.T.; Bui, H.H.; Ngo, T.D.; Nguyen, G.D. Discrete element modelling of the mechanical behaviour of a highly porous foamed concrete. In Poromechanics VI, Proceedings of the Sixth Biot Conference on Poromechanics, Paris, France, 9 July 2017–13 July 2017; ASCE: Paris, France, 2017; pp. 1380–1387. [Google Scholar]
- Dunant, C.F.; Bary, B.; Giorla, A.B.; Péniguel, C.; Sanahuja, J.; Toulemonde, C.; Tran, A.-B.; Willot, F.; Yvonnet, J. A critical comparison of several numerical methods for computing effective properties of highly heterogeneous materials. Adv. Eng. Softw. 2013, 58, 1–12. [Google Scholar] [CrossRef]
- She, W.; Zhang, Y.; Jones, M.R. Three-dimensional numerical modeling and simulation of the thermal properties of foamed concrete. Constr. Build. Mater. 2014, 50, 421–431. [Google Scholar] [CrossRef]
- Gilka-Bötzow, A.; Zimmer, M.; Koenders, E.A.B. Material Properties of mineralized foam and its density dependency—A meta-study. S. 12284–1295. In Proceedings of the International Conference on Concrete Sustainability (ICCS16), Madrid, Spain, 13–15 June 2016. [Google Scholar]
- DARASET 304 (BE) (2018) Chloride-Free, Hardening Accelerator for Concrete acc. EN 934–2: T7. Available online: https://gcpat.uk/sites/uk.gcpat.com/files/pdf/current/resource/9171__daraset_304_en-gb.pdf (accessed on 5 October 2020).
- DIN EN 934-2 (2012-08-00). Admixtures for Concrete, Mortar and Grout-Part 2: Concrete Admixtures; Definitions, Requirements, Conformity, Marking and Labelling, German version EN 934-2:2009+A1:2012; Beuth Verlag: Berlin, Germany, 2009. [Google Scholar]
- DIN EN 12667 (2001-05-00). Thermal Performance of Building Materials and Products Determination of Thermal Resistance by Means of Guarded Hot Plate and Heat Flow Meter Methods Products of High and Medium Thermal Resistance, German version EN 12667:2001; Beuth Verlag: Berlin, Germany, 2001. [Google Scholar]
- ISO 8302. Thermal insulation—Determination of Steady-State Thermal Resistance and Related Properties—Guarded Hot Plate Apparatus; International Organization for Standardization: Geneva, Switzerland, 1991. [Google Scholar]
- Mezger, T.G. Das Rheologie-Handbuch; Vincentz Network: Hannover, Germany, 2010. [Google Scholar]
- DIN 53019-1 (2008-09-00). Viskosimetrie—Messung von Viskositäten und Fließkurven mit Rotationsviskosimetern—Teil 1: Grundlagen und Messgeometrie; Beuth Verlag: Berlin, Germany, 2008. [Google Scholar]
- Cross, M.M. Rheology of non-Newtonian fluids: A new flow equation for pseudoplastic systems. JCOSCI J. Colloid Sci. 1965, 20, 417–437. [Google Scholar] [CrossRef]
- DIN EN 480-11 (2005-12-00). Admixtures for Concrete, Mortar and Grout—Test Methods—Part 11: Determination of Air Void Characteristics in Hardened Concrete; German Version EN 480-11:2005; Beuth Verlag: Berlin, Germany, 2005. [Google Scholar]
- Collishaw, P.G.; Evans, J.R.G. An assessment of expressions for the apparent thermal conductivity of cellular materials. J. Mater. Sci. 1994, 29, 2261–2273. [Google Scholar] [CrossRef]
Publisher’s Note: MDPI stays neutral with regard to jurisdictional claims in published maps and institutional affiliations. |
© 2021 by the authors. Licensee MDPI, Basel, Switzerland. This article is an open access article distributed under the terms and conditions of the Creative Commons Attribution (CC BY) license (https://creativecommons.org/licenses/by/4.0/).