Abstract
In this study, aluminum foams reinforced with different steel elements were produced by the AluLight process. The master alloy AlMgSi0.6 was used as the matrix material, titanium hydride (TiH2) powder was used as a foaming agent, and steel wire, cylindrical steel mesh and flat steel mesh were used as reinforcing elements. Reinforcements were placed inside the mold, along with the precursors, and samples were manufactured by gas releasing particles in a semi-solid state. To examine the effect of the reinforcements on specific energy absorption, quasi-static uniaxial compression tests were carried out, with a constant separation rate of 1 mm/s. From the tested results, the energy absorption per unit volume and specific energy absorption efficiency were calculated and then also statistically evaluated. The results showed that examined shapes of reinforcements affect differently specific energy absorption and its efficiency, compared to non-reinforced aluminum foams. The best result obtained was with cylindrically shaped steel mesh.
1. Introduction
Metal foams are considered a new material, but they are still imperfectly characterized. The combination of their properties, such as low-density and great mechanical, electrical and acoustic properties, make them ideal for lightweight structures, energy absorption and thermal regulation [1]. The greatest advantage of their properties is a cellular structure that imitates other cellular structures that can be found in nature, such as wood or bones [2]. They have been attracting considerable attention in the past few years and have the potential to be used in the automotive industry. A motive for that, especially in the 21st-century, is a rapid increase in air pollution and global warming, which is directly in correlation with the greater use of fossil fuels. Weight reduction is one of the ways to reduce fuel consumption, and metal foams stand as the material with great potential for that [3,4]. Tubular structures are the most commonly implemented and recognized energy–absorption devices in automotive industries.
Recently, aluminum foams are widely investigated and used as an alternative to bulk aluminum and aluminum alloys in engineering applications. Aluminum itself is widely used in automotive, aerospace and shipbuilding industries because of its lightweight property, low density, relatively high strength and high ratio of strength to density (specific strength), excellent corrosion resistance and very simple machining. It is easily recyclable, environmentally friendly and sustainable [5]. Tubular structures are the most commonly implemented and recognized energy–absorption parts in the automotive industry, where these devices are crucial for the safety of passengers [6]. One of the interesting characteristics of aluminum foams is sound absorption ability. It is an important property for before mentioned industries where aluminum foams can absorb high and low frequencies, depending on the type of foam [7]. Aluminum foams have superior properties due to the combination of aluminum and foam structure properties, and they continue to attract interest from the science and technology communities [5,8]. The mechanical properties of aluminum foams are of great interest, and they depend on relative density, cell topology, and cell size, shape and distribution. There can be two distinct types of cells—open and closed ones. Mechanical properties can be tested under different conditions, from low to high temperatures, with different densities [9]. Amaro et al. [1] have given a brief review of the influence of these parameters on the mechanical properties of aluminum foams. Most importantly, aluminum can appear in different variations in aluminum foam—in a pure condition and as a metal matrix. That way, aluminum foams and aluminum matrix syntactic foams can have broader engineering applications [10]. Aluminum foams can be a filling material to improve the stiffness of hollow sections, which demands the full characterization of their mechanical properties [11].
One way to improve the mechanical properties of aluminum foams is to internally reinforce them. Internal reinforcements are a new approach to improving the mechanical properties of aluminum foams. According to Solórzano et al. [12], these composite materials are made of aluminum foams that serve as a base, and net-shape steel sheets are cores that are placed in the inner part of the foam. They are made via in-situ foaming of precursor material, which is produced by the powder metallurgy method. They acknowledged that this kind of reinforcement in aluminum foams benefits in compression (as compared to non-reinforced foams). Linul et al. [13] showed how stainless steel mesh as reinforcement improved the mechanical properties of aluminum foams made of foamable precursor material. Reinforcements were infiltrated with molten material at high temperatures and have formed a metallurgical bond between the aluminum foam and stainless steel. Linul et al. [14] has also shown how metal foam matrix composites collapse under static and dynamic loading condition, which is of great importance for their complete understanding. They have investigated closed-cell aluminum foam as core material with stainless-steel mesh as faces or skin material. Stainless-steel mesh had two iterations—one type was longitudinal mesh, and another was transversal. These different types of meshes directly influenced the initiation and propagation of the collapse mechanism. In another work, Linul et al. [15] showed how manufacturing foam matrix composites is extremely cost-effective—if one manufactures with plain foams, it is only necessary to insert the reinforcements into the mold before the foaming. Reinforced foams showed superior results in energy absorption, but it greatly depended on the reinforcement position. The reinforcements were made of stainless-steel mesh and investigated under cryogenic, room and high temperatures. Orbulov et al. [16] investigated compressive characteristics of bimodal aluminum matrix syntactic foams. Aluminum alloy was matrix material to produce metal matrix syntactic foams, and filler material were two grades of mixed oxide ceramic hollow spheres. Another way to investigate how reinforcements influence aluminum foams is to make sandwich structure, as Formisano et al. [8] investigated. The core was made of strips of foamable solid precursor (AluLight), and the skin was stainless steel wire mesh-grid. They showed how the sandwich panel had significant improvement on the mechanical properties of aluminum foams. Viscusi et al. [17] investigated aluminum foam cylinders with rectangular pieces of wire mesh, which was manually wrapped and side joined to form the cylindrical, flexible reinforcement around the precursor.
The objective of this study is to investigate aluminum foams with different kinds of inside reinforcements. The question stated is how they influence specific energy absorption and the specific energy absorption efficiency. The original intention of this work was to examine if adding different shaped reinforcements into aluminum foam core would positively influence mechanical properties. The obtained results were statistically evaluated by the chi-squared test (χ2 test).
2. Materials and Methods
2.1. Production Process and Samples Preparation
To successfully produce fourteen samples, the AluLight process of manufacturing metal foams were used. The molds were cylindrical and made of tool steel, dimensions Ø85 × 100 mm. The precursor used was made of AlMgSi0.6 and 0.4 wt % TiH2 (titanium hydride). The extruded bar was cut into smaller pieces, dimension 100 mm × 20 mm × 5 mm, and precursors weighed 430 g, per sample, with the addition of reinforcements made of S185 structural steel (according to EN 10027-1:2016). Reinforcements were made in three different shapes: steel wire element (dimension 48 mm × 48 mm × 95 mm, wire diameter 4 mm, cylindrical steel mesh (dimension 132 mm × 95 mm, the diameter of the bent mesh Ø35 mm, wire diameter 1.6 mm) were 125 g of the precursor was inside the cylindrically shaped mesh and 305 g outside of it, and flat steel mesh (40 mm × 95 mm, wire diameter 1.6 mm), as seen in Figure 1. Same steel meshes were used for cylindrical and flat reinforcements (the size of the holes in the meshes were the same). The reinforcements and the reinforced foams were weighed on the E. Mettler laboratory balance scale, type D5 #1262 (Mettler Toledo, Zürich, Switzerland). Only one steel wire element was added into the mold, as well as one cylindrical steel mesh, but two flat steel meshes were added in the mold, where precursor material was put between flat steel meshes, Figure 2.

Figure 1.
Reinforcement elements: (a) steel wire element, (b) cylindrically shaped steel mesh, (c) flat steel mesh.
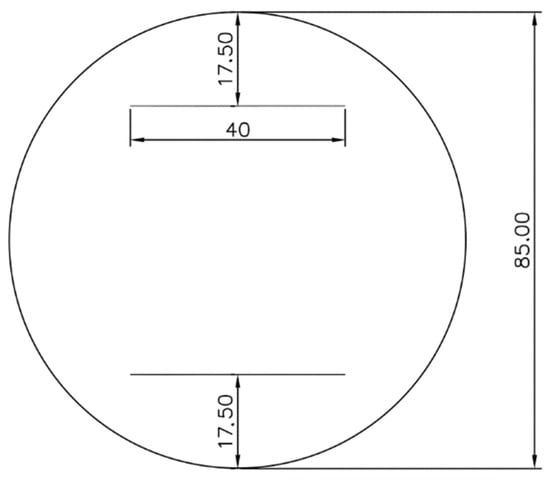
Figure 2.
Position of the flat steel meshes inside the mold.
When reinforcements were placed inside the mold, precursors were then added. Additional samples of non-reinforced aluminum foams were made to compare the results. They were, respectively, named as samples H (steel wire element, 5 samples), O (cylindrical mesh, 3 samples), III (steel mesh, 3 samples), and N (non-reinforced aluminum foams, 3 samples).
To produce these samples, aluminum alloy powder (AlMgSi0.6) was mixed with a product releasing gas (TiH2). TiH2 compound was a foaming agent—it began decomposing around ~465 °C, which is below the melting point of pure aluminum, 660 °C. In the process of powder metallurgy, the metal powder, in this case, aluminum alloy powder, and foaming agent, TiH2, are mixed and then extruded into a bar of near theoretical density. Then bars were placed inside the mold, alongside reinforcements, and heated. After some time in the furnace, TiH2 started decomposing in Ti and H2. Hydrogen gas created voids with high internal pressure. Voids were then expanded by semi-solid flow, and aluminum swelled, creating a foam that filled the mold, Figure 3 [5]. To produce these samples, an electric resistance furnace (Feliks Metal d.o.o., Zagreb, Croatia) with a power of 7.5 kW was used. The furnace was heated at 750 °C. After each mold was placed inside the furnace, the mean time to produce the sample was around 20 min. When melted aluminum started spilling out outside the vent, the mold was taken outside and was then partially cooled in the water at room temperature. While the mold was still warm, the sample was taken outside of the mold and cooled down to room temperature.
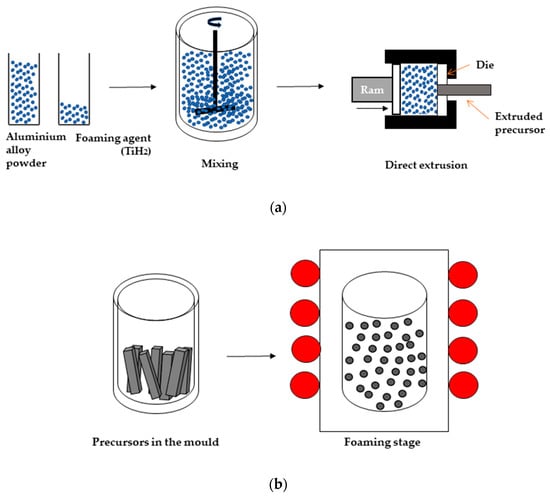
Figure 3.
Scheme of AluLight process of the production aluminum foams by gas releasing particles in semi-solids: (a) production of precursors, (b) production of aluminum foams according to [5].
There were problems with producing samples with steel wire reinforcement. Morphological and structural homogeneity at the bottom of the mold could not be obtained, which occurred with samples H1, H2 and H3. When the foaming time was prolonged with samples H4 and H5, some amount of melt spilled outside the mold, which affected the density; it was lower than expected, but homogeneity was satisfying. Non-reinforced samples and samples with two other types of reinforcement were foamed successfully, without any problems.
2.2. Quasi-Static Uniaxial Compression
A quasi-static uniaxial test was carried out by universal testing machine EU 40mod. (Werkstoffprüfamachinen GmbH, Leipzig, Germany), with maximum compression force of 400 kN. The test was performed at a crosshead separation rate of 1 mm/s.
Figure 4 shows how the specific energy absorption was determined, according to DIN 50134 2008-10 [18]. Plateau stress, Rplt, was determined as the arithmetic mean of the stresses that belong to strains at 20% and 40%. R130 is the point in the stress–strain curve, which is equal to:
when R130 is determined, Aplt-E is the total strain at R130 stress.
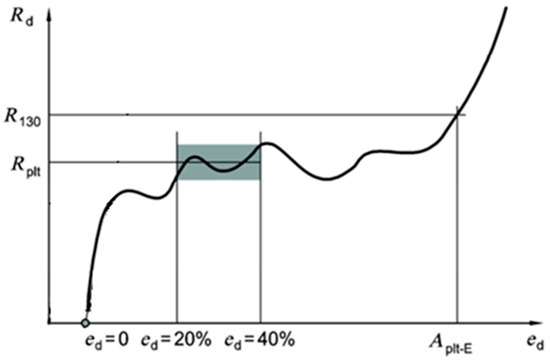
Figure 4.
Stress–strain curve for determining the characteristic values from a compression test of cellular material with a plateau area [18].
If the area under the curve is integrated by the equation:
where Ev (MJ/m3)—absorbed energy per unit volume, R (N/mm2)—stress, and ed (%)—strain. In this study, the specific energy absorption is calculated as the area under the curve in the stress–strain diagram up to the point of the total strain Aplt-E.
It is important to notice that the energy absorption of cylinders depends on various interactions between different deformation modes. The strain rate effects on energy absorption depend on the type of material. The effect of the strain hardening under impact load increases the impact force and reduces the deformation [19].
Specific energy absorption efficiency is also one of the important properties of the metal. Once the value of absorbed energy was determined, the samples can be compared with an “ideal” absorber whose energy is the area of a rectangle with dimensions determined by the value of stress R130 and the corresponding strain, Aplt-E. An “ideal” absorber will directly reach the maximum admissible stress and keep it constant during the whole process. The equation used for calculating specific energy absorption efficiency Eeff is:
where Ev (MJ/m3) is specific energy absorption related to the sample of the stress, R130 (N/mm2), and the strain, Aplt-E (%), at the end of the plateau [18].
2.3. The Chi-Squared Test (χ2 Test)
Statistical analysis was primarily used to investigate the highest contributing factor in specific energy absorption of produced aluminum foams. The analysis was performed by MINITAB 2019 software (version 19.1.1.0, Minitab LLC, State College, PA, USA).
The chi-squared test (χ2 test) is a family of tests based on a series of assumptions. It is widely used in the statistical analysis of experimental data [20]. This test was introduced by K. Pearson in 1900, and in 1922 R. A. Fisher introduced a significant modification of the test [20,21]. The main characteristics of these tests are goodness-of-fit (Pearson’s chi-squared test), the test of homogeneity and the test of independence (chi-squared test of association) [20]. The test is still widely used in industry, education and biological, medical and social science. It is used as statistical quality control for industry [21]. In this article, a goodness-of-fit test is used to study similarities between groups of categorical data. The probability distribution of a statistic is called a sampling distribution. There are many different sampling distributions where the chi-squared or χ2 distribution is an important sampling distribution [22].
3. Results and Discussion
3.1. Quasi-Static Uniaxial Compression Results
A major problem that occurred while producing samples was to achieve an acceptable stage of foaming. From Figure 5, it is evident that the precursors at the bottom of the sample are not fully foamed; they still have the bar shape. Precursor bars have not been joined at the outer alumina skin, which was still not broken. It was nonhomogeneous foaming with the low-temperature at one part of the mold, which is not acceptable. Samples H2 and H3 had the same problem during the production as sample H1. Samples H4 and H5 had the outer skin without irregularities and cracks, Figure 6.
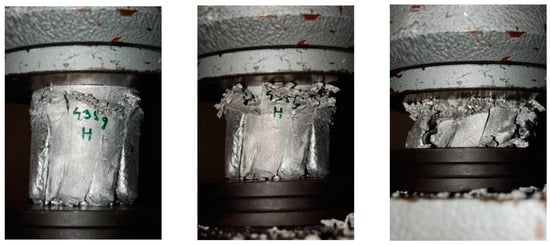
Figure 5.
The sample H1 under compression load and irregularities on outer skin.
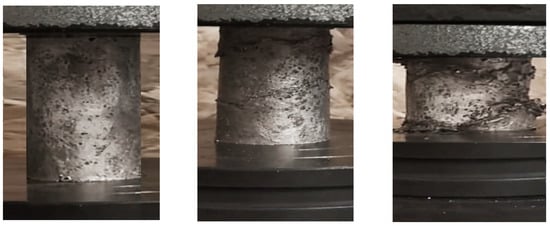
Figure 6.
The sample H4 under compression load.
Table 1 shows the values of mass and volume of the reinforcements themselves, the total mass of reinforced samples, the volume of the aluminum foams, densities and relative densities of the aluminum foams. Volume of the reinforcements, Vr (cm3), was determined by the equation:
where mr (g)—mass of the reinforcement and ρs (7.85 g/cm3)—density of the steel. Volume of the aluminum foam, Vf (cm3), was determined by the equation:
where Vm (567.4503 cm3)—volume of the mold. The equation used for determining the density of the aluminum foam, ρf (g/cm3), was:
where mp (430 g)—mass of the precursor. The relative density, ρr, was determined by the equation:
where ρAl (2.7 g/cm3)—density of the aluminum.

Table 1.
Mean values of mass, volume and densities.
There are small differences in the relative densities of the samples, which means that the values of absorbed energy can be compared with each other for all samples (with the exception of samples H4 and H5), regardless of whether they are reinforced or not, and regardless of the type of the reinforcement applied.
Figure 7, Figure 8, Figure 9 and Figure 10 show stress–strain curves for all types of used reinforcements and non-reinforced foams, with a plotted point on each curve according to which the absorbed energy is determined. The compression behavior of aluminum foams reinforced with steel wire elements is shown in Figure 7. There were initial problems while producing these samples where the foaming process was not successful (samples H1, H2 and H3). Samples H4 and H5 stood out in particular. They have absorbed less energy than the first three samples, but their curves are closer to the ones of the “ideal” absorbers—they have a long flat stress–strain plateau, which is explained with lower densities of these samples. Generally, curves are similar but not overlapping. Figure 8 shows stress–strain curves of aluminum foams reinforced with cylindrical wire mesh. O3 sample had an almost “ideal” force—deformation curve. The curves of O1 and O2 samples are overlapping, and they absorbed almost the same amount of energy. Stress–strain curves of aluminum foams reinforced with steel meshes are shown in Figure 9. Surprisingly, curves are almost completely overlapping, which is important for the replicability of aluminum foam behavior. Stress–strain curves for non-reinforced aluminum foams are shown in Figure 10. While curves do not look “ideal”, they are still overlapping in the linear plasticity region. Figure 11 shows the compression behavior for all 14 samples. The majority of the curves look similar under low deformation. As the deformations increase, the difference becomes more prominent. The initial load causes elastic deformation, but the starting line in most cases is not straight and has a lower slope than the one corresponding to the actual Young’s modulus of aluminum because some cells begin to locally yield even at very low loads. According to Gibson–Ashby model [5], bending takes place in the quasi-linear stage. When the stress reaches the compression limit, the cell collapse occurs, which initiates the densification of the foam until the final deformation of the densification. In the horizontal curves in Figure 7, Figure 8 and Figure 11, the cell walls are gradually deformed, while in the case of inhomogeneous distribution of deformations, there is local densifying, i.e., inhomogeneous density distribution along the sample, which requires an increase in load for further compression and the horizontality of the curve is lost.
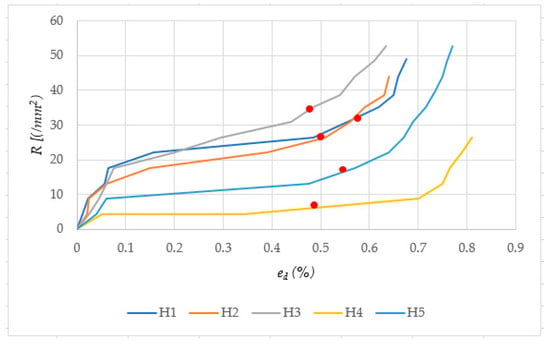
Figure 7.
Stress–strain curves for samples reinforced with steel wire element.
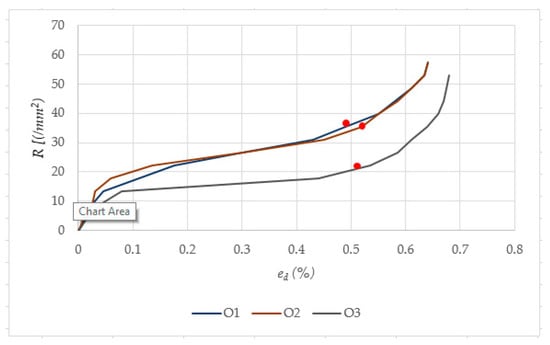
Figure 8.
Stress–strain curves for samples reinforced with cylindrical wire mesh.
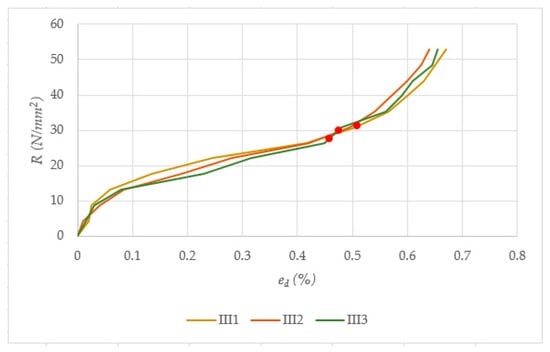
Figure 9.
Stress–strain curves for samples reinforced with flat steel meshes.
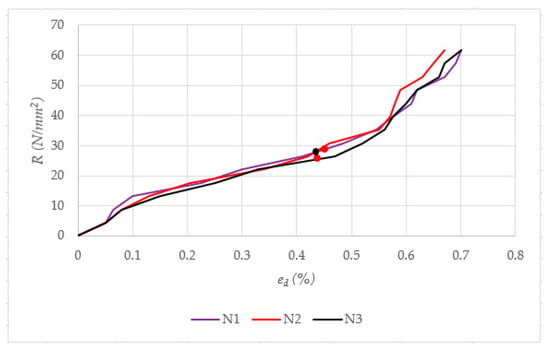
Figure 10.
Stress–strain curves for samples without reinforcements.
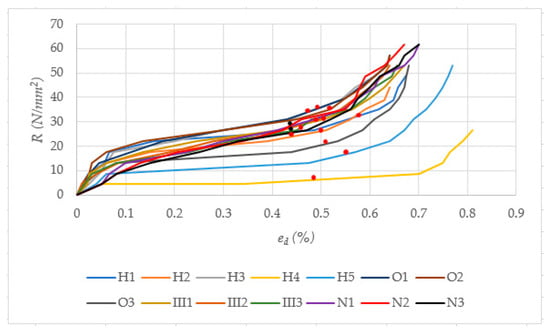
Figure 11.
Stress–strain curves of all samples.
Table 2 shows obtained results plateau stress (Rplt), plateau stress at the end of the plateau (R130), strain at the end of the plateau (Aplt-E), specific energy absorption (Ev) and specific energy absorption efficiency (Eeff) of each sample. Specific energy absorption and its efficiency are two properties of aluminum foams that are codependent and important for the production of aluminum foams. Absorbed energy can be high, but with the low-efficiency of the foam, which is not preferable.

Table 2.
Specific energy absorption and specific energy absorption efficiency.
The mean value of specific energy absorption for the H series samples was 4.01 MJ/m3 (without samples H1, H2, and H3, which were not taken into consideration due to the nonhomogeneous structure and poor foaming process), which is significantly lower (55.31%) compared to non-reinforced aluminum foams. The efficiency of the H4 sample is 71.58% and of the H5 sample is 73.14%, which is still high, considering the problems with the production of the H series of samples. It is interesting to notice that the H4 sample had an almost “ideal” stress–strain curve, alongside with O3 sample. The reason for this is the fact that the H4 and H5 samples have a slightly lower density and begin to compress at lower stresses, which ultimately results in a reduced possibility of energy absorption.
Cylindrical steel mesh reinforcement contributed the most to the specific energy absorption and its efficiency. O series of samples, observing the mean value for energy absorption (10.53 MJ/m3), absorbed 45.24% more energy than non-reinforced aluminum foams. O2 sample stood out, it individually absorbed the highest amount of energy (12.73 MJ/m3), but the O3 sample had the highest efficiency (71.43%).
Flat steel mesh reinforcement also contributed to the specific energy absorption, compared to the non-reinforced aluminum foams, but not as significantly as the O type of reinforcement (cylindrical steel mesh). Samples from the III series, observing the mean value for energy absorption (9.25 MJ/m3) and absorbed 27.58% more energy than non-reinforced aluminum foams. Generally, their individual values for energy absorption and efficiency were similar, although the sample III3 stood out with the lowest energy absorption in that series of samples (8.22 MJ/m3), which indicated good properties replicability of that series of aluminum composites. Aplt-E of the III series of samples is also approximately close. O and III series of samples absorbed more energy compared to non-reinforced aluminum foams. Adding the reinforcements (except steel wire element) contributed to the higher amounts of specific energy absorption and its efficiency.
3.2. Statistical Analysis and Evaluation
The chi-squared goodness-of-fit test was used, as mentioned in Part 2.3, to evaluate the alternative hypothesis and to compare the expected and observed values to determine how well the predictions fit the data. This statistical tool gives information on how different kinds of reinforcements directly affect energy absorption. The input parameters for statistical analysis are listed in Table 2, but obtained results from the H series of samples was not taken into consideration for the reasons states earlier. Therefore, only samples that had the same foaming time and similar densities were taken as the base of the statistical approach.
The question arises if the change of reinforcements affects specific energy absorption—null and alternative hypothesis needs to be tested. The null hypothesis, H0, stated that the population proportions in each category are consistent with the specified values in each category. The alternative hypothesis, H1, stated that the population proportions in each category are not consistent with the specified values in each category [23]. The null hypothesis in this paper stated that all groups of samples taken into evaluation (O, III and N) would have the same mean values of specific absorbed energy. The alternative hypothesis stated that the results are going to be different; some samples will exceed predicted results, and some will not.
Table 3 and Table 4 show the observed and expected values and the chi-squared goodness-of-fit test of energy absorption for all samples divided into three categories. The observed values are the actual results of energy absorption capacities in a sample that belongs to a category. The expected values are the number of observations that are expected to occur if the test proportions were true. Categories with a large difference between observed and expected values contribute more to the overall chi-squared statistic. Data in the chi-squared test consists of N, which represents the total sample size, DF, which represents degrees of freedom used to determine the p-value. Graphical representations of the results are shown in Figure 12 and Figure 13.

Table 3.
Observed and expected values of specific energy absorption for samples.

Table 4.
The results of the chi-squared test for samples.
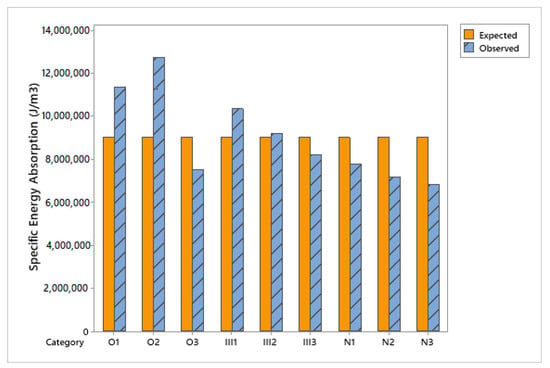
Figure 12.
Observed vs. expected specific energy absorption values.
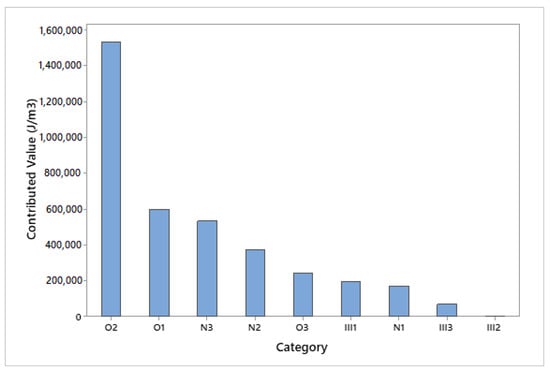
Figure 13.
Contribution of tested samples to the chi-squared value.
As shown in Table 3 and Table 4, the expected value of all samples was 9,014,444 J/m3, and the p-value was 0.00, which is less than the value of α, where the significance level is 0.05. Therefore, the null hypothesis H0 was rejected and concluded that the data does not follow a distribution with certain proportions. As seen from Figure 12, samples O1, O2, III1 and III2 were larger than expected values, which was confirmed with obtained experimental results. The highest contributing category to the chi-squared value was the O2 sample, which absorbed the highest amount of energy, Figure 13.
Table 5 and Table 6 and Figure 14 and Figure 15 show the observed and expected values and the chi-squared goodness-of-fit test of energy absorption concerning mean values in individual categories of samples. That way, it can be seen which type of reinforcement, in general, contributed more to the specific energy absorption. Table 6 shows that p-value ≤ α and the null hypothesis H0 was rejected. Figure 14 shown that O and III types of reinforcements had larger observed values than expected ones, and they had better results than non-reinforced aluminum foams, which was confirmed with obtained experimental results. N series of samples was the highest contributing category to the chi-squared value by category, and they absorbed the least amount of energy, Figure 15. III type of reinforcement had the lowest contribution to it because their observed values are closest to the expected ones.

Table 5.
Observed and expected mean values of specific energy absorption by sample categories.

Table 6.
The results of the chi-squared test for sample categories.
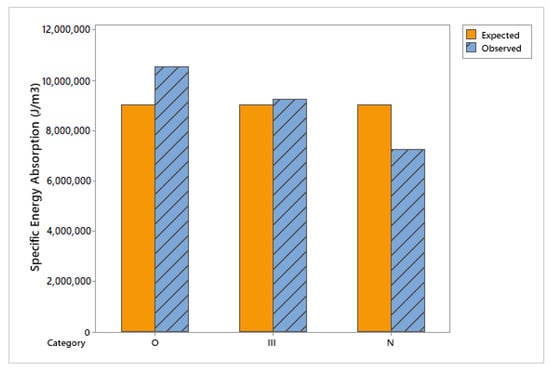
Figure 14.
Observed vs. expected specific energy absorption mean values by sample categories.
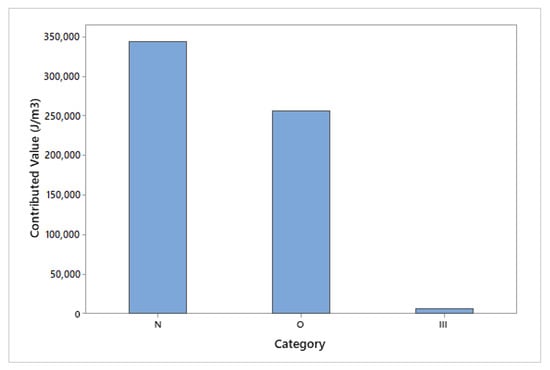
Figure 15.
Contribution of sample categories to the chi-squared value.
4. Conclusions
Producing aluminum foams is still very complex and unpredictable, where engineers and scientists are continuously contributing to their investigation of the production of aluminum foams. During production, random cell distributions of different shapes are formed with the inevitable formation of a dense surface crust, which significantly affects the mechanical behavior and thus the ability to absorb energy. On the other hand, the crust can contain invisible cracks (as a result of thermal stresses) and voids that can initiate premature fracture, especially at high load rates when conditions are favorable for crack formation in highly porous foam. The idea was that adding the reinforcements to the aluminum foams could prevent the growth of cracks in the cell walls and so improve the mechanical properties, but many obstacles need to be passed to achieve that. During expansion, the molten foam reacts with the reinforcement to form a stronger or weaker bond. The quality of this bond depends on the reinforcement material and the foam and can be controlled by preparing the reinforcement surface as well as its total surface area (shaping of reinforcement).
In this study, three different types of reinforcements were used, made of the same material (S 185 steel). Because the reinforcement material has a higher modulus of elasticity (210 GPa) than the cell wall material (70 GPa) and higher yield strength, stresses are transferred from the foam to the reinforcing element. In this sense, the reinforcement in the form of a cylindrical steel mesh (O type) proved to be the best, contributing the most to the specific energy absorption and the specific energy absorption efficiency. The average values of energy absorption per unit volume for the tested types of metal foams were: 10.53 MJ/m3 (O type), 9.25 MJ/m3 (III type) and 7.25 MJ/m3 (N type). The cylindrical mesh has the largest effective surface area and thus achieves the strongest bond with the foam and most effectively reduces the external stresses that cause local high plastic flow and the appearance of local density gradients that lead to premature densification.
In other types of reinforcement, less specific energy absorption and specific energy absorption efficiency have been reported due to the possible stress concentration around the reinforcement itself, leading to rapid cell collapse [5]. Although H type of reinforcement, steel wire element, did not contribute to energy absorption samples H4 and H5 had the best-looking stress–strain curves, with shapes closest to one of the “ideal” absorbers. Specific shape of steel wire element used for reinforcing the aluminum foams, in combination with longer foaming time and lower densities of the samples, were the reasons why their curves were almost ideal.
Flat steel mesh reinforcement also contributed to the energy absorption, compared to the non-reinforced aluminum foams, but not as significantly as the O-type of reinforcement. These samples showed approximately constant values of specific energy absorption.
The obtained experimental results were also statistically substantiated. If experimental and statistical results are compared, adding reinforcements to the aluminum foams contributes to energy absorption properties to a greater or lesser extent depending on the shape (which includes the mass of the reinforcement) and orientation of the reinforcement.
Author Contributions
Conceptualization, I.B. and D.Ć.; methodology, K.G.; software, I.B.; validation, I.B., K.G. and D.Ć.; formal analysis I.B.; investigation, K.G.; resources K.G.; writing—original draft preparation, I.B.; writing—review and editing, D.Ć.; visualization, I.B. and D.Ć.; supervision, D.Ć.; project administration, K.G.; funding acquisition, D.Ć. and K.G. All authors have read and agreed to the published version of the manuscript.
Funding
This research received no external funding.
Institutional Review Board Statement
Not applicable.
Informed Consent Statement
Not applicable.
Acknowledgments
Authors thank M. Keser for his assistance in conducting the experimental tests.
Conflicts of Interest
The authors declare no conflict of interest.
References
- Amaro, A.M.; Neto, M.A.; Cirne, J.S.; Reis, P.N.B. Mechanical characterization of different aluminium foams at high strain rates. Materials 2019, 9, 1428. [Google Scholar] [CrossRef] [PubMed]
- Banhart, J. Manufacture, characterisation and application of cellular metals and metal foams. Prog. Mater. Sci. 2001, 6, 559–632. [Google Scholar] [CrossRef]
- Baumeister, J.; Banhart, J.; Weber, M. Aluminium foams for transport industry. Mater. Des. 1997, 18, 217–220. [Google Scholar] [CrossRef]
- Endut, N.A.; Al Hazza, M.H.F.; Sidek, A.A.; Adesta, E.T.Y.; Ibrahim, N.A. Compressive behaviour and energy absorption of aluminium foam sandwich. IOP Conf. Ser. Mater. Sci. Eng. 2018. [Google Scholar] [CrossRef]
- Ashby, M.F.; Evans, A.G.; Fleck, N.A.; Gibson, L.J.; Hutchinson, J.W.; Wadley, H.N.G. Metal Foams: A Design Guide; Butterworth-Heinemann: Boston, MA, USA; Oxford, UK; Auckland, New Zealand; Johannesburg, South Africa; Melbourne, Australia; New Delhi, India, 2000. [Google Scholar]
- Rajak, D.K.; Mahajan, N.N.; Linul, E. Crashworthiness performance and microstructural characteristics of foam-filled thin-walled tubes under diverse strain rate. J. Alloys Compd. 2019, 775, 675–689. [Google Scholar] [CrossRef]
- Nosko, M.; Kováčik, J. Sound absorption ability of aluminium foams. Met. Foam. 2017, 1, 15–41. [Google Scholar] [CrossRef]
- Formisano, A.; Viscusi, A.; Durante, M.; Carrino, L.; de Fazio, D.; Langella, A. Experimental investigations on bending collapse modes of innovative sandwich panels with metallic foam core. Procedia Manuf. 2020, 47, 749–755. [Google Scholar] [CrossRef]
- Kováčik, J.; Orovčík, L.; Jerz, J. High-temperature compression of closed cell aluminium foams. Met. Mater. 2016, 54, 429–440. [Google Scholar] [CrossRef]
- Karuppasamy, R.; Barik, D. Production methods of aluminium foam: A brief review. Mater. Today Proc. 2020. [Google Scholar] [CrossRef]
- Zhang, C.J.; Feng, Y.; Zhang, X.B. Mechanical properties and energy absorption properties of aluminium foam-filled square tubes. Trans. Nonferrous Met. Soc. China 2010, 20, 1380–1386. [Google Scholar] [CrossRef]
- Solórzano, E.; Rodríguez-Perez, M.A.; Reglero, J.A.; De Saja, J.A. Mechanical behaviour of internal reinforced aluminium foams. Adv. Eng. Mater. 2007, 9, 955–958. [Google Scholar] [CrossRef]
- Linul, E.; Marsavina, L.; Kovačík, J. The compressive behaviour of reinforced aluminium alloy foam. In Proceedings of the 7th International Conference on Advanced Materials and Structures (AMS2018), Timisoara, Romania, 28–31 March 2018; pp. 6–7. [Google Scholar]
- Linul, E.; Marsavina, L.; Kovačík, J. Collapse mechanisms of metal foam matrix composites under static and dynamic loading conditions. Mater. Sci. Eng. A 2018, 690, 214–224. [Google Scholar] [CrossRef]
- Linul, E.; Marsavina, L.; Linul, P.A.; Kovačík, J. Cryogenic and high temperature compressive properties of metal foam matrix composites. Compos. Struct. 2019, 209, 490–498. [Google Scholar] [CrossRef]
- Orbulov, I.N.; Kemény, A.; Filep, Á.; Gácsi, Z. Compressive characteristics of bimodal aluminium matrix syntactic foams. Compos. Part A Appl. Sci. Manuf. 2019. [Google Scholar] [CrossRef]
- Viscusi, A.; Carrino, L.; Durante, M.; Formisano, A. On the bending behaviour and the failure mechanisms of grid-reinforced aluminium foam cylinders by using an experimental/numerical approach. Int. J. Adv. Manuf. Technol. 2020, 106, 1683–1693. [Google Scholar] [CrossRef]
- DIN 50134:2008-10-Prüfung von Metallischen Werkstoffen-Druckversuch an Metallischen Zellularen Werkstoffen; Deutsches Institut für Normung: Berlin, Germany, 1 January 2008.
- Simhachalam, B.; Srinivas, K.; Rao, C.L.B. Energy absorption characteristics of aluminium alloy AA7XXX and AA6061 tubes subjected to static and dynamic axial load. Int. J. Crashworthiness 2014, 19, 139–152. [Google Scholar] [CrossRef]
- Bolboacă, S.D.; Jäntschi, L.; Sestraş, A.F.; Sestraş, R.E.; Pamfil, D.C. Pearson-Fisher chi-square statistic revisited. Information 2011, 2, 528–545. [Google Scholar] [CrossRef]
- Magnello, M.E. Karl Pearson, paper on the chi square goodness of fit test (1900). Landmark Writ. West. Math. 2005. [Google Scholar] [CrossRef]
- Montgomery, D.C. Simple comparative elements. In Design and Analysis of Experiments, 8th ed.; John Wiley & Sons, Inc.: Hoboken, NJ, USA, 2017; pp. 57–59. [Google Scholar]
- Minitab 18 Support. Available online: https://support.minitab.com/en-us/minitab/18/help-and-how-to/statistics/tables/how-to/chi-square-goodness-of-fit-test/interpret-the-results/all-statistics-and-graphs/ (accessed on 20 October 2020).
Publisher’s Note: MDPI stays neutral with regard to jurisdictional claims in published maps and institutional affiliations. |
© 2021 by the authors. Licensee MDPI, Basel, Switzerland. This article is an open access article distributed under the terms and conditions of the Creative Commons Attribution (CC BY) license (http://creativecommons.org/licenses/by/4.0/).