Article

Effect of Gas-Liquid Contact Intensification on Heat and Mass Transfer in Deflector and Rod Bank Desulfurization Spray Tower

1
Key Laboratory of Fluid Transmission Technology of Zhejiang Province, Zhejiang Sci-Tech University, Hangzhou 310018, China
2
Hangzhou Yunze Environmental Science & Technology Company, Hangzhou 310051, China
*
Author to whom correspondence should be addressed.
Processes 2021, 9(8), 1269; https://doi.org/10.3390/pr9081269
Submission received: 28 May 2021 / Revised: 4 July 2021 / Accepted: 18 July 2021 / Published: 23 July 2021

Abstract

:
The deflector and the rod bank are commonly used to optimize flue gas distribution in the original spray tower (OST) of a wet flue gas desulfurization system (WFGD). In this paper, the internal optimization mechanism of the deflector desulfurization spray tower (DST) and the rod bank desulfurization spray tower (RBST) are studied. Based on the Euler–Lagrange method, the standard k-ε turbulence model, an SO2 absorption model and a porous media model, the numerical simulation of the desulfurization spray tower is carried out with the verification of the model rationality. The results show that there are gas-liquid contact intensification effects in DST and RBST. Compared with OST, gas-liquid contact intensification enhances the heat and mass transfer effects of DST and RBST. The temperature difference between inlet and outlet of flue gas increased by 3.3 K and the desulfurization efficiency of DST increased by 1.8%; the pressure drop decreased by 37 Pa. In RBST, the temperature difference between the flue gas inlet and outlet increased by 5.3 K and the desulfurization efficiency increased by 3.6%; the pressure drop increased by 33 Pa.

1. Introduction

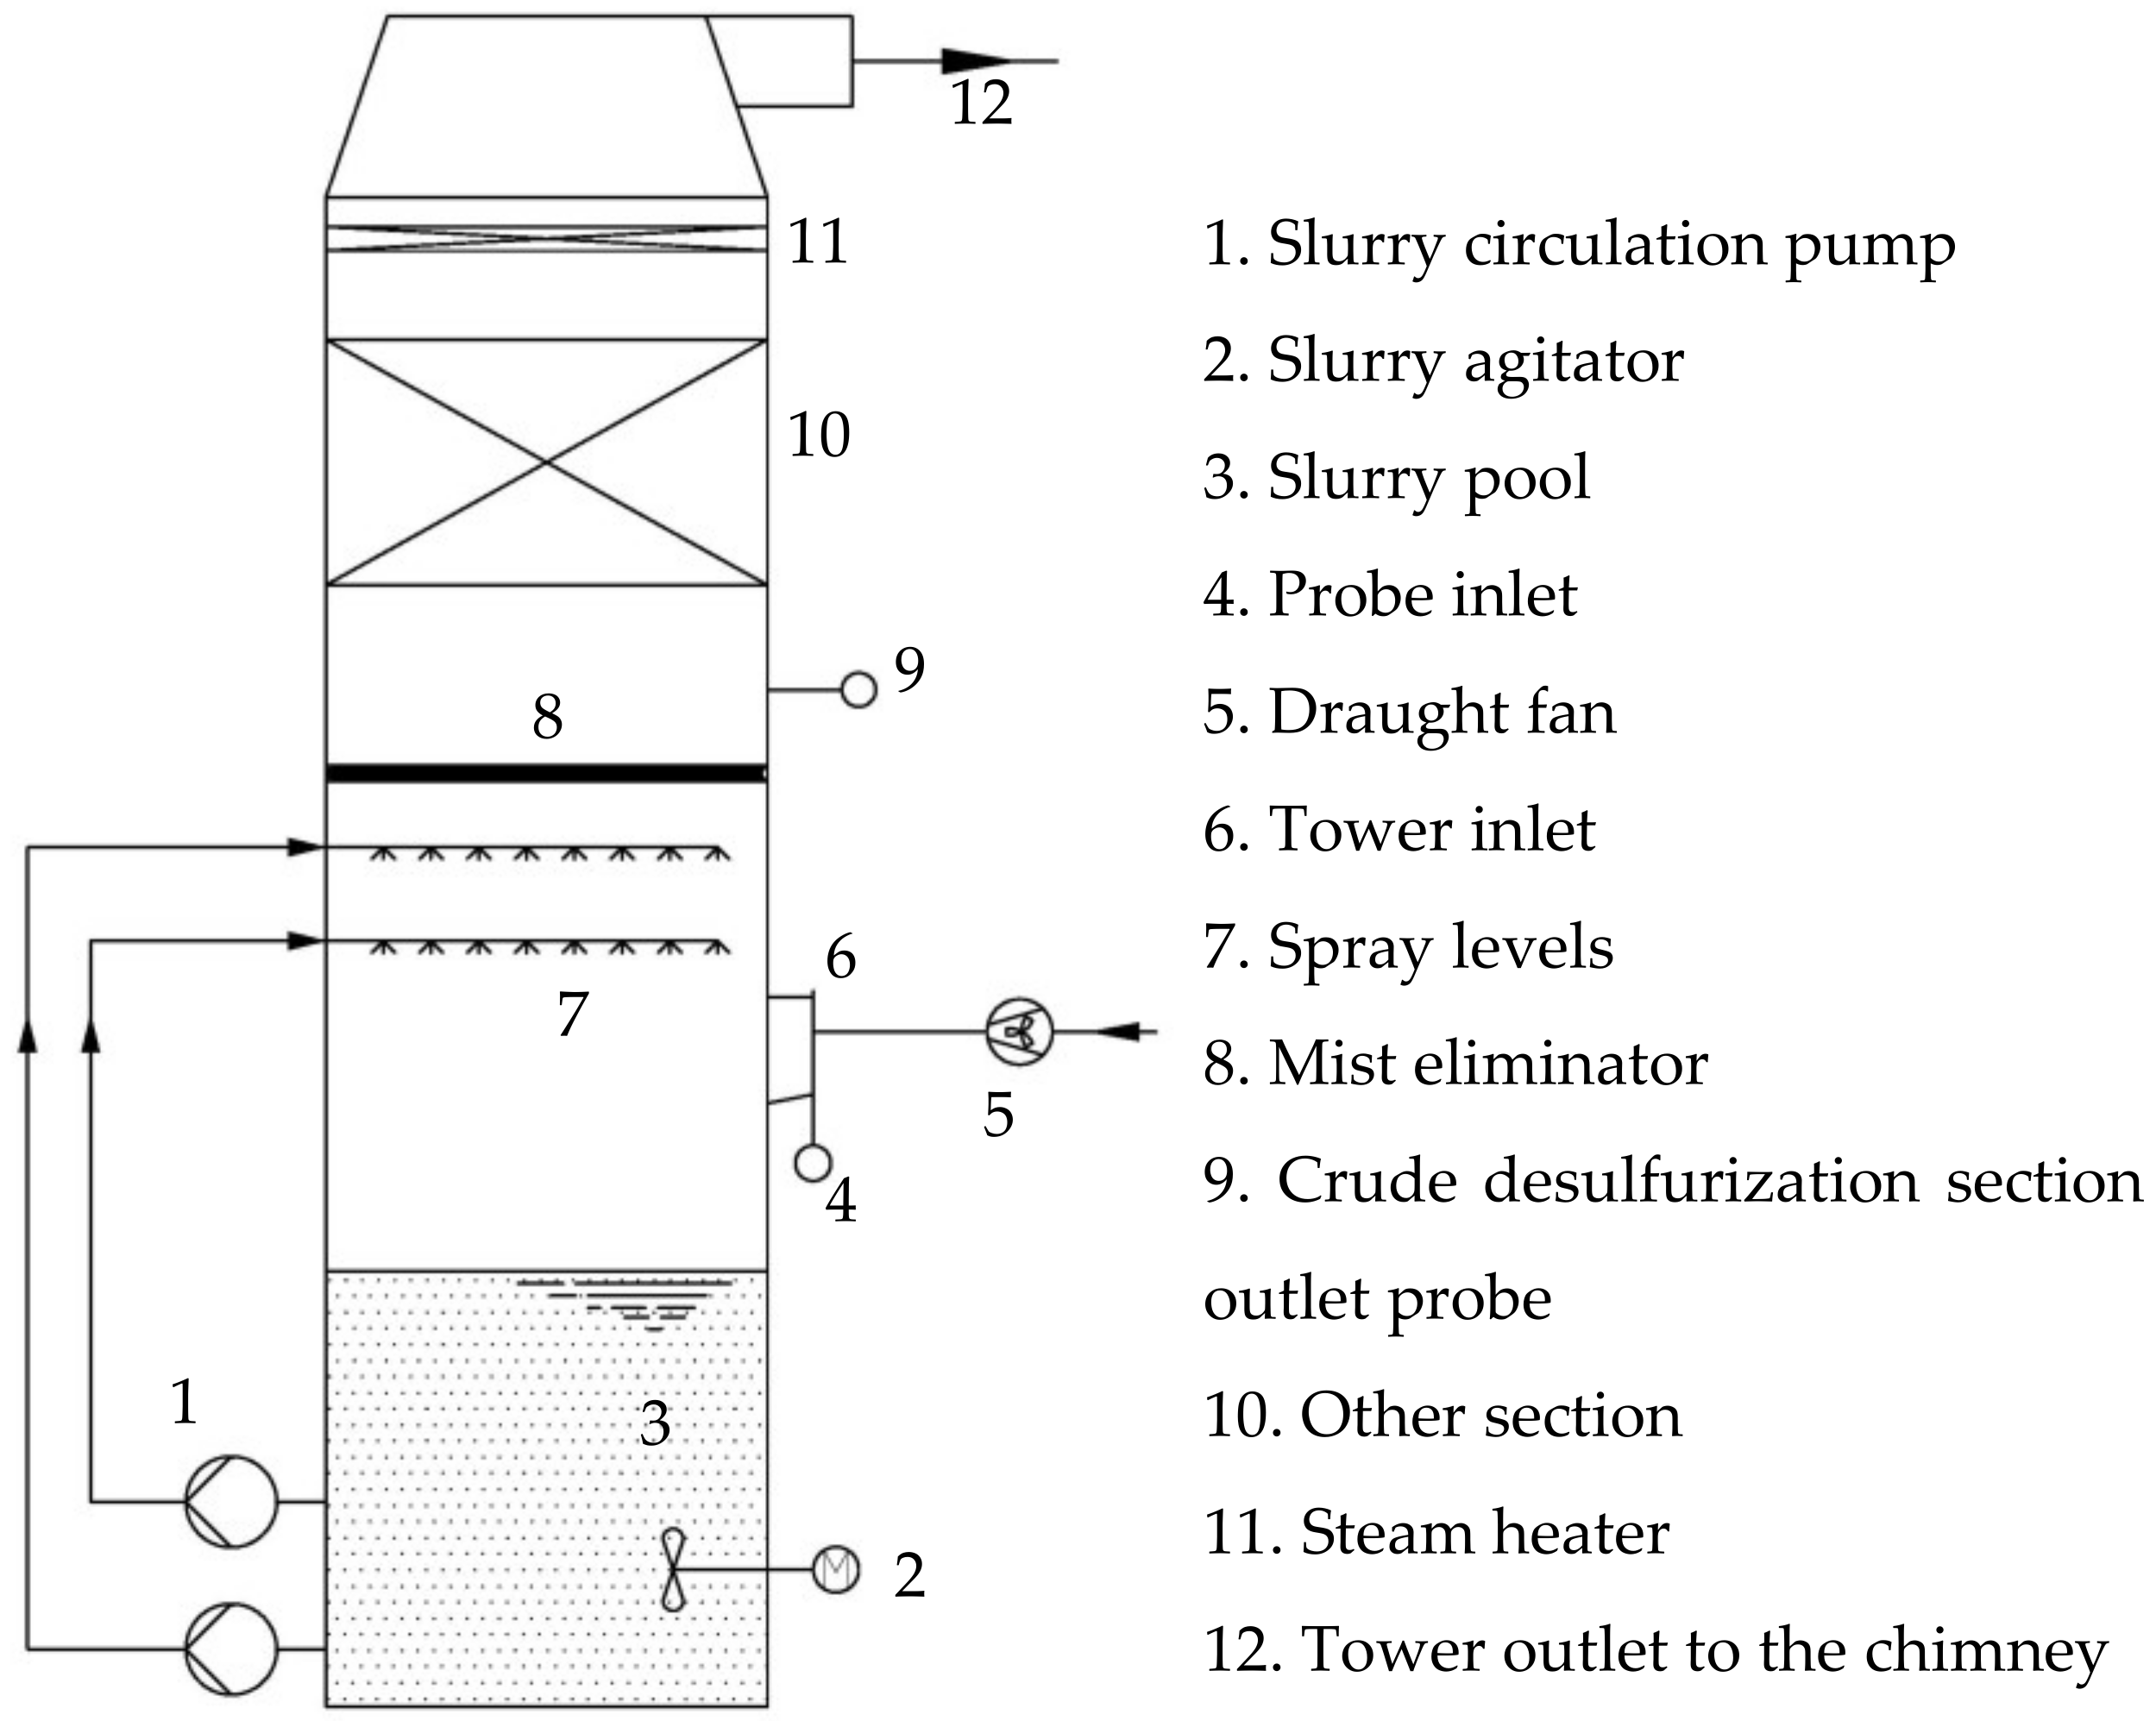
Wet flue gas desulfurization (WFGD) is used to treat most of the flue gas produced by the power and heat production and supply industries in China [1]. Through the countercurrent contact between acidic flue gas and alkaline slurry, the acidic gas is absorbed by the slurry, thus achieving the purpose of removing sulfur dioxide [2,3]. The operating cost of WFGD is mainly composed of electricity consumption, alkali consumption, water consumption, labor cost and equipment maintenance. The desulfurization efficiency can be effectively improved by increasing the amount of slurry circulation, but the amount of power required by the slurry circulation pump is greatly increased, thus increasing the electricity consumption. The increase in the operating resistance of the desulfurization spray tower will cause the induced draft fan to use more power, so the electricity consumption will also increase. Since the desulfurization spray tower is the main equipment of WFGD [4], the operating parameters, structure design and hydrodynamic performance analysis of the desulfurization spray tower are particularly important.
In the desulfurization spray tower, the non-uniformity of the flue gas flow field is common, due to the radial flow direction of the flue gas [5]. It is a common method to optimize the uniformity of the flue gas flow field by adjusting the operating parameters in the tower. Deng [6] optimized the flow field through the flow rate of the flue gas inlet and continued through the uniformity index to evaluate the uniformity of the flow field. Wang [7] proposed a detailed design scheme by studying the flow field uniformity of the desulfurization spray tower with different spray layers. Wang [8] simulated the gas-liquid flow field of the desulfurization spray tower in full size by ANSYS CFX software and concluded that the combined flow field of 2nd and 3rd spray level is the most uniform. In addition to adjusting operating parameters, changing the tower structure is also an optimization method. Xiao [9] simulated PCF (a wet flue gas desulfurization absorber) with different inlet structure forms, and chose the best PCF inlet structure to reduce design time and economic cost.
However, the adjustment of operating parameters may increase the operating costs. In addition, changing the structure of the tower is not viable in the existing equipment. With the improvement of environmental protection requirements and the harsh requirements of engineering reconstruction, installing special structures has become an important and feasible flow field optimization method. Chou [10] added perforated sieve trays into the desulfurization spray tower with the consideration of chemical effects and concluded that the perforated sieve trays can increase the desulfurization efficiency. Zhen [11] optimized the flow field by adding a FPC (flow pattern controlling) device to the desulfurization spray tower. Compared with the common spray tower without a perforated plate, the desulfurization performance of the FPC device is significantly improved. Both the deflector [12] and the rod bank [13] are important structures for the development of the flow field of the desulfurization spray tower, which are used to optimize the flow field uniformity and strengthen the mass transfer. Research on the flow field distribution of these two structures has mainly focused on the distribution of flue gas, while the liquid distribution has not been analyzed in detail. Although Wang [14] proposed the droplet self-adjustment to explain the gas-liquid interaction, it is not clear how the two structures regulate the gas-liquid contact.
The disadvantage of high energy consumption of WFGD in traditional coal-fired power plants is increasingly prominent [15]. Therefore, the recovery of flue gas residual heat has become the focus of energy-saving transformation. In WFGD, most of the residual heat of flue gas is transferred to the slurry. The study of two kinds of heat transfer is beneficial to provide ideas for the subsequent recovery of flue gas residual heat. However, the analysis of special structures in previous studies is not comprehensive, especially the analysis of the gas-liquid two-phaseheat transfer law in a desulfurization spray tower.
Computational fluid dynamics (CFD) is an ideal method for the optimal design of the desulfurization spray tower and for the prediction of flow field distribution. Gas-liquid two-phase flow can be simulated by Euler–Euler [16,17,18] and Euler–Lagrange [19,20] methods. It is believed that in some studies liquid exists in the form of liquid film, formed on the surface of the structures with its local volume concentration much higher than 10%, which contributes to the application of the Euler–Euler method [10,14]. However, according to experimental studies, the liquid volume fraction in a large area of the spray tower is less than 5–8% [21]. Comparing with the Euler–Euler method, particles and injection types are modeled strictly and accurately by the Euler–Lagrange method [22]. The Euler–Lagrange method is adopted in this paper to model the two-phase flow in WFGD due to the requirements of accurate analysis of the liquid phase and the gas-liquid phase interaction.
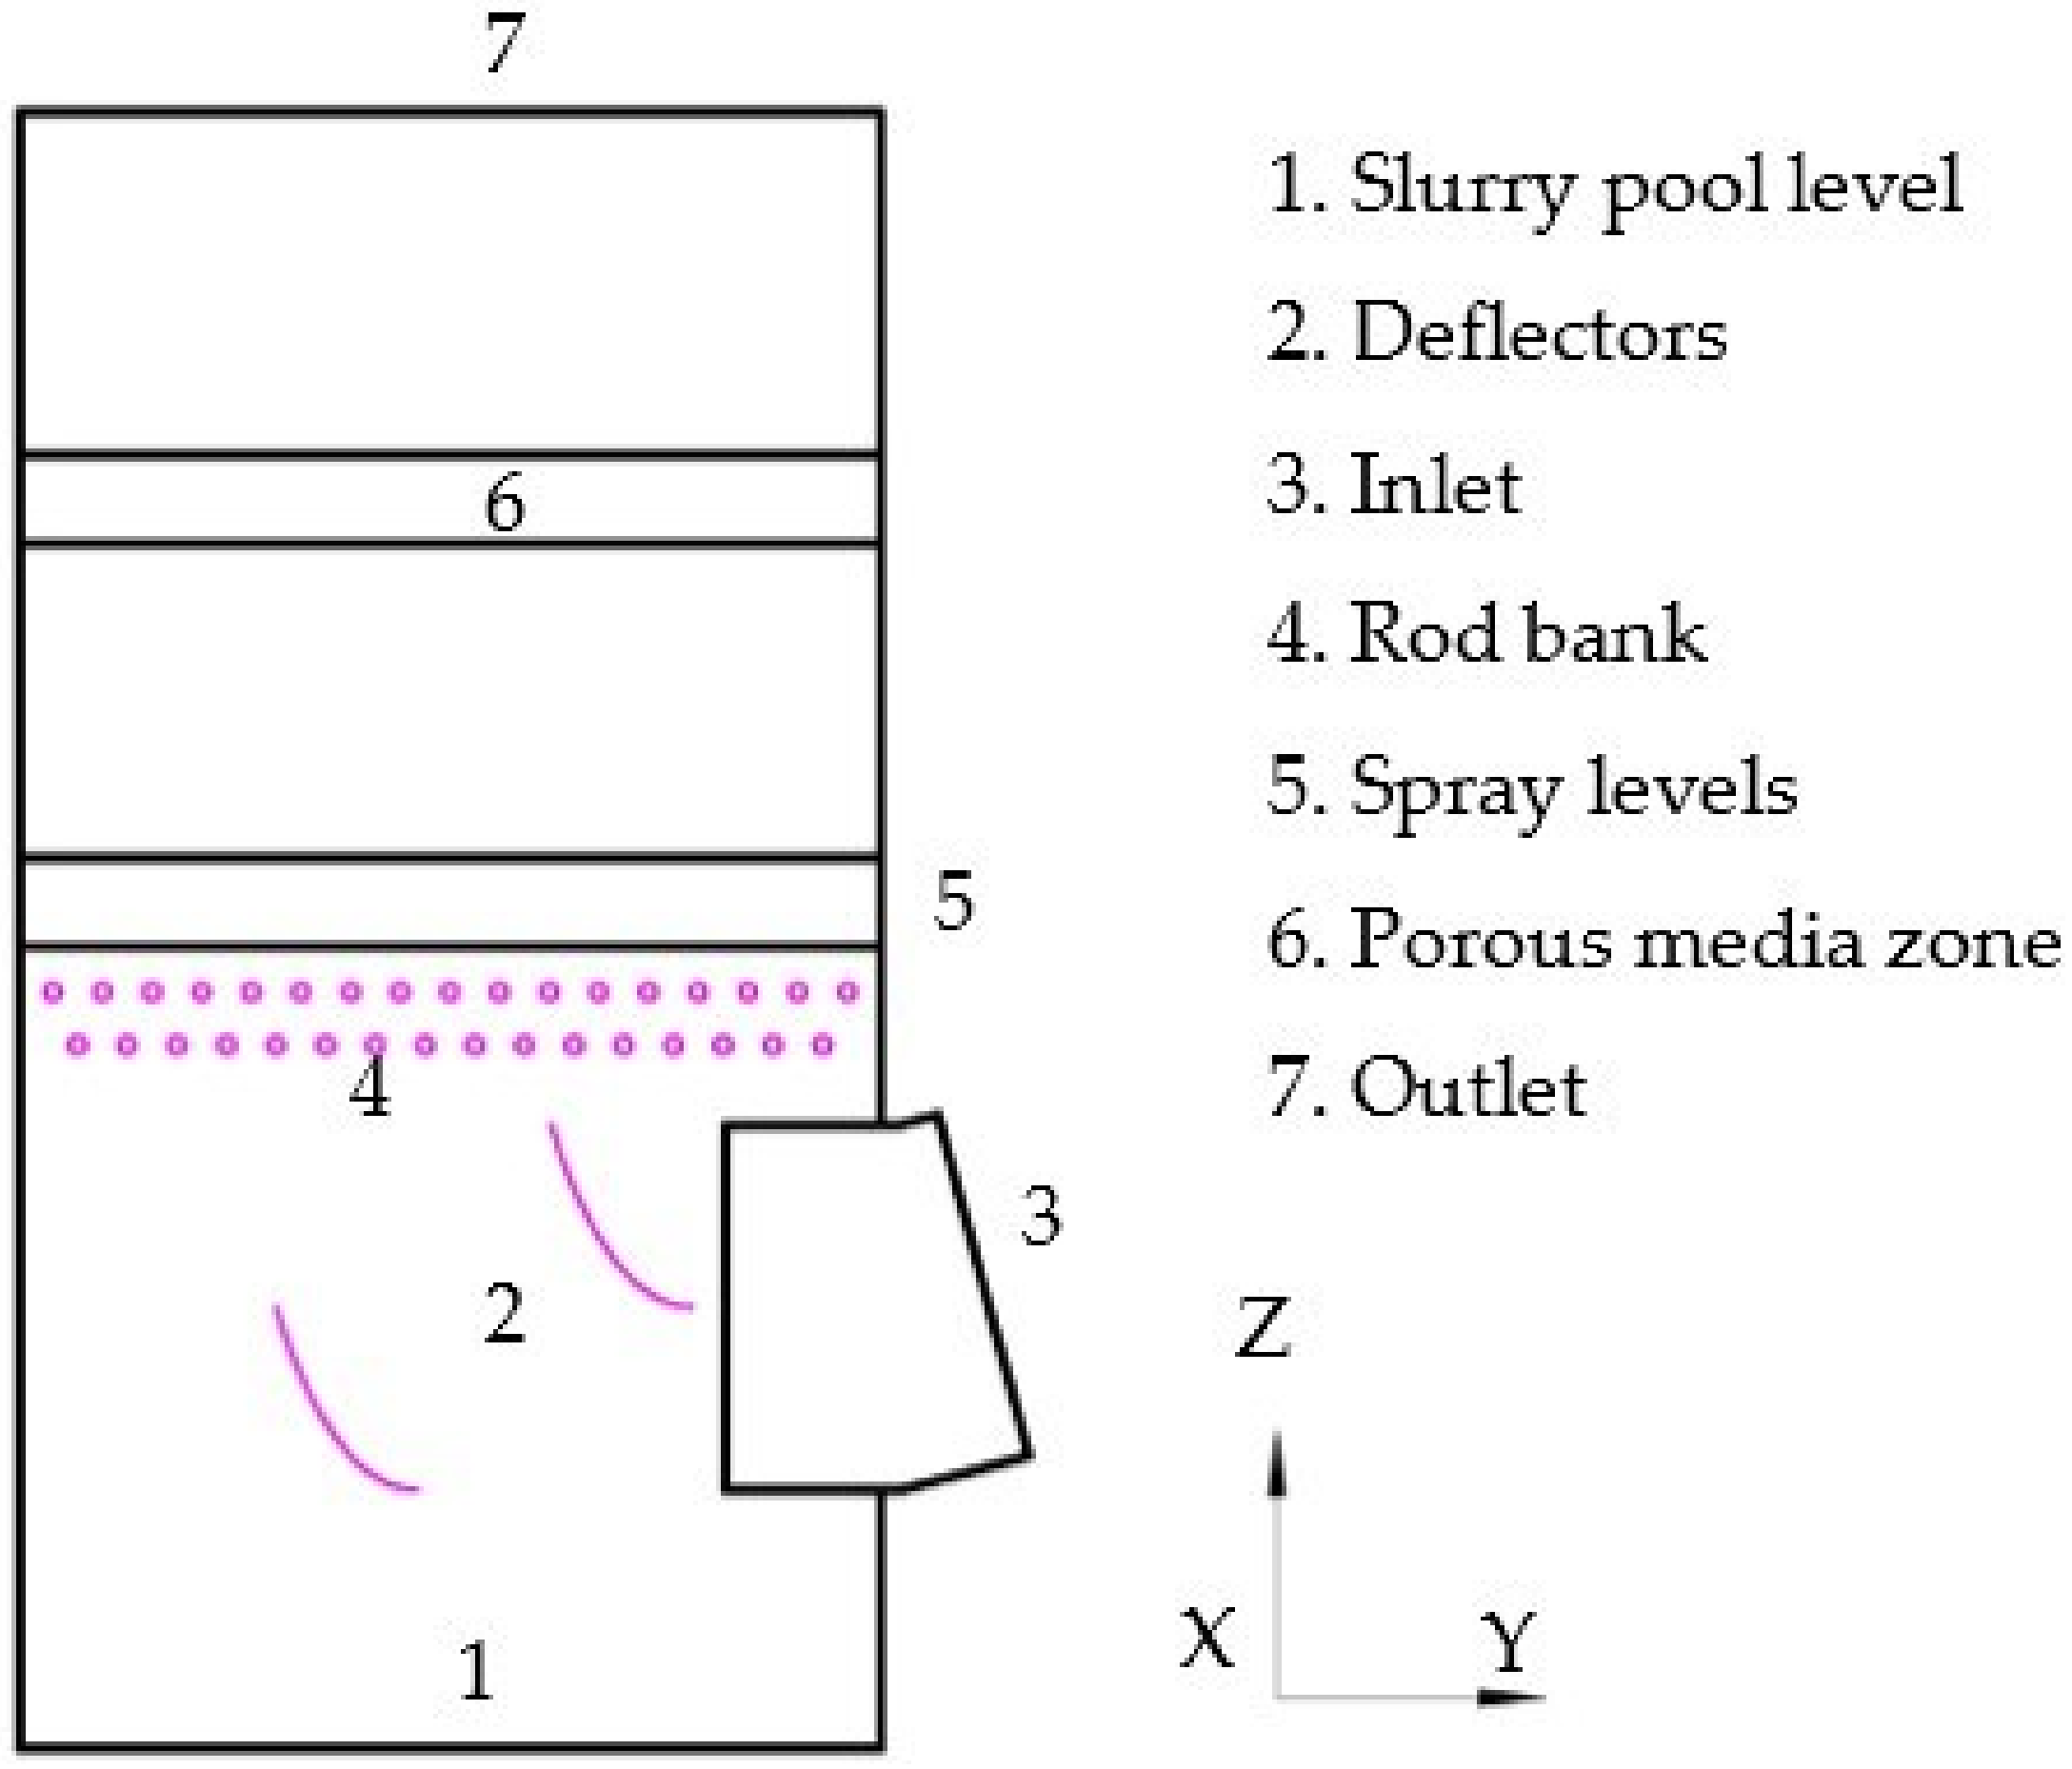
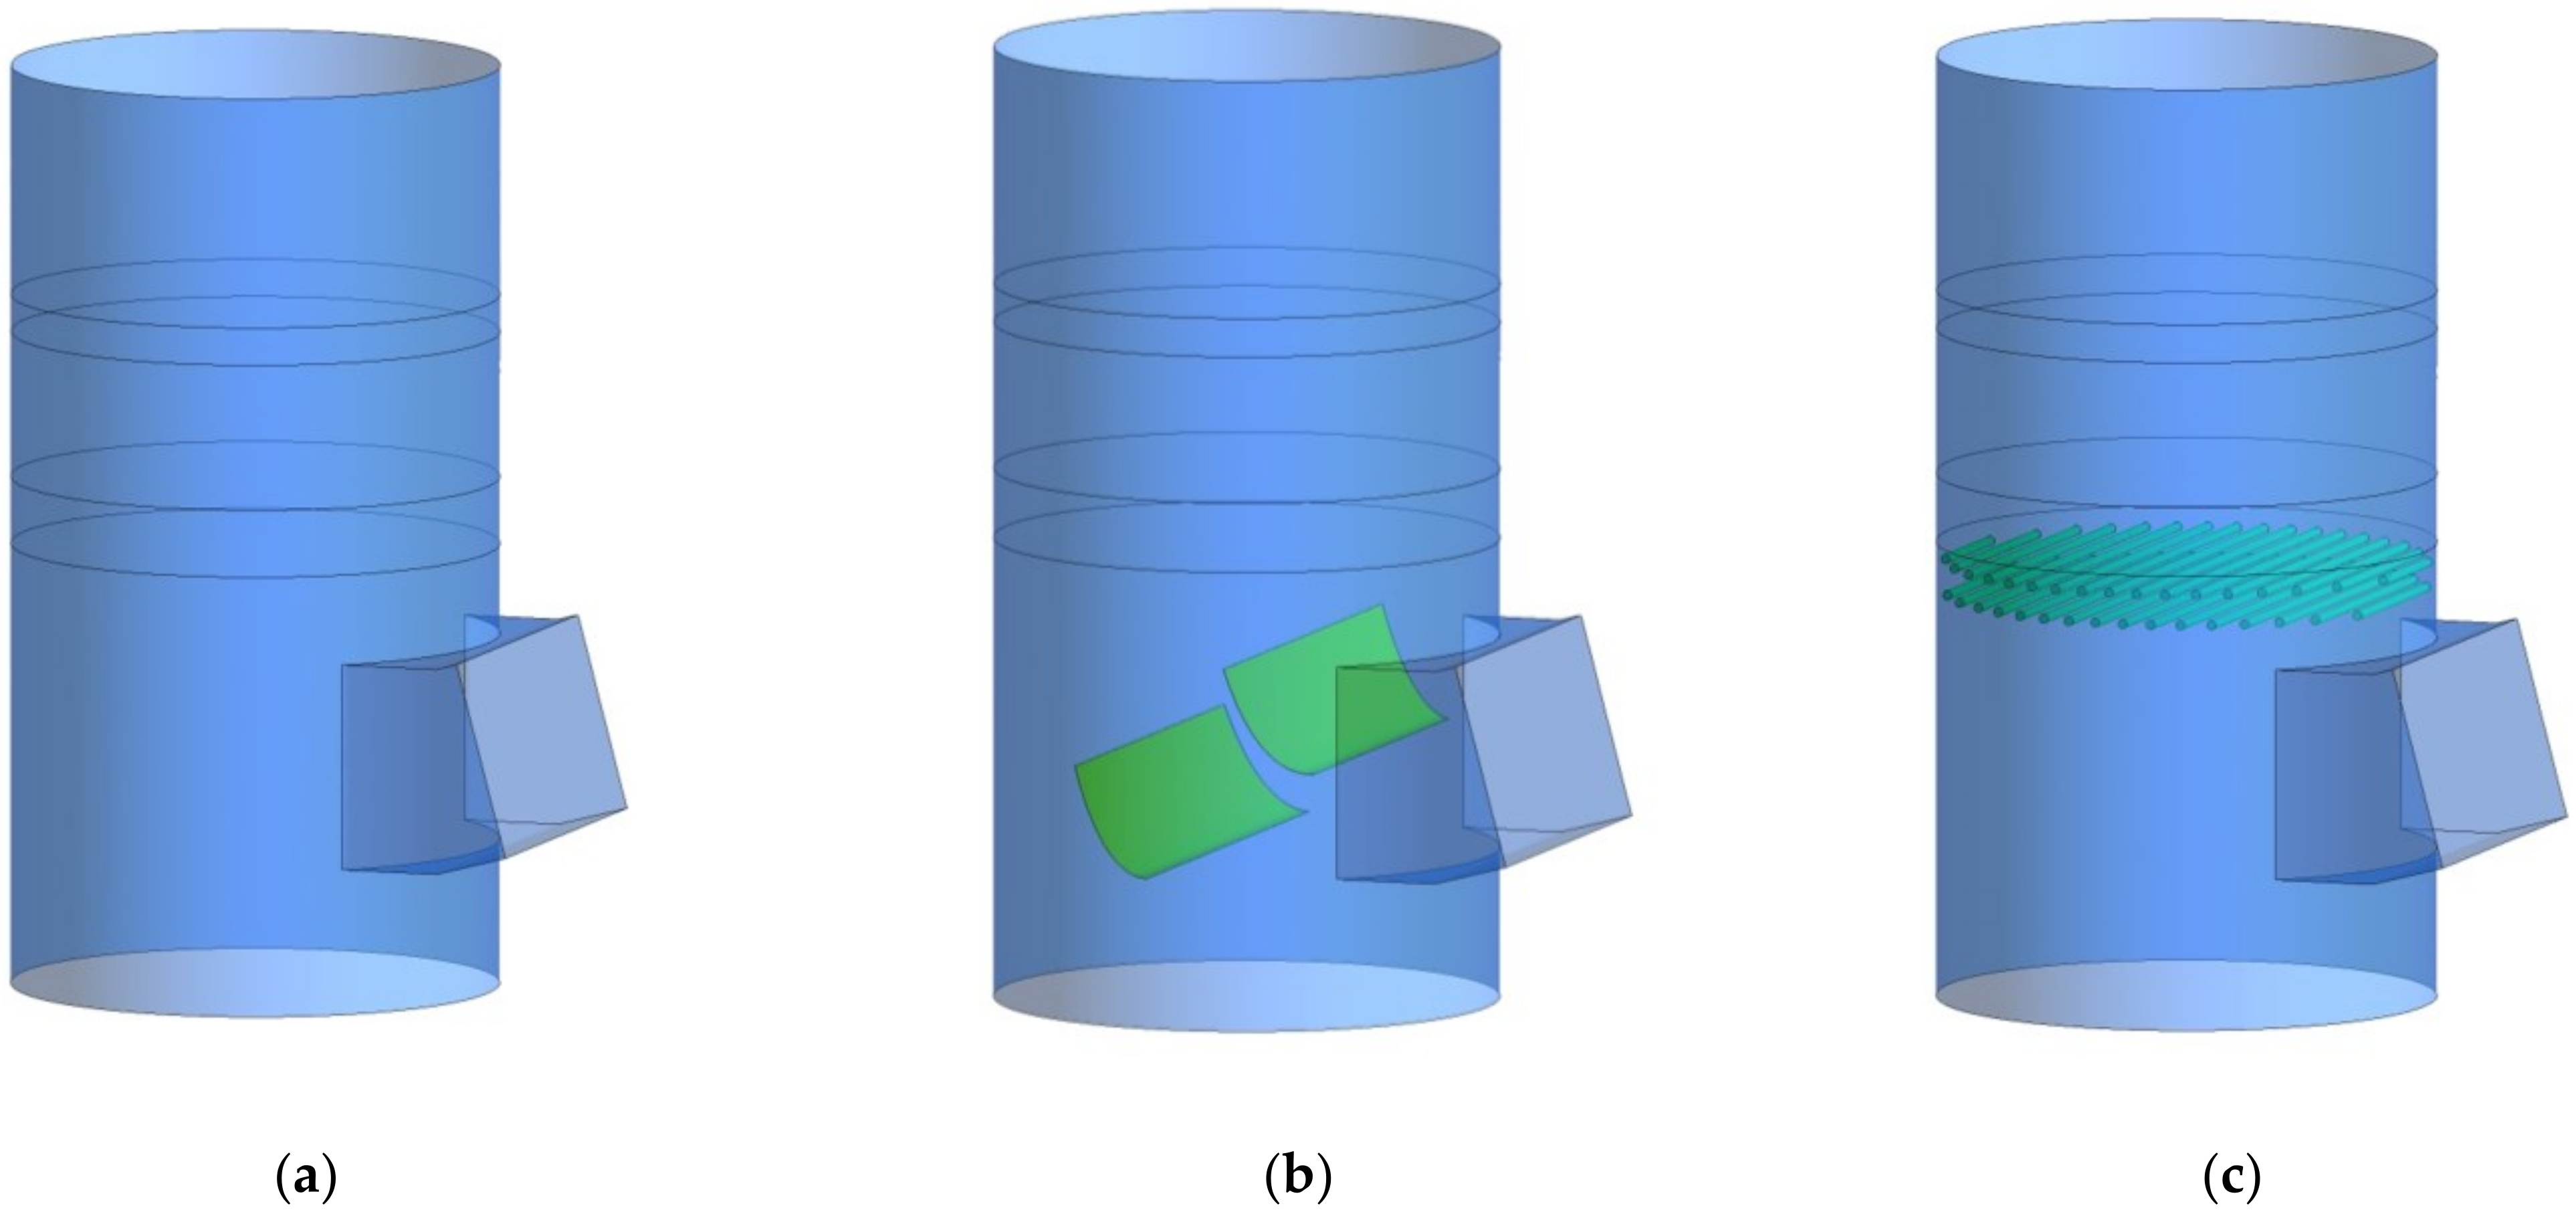
In this paper, a CFD numerical simulation method is used to study the original desulfurization spray tower (OST) of a 330 MW coal-fired unit WFGD system, the deflector desulfurization spray tower (original desulfurization spray tower + deflector) (DST) and the rod bank desulfurization spray tower (original desulfurization spray tower + rod bank), respectively. The flow field under three working conditions is analyzed, the gas-liquid contact intensification in DST and RBST is revealed, and the influence of gas-liquid contact strengthening on heat and mass transfer is discussed. Finally, the operating resistance in each desulfurization spray tower is analyzed.

2. Numerical Method

2.1. Governing Equations

In the desulfurization spray tower, there is a complex multiphase flow of gas, liquid and solid, including the mass and heat transfer between the three phases. Flue gas and slurry, which are two main phases in the desulfurization spray tower, are the emphasis of the research. Therefore, the flow in the tower is simplified as the gas-liquid two-phase flow, and the heat and mass transfer between the two phases are considered. Because the volume fraction of the slurry in the desulfurization spray tower is less than 10%, the Euler–Lagrange method is used for the two-phase numerical simulation in this paper. In the Euler–Lagrange method, the flue gas with a higher volume fraction is treated as a continuous phase by the Euler method. The liquid phase is treated as a discrete phase model (DPM) by the Lagrange method. The Lagrange method can accurately track the trajectory of particles and fully consider the interaction between the two phases. In the actual desulfurization spray tower, the slurry exists in the form of droplets through the atomization of the nozzles. In the process of moving, droplets will collide with each other, and the coalescence and rupture of droplets will occur at the same time. In the large-scale calculation domain, the collision, coalescence and rupture processes of droplets can be ignored. Therefore, the model of water droplets established by the Lagrange method can be applied to simulate the liquid phase in the tower, and has been verified [12]. The empirical equation standard k-ε turbulence model is used to simulate the turbulence.

2.1.1. Continuous Phase

The flue gas is regarded as incompressible Newtonian fluid. The governing equations of continuous phase motion are the mass conservation equation and the momentum conservation equation. Since heat and mass transfer processes are taken into simulation, the energy equation and species transport equation are also involved. The solution of a species transport equation for a species predicts the local mass fraction of the species. The equations are listed as follows [23]:
ρ t + ρ v = S m a s s
t ρ v + ρ v v = p + τ = + ρ g + F
t ρ E + v ρ E + p = k e f f T i h i J i + τ = e f f v + S h
t ρ Y i + ρ v Y i = J i + S i
where, ρ is fluid density, t is time, v is the velocity, p is static pressure, τ = is the stress tensor, ρ g is the volume force of gravity, keff is effective coefficient. Smass is the mass source term, F is the momentum source term, Sh other volumetric heat source, Yi mass fraction of specie i, Si is the rate source term. J i is the diffusion flux of specie i, which arises due to gradients of concentration and temperature. Fick’s law is applied to model mass diffusion due to concentration gradients:
J i = ρ D i , m + μ t S c t Y i D T , i T T
where, S c t = μ t / ρ D t , is the turbulent Schmidt number, μ t is the turbulent viscosity, Dt is the turbulent diffusivity. Di,m is the mass diffusion coefficient for species i in the mixture, DT,i is the thermal diffusion coefficient.

2.1.2. Discrete Phase Model

The slurry is regarded as a discrete phase. Liquid droplets are regarded as rigid spheres. A force equilibrium integral is applied in ANSYS FLUENT to predict the trajectory of slurry droplets. The force equilibrium is that the inertia of slurry droplets is equal to the force acting on slurry droplets, which can be written as:
d u p d t = u - u p τ r + g ( ρ p ρ ) ρ p
where, u is the velocity of the fluid phase, up is the velocity of the particles, μ is the molecular viscosity of the fluid, ρp is the density of the particles, u u p τ r is the drag force and
τ r = 18 μ ρ p d p 2 18 μ 24 C D R e
where, dp is the diameter of the particles, Re is the relative Reynolds number, and CD [24] is a function related to Re:
C D = a 1 + a 2 R e + a 3 R e 2
where a 1 , a 2 , and a 3 are constants that apply over several ranges of Re [24].

2.2. Coupling of Two Phase

2.2.1. Mass Exchange

In the calculation process, the absorption process of SO2 is considered. The absorption of SO2 is added as the source term by the user-defined functions (UDF). The mass source term can be expressed as:
S m a s s = m ˙ so 2
The SO2 absorption model is established according to the two-film theory, and the mass transfer rate of SO2 is expressed as [12]:
m ˙ so 2 = K t o t a l A p ( p g , SO 2 C l , SO 2 / H e SO 2 )
where, p g , SO 2 is the partial pressure of SO2 in flue gas, C l , SO 2 is the concentration of SO2 in the droplet, H SO 2 is Henry’s constant [25]:
H e SO 2 = 1 / exp 16.765 3751.2 / T p
where, Tp is the temperature of the droplet.
Ktotal is the total mass transfer coefficient, which is jointly affected by the mass transfer rates of SO2 on the gas side and liquid side, respectively. Its expression is written as follows [12]:
1 K t o t a l = 1 K SO 2 , g + 1 E SO 2 H e SO 2 K SO 2 , l
where,   E SO 2 is the enhancement factor. K SO 2 , g is the mass transfer coefficient if the gas can be obtained by the following correlation [21]:
S h = K SO 2 , g d p D g = 2 + 0.6 R e 1 / 2 S c 1 / 3
where, Sh is the Nusselt number. Dg is the diffusion coefficient of SO2 in the gas phase. SC is schmidt number of gas.
K SO 2 , l is the mass transfer coefficient if liquid side [26]:
K SO 2 , l = 0.88 f D l 1 / 2
f = 8 σ / 3 π m p 1 / 2
D l = T l exp 19.895 1800 T l
where, σ is the solution surface tension, Dl is the diffusion coefficient of SO2 in the liquid phase, mp is the quality of the droplet, Tl is the temperature of the solution.

2.2.2. Momentum Exchange

The momentum exchange from the continuous phase to the discrete phase is obtained by checking the momentum change of a particle through each control volume in the model, and the source phase of the momentum exchange is expressed as:
F = 18 μ C D R e ρ p d p 2 24 u p u m ˙ p Δ t
where, m p ˙ is mass flow rate of the particle.

2.2.3. Heat Exchange

The interphase heat transfer is considered as a simple heat balance. Particle temperature is associated with convective heat transfer. After the two-phase contact and heat transfer, the gas temperature dropped significantly, which is the same as the slurry temperature. At the same time, the evaporation water in the column accounted for 0.61% of the total spray slurry. Therefore, the evaporation process of the droplet can be ignored [27]. There is no supersaturated environment for water vapor in the tower, so the condensation process can also be ignored. In the whole wet flue gas desulfurization process, the flue gas temperature is low, and the flue gas inlet temperature is up to 140 °C, therefore, thermal radiation can be ignored since strong thermal radiation will not occur. The interphase heat transfer equation is:
m p c p d T p d t = h A p T T p
where, cp is droplet heat capacity, h is convective heat transfer coefficient, T is temperature of continuous phase.

2.3. Porous Media Model

The structure of the mist eliminator is complex, and thus can be simplified by using a porous media model. The model defines a cell region in which the porous media model is applied and the pressure loss in the flow is determined by the input described in the momentum equation of the porous media. Porous media are modeled by adding the momentum source term to the standard fluid flow equation. The source term is composed of two parts: the viscous loss term (Darcy equation) and the inertia loss term. The equation can be expressed as:
S i = j = 1 3 D i j μ v j + j = 1 3 C i j 1 2 ρ v v j
where, Si is a momentum equation of x (y, or z) of the source, |v| is the size of the velocity, C, D is stipulated by the matrix. For homogeneous porous media:
S i = μ α v i + C 2 1 2 ρ v v i
In this time, D is the 1/α, C is the C2. α is the permeability, α = 320,000, C2 is the inertial resistance coefficient, C2 = 71.

3. Simulation Condition and Experimental Method

3.1. Computational Domain and Boundary Condition

In Figure 1, the flue gas enters the domain through the inlet, and then goes through the rectifying effect of the deflectors or the rod bank. The flue gas contacts the spray slurry countercurrent and flows out of the outlet through a defined porous medium zone.
In Figure 2, a 3D model (1:1 scale) is established for OST flow field area, DST and RBST, of which the design ideas are derived from literatures [12,14]. There are two deflectors. Its shape is two incomplete elliptical arcs. The bottom of the first deflector is installed at the middle height of the flue gas inlet, and the bottom of the second deflector is installed at the intersection of the center of the tower and the bottom of the inlet. The rod bank has two layers, which are staggered. The distance between the two layers of the rod bank is 800 mm, and the distance between the lower layer of the rod groups and the upper part of the inlet is 1200 mm. Horizontal spacing of adjacent rods is 750 mm. The diameter of the rod is 250 mm.
The flue gas flow field adopts velocity inlet and pressure outlet, the solid boundary is set as a non-slip wall:
u i n l e t = Q / A
p o u t l e t = 1500 P a
u w a l l = 0
where, uinlet is flue gas velocity at the inlet, Q is flue gas flow, A is cross-sectional area of inlet, poutlet is pressure at the outlet of flow field, uwall is velocity at the wall.
The temperature of flue gas is equivalent to that of slurry after cooling, at about 50 °C. Therefore, the physical properties of flue gas at this time are taken as calculation parameters. Flue gas parameters and slurry parameters are shown in Table 1.
The droplet size in simulation is the median particle size of spray atomized droplets, which value equals to 3 mm. The slurry is injected from the spray surface, and the collision of droplets with the tower wall, the deflector and the rod bank is simulated by the wall-particle reflection model. The tangential and normal reflection coefficients are set as 0.2. The boundary conditions of the collision between the droplets and the slurry plane are set as trap, and the boundary conditions of the droplets at the inlet and outlet of the flue gas are set as escape. The SIMPLE algorithm is used to solve the problem.

3.2. Grid Generation and Independence Verification

Owing to the complex structures of the deflector and the rod bank, a tetrahedral unstructured grid is used as a whole. The boundary layer grids are used to encrypt the tower wall, the deflector and the rod bank, which are shown in Figure 3. For the OST, 0.5 million, 1.5 million, and 2.5 million grids are generated. For the DST, 0.9 million, 1.9 million, and 2.9 million grids are generated. For the RBST, 1.2 million, 3.2 million, and 4.2 million grids are generated. The simulation results are shown in Table 2. When the grid number of the OST is 1.5 million, the grid number of the DST is 1.9 million, and the RBST is 3.2 million, the temperature difference, pressure drop and desulfurization efficiency of the calculation result are all stable.

3.3. Experimental Method

The actual process flow of a WFGD system of a 330 MW coal-fired unit is shown in Figure 4. The process is mainly composed of a flue gas circulation system and a slurry circulation system. In the flue gas circulation system, the draught fan provides power for the flue gas to enter the crude desulfurization section from the inlet. Then the flue gas and spray slurry are in countercurrent contact to remove SO2. In addition, the entrainment small droplets in the flue gas are removed through the mist eliminator. Finally, it flows out of the crude desulfurization section outlet. The flue gas continues to move upward, and the rest of SO2 is removed through the fine desulfurization section to meet the discharge standard. After being heated by the steam heater, the flue gas flows out of the tower outlet. In the slurry circulation system, the slurry is injected into the tower from the spray layer by the circulation pump and then collected into the slurry pool. The slurry is replenished regularly, and the role of the slurry agitator is to prevent precipitation. The spray tower is 13 m in diameter, and the spray layer is two layers (horizontal height of 5.2 m and 7 m from the entrance center). There are 240 nozzles in each spray layer, as shown in Figure 5b,c. The operation parameters of the tower are summarized in Table 3.
Measuring probes are set at the flue gas inlet and the crude desulfurization outlet to obtain pressure, temperature and SO2 concentration data, respectively. A comparison between numerical results and experimental data is shown in Table 4. The results show that the errors of temperature difference, pressure difference and desulfurization efficiency are all less than 10%, proving the feasibility and effectiveness of the simulation.

4. Simulation Results and Discussion

4.1. Contact Condition of Gas-Liquid

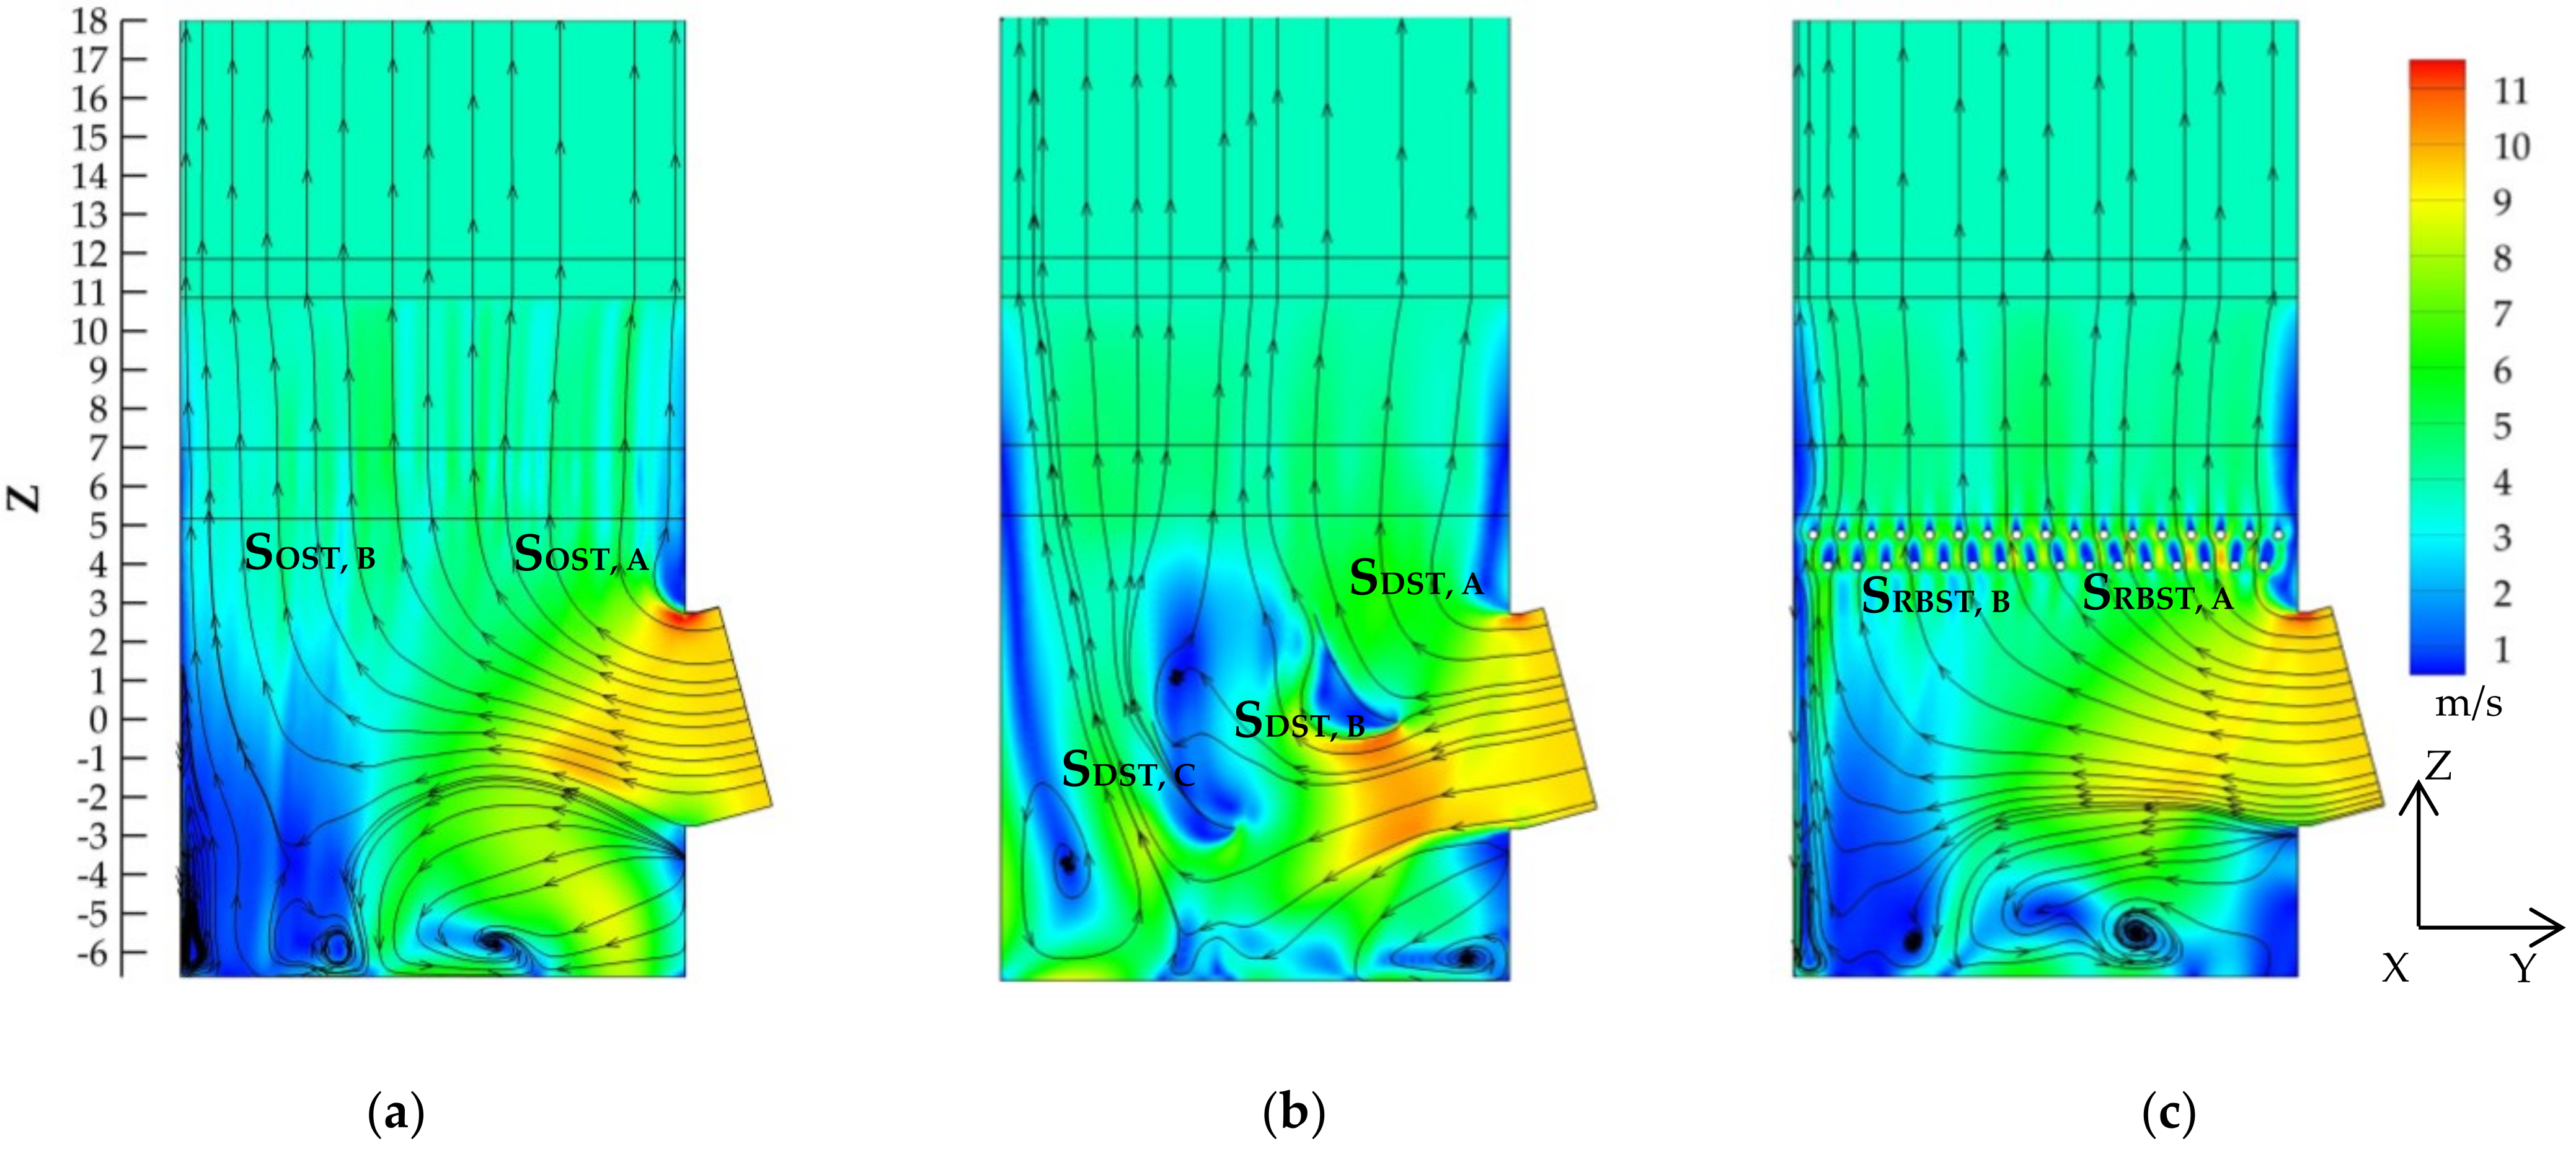
Figure 6 shows the velocity and streamline distributions for the three operating conditions on the X = 0 plane. 
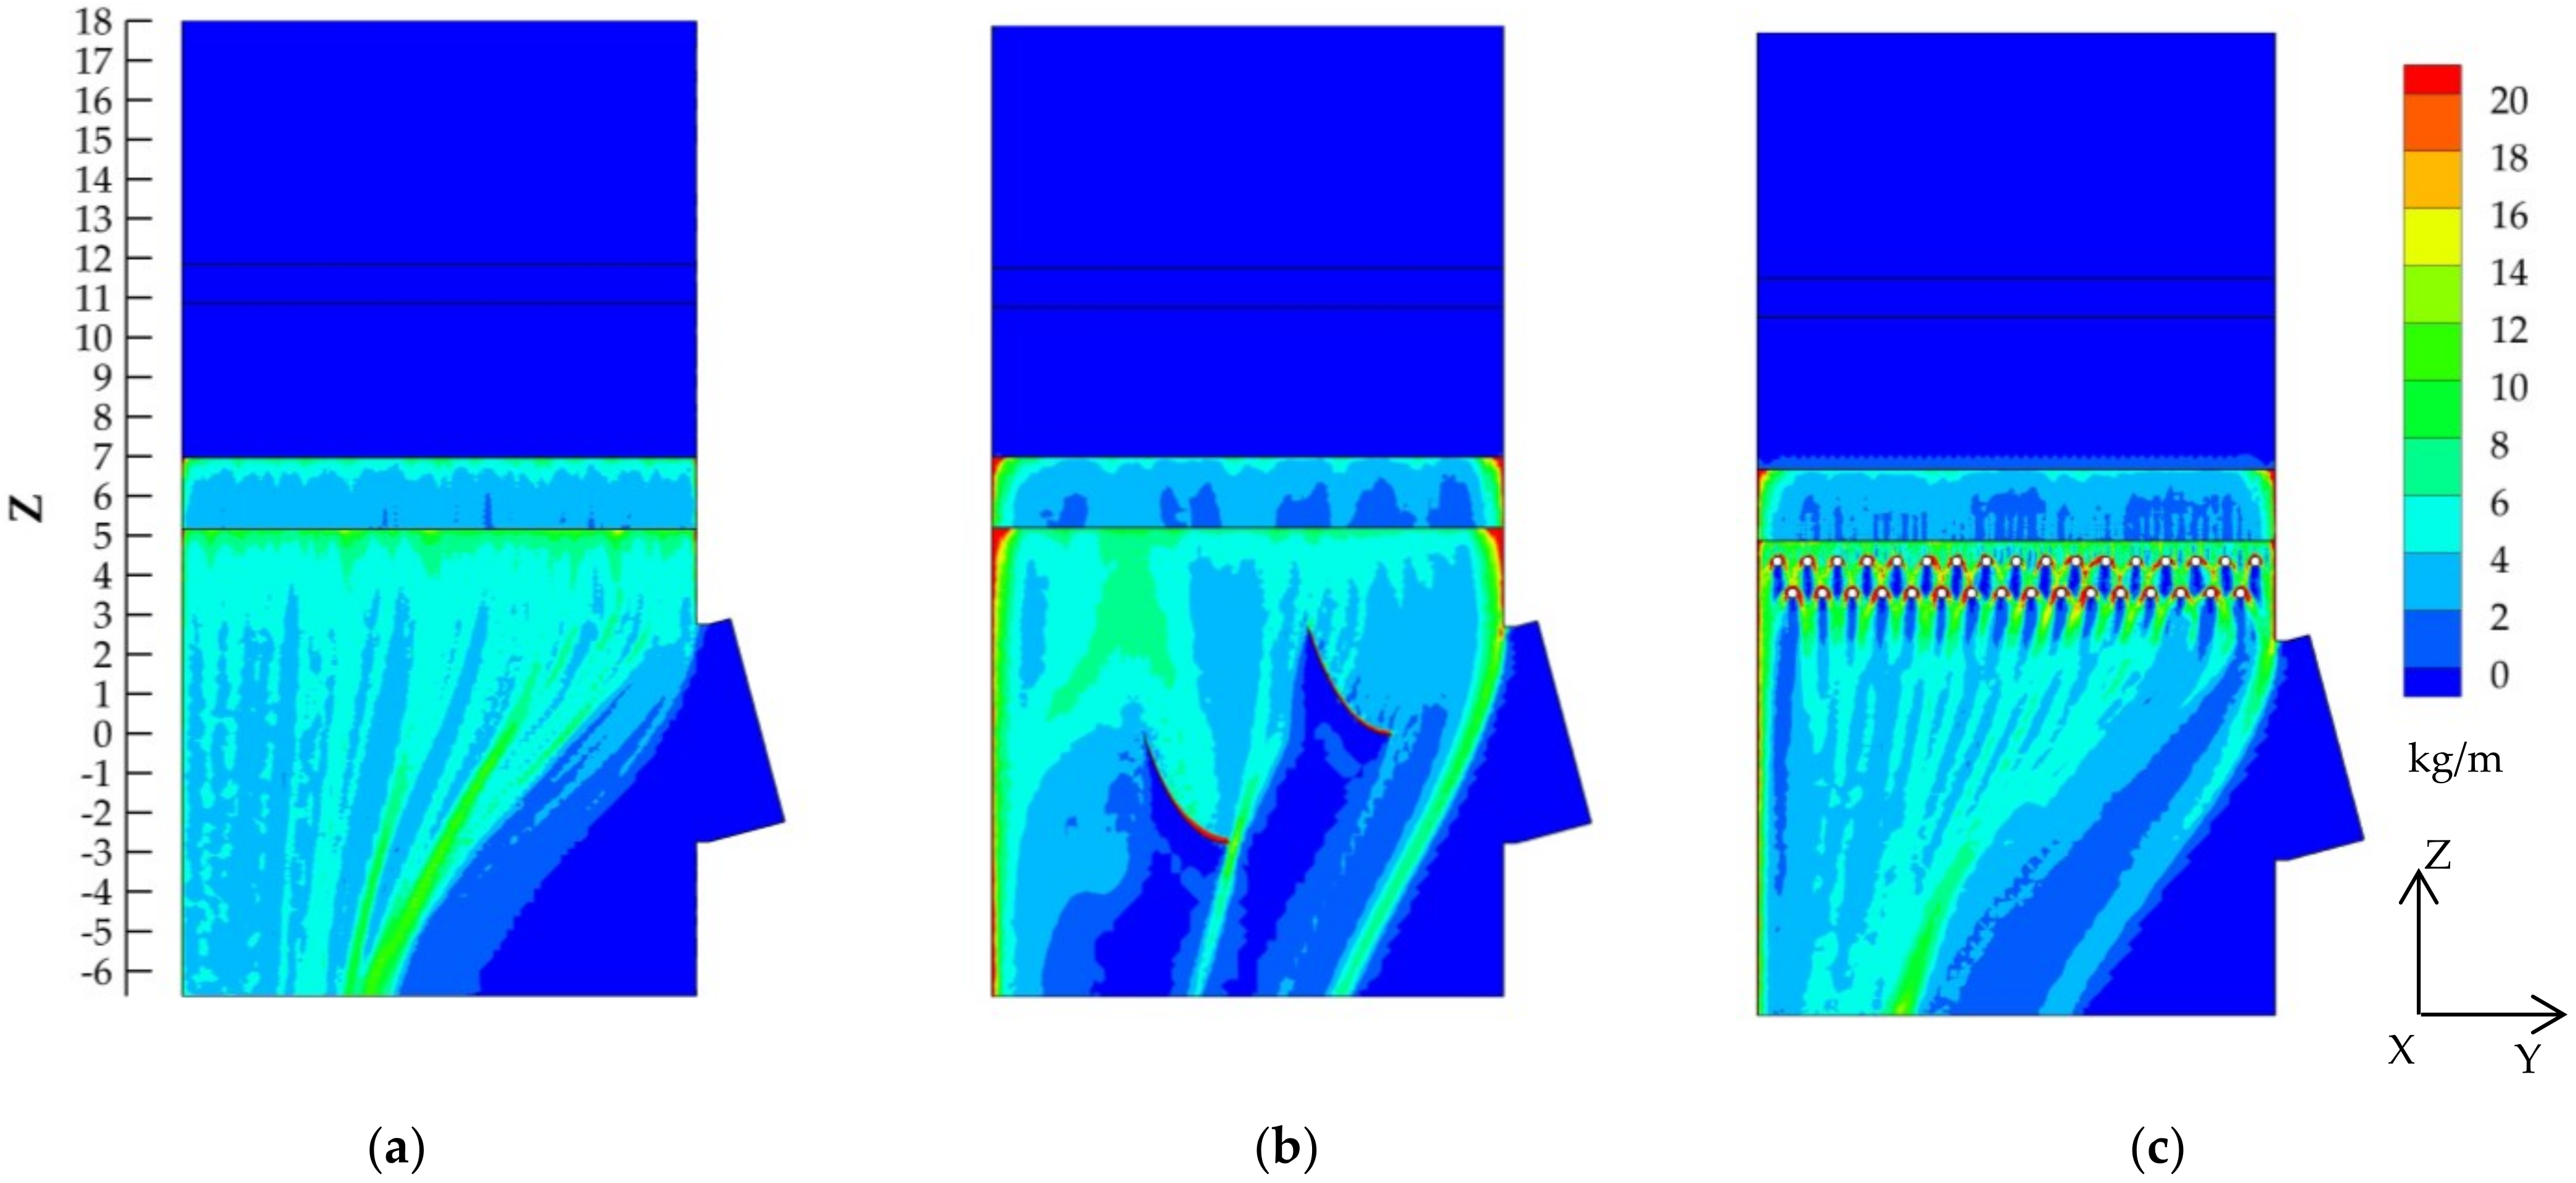
Figure 7 shows the liquid mass concentration distribution on the X = 0 plane. In the OST, the flue gas enters the tower and flows to the left (the negative direction of the Y axis) and upward (the positive direction of the Z axis) at a relatively high velocity near the inlet. The flue gas stream can be divided into two types according to its flow path, one is the stream SOST,A with a short path in the liquid distribution area, and the other is the flow SOST,B with a long path. Obviously, stream SOST,B has better contact with the liquid. However, the running resistance of SOST,B is larger, making the flue gas flow of stream SOST,A stronger than SOST,B. After the flue gas flows into the liquid distribution area, the flue gas with a high velocity is subject to greater resistance, while that of the flue gas with a low velocity is just the opposite. This is a rectifier phenomenon between gas and liquid phases. Even if there is rectification phenomenon, the flue gas velocity distribution tends to be obviously uniform when the flue gas reaches a height of more than 5 m. In DST, the flue gas passes through the diversion of the first deflector to form two streams, one stream (SDST,A) flow upward, and the other forms two streams (SDST,B and SDST,C) by the second deflector. Streams SDST, B and SDST, C have better contact with the liquid and are stronger than SDST,A. In RBST, the flue gas flow is similar to OST, and the component of the flow velocity on the Y axis is larger, which makes the flue gas flow in the negative direction (left) of the Y axis toward the tower. Thus, the flue gas flow of stream SRBST,B is stronger than stream SOST,B.
In the three working conditions, the spray liquid near the flue gas inlet is affected by the movement of the flue gas and moves to the left, causing the liquid aggregation and high concentration liquid interface formation. And at the same time, an area with zero liquid concentration is formed near the inlet, namely the “Liquid Void Area”, causing uneven distribution of liquid. The deflectors cause the liquid to be blocked and concentrated above the deflectors. As a result, two “Liquid Void Areas” are formed below deflectors.
In the OST, the gas velocity is high and the liquid concentration is low in the inlet area. The liquid is concentrated in the left side of the tower and almost no gas flows through, resulting in poor gas-liquid contact conditions. However, for streams SDST,B and SDST,C in DST as well as stream SRBST,B in RBST, the velocity component of flue gas in the Y axis direction is relatively high, so the flue gas can flow smoothly to the left side of the tower, thus improving the contact conditions between the two phases, which is the gas-liquid contact intensification effect.
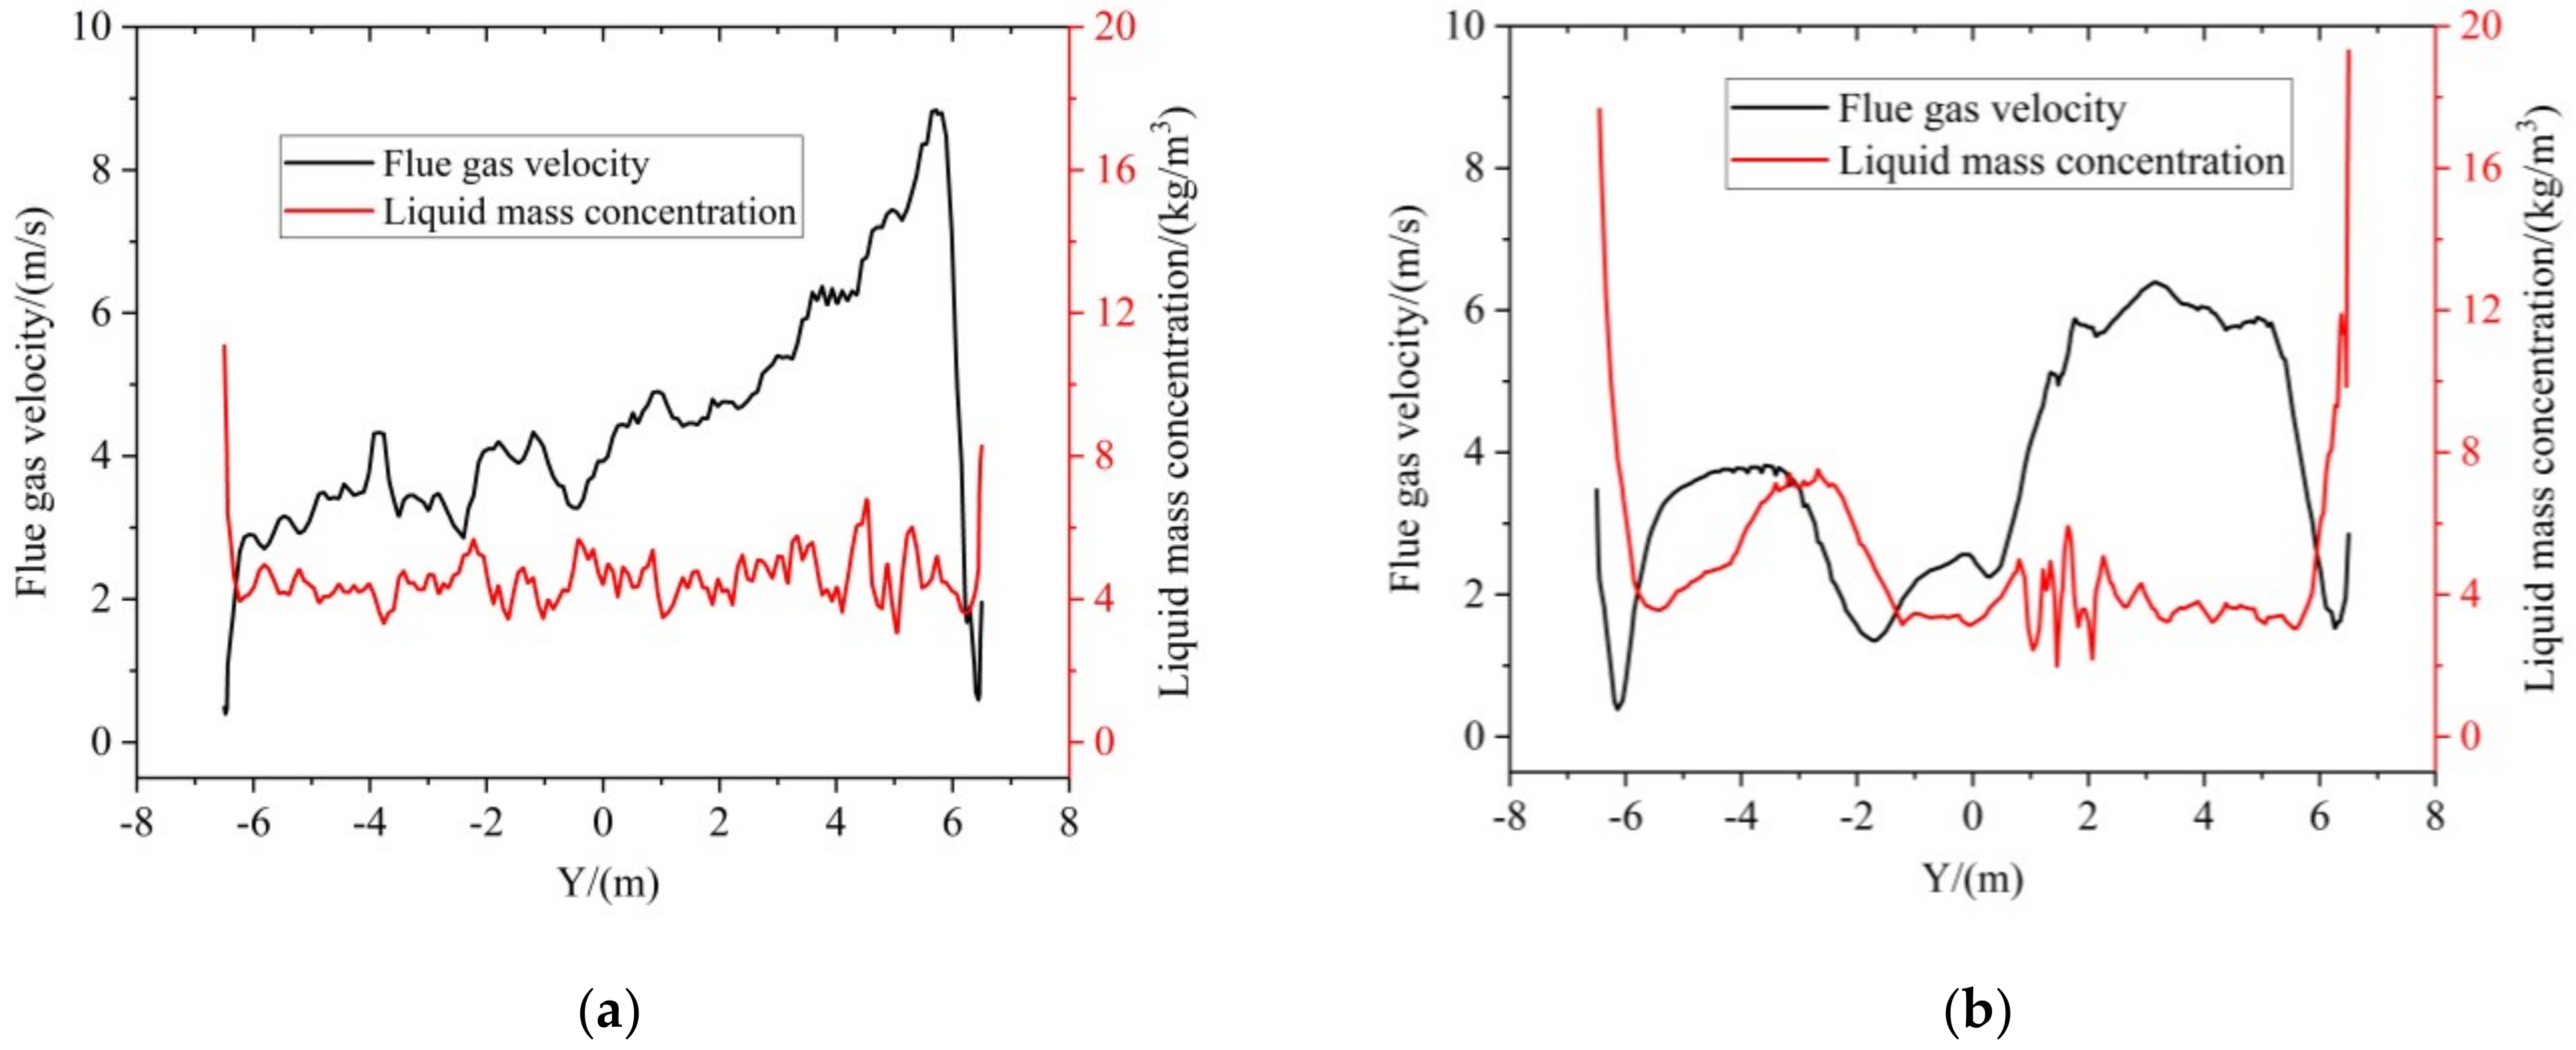
Figure 8 shows the distribution of flue gas velocity and liquid mass concentration on the curve of height Z = 3 m on the plane X = 0. In OST, the liquid mass concentration is evenly distributed at about 4 kg/m3. However, within the range of Y = 4–6 m, the velocity of flue gas is higher than 6 m/s and the maximum reaches 8.8 m/s, forming a wide range of “flue gas channel”, resulting in a short gas-liquid contact time, and insufficient heat and mass transfer. In DST, the existence of the diversion of the deflectors makes the occurrence of two peaks in the flue gas velocity curve, and the maximum velocity is up to 6.3 m/s. At the position of the left peak, the liquid mass concentration distribution is also at the peak, and the gas-liquid contact has been intensified. At the same time, at the position of the right peak, the flue gas velocity is far less than that of OST, and the liquid mass concentration is also around 4 kg/m3. Therefore, the gas-liquid contact is also strengthened. In RBST, the maximum peak velocity of flue gas is 8.4 m/s, which is lower than OST. Flue gas velocity and liquid mass concentration fluctuate, obviously. High-speed flue gas and high mass concentration liquid do not continuously gather, which avoids the formation of a wide range of “flue gas channel”, which also strengthens the gas-liquid contact.

4.2. The Heat Transfer of Gas-Liquid

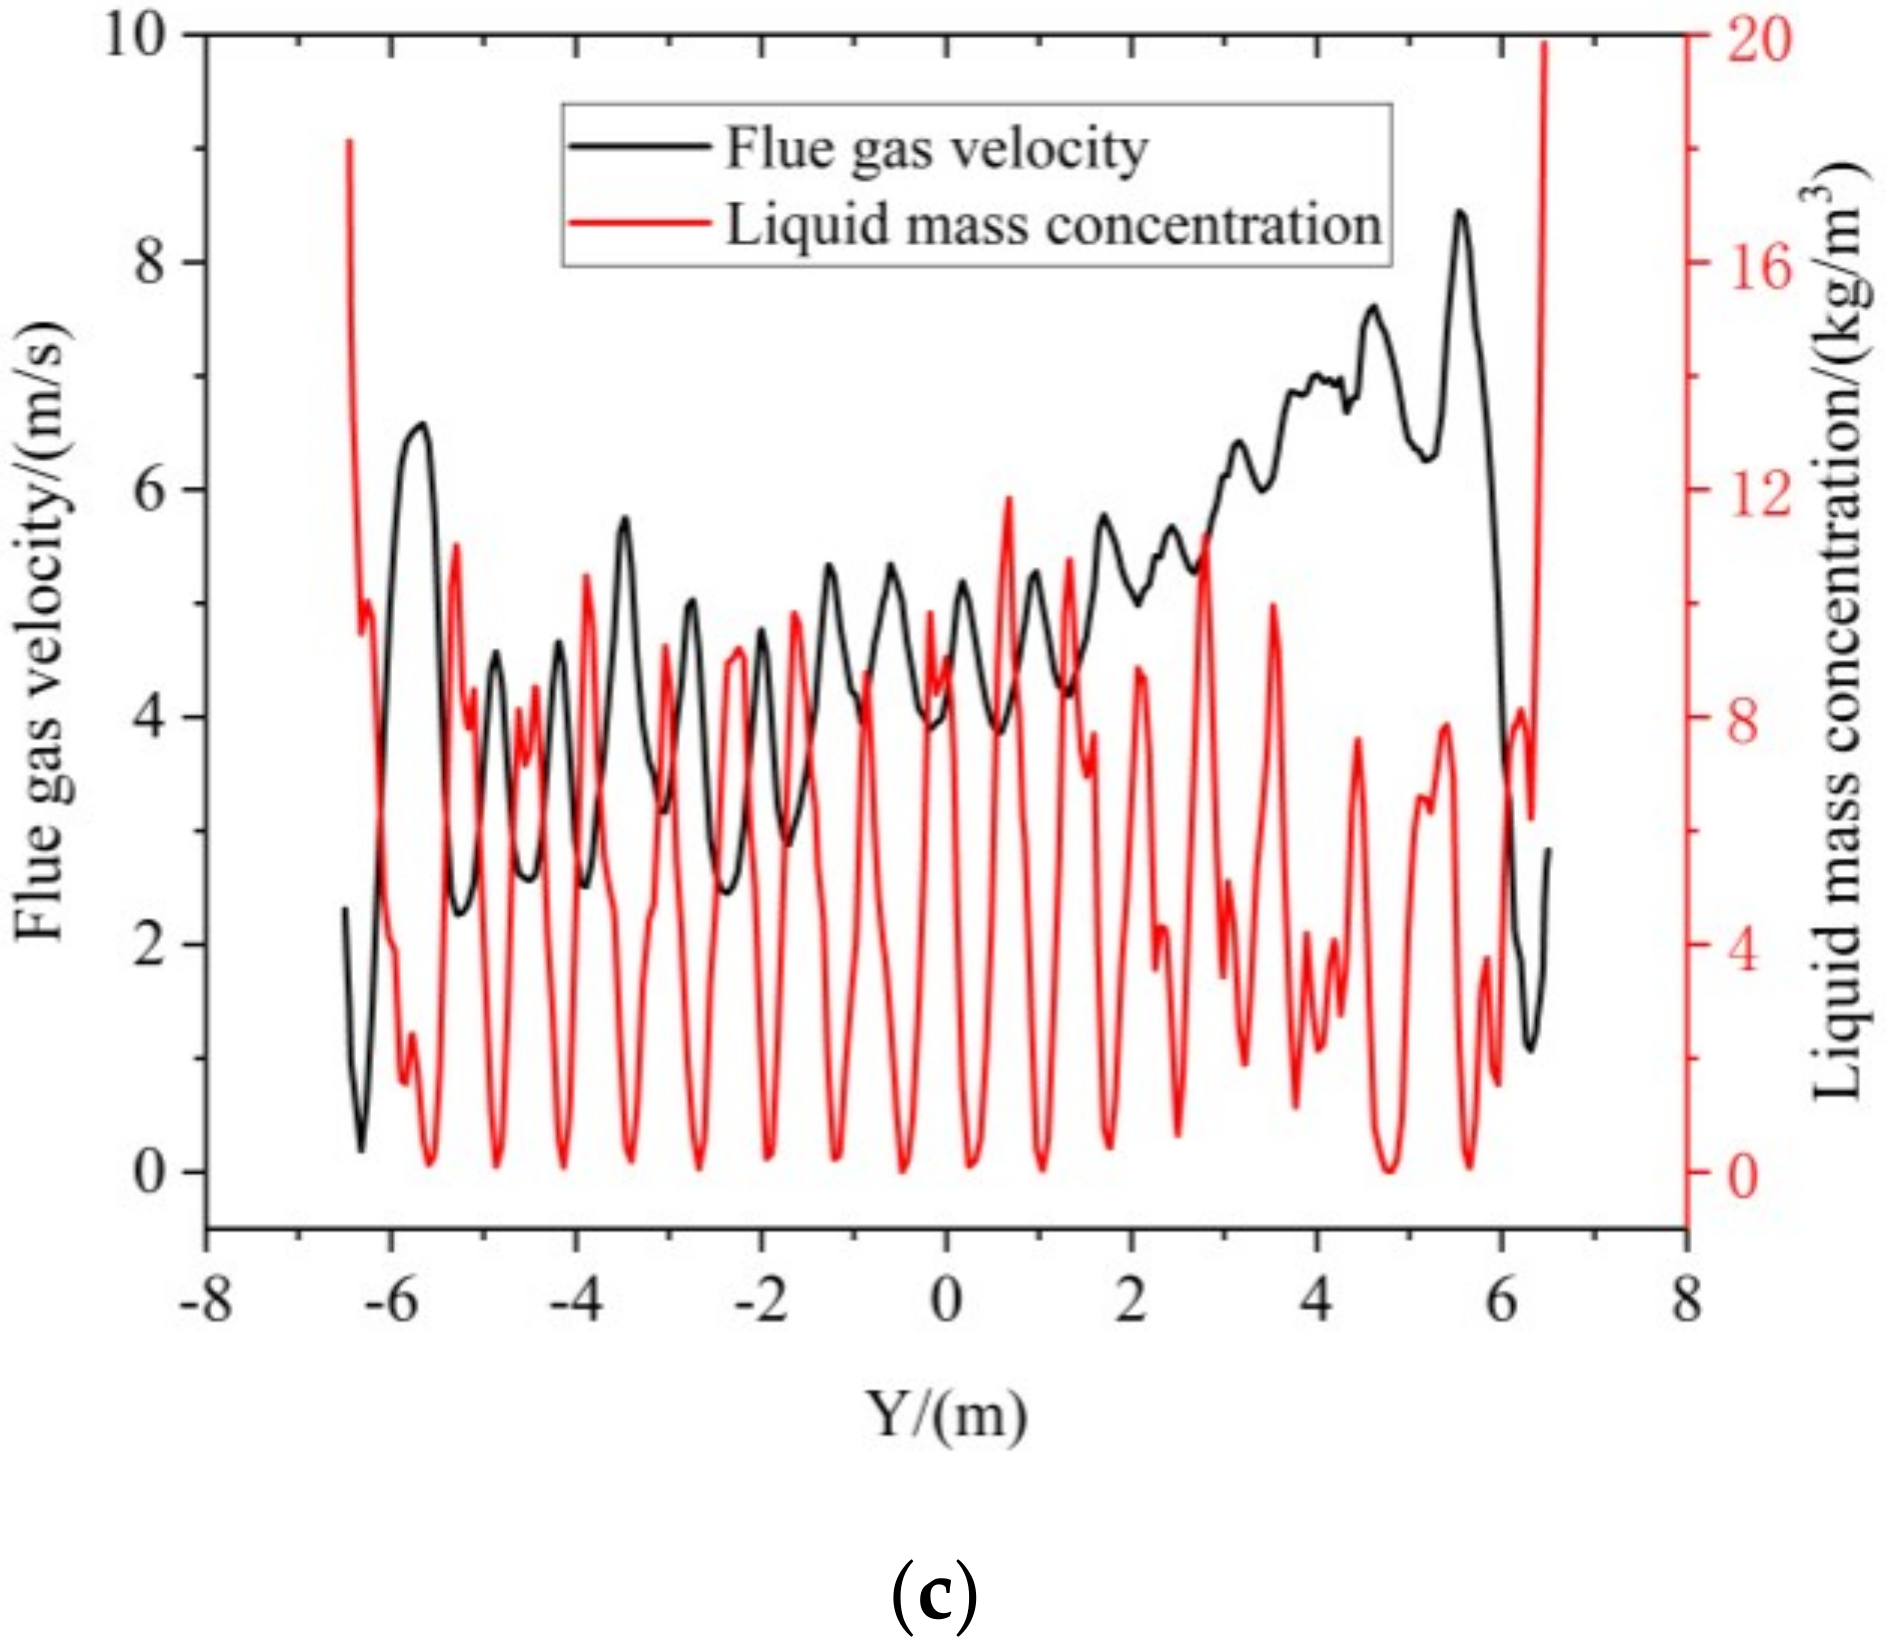
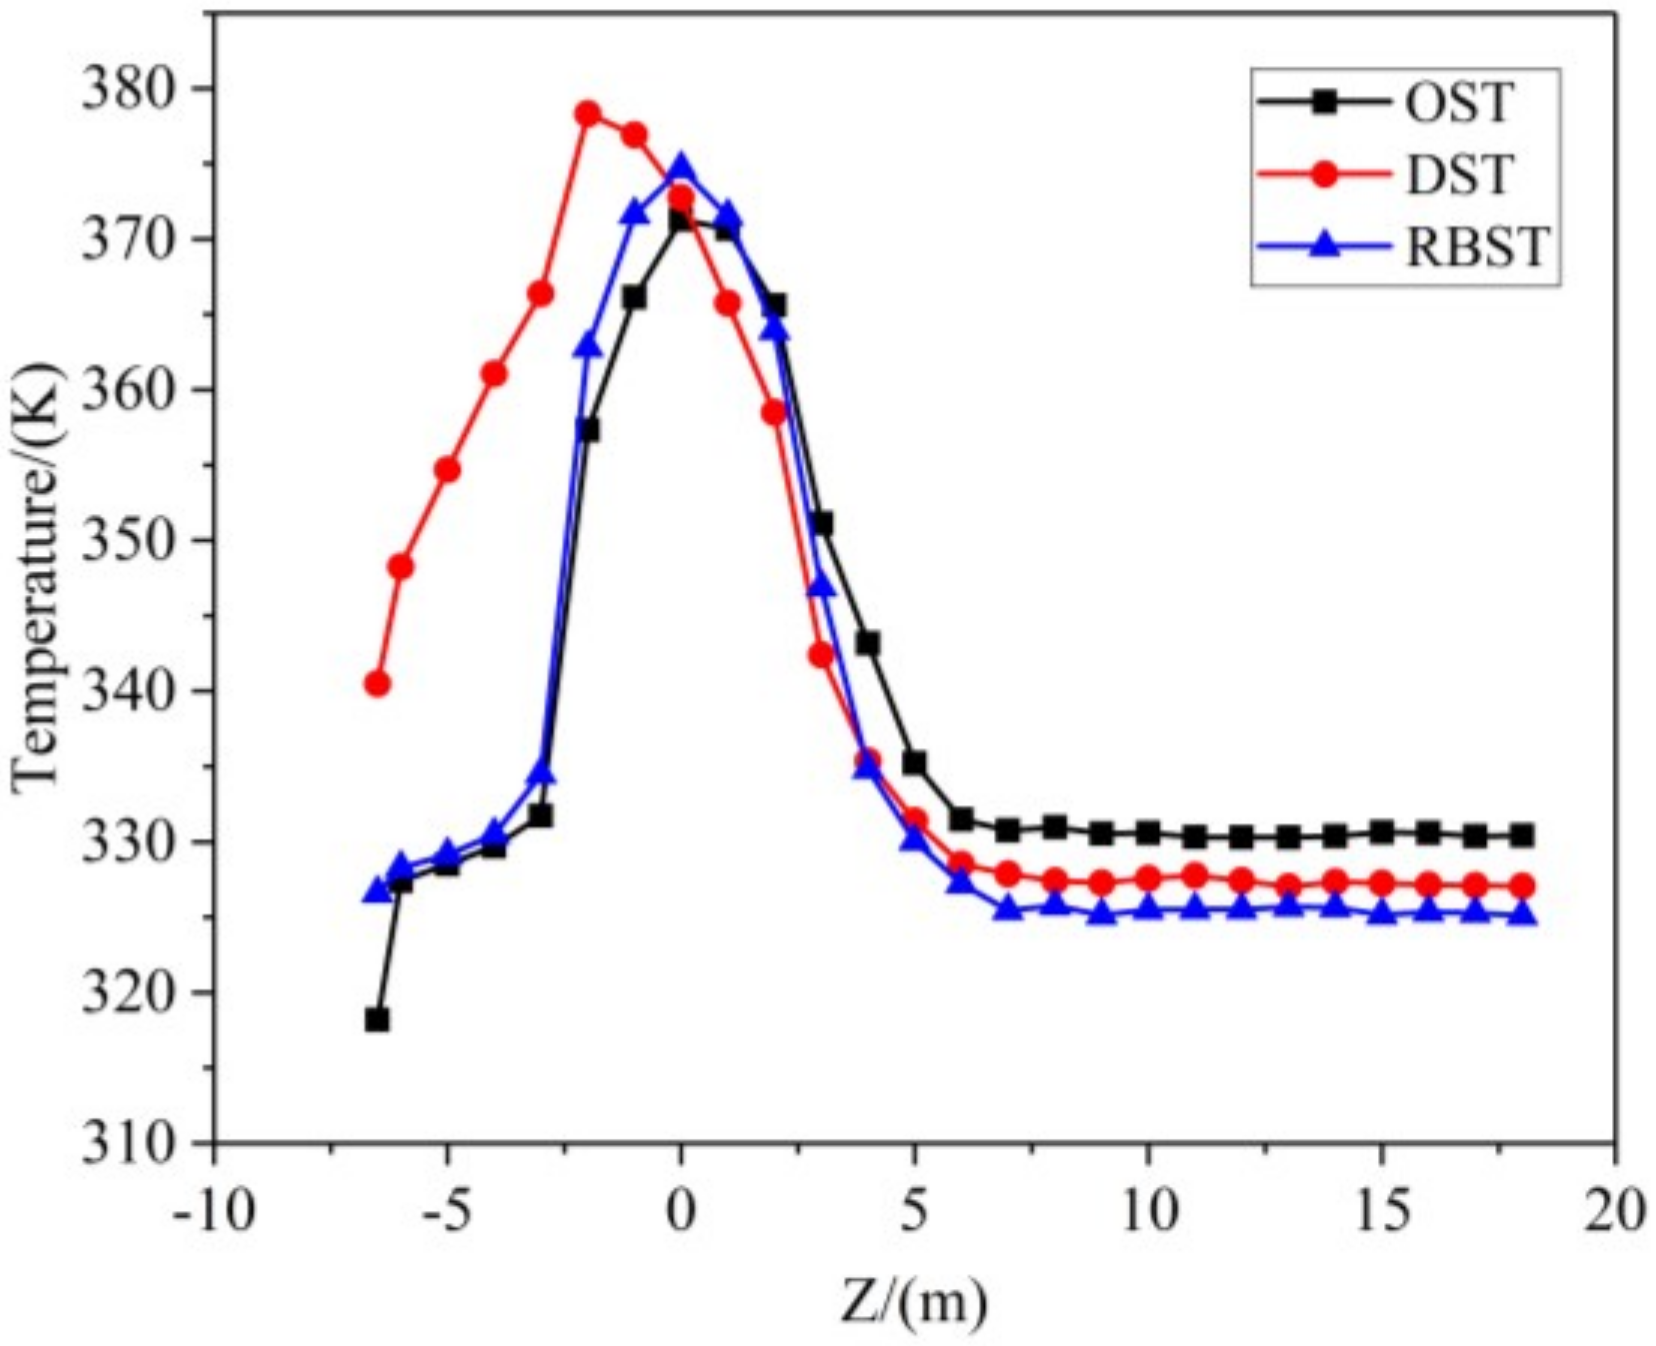
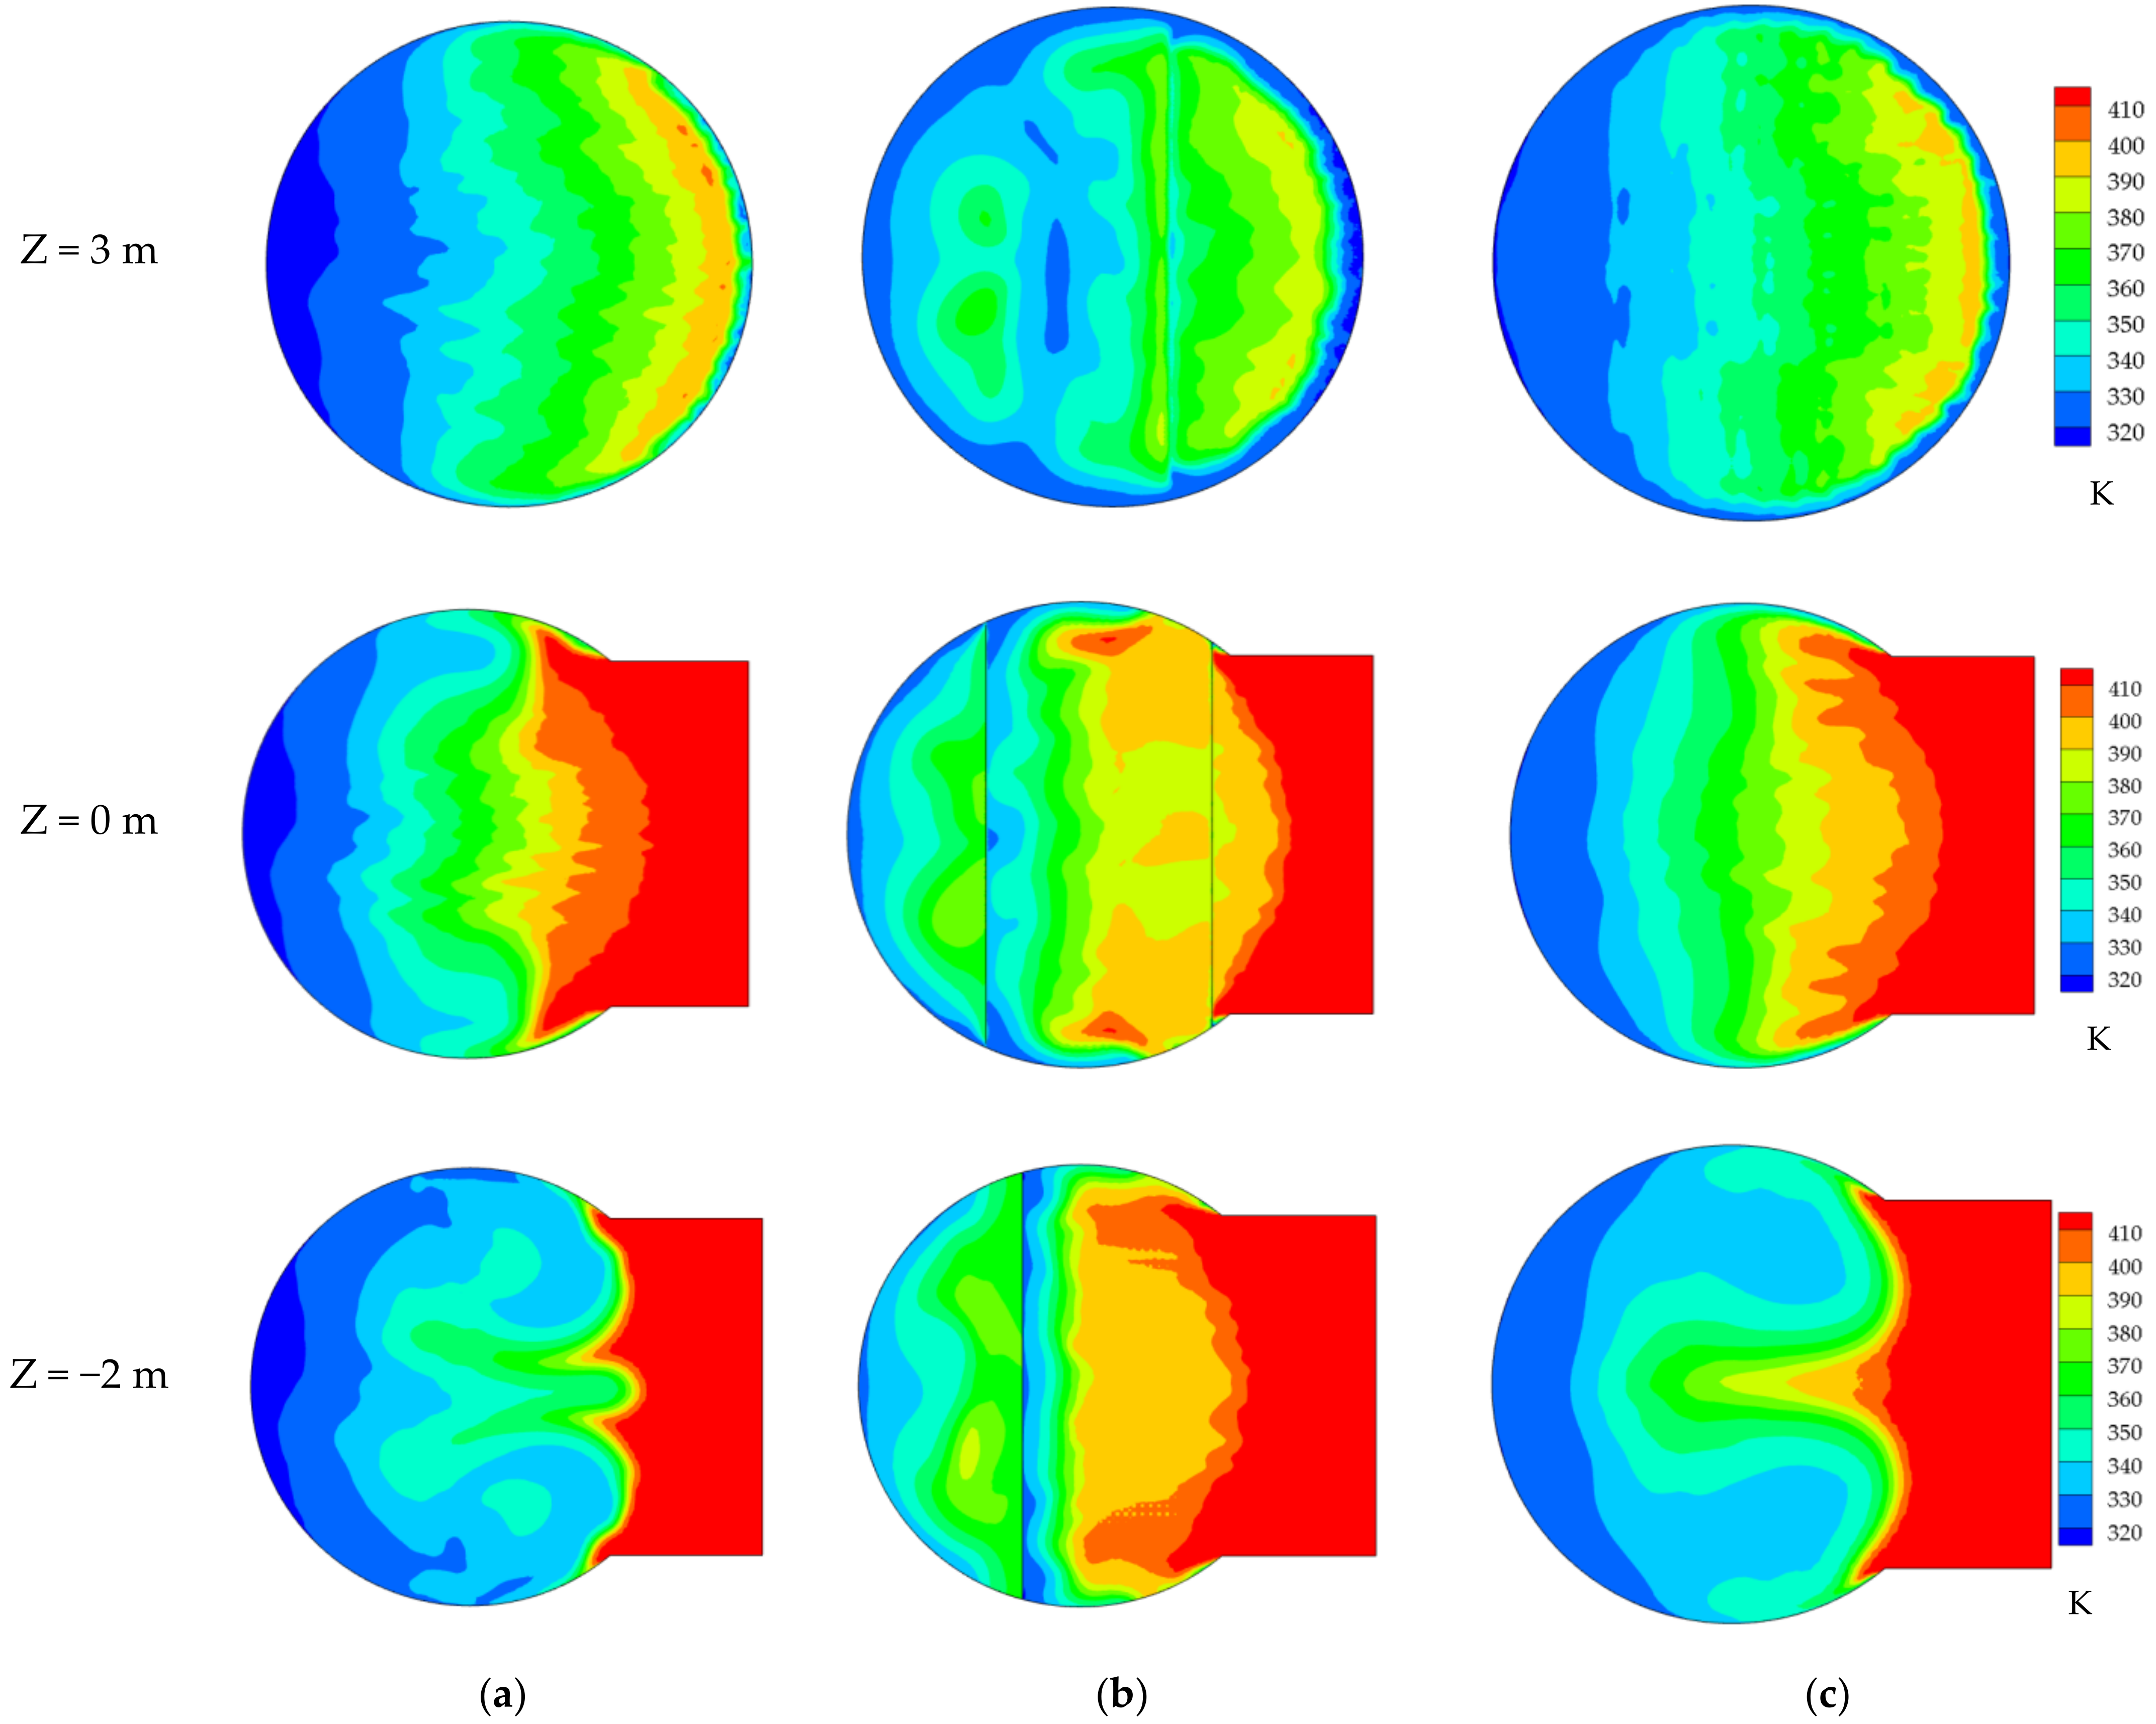
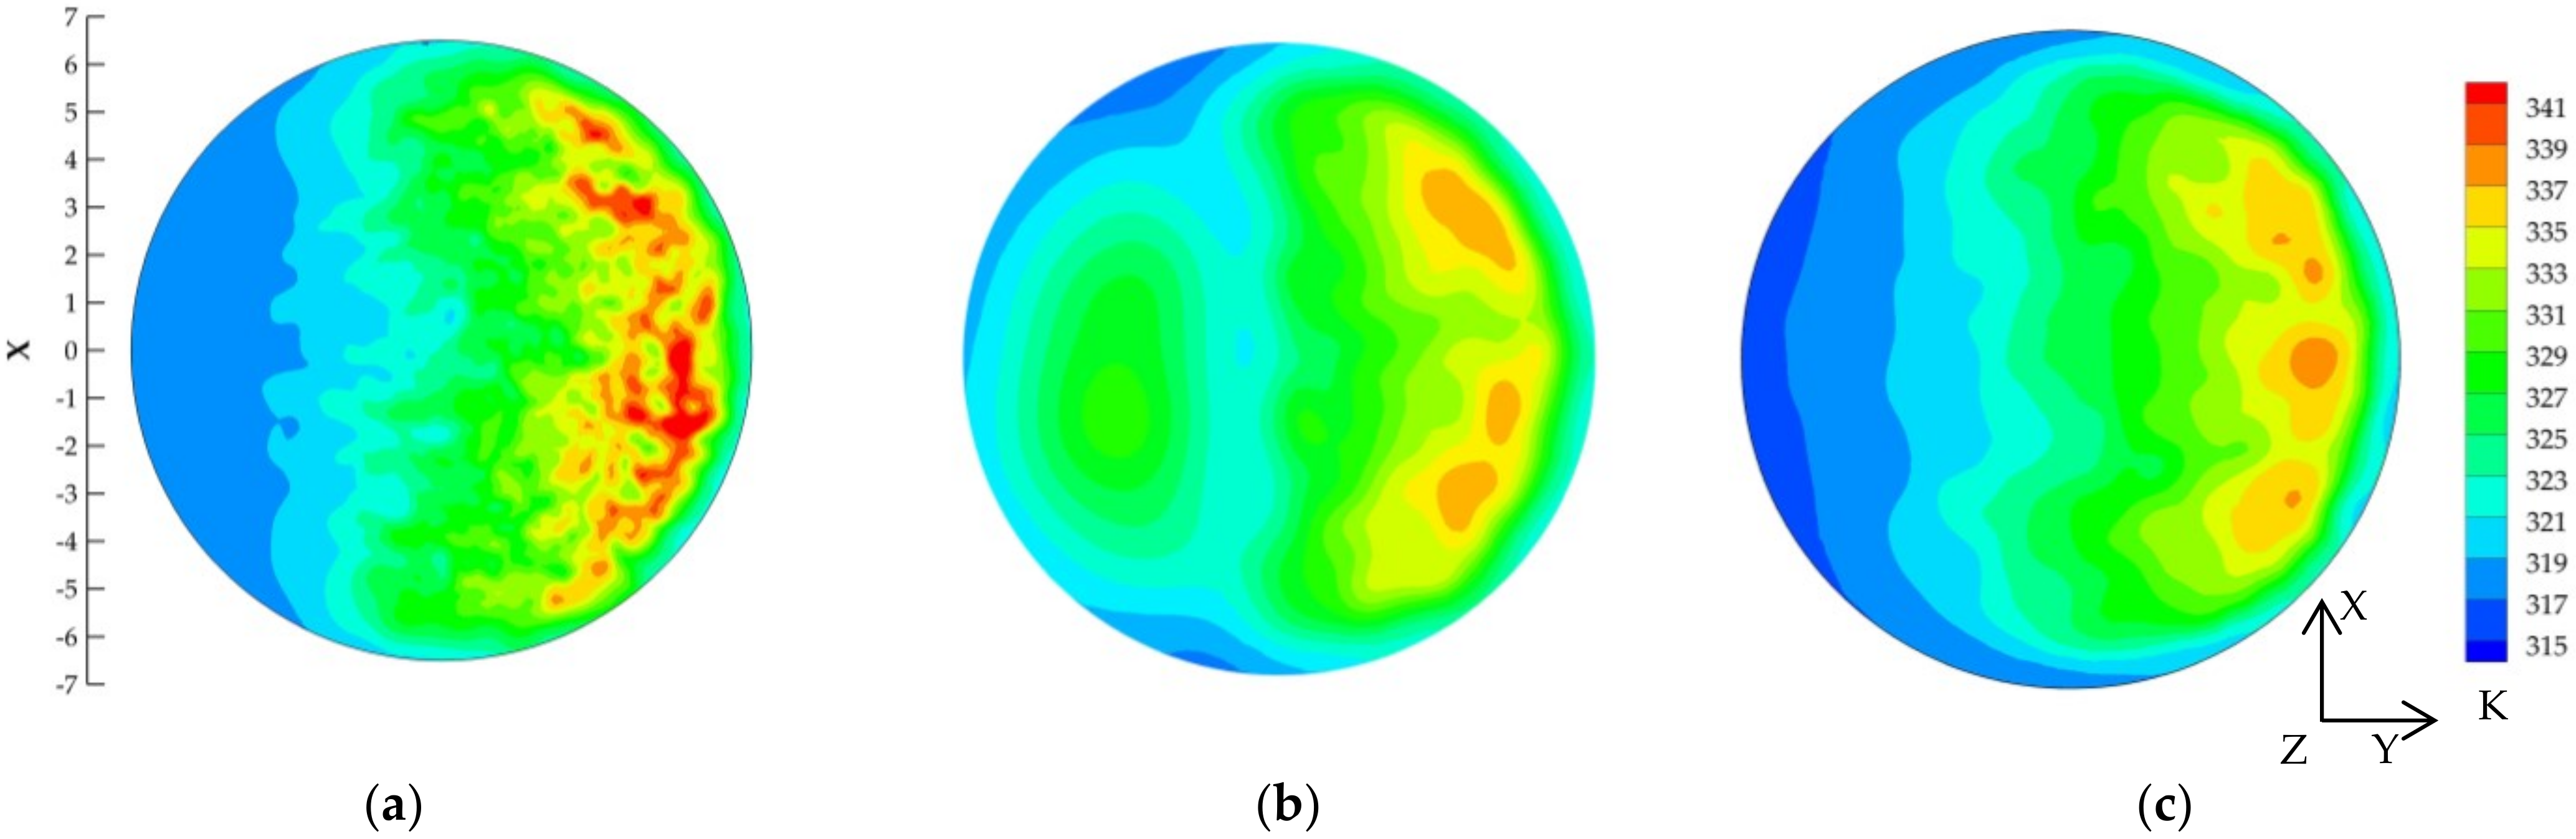
Figure 9 displays the average temperature distribution curve of flue gas at different height Z of the desulfurization spray tower. Figure 10 displays the distribution of flue gas temperature at different planes. In OST and RBST, the average temperature of flue gas reaches its maximum at Z = 0 (inlet center level height). The maximum average temperature of RBST is greater than OST for the reason that the flue gas of RBST is more widely distributed on the plane Z = 0. Then, as the heat transfer process continues, the flue gas temperature gradually decreases. When the flue gas moves upward to Z = 2 m, the average temperature of flue gas in RBST is already less than OST, and the temperature difference between them becomes larger with the increase in height. Due to the gas-liquid contact intensification caused by the rod bank, the heat transfer efficiency between the two phases in RBST is increased. In DST, due to the action of the first deflector, part of the flue gas flows downward for a certain distance, so the maximum average temperature is at the height Z = −2 m. When the flue gas moves towards Z = 1 m, the gas-liquid contact strengthening effect of DST makes the average temperature of DST flue gas lower than OST. Finally, when the flue gas moves to a position above Z = 7 m, the two phases are out of contact; the average temperature of flue reaches a stable state.
Figure 11 is the distribution of flue gas temperature at Z = 8 m plane. In OST, two-phase heat transfer is insufficient while there is higher temperature in part of the flue gas. In DST and RBST, the two-phase heat transfer effect is better, which further verifies the promoting effect of gas-liquid contact intensification on heat transfer.
Table 5 shows the temperature difference between inlet and outlet of the three working conditions. The temperature difference between inlet and outlet of DST is 3.3 K, which is higher than that of OST. In RBST, the gas-liquid heat transfer effect is the best, and the temperature difference between inlet and outlet flue gas is 5.3 K higher than that of OST.

4.3. The Mass Transfer of Gas-Liquid

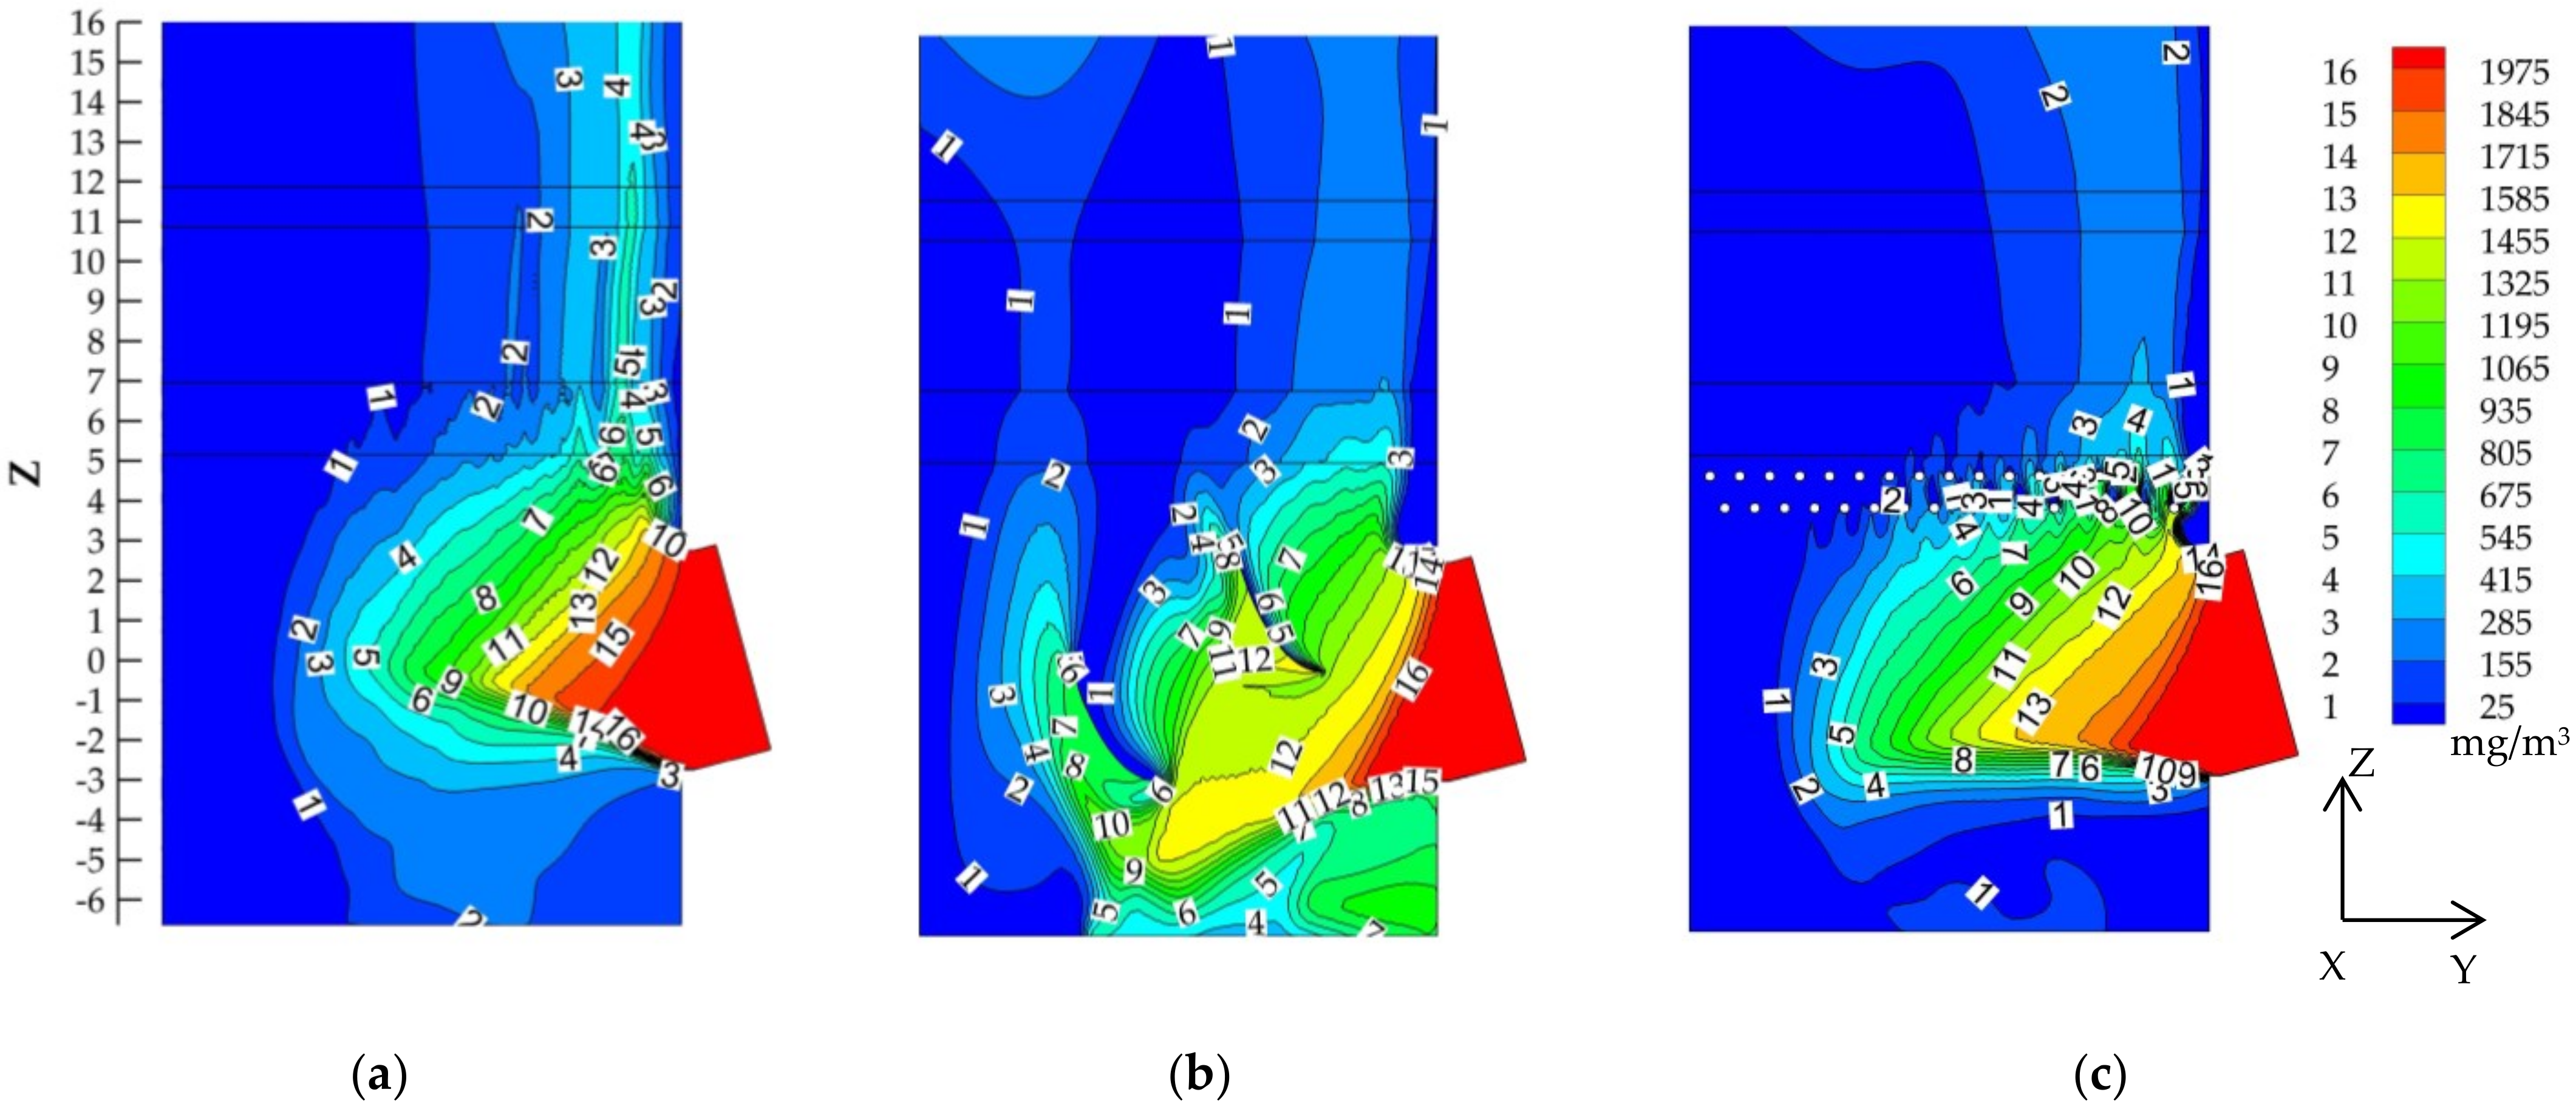
Figure 12 displays the concentration distribution of sulfur dioxide. When the flue gas enters the tower, SO2 reacts quickly with the slurry and its concentration decreases gradually. In OST, Stream SOST,A is still diffused for high concentration of SO2 due to its poor contact condition with liquid and incomplete reaction. In DST, the distribution of high concentration of SO2 in the Y axis is more extensive, which is more conducive to the reaction. In RBST, the high concentration of SO2 is more widely distributed in the Y-axis direction, while the SO2 concentration drops sharply and the reaction is violent when the flue gas moves to the position of the rod bank. In DST and RBST, although SO2 is not completely absorbed due to contact intensification, the concentration of escaped SO2 was significantly lower than that of OST.
In Table 6, the desulfurization efficiency under three working conditions is listed. The desulfurization efficiency of DST and RBST increase by 1.8% and 3.6%, respectively, when compared with OST.

4.4. Pressure Drop of Tower

The pressure drop in the desulfurization spray towerhas a significant impact on operating costs. Installing deflectors and rod bank in the desulfurization spray tower will cause an obvious effect on flue gas operation. Therefore, the running resistance of the tower must be optimized.
In 
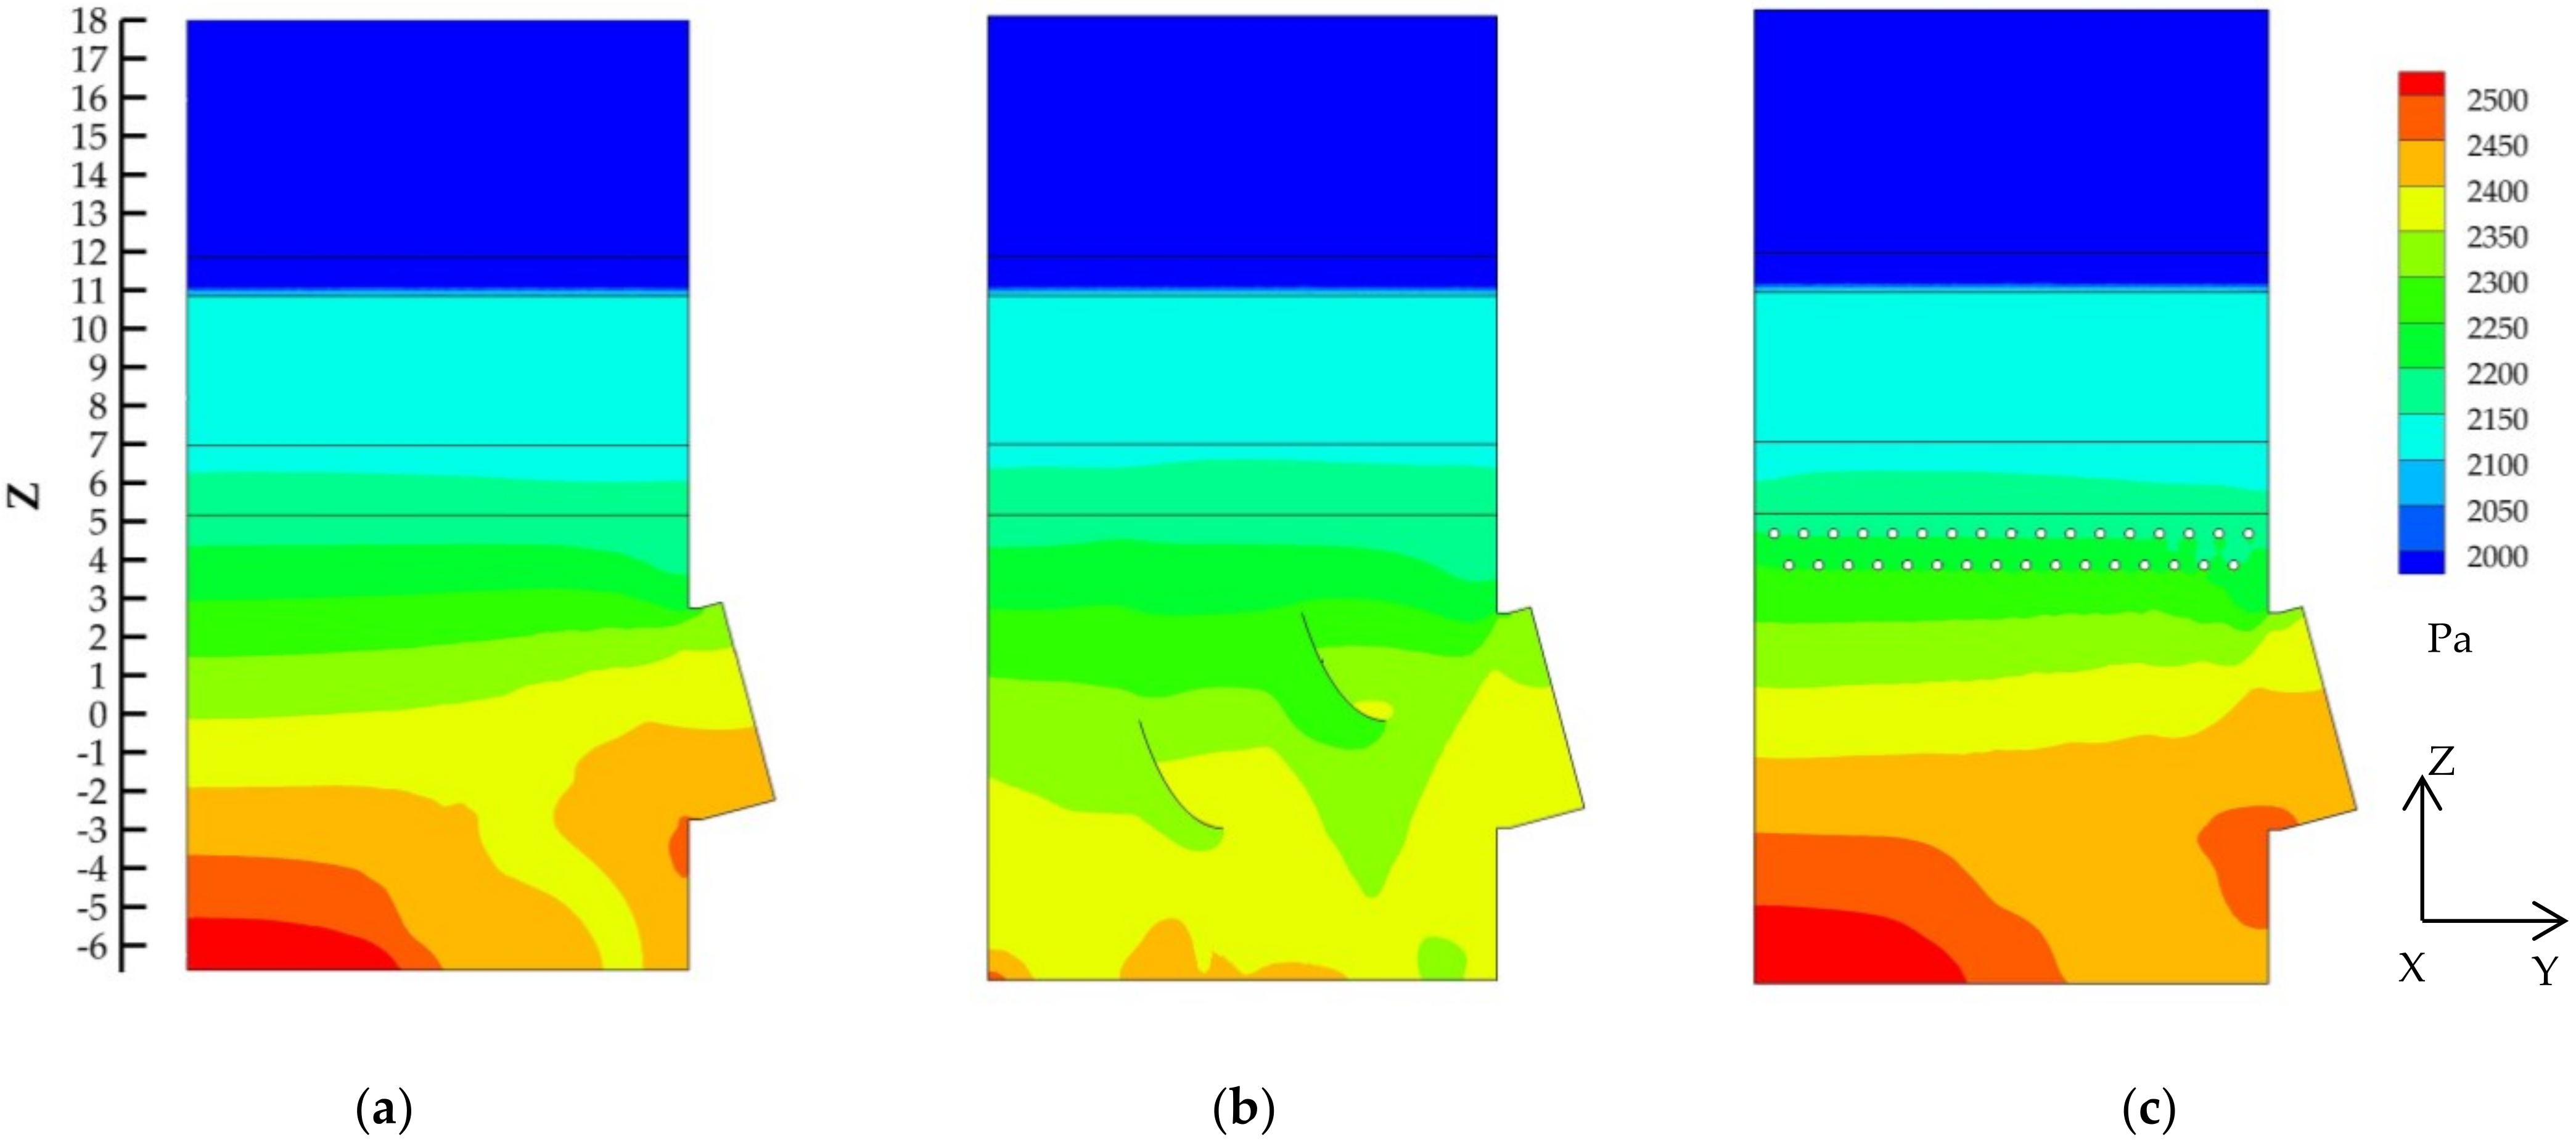
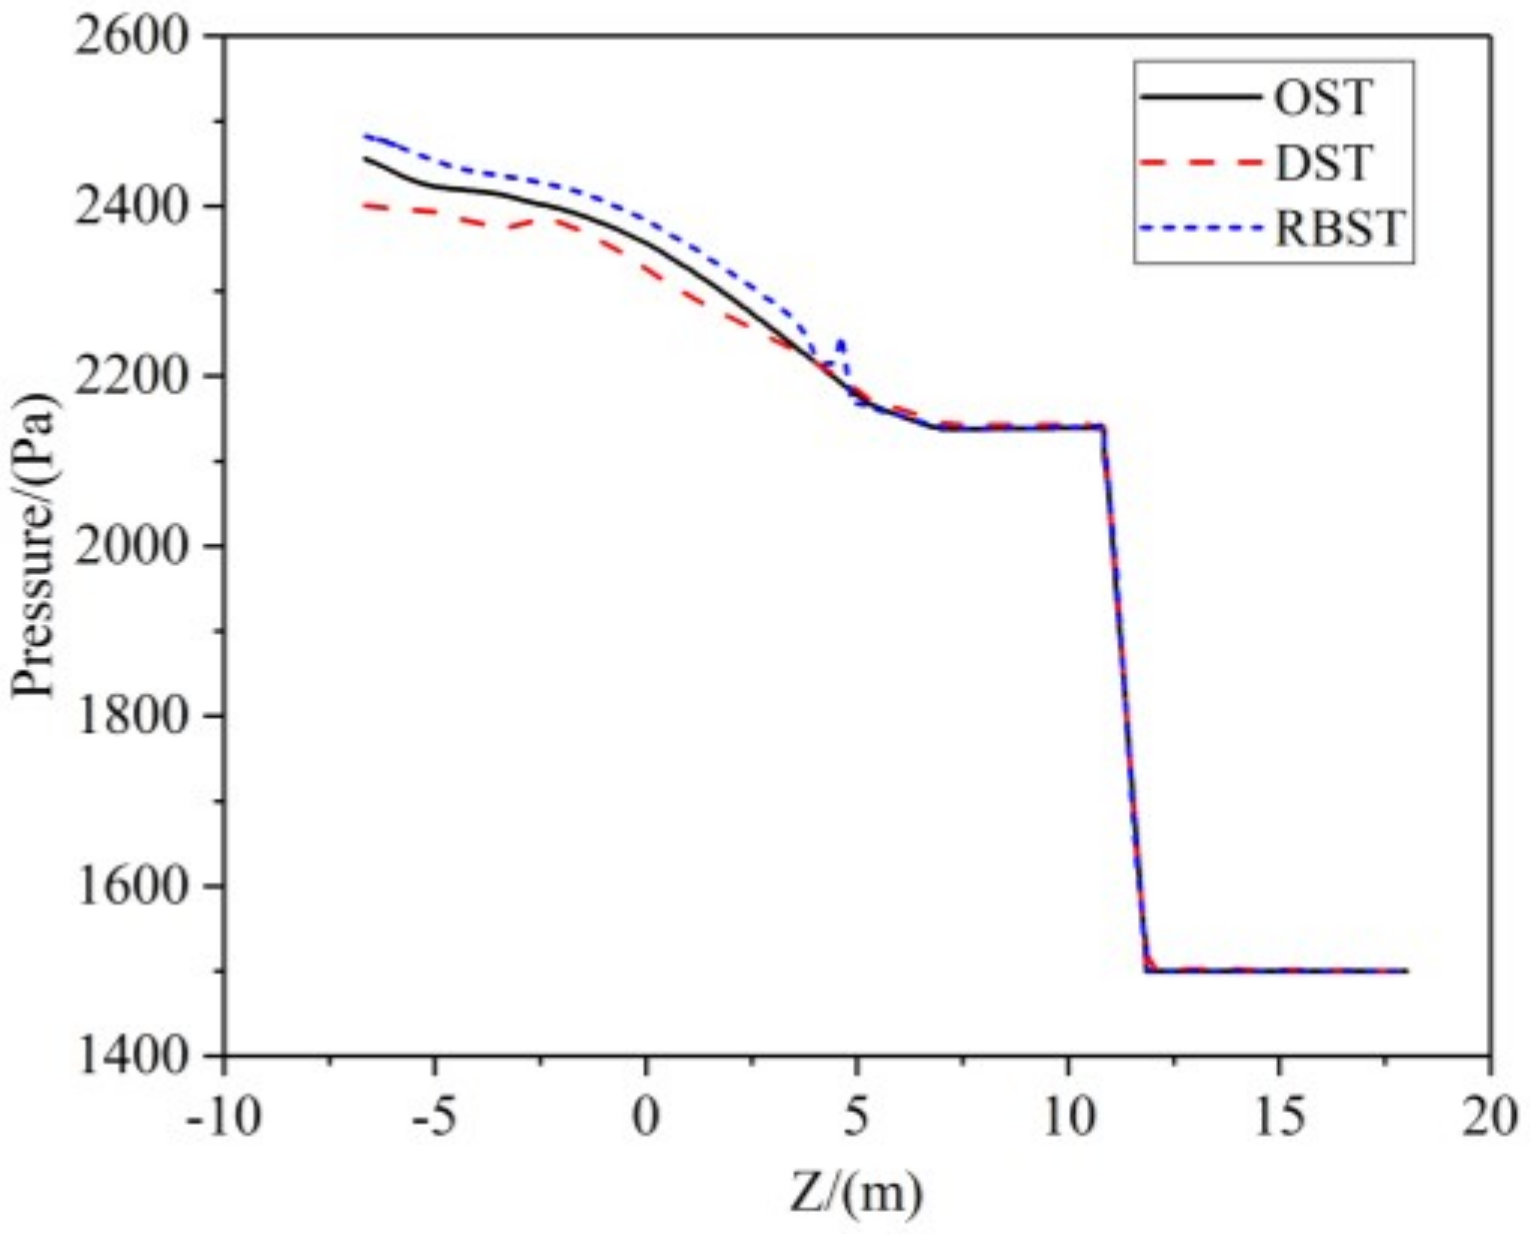
Figure 13, the pressure changes mainly occurred in two areas. First, the pressure decreases under the spray layer area. Second, pressure mutations occur in the porous media zone. In Figure 14, the pressure distribution curve along the central axis of the tower is shown. The difference of pressure variation in the three working conditions is mainly in the area below the spray levels. Here, the reason for the pressure drop is the change of tower structure, rectifying components (deflectors and rod bank) and resistance from liquid phase. In DST, the flue gas flows from both sides of the deflectors, which causes less resistance. Meanwhile, the deflectors cause the “liquid void areas”, which indirectly reduces the resistance from liquid phase. Therefore, overall, the pressure required by the DST inlet is reduced relative to the OST. In RBST, the rod bank has a direct obstruction effect on the flow of flue gas. Meanwhile, its liquid phase distribution is similar to OST, and the resistance from liquid phase does not decrease. Therefore, the pressure required by RBST inlet is increased relative to OST.
Table 7 lists inlet and outlet pressure drop data under three working conditions. The pressure drop of DST is 37 Pa lower than that of OST. In RBST, the rods are distributed across the entire cross section of the tower, which impedes the flow of the flue gas. As a result, the pressure drop is 33 Pa higher than the OST.

5. Conclusions

In this paper, the Euler–Lagrange method, the standard k-ε turbulence model, the SO2 absorption model and porous media model based on the two-film theory are applied to simulate the gas-liquid two-phase flow with the consideration of heat and mass transfer between phases for DST, RBST and OST. Comparisons are summarized and the conclusions are as follows:
  • The experimental data are measured in a wet flue gas desulfurization tower of a 330 MW coal-fired unit; Compared with the simulation data in OST, the temperature difference, pressure drop and desulfurization efficiency is basically the same, which indicates that the numerical method is feasible and effective.
  • The gas-liquid contact intensification is mainly reflected in two aspects. First, the deflectors and the rod bank force the flue gas to the place where the liquid concentration is high, enhancing the liquid utilization efficiency. Second, the deflectors and the rod bank reduce the peak velocity of the flue gas and ensure the residence time of the flue gas in the liquid distribution area.
  • In DST, “Liquid Void Areas” are formed below the deflectors, which apparently has a weaken effect on gas-liquid contact. However, the flue gas flow passing under the deflectors will flow to the high concentration distribution area of the liquid, so that the DST as a whole still plays the role of gas-liquid contact strengthening. At the same time, "Liquid Void Areas" will reduce the resistance of flue gas flow.
  • The gas-liquid contact intensification can enhance the heat and mass transfer effect in the DST and RBST. In RBST, there is no factor to weaken the gas-liquid contact, so the heat and mass transfer effect is obviously better than DST.
  • In RBST, the resistance of flue gas flow increases, so it is necessary to pay attention to the increase in operation cost when using the rod bank to optimize the flow field.

Author Contributions

Conceptualization, Y.J. and W.Z.; methodology, Y.J.; software, Z.L. and W.Z.; validation, Y.J.; formal analysis, Y.J.; investigation, Z.L., W.Z. and Y.J.; resources, Y.J. and Z.L.; data curation, Y.J.; writing—original draft preparation, W.Z.; writing—review and editing, Y.J.; visualization, Y.J.; supervision, Y.J.; project administration, Y.J. and Z.L.; funding acquisition, Y.J. All authors have read and agreed to the published version of the manuscript.

Funding

This research was funded by the financial supports from the Key Research and Development Program of Zhejiang Province, grant number 2019C03117.

Institutional Review Board Statement

Not applicable.

Informed Consent Statement

Not applicable.

Data Availability Statement

All relevant data presented in the article are stored according to institutional requirements and, as such, are not available online. However, all data used in this manuscript can be made available upon request to the authors.

Acknowledgments

The authors gratefully acknowledge the financial supports from the Key Research and Development Program of Zhejiang Province (No.2019C03117).

Conflicts of Interest

The authors declare no conflict of interest.

References

  1. Wu, X.C.; Zhao, H.F.; Zhang, Y.X.; Zheng, C.H.; Xiang, G. Measurement of slurry droplets in coal-fired flue gas after WFGD. Environ. Geochem. Health 2015, 37, 915–929. [Google Scholar] [CrossRef]
  2. Uchida, S.; Moriguchi, H.; Maejima, H.; Koide, K.; Kageyama, S. Absorption of Sulfur Dioxide into Limestone Slurry in a Stirred Tank Reactor. Can. J. Chem. Eng. 1978, 56, 690–697. [Google Scholar] [CrossRef]
  3. Xiang, G.; Ding, H.; Zhen, D.; Wu, Z.; Fang, M.; Luo, Z.; Cen, K. Gas-liquid absorption reaction between (NH4)2SO3 solution and SO2 for ammonia-based wet flue gas desulfurization. Appl. Energy 2010, 87, 2647–2651. [Google Scholar]
  4. Zhu, J.; Ye, S.C.; Bai, J.; Wu, Z.Y.; Liu, Z.H.; Yang, Y.F. A concise algorithm for calculating absorption height in spray tower for wet limestone–gypsum flue gas desulfurization. Fuel Process. Technol. 2015, 129, 15–23. [Google Scholar] [CrossRef]
  5. Zhang, Q.; Wang, S.; Zhu, P.; Wang, Z.; Zhang, G. Full-scale simulation of flow field in ammonia-based wet flue gas desulfurization double tower. J. Energy Inst. 2017, 91, 619–629. [Google Scholar] [CrossRef]
  6. Deng, Q.; Ran, J.; Niu, J.; Yang, Z.; Yang, L. Numerical Study on Flow Field Distribution Regularities in Wet Gas Desulfurization Tower Changing Inlet Gas/Liquid Feature Parameters. J. Energy Resour. Technol. 2020, 143, 1–29. [Google Scholar]
  7. Wang, P.; Dai, G. Synergistic effect between spraying layers on the performance of the WFGD spray column. Asia Pac. J. Chem. Eng. 2018, 13, e2266. [Google Scholar] [CrossRef]
  8. Wang, S.J.; Zhu, P.; Zhang, G.; Zhang, Q.; Wang, Z.Y.; Zhao, L. Numerical simulation research of flow field in ammonia-based wet flue gas desulfurization tower. J. Energy Inst. 2015, 88, 284–291. [Google Scholar] [CrossRef]
  9. Xiao, Y.J.; Li, C.T.; Li, S.H.; Zeng, G.M.; Wen, Q.B.; Guo, G.Q.; Song, J.K. Optimal design of a wet-type desulphurization absorber by the numerical simulation method. Chem. Eng. Res. Des. 2014, 92, 1257–1266. [Google Scholar] [CrossRef]
  10. Chou, T.C.; Jui, L.C. Eulerian-Eulerian numerical simulation for a flue gas desulfurization tower with perforated sieve trays. Int. J. Heat Mass Transf. 2017, 116, 329–345. [Google Scholar]
  11. Zhen, C.; Haiming, W.; Jiankun, Z.; Changfu, Y. Enhancement of Mass Transfer between Flue Gas and Slurry in the Wet Flue Gas Desulfurization Spray Tower. Energy Fuels 2018, 32, 703–712. [Google Scholar]
  12. Chen, Z.; Wang, H.; Zhuo, J.; You, C. Experimental and numerical study on effects of deflectors on flow field distribution and desulfurization efficiency in spray towers. Fuel Process. Technol. 2017, 162, 1–12. [Google Scholar] [CrossRef]
  13. Wang, P.; Dai, G. Field Synergy of the Rod Bank on the Enhancement of Mass Transfer in a Spray Column. Ind. Eng. Chem. Res. 2018, 57, 12531–12542. [Google Scholar] [CrossRef]
  14. Wang, P.; Zhuang, L.; Dai, G. Synergistic effect of droplet self-adjustment and rod bank internal on fluid distribution in a WFGD spray column. Chem. Eng. Sci. 2017, 162, 227–244. [Google Scholar] [CrossRef]
  15. Cui, L.; Lu, J.; Liu, L.; Qin, M.; Dong, Y. Simulation study on novel groove separator in a dual—Loop wet flue gas desulfurization spray tower. Asia Pac. J. Chem. Eng. 2020, 15, e2442. [Google Scholar] [CrossRef]
  16. Dana, M.M.; Javidi, M. Corrosion simulation via coupling computational fluid dynamics and NORSOK CO2 corrosion rate prediction model for an outlet header piping of an air-cooled heat exchanger. Eng. Fail. Anal. 2021, 122, 105285. [Google Scholar] [CrossRef]
  17. Rzehak, R.; Liao, Y.; Meller, R.; Schlegel, F.; Lehnigk, R.; Lucas, D. Radial pressure forces in Euler-Euler simulations of turbulent bubbly pipe flows—ScienceDirect. Nucl. Eng. Des. 2021, 374, 111079. [Google Scholar] [CrossRef]
  18. Movahedi, H.; Jamshidi, S. Experimental and CFD Simulation of Slurry Flow in the Annular Flow Path Using Two-Fluid Model. J. Pet. Sci. Eng. 2020, 198, 108224. [Google Scholar] [CrossRef]
  19. Dwivedi, K.K.; Dutta, S.; Loha, C.; Karmakar, M.K.; Chatterjee, P.K. A numerical study on the wall erosion impact and gas-particle hydrodynamics in circulating fluidized bed riser. Therm. Sci. Eng. Prog. 2021, 22, 100852. [Google Scholar] [CrossRef]
  20. Wittmann, T.; Bode, C.; Friedrichs, J. The Feasibility of an Euler-Lagrange Approach for the Modelling of Wet Steam. In Proceedings of the ASME Turbo Expo 2020: Turbomachinery Technical Conference and Exposition, London, UK, 22–26 June 2020. [Google Scholar]
  21. Marocco, L.; Inzoli, F. Multiphase Euler–Lagrange CFD simulation applied to Wet Flue Gas Desulphurisation technology. Int. J. Multiph. Flow 2009, 35, 185–194. [Google Scholar] [CrossRef]
  22. Marocco, L. Modeling of the fluid dynamics and SO2 absorption in a gas-liquid reactor. Chem. Eng. J. 2010, 162, 217–226. [Google Scholar] [CrossRef]
  23. ANSYS. ANSYS Fluent 17.0 User’s Guide; ANSYS Inc.: Pittsburgh, PA, USA, 2017. [Google Scholar]
  24. Morsi, S.A.; Alexander, A.J. An investigation of particle trajectories in two-phase flow systems. J. Fluid Mech. 1972, 55, 193–208. [Google Scholar] [CrossRef]
  25. Mondal, M.K. Experimental determination of dissociation constant, Henry’s constant, heat of reactions, SO2 absorbed and gas bubble–liquid interfacial area for dilute sulphur dioxide absorption into water. Fluid Phase Equilibria 2007, 253, 98–107. [Google Scholar] [CrossRef]
  26. Gomez, A.; Fueyo, N.; Tomas, A. Detailed modelling of a flue-gas desulfurisation plant. Comput. Chem. Eng. 2007, 31, 1419–1431. [Google Scholar] [CrossRef]
  27. LIN, Y.; CHEN, D. Numerical Simulation of the Gas-Liquid Two Phases Flow and Evaporative Cooling Process in the Desulphurization Absorption Tower at Different Spraying Layers Operation Modes. J. South China Univ. Technol. 2019, 47, 20–29. [Google Scholar]
Figure 1. Setting up a computational domain.
Processes 09 01269 g001
Figure 2. Computational domain: (a) OST; (b) DST; (c) RBST.
Processes 09 01269 g002
Figure 3. Boundary layer grids: (a) Grids of wall; (b) Grids of deflector; (c) Grids of rod.
Processes 09 01269 g003
Figure 4. The WFGD process flow.
Processes 09 01269 g004
Figure 5. Tower internal structural parts: (a) Mist eliminator; (b) Spray levels; (c) Nozzles.
Processes 09 01269 g005aProcesses 09 01269 g005b
Figure 6. Velocity distribution: (a) OST; (b) DST; (c) RBST.
Processes 09 01269 g006
Figure 7. Liquid mass concentration: (a) OST; (b) DST; (c) RBST.
Processes 09 01269 g007
Figure 8. The distribution of flue gas velocity and liquid mass concentration on the curve of height Z = 3 m: (a) OST; (b) DST; (c) RBST.
Processes 09 01269 g008aProcesses 09 01269 g008b
Figure 9. Average temperature in the plane at different heights.
Processes 09 01269 g009
Figure 10. Distribution of flue gas temperature at different height Z: (a) OST; (b) DST; (c) RBST.
Processes 09 01269 g010
Figure 11. Distribution of flue gas temperature at Z = 8 m plane: (a) OST; (b) DST; (c) RBST.
Processes 09 01269 g011
Figure 12. Concentration distribution of SO2 at X = 0 plane: (a) OST; (b) DST; (c) RBST.
Processes 09 01269 g012
Figure 13. Pressure distribution at X = 0 plane: (a) OST; (b) DST; (c) RBST.
Processes 09 01269 g013
Figure 14. Pressure of central axis of tower.
Processes 09 01269 g014
Table 1. Flue gas and slurry parameters.
ParametersValue
Flue gas density/(kg/m3)1.13
Flue gas dynamic viscosity/(105 kg/(m·s))1.82
Slurry density/(kg/m3)1060
Slurry pH5
N2 mass fraction/(%)73.6
CO2 mass fraction/(%)13
O2 mass fraction/(%)4.9
H2O mass fraction/(%)8.4
SO2 mass fraction/(%)0.1
Table 2. Simulation results of different number of grids.
Number of Grids/(Million)Temperature Difference/(K)Pressure Drop/(Pa)Desulphurization Efficiency/(%)
OST0.579.485083.3
1.582.888187.7
2.582.888287.8
DST0.978.281785.7
1.985.884489.5
2.985.984489.5
RBST1.282.189689.1
3.287.991491.3
4.287.991491.3
Table 3. Operation parameters.
ParametersValue
Flue gas flow/(Nm3/h)1,200,000
Flue gas temperature/(°C)140
Slurry flow/(m3/h)10,000
Slurry temperature/(°C)45
Inlet SO2 concentration/(mg(Nm3)−1)1200
Table 4. Experimental verification.
ResultsTemperature Difference/(K)Pressure Drop/(Pa)Desulphurization Efficiency/(%)
Simulation82.888687.7
Experiment8992195.5
Error/(%)6.93.88.2
Table 5. Temperature difference between inlet and outlet.
TowerTemperature Difference/(K)
OST82.6
DST85.9
RBST87.9
Table 6. Desulfurization efficiency.
TowerDesulfurization Efficiency/(%)
OST87.7
DST89.5
RBST91.3
Table 7. Pressure drop.
TowerPressure Drop/(Pa)
OST881
DST844
RBST914
Publisher’s Note: MDPI stays neutral with regard to jurisdictional claims in published maps and institutional affiliations.

