Article

Techno Economic Analysis of the Modified MixAlco Process

Biomolecular Engineering Program, Physics and Chemistry Department, Milwaukee School of Engineering, Milwaukee, WI 53202, USA
*
Author to whom correspondence should be addressed.
Processes 2021, 9(6), 958; https://doi.org/10.3390/pr9060958
Submission received: 15 April 2021 / Revised: 21 May 2021 / Accepted: 25 May 2021 / Published: 28 May 2021
(This article belongs to the Section Manufacturing Processes and Systems)

Abstract

:
The MixAlco process is a patented biomass conversion technology used to produce valuable chemicals. The basis of this design relies on the use of fermentation, where acidophiles utilize their own enzymatic pathways to convert a variety of biomass, such as organic wastes, into carboxylic acid salts. Unlike previous MixAlco designs in which carboxylate salts are processed further into hydrocarbon fuels, this proposed design simulates the optimization and commercialization of mixed carboxylic acid salts as the final product. Sensitivity analyses identified four critical input factors of the base case process—biomass feed rate, selling price, distribution cost, and biomass composition. Increasing the biomass feed rate or population size has the most pronounced effect on process economics. Overall, the sensitivity analyses of all four critical input factors support that the new design is flexible in its ability to support populations of varying sizes, as well as different biomass feed rates and compositions.

1. Introduction

As the global population continues to grow, the rates of fossil fuel depletion and subsequent greenhouse gas emissions (GHG) are steadily rising. The world energy demand for oil rose from 6106 million tons in 1973 to 13,371 in 2012, with GHG rising from 15,633 to 31,734 megatons during the same years [1]. Such phenomena have driven extensive research in the discovery and utilization of renewable resources, such as biomass and biodegradable materials, as alternative sources of fuel and chemicals. Biomass is a “term for all organic material that stems from plants (including algae, trees, and crops) and includes all land and water-based vegetation, as well as all organic wastes” [2]. Biodegradable materials consist of sorted municipal solid waste, sewage sludge, industrial biosludge, manure, agricultural residues, and energy crops [3]. Components of biomass such as glucose, cellulose, hemicellulose, lignin, starch, pectin, fats, and proteins are found abundantly in a variety of agricultural and industrial biodegradables, leading to the opportunity to not only produce sustainable fuels and chemicals but also to reduce such organic wastes [3,4].
There are three main processing platforms that are currently utilized for biomass conversion—thermochemical, sugar, and carboxylate [5]. Thermochemical processing of biomass (such as in fast pyrolysis) involves gasification, to yield ethanol and higher alcohols [5,6]. Sugar platforms like commercial crop-to-alcohol pathways involve the hydrolyzation of carbohydrate polymers to sugars, using catalysts followed by fermentation to ethanol and carbon dioxide [5,7]. The carboxylate platform utilizes similar hydrolyzation as the sugar platform but yields acetic acid instead of ethanol.
Table 1 below compares the product yields for each platform. The composition of biomass used in each is 68.3% polysaccharides and 31.7% lignin. Based on the results presented in Table 1, the sugar and carboxylate methods produce equally higher yields of both ethanol and hydrocarbon than the thermochemical platform. This is due to the partial oxidation of the polysaccharides within the thermochemical platform, leading to overall lower efficiency and product yields [5,8]. However, the carboxylate platform utilizes a shift catalyst, which is less expensive, as compared to the alcohol catalyst used in the sugar platform, making the carboxylate platform the most economical [5].
Though there are several versions of each platform, the carboxylate method has garnered more interest due to greater economic feasibility [5,7]. Not only does the carboxylate platform produce the highest product yields, but it also allows for the recycling of enzymes and energy in subsequent cultures. This is possible because the carboxylic platform undergoes catalytic conversion of the lignin synthesis gas (which is a product of biomass gasification consisting of primarily hydrogen and carbon monoxide) to hydrogen rather than ethanol, a process which is a lot less challenging and expensive [5]. Additionally, the carboxylic acids that can be produced using this platform are common high demand intermediates found in the food and pharmaceutical industries, which have been primarily synthesized from petroleum. Carboxylic acids are pH-sensitive, which alters their level of dissociation. This flexibility allows carboxylic acids to act as viable preservatives and flavor additives, with antimicrobial properties, within the food industry [9,10]. This property also allows for carboxylic acids to act as solubilizers and prodrugs within the pharmaceutical industry, which can promote the bioavailability and lipophilicity of hydrophobic drug substances [9,11].
The MixAlco process is a version of a carboxylate biomass conversion platform, which converts any biodegradable material or biomass into carboxylate salts or carboxylic acids. These can be subsequently processed to produce alcohols through ketonization or esterification routes [1,5,7]. The alcohols may be further dehydrated and oligomerized to produce biofuels or blendstocks for gasoline and jet fuel [4,7]. Unlike many other biomass conversion methods, the MixAlco process operates without aseptic fermentation or high enzyme loading, reducing the capital cost, and greatly improving operability. The key to these advantages is the fermentation step, which utilizes a mixed culture of acid-forming microorganisms. These microorganisms are primarily methanogens, which are strictly anaerobic, and produce their own enzymes to convert biomass to carboxylate salts, in a form of consolidated bioprocessing [1,3,5,7]. The microorganisms are naturally occurring, and starter cultures can be obtained from soils of saline environments. They are also robust and do not require aseptic conditions, as contamination does not impact process efficiency. The mixed culture can also accommodate a range of feedstocks and is adaptable to changes in the composition [12].
Since its conception, the MixAlco process has proven its stability, by adapting to a fluctuating energy market. The MixAlco process was first introduced in 1999 as a means of thermally converting carboxylate salts to alcohols with the intent of using the mixed alcohols as a fuel source. The process consisted of the following steps—lime pretreatment, fermentation, dewatering, drying, thermal conversion, and hydrogenation [3]. Pretreatment was necessary because of the diversity of the biomass components. While cellulose and hemicellulose contain sugars that are easily broken down by microorganisms, lignin is a rigid structural component comprised of amorphous, high molecular weight carbon chains and rings, making the biomass difficult to digest [10,13]. Under lime treatment, high heat, pressurized oxygen, and long residence times, digestibility increased between 5.6 and 13.3 times [3]. Pretreated biomass then underwent fermentation in which microorganisms and calcium carbonate buffers were added in a series of countercurrent bioreactors, to yield highly concentrated carboxylate salt products [3,4]. To obtain solid salts, 80–90% of the water was removed in the dewatering and drying processes, to increase product concentration by 19% in comparison to 2–4% [3,13]. During the dewatering step, water-sensitive secondary and tertiary amines added to the fermentation broth in evaporators caused the formation of a separate phase that was isolated from the salt product. Superheated steam within heat exchangers then evaporated the remaining moisture and stripped amine residuals during the drying process. The final steps thermally converted carboxylate salts to ketones, using high heat, and then hydrogenated ketones to secondary alcohols [3].
In 2009, the MixAlco process saw a substantial change—rather than use calcium carbonate buffer in the fermentation step used in the ketonization pathway, ammonium bicarbonate buffers were added to form ammonium carboxylate salts, which then underwent esterification and hydrogenolysis to become mixed alcohols. The process redesign included using vapor compression in the dewatering step and utilizing a distillation column in the esterification step, in which the salts contact a high molecular weight alcohol and solid-acid catalyst to form esters. The esters were then reacted with hydrogen, using another catalyst to form primary alcohols [12].
Modifications to the design process of each route have been made over the last decade by the inventor of the process, Dr. Mark Holtzapple and his co-workers. Small pilot-scale studies and simulations have also been conducted by other external parties, to determine differences in feasibility between the ketonization route (KR) and the esterification route (ER). To settle the debate over whether KR or ER is more sustainable, these processes were simulated and compared using the Aspen Plus v8.6 software [1,4]. One discovered disadvantage of the esterification route is that ammonium bicarbonate is more expensive than calcium carbonate and requires more energy because it cannot be recycled. Calcium carbonate, conversely, can be recovered from the ketonization reaction and recycled to the fermenters without additional processing. The most energy consuming unit in the ketonization route is the dewatering unit, whereas for the esterification route, energy consumption is high for alcohol separation, esterification, dewatering, and recovery of ammonium bicarbonate—leading to a total energy requirement that is three times greater for the esterification route than for ketonization. Another downfall of the esterification route is the production of large GHG emissions as compared to ketonization [1]. However, esterification has a high theoretical yield because there is little carbon loss from the biomass to final products, while ketonization produces lower yields for alcohols than esterification [5]. The most recent studies are primarily modeled using KR, suggesting a preference for lower costs over higher yields [1,4].
Due to the flexible and sustainable approach of the process, the direction of the MixAlco process was recently changed to produce carboxylic acids instead of fuels. A pilot plant of the facility was even set up in Bryan, Texas, in collaboration with Earth Energy Renewables LLC, in 2018, with plans to scale it up to a commercial plant in future [4,14]. This transition shows promise, as the carboxylic acid market is projected to peak at a value of 20 billion dollars by 2023, with stepwise increases in demand by 5% each year [15]. Concurrently, gasoline produced by fossil fuels had a wholesale price of $1.60/gallon in December of 2019, much lower than the $2.20/gallon selling price required to yield at least a 15% return on investment, utilizing the MixAlco process [16]. Carboxylic acids, however, have much higher selling prices averaging up to $10/kg of nutraceutical grade mixed carboxylic acids, leaving more room for process optimization and profit [17]. In addition, the MixAlco process offers a much-needed solution to reduce the accumulating amounts of municipal solid waste that cities must treat around the globe. A staggering 267.8 million tons of municipal solid waste were generated in 2017, to which over half was discarded into landfills [18]. In landfills, this mixture of food, plastic, paper, and other wastes generated 115.7 megatons of GHGs (2015), most of which remain untreated [19]. By processing these wastes to carboxylic acids, the MixAlco process not only diminishes the harmful effects of excess wastes and emissions but also adds a revenue source to the process, as waste handlers pay for waste removal.
To execute this shift in production from biofuels to carboxylic acid salts, certain steps of the MixAlco process were eliminated, such as ketonization/esterification, as well as lime pretreatment. Other steps such as clarification and dewatering were replaced with centrifugation and evaporation, respectively, to improve approximations of the required energy and the overall economic feasibility of the process. This paper describes the scale-up design optimization to meet the requirements of a commercial production facility of carboxylic acid salts (or carboxylate salts), for the first time. The proposed process was modeled using the SuperPro Designer software (Intelligen, NJ, USA), to perform the material and energy balance calculations, as well as economic evaluations. A sensitivity analysis was also conducted to investigate the effect of individual process components, including biomass feed rate, distribution cost, product selling price, and biomass composition, on the net present value (NPV), the operating cost, payback time, and the total capital investment. The emphasis here was to determine the potential of MixAlco within the mixed carboxylic acid industry, and how pertinent the process could be at certain levels of operation.

2. Methodology

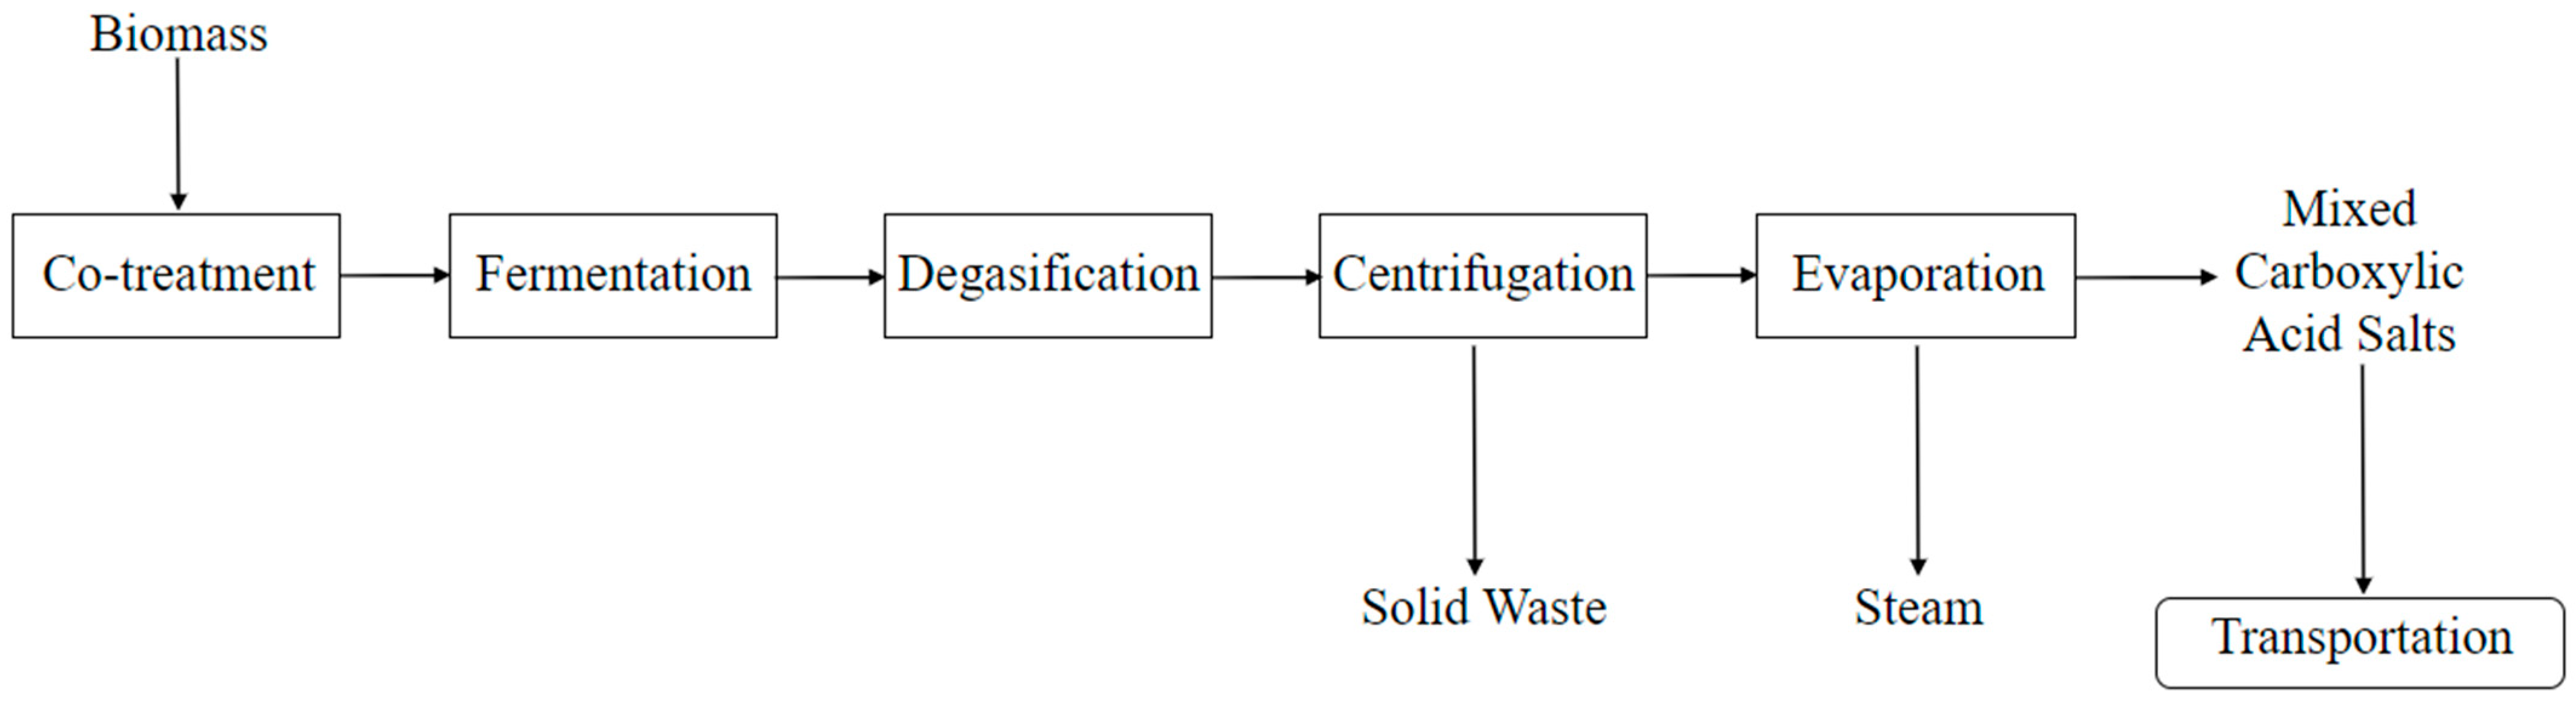
2.1. Proposed Process Description

In the proposed design, ideal biomass is first received from municipal waste companies. It is preferable to have this facility situated near or next to these municipal waste companies so that biomass transportation costs are greatly reduced and do not impact the economics of the facility. The biomass is subsequently ground up in a process known as co-treatment, in order to promote bacterial digestion of cellulose. Treated biomass is fermented using a mixed culture of anaerobic bacteria to produce carboxylic acids; sodium bicarbonate is added to maintain neutral pH; and to convert carboxylic acids into sodium carboxylic salts. Effluent from the fermenter then enters a degasifier to remove the dissolved carbon dioxide, and the remaining undigested solids are later separated via centrifugation. The clarified supernatant, containing water and carboxylate salts, is then heated up to 98 °C in a heat exchanger. This is then funneled into a multi-effect evaporator to increase the concentration of the carboxylate salts and to remove excess water as steam. Dewatered carboxylic salts are lastly loaded on tanker trucks and shipped to the desired locations. Figure 1 illustrates the sequence of unit operations necessary to convert biomass to mixed carboxylic salts.
The components of the entire process are introduced in detail below.

2.1.1. Cotreatment

During the process of cotreatment, a grinder (P-1) is utilized to mechanically break down wet biomass consisting of 5–11 wt.% lignin. The feed utilized within the proposed model consisted of 27.02 wt.% cellulose, 67.57 wt.% water, and 5.41 wt.% undigested lignin residue. The feed stream enters the grinder at a rate of 18.5 US ton/h, yielding a throughput of 16,783 kg/h, at a specific power of 0.1 kW. The ground biomass outlet stream improves the reaction time within the following fermentation step, to a great extent. It also eliminates the need for lime as a pretreatment step, which was used in previous MixAlco designs [12].

2.1.2. Fermentation

Along with the treated biomass, sodium bicarbonate buffer, iodoform (to inhibit the generation of methane gas by methanogens), and ammonia, are fed into the fermenter (P-6/FR-101). The addition of these components is vital in supporting bacterial growth, maintaining ideal operating conditions at a near neutral pH, and generating sodium carboxylate salts as the desired final products in the MixAlco process. After bacterial digestion, the concentration of the mixed carboxylate salts is approximately 3 g/L (14% salts by mass and 58% water by mass) in the output stream. The output stream also contains some undesired products including carbon dioxide, iodoform, etc., which are targeted in subsequent unit operations.
The fermenter utilized in this process is a concrete pit reactor with a total volume of 17,027 m3 and a working volume of 15,324.12 m3. Based on the desired ratio of carboxylic salts, the temperature can be varied. Operation at 40 °C produces the widest variety of C2-C7 carboxylic salts, with each salt accounting for at least 3% of the total salt mass. Table 2 below illustrates the overall weight percent distribution of the different types of carboxylic salts produced.
Assuming 100 g of cellulose at a conversion of 0.8 g digested/g volatile solids fed, selectivity of the 0.65 g carboxylic acids/g volatile solids digested, and the weight percentage of each acid in the product (Table 2) are used to calculate the mass basis stoichiometric coefficients of the carboxylic acid products seen below [7].
Carboxylic acid formation:
100.00 Cellulose → 26.65 Acetic acid + 9.75 Propionic acid + 13.65 Butyric acid + 5.20 Valeric acid + 7.80 Hexanoic acid + 1.95 Heptanoic acid + 23.48 Carbon dioxide + 11.52 Water
100.00 C6H10O5 → 26.65 C2H4O2 + 9.75 C3H6O2 + 13.65 C4H8O2 + 5.20 C5H10O2 + 7.80 C6H12O2 + 1.95 C7H14O2 + 23.48 CO2 + 11.52 H2O
The balanced carboxylate salt reactions expressed on a molar basis are given below:
Sodium acetate formation:
Acetic acid + Sodium bicarbonate → Carbon dioxide + Sodium acetate + Water
C2H4O2 + NaHCO3 → CO2 + C2H3NaO2 + H2O
Sodium propionate formation:
Propionic acid + Sodium bicarbonate → Carbon dioxide + Sodium propionate + Water
C3H6O2 + NaHCO3 → CO2 + C3H5NaO2 + H2O
Sodium butyrate formation:
Butyric acid + Sodium bicarbonate → Carbon dioxide + Sodium butyrate + Water
C4H8O2 + NaHCO3 → CO2 + C4H7NaO2 + H2O
Sodium valerate formation:
Valeric acid + Sodium bicarbonate → Carbon dioxide + Sodium Valerate + Water
C5H10O2 + NaHCO3 → CO2 + C5H9NaO2 + H2O
Sodium hexanoate formation:
Hexanoic acid + Sodium bicarbonate → Sodium hexanoate + Carbon dioxide + Water
C6H12O2 + NaHCO3 → C6H11NaO2 + CO2 + H2O
Sodium heptanoate formation:
Heptanoic acid + Sodium bicarbonate → Sodium heptanoate + Carbon dioxide + Water
C7H14O2 + NaHCO3 → C7H13NaO2 + CO2 + H2O
Undigested residue:
Ammonia → undigested residue

2.1.3. Degasification

The main purpose of degasification is to remove the carbon dioxide gas, which is necessary for proper flow-rate calculations in later processing steps. The exit stream from the fermentation step enters the degasification unit (P-3/DG-101) at a throughput of 17,831 L/h, at an operating flux of 100,000 L/m2h. The unit operates under vacuum conditions to remove 100% of carbon dioxide gas and iodoform from the system, increasing the carboxylic salt concentration to about 172.11 g/L (16% salts by mass and 65% water content by mass) in the output stream.

2.1.4. Centrifugation

The wet sludge is sent to the centrifuge (P-4/DC-101) to separate the residual acid salts and water from the solids. Operating at 17,701 L/h, the centrifuge removes 100% of the undigested residue and sodium bicarbonate with 20% loss of carboxylate salt products. Much of the desired salt product and water within the supernatant are separated from undesirable components such as undigested residues, cellulose, and sodium bicarbonate. The resulting liquid solution is then heated by steam in a plate and frame heat exchanger (P-2/HX-101) prior to evaporation. The sludge enters the heat exchanger at a rate of 12,295.67 kg/h and leaves at an exit temperature of 98 °C. The heat transfer coefficient of the heat exchanger is 1500 W/m2K and the steam temperature is 152 °C.

2.1.5. Evaporator

The clarified stream of water and carboxylic salts enters the vapor-compression evaporator (P-5/EV-101) at 98 °C at an input rate of ~12,304 L/h. With a heat transfer coefficient of 2800 W/m2K, the steam within the evaporator is able to remove nearly 89.4% of the water from the input stream, which greatly decreases the cost of extraction of individual carboxylic salts and increases salt concentration. The carboxylic acid salts can then be removed from the mixture and prepared for transport to a central facility, where additional processing into other forms of chemicals (such as carboxylic acids) and fuels can occur.

2.1.6. Transportation

The transportation by truck unit incorporates the direct loading from the dewatered product stream into 20 m3 tanker trucks that will then be shipped to further processing facilities outside of the MixAlco Process. The bulk cost of shipping mixed carboxylic acid salts 1000 km to a downstream processing facility has a quantity dependent cost of $40.00/m3 and a quantity and distance dependent cost of $0.050/m3-km.

2.1.7. Cellulose Piggybank

Since waste companies pay the facility a fee to take organic waste, the cellulose piggybank is a feature of the design to ensure this transaction is counted as revenue. A separate unit operation containing a one input one output generic box matches the total wet weight of the biomass feed rate in order to account for this profit. The output stream is adjusted to sell at $55/ton of biomass waste, which is comparable to what is brought into the inlet stream at the beginning of the process [20].

2.1.8. Assumptions Used in the Proposed Design

Table 3 identifies the key assumptions associated with the MixAlco design such as the US dollar used to determine selling price and annual profit from Table 3 as well as other key project totals.
Table 4 lists the assumptions specific to each component of the design for the base case.
The process described above was modeled with the SuperPro Designer software. The flow of biomass through each unit operation in addition to other inlet and outlet streams are identified in Figure 2.

2.2. Sensitivity Analysis

The purpose of this sensitivity analysis was to quantify the effects of certain input factors on the output of the process and determine the process’s overall robustness in a variety of environments. There were four inputs that were deemed critical in determining the stability of MixAlco facilities—biomass feed rate, distribution cost, mixed carboxylic acid salts selling price, and biomass composition. The impact of each of these input variables on payback time, capital investment, operating cost, and net present value at 7% were calculated and analyzed.

3. Results and Discussion

3.1. Base Case

There were a variety of key performance parameters associated with these unit operations that directly affected the base case of operations—a financial projection based on market sensitivities. Table 5 below presents the key parameters and their values for this base case MixAlco design. Values associated with the I/O diagram (Figure 2) and process description were also directly related to the base case values.
Examples of the adjustable process parameters included carboxylate salt selling price and operating temperature. Projection data points such as return on investment (ROI), total capital investment, operating costs, revenue, and net present value (NPV) were directly affected by these process parameters. In this design, mixed carboxylate salts were set to a base case selling price of $3.41/kg, which was the modeled break-even point, and at temperatures of 40 °C. This temperature yielded the following mix of salts—41% acetic (C2), 15% propionic (C3), 21% butyric (C4), 8% valeric (C5), 12% caproic (C6), and 3% heptanoic (C7). Table 6 below illustrates the annual profit generated by each carboxylic salt as well as the biomass tipping fee, and breaks down each revenue source by its market selling price and weight, harvested within the design process.
Using the design assumptions in Table 3, the process parameters outlined in Table 4 and Table 5, and the profit contributions from Table 6, key project indices such as the ROI of the plant were calculated to be 47.54%, with annual revenues of $73,809,000/year. The total capital investments and operating costs of the process were $28,949,000/year and $54,618,000/year, respectively. At such a high ROI, the payback time of the plant was 2.10 years at a 7% net present value of $69,803,000. The complete list of project indices can be found in Table 7.
Table 8 below presents each cost component of the process design and percent contribution to the overall minimum selling price of $2.38, for one gallon of mixed carboxylic acid salt product.
Table 9 outlines both the plant direct and indirect costs, respectively. Total plant direct costs, or physical costs, were those assigned to specific functions or services within the plant, during operation. Indirect costs such as overhead were those not related to direct materials or labor and not assignable to a specific function or service. The summation of total plant direct and indirect cost yielded total plant cost.

3.2. Sensitivity Analysis

The sensitivity analysis was performed to examine the potential variation of the net present value (NPV), the operating cost, payback time, and the total capital investment caused by four critical process parameters, including biomass feed rate, distribution cost, product selling price, and biomass composition.

3.2.1. Biomass Feed Rate

The first critical input factor was biomass feed rate. To quantify this effect, the waste generation of cities with varying population sizes across the United States were obtained and assumed to be equal to the feed rate (Table 10). Waste generation was obtained from the cities’ municipal websites [22,23,24,25].
The simulation results and economic metrics of four cases are provided in Table 11 below.
Figure 3a shows the biomass feed rate effect on the payback time of the MixAlco facility for different cities.
From Table 11 and Figure 3a, it can be concluded that cities with larger populations and higher biomass feed rates are more economically favorable. New York City was the most successful simulated city with a biomass feed rate and payback time of 451.1 US ton/h and 0.36 years, respectively, but Austin and Glendale also proved to be profitable with a payback times less than five years. The city of Atlanta was neither a favorable nor profitable case, as the payback time greatly exceeded five years, and it had a negative NPV. In order for smaller cities or lower biomass feed rates to be supported by this MixAlco process, another design would be necessary.

3.2.2. Selling Price of the Carboxylate Salt Mixture

The selling price of the carboxylate salt mixture was the second critical input factor, as it was essential in determining majority of the profit gained from the product. The selling price must be both competitive in comparison to other companies within the market, as well as feasible from a customer standpoint. This sensitivity analysis simulated various selling prices up to $10/kg, including the prices in which an NPV of zero as well as a payback time of five years were obtained. Table 12 outlines the effects of selling price on process economics.
Figure 3b illustrates the selling prices and their corresponding payback times. It should be noted that the investors were more inclined to buy into projects with payback times of five years or less, so this sensitivity analysis would be particularly helpful in suggesting the minimum selling price of the mixed carboxylic salts.
As seen in Table 12 and Figure 3b, the selling price had no effect on the annual operating cost and total capital investment, as the process itself was not modified. However, the net present value and payback time were strong functions of the selling price, as it dictated profit gains for the project. As the selling price was increased, the net present value increased due to higher monetary flow. This resulted in a lower payback time, as the investments were paid off quicker, with an increase in profit. The overall process was feasible, as the minimum selling price at which the net present value was zero ($1.79), was less than 20% of the recommended selling price of $10/kg. The minimum selling price at which the payback time was about five years ($1.90) was also less than 20% of the recommended selling price, but was a much better choice for the minimum selling price.

3.2.3. Distribution Cost

Distribution cost was the third critical input factor of this current design. This input factor could be easily adjusted in the model, by changing the distance traveled by the tanker trucks carrying the final product. During the planning and implementation of a centralized processing facility, the effect of shipping distance on key financial parameters needs to be carefully evaluated to evaluate the effect of shipping distance on key financial parameters. This sensitivity analysis considered shipping distances from 100 km to 1500 km, because they best represented the minimum and maximum distances that would need to be traveled. Table 13 below outlines the process economics for each shipping distance.
Figure 3c illustrates the shipping distances and their corresponding payback times. Figure 3c and Table 13 indicate that the shipping distance had minimal impact on most financial aspects considered. This was promising because it illustrated the robustness of the design. The location of a centralized facility was flexible with respect to the biomass collection locations because the increased shipping distance had a maximum additional impact of 0.09 years upon payback time, thus confirming the lack of impact with shipping distance.

3.2.4. Biomass Composition

The MixAlco process can utilize a variety of different substrates with unique mass compositions of cellulose, lignin, and water. The composition of biomass feed was the next critical input factor to this process design because it had a direct impact on the quantity of mixed carboxylic salts produced, as well as the size of facilities needed to satisfy such production levels. Table 14 below describes the process economics for five different biomass compositions on an ash- and salt-free basis [5]. Row one represents the base case biomass composition while the remaining compositions were calculated by deviating from this base case, while maintaining the same feed rate of 18.5 US ton/h.
Figure 3d illustrates each biomass composition and its corresponding payback time. Based on the results presented in Table 14 and Figure 3d, it could be concluded that the biomass composition components of lignin and water had a minimal impact on the process total capital investment and operating cost, as these values fluctuated minimally, case to case. However, modifying the cellulose component of the biomass composition was found to have a great effect on the net present value and payback time, with NPV and payback time values ranging from almost 15 $ M–100 $ M and 1.5 years–5 years, respectively. In terms of payback time alone, five years is the recommended upper limit for a feasible process, so this component was critical. As cellulose is the biomass component that was converted to carboxylic acid salts, the percentage of this component directly affected the yield of carboxylic acid salts. In the case of increased amounts of cellulose compared to the base case (29.7% versus 27%), more acid salts were produced and sold, resulting in increased profit margins, net present value, and a lower payback time (1.66 years versus 2.10 years). Overall, all biomass compositions tested in this sensitivity analysis had payback times under five years, suggesting that this proposed process design is quite robust in the types of biomass it can support.
Completion of the sensitivity analyses illustrated critical input factors that should be targeted, as well as some advantages of this MixAlco design. Of these four critical input factors, selling price, biomass composition, and biomass feed rate have substantial impact on financial metrics. While distribution cost was found to have minimal effects on such metrics. This can be viewed as an advantage due to the added flexibility in the planning of a centralized facility. The selling price of mixed carboxylic acid salts was advantageous, as four of the five prices exhibited payback times of less than five years. This proved that price can be varied substantially and still remain profitable during turbulent economic periods. Biomass feed rate and biomass composition had the greatest impact on all four process economic factors studied, as they were directly related to the cellulose conversion to carboxylic acid salts. With regards to biomass composition, process economics were only contingent on cellulose composition, so biomass wastes with higher cellulose levels would be preferable. Lastly, analysis of the biomass feed rate proved MixAlco’s robustness, as payback time remained low in cities with varying populations and feed rates. Table 15 summarizes the effect of each of the four critical input factors on the four measurable process economic factors from the sensitivity analyses.
The conversion and selectivity of our proposed design were the same as in previous designs, so it produced the same yield and similar composition of mixed carboxylic acid salts. However, the base case fixed investment of $23.7 million at 18.5 US ton/h in this design was less than that of previous models at 11.02 US ton/h, which had a fixed capital investment of $33.4 million (2007 US dollars). If the esterification and hydrogenolysis costs of $3.86 million combined with analysis of similar process steps are not included, the model at 11.7 US ton/h had a fixed investment of $29.5 million (2007 US dollars) [12]. At 44.1 dry US ton/h, the estimated fixed investment for the new design was $42.3 million, while an older model at 44.1 US ton/h had a fixed investment of $87.2 million for all process steps, or $77.9 million without esterification and hydrogenolysis (2007 US dollars). Another model at 45.7 US ton/h had a fixed investment of $97.8 million for all process steps, or $84.3 million (2012 US dollars) for similar process design steps [1,12].
The total capital investment of the proposed design at $28.9 million for 18.5 US ton/h and $49.3 million for 44.1 US ton/h also displayed a marked decrease from older models. A plant operating at a biomass feed rate of 45.7 US ton/h was estimated to have a TCI of $105.9 million for all process steps, or $92.4 million (2012 US dollars) for similar process steps [1]. The sensitivity analysis demonstrated that, at various biomass feed rates, the new proposed design operated at a higher capacity for a lower cost than the previous models.
At the most optimized biomass composition, the NPV of our proposed design was $95.6 million, but it also had a positive NPV for many variations of biomass compositions. For an older model of a MixAlco plant that processes brown algae—12% solids (6% cellulose) and 88% water on a wet basis—the NPV was $61.1 million (all process steps for producing hydrocarbon fuels included) [1]. Yet, at a biomass feed rate of 45.7 US ton/h and biomass composition of 6% cellulose and 88% water, the NPV for the new design was estimated at a negative valuation, so while the new design may support many variations on biomass composition, there exists a minimum threshold for cellulose percentage which must be met for the plant to be profitable.
At 44.1 US ton/h, older models suggest a plant that produces hydrocarbon fuels must sell at a minimum of $1.57/gal (2009 US dollars) and $1.75/gal (2007 US dollars) for economic feasibility, while the new design at 18.5 US ton/h may have a minimum selling price between $1.90 and $2.38/kg of mixed carboxylic salts to be profitable and achieve a payback time within five years [7,12]. At 44.1 US ton/h, the selling price of mixed carboxylic acid salts was $1.78/kg at minimum for the design to be economical and had a payback time of 0.85 years. The sensitivity analysis highlights an advantageous shift in the new design, from fuel to carboxylic acids, because the selling prices of the mixed carboxylic acids are much more competitive than the selling prices of hydrocarbon fuels in the current market.

4. Conclusions

In this study, the commercial robustness of the MixAlco process was demonstrated by modeling its first use in the conversion of biomass to mixed carboxylic salts/acids. The calculated base case resulted in an estimated total capital investment and annual operating cost of $28,949,000 and $54,618,000, respectively. Other process economics such as ROI (47.54%) and payback time (2.10 years) were computed based on a facility operating throughput of 16,782.92 kg biomass per hour and biomass tipping fee of $0.06/kg. The sensitivity analyses of critical input factors concluded that the proposed MixAlco design could be quite successful in supporting a variety of different sized populations over a large region, due to minimal effects of distribution cost on process economics, in conjunction with low payback times at a variety of different biomass feed rates and biomass compositions. However, cities with smaller populations and biomass with low cellulose content were not supported by this design. Overall, all four critical input factors must be optimized in order to maximize the net present value and minimize the operating cost and payback time. Future market and municipality studies should be conducted to explore the most favorable selling price for the mixed carboxylic acids, as well as to ensure consistent levels of cellulose from the biomass. Separation and purification techniques of the carboxylic acids can also be explored to provide insight on potential additional profitability of the process.

Author Contributions

Investigation, C.S., B.Z., D.M. (Devin Moder), D.M. (Dustin Madson), M.P., J.K., F.S. and S.O.; Project administration, S.O.; Supervision, F.S. and S.O.; Writing—original draft, C.S. and B.Z.; Writing—review & editing, C.S., B.Z., F.S. and S.O. All authors have read and agreed to the published version of the manuscript.

Funding

This research was partially funded by MSOE Summer Faculty Development Grant.

Acknowledgments

We would like to express our sincere gratitude to Mark Holtzapple and Mahmoud El-Halwagi from the Artie McFerrin Department of Chemical Engineering at Texas A&M University, for their help and guidance in this study. This work was carried out with financial support from Milwaukee School of Engineering.

Conflicts of Interest

The authors declare no conflict of interest.

References

  1. Fasahati, P.; Liu, J.J. Application of MixAlco® processes for mixed alcohol production from brown algae: Economic, energy, and carbon footprint assessments. Fuel Process. Technol. 2016, 144, 262–273. [Google Scholar] [CrossRef]
  2. McKendry, P. Energy production from biomass (part 1): Overview of biomass. Bioresour. Technol. 2002, 83, 37–46. [Google Scholar] [CrossRef]
  3. Holtzapple, M.T.; Davison, R.R.; Ross, M.K.; Aldrett-Lee, S.; Nagwani, M.; Lee, C.-M.; Lee, C.; Adelson, S.; Kaar, W.; Gaskin, D.; et al. Biomass Conversion to Mixed Alcohol Fuels Using the MixAlco Process. Appl. Biochem. Biotechnol. 1999, 79, 609–631. [Google Scholar] [CrossRef]
  4. Vasquez, S.T.; Dunkleman, J.; Chaudhuri, S.K.; Bond, A.; Holtzapple, M.T. Biomass conversion to hydrocarbon fuels using the MixAlco™ process at a pilot-plant scale. Biomass Bioenergy 2014, 62, 138–148. [Google Scholar] [CrossRef]
  5. Holtzapple, M.T.; Granda, C.B. Carboxylate Platform: The MixAlco Process Part 1: Comparison of Three Biomass Conversion Platforms. Appl. Biochem. Biotechnol. 2009, 156, 95–106. [Google Scholar] [CrossRef] [PubMed]
  6. Dutta, A.; Schaidle, J.A.; Humbird, D.; Baddour, F.G.; Sahir, A. Conceptual Process Design and Techno-Economic Assessment of Ex Situ Catalytic Fast Pyrolysis of Biomass: A Fixed Bed Reactor Implementation Scenario for Future Feasibility. Top. Catal. 2016, 59, 2–18. [Google Scholar] [CrossRef] [Green Version]
  7. Pham, V.; Holtzapple, M.; El-Halwagi, M. Techno-economic analysis of biomass to fuel conversion via the MixAlco process. J. Ind. Microbiol. Biotechnol. 2010, 37, 1157–1168. [Google Scholar] [CrossRef] [PubMed]
  8. Holtzapple, M. History of the MixAlco Process and Future Challenges; Lecture presented at Rewiring Anaerobic Digestion; Advanced Research Projects Agency-Energy (ARPA-E): Washington, DC, USA, 2016. Available online: https://arpa-e.energy.gov/sites/default/files/Mark_Holtzapple_MixAlco_History.pdf (accessed on 25 May 2021).
  9. Badea, G.I.; Radu, G.L. Introductory Chapter: Carboxylic Acids—Key Role in Life Sciences. In Carboxylic Acid—Key Role in Life Sciences; IntechOpen: London, UK, 2018. [Google Scholar] [CrossRef] [Green Version]
  10. Yang, S.-T.; Huang, H.; Tay, A.; Qin, W.; De Guzman, L.; Nicolas, E.C.S. Extractive Fermentation for the Production of Carboxylic Acids. In Bioprocessing for Value-Added Products from Renewable Resources; Elsevier: Amsterdam, The Netherlands, 2007; pp. 421–446. [Google Scholar] [CrossRef]
  11. Solubilizers & Emulsifiers—Excipients for R&D Use Only: Sigma-Aldrich. 2020. Available online: https://www.sigmaaldrich.com/life-science/biochemicals/biochemical-products.html?TablePage=105243119 (accessed on 24 June 2020).
  12. Granda, C.B.; Holtzapple, M.T.; Luce, G.; Searcy, K.; Mamrosh, D.L. Carboxylate Platform: The MixAlco Process Part 2: Process Economics. Appl. Biochem. Biotechnol. 2009, 156, 107–124. [Google Scholar] [CrossRef] [PubMed]
  13. Crocker, M. Thermochemical Conversion of Biomass to Liquid Fuels and Chemicals; RSC Publishing: Cambridge, UK, 2010. [Google Scholar] [CrossRef] [Green Version]
  14. Advanced BioFuels USA. Available online: https://advancedbiofuelsusa.info/the-mixalco-process-green-energy-for-the-future/ (accessed on 20 March 2018).
  15. Newcombe, G.; Dixon, D. Interface Science in Drinking Water Treatment—Theory and Application. In Interface Science and Technology; Academic Press: London, UK, 2006. [Google Scholar] [CrossRef]
  16. Crude Oil vs. Gasoline Prices—10 Year Daily Chart. Available online: https://www.macrotrends.net/2501/crude-oil-vs-gasoline-prices-chart (accessed on 8 May 2020).
  17. Acid Carboxylic Hot Sell Stearic Acid Manufacturer Price Carboxylic Acid. Mixed Carboxylic Acid-Mixed Carboxylic Acid Manufacturers, Suppliers and Exporters on Alibaba.com Pharmaceutical Intermediates. 2020. Available online: www.alibaba.com/products/mixed_carboxylic_acid.html?spm=a2700.7724857.0.0.4b15226eXDYDz5 (accessed on 6 May 2020).
  18. National Overview: Facts and Figures on Materials, Wastes and Recycling (13 March 2020). Available online: https://www.epa.gov/facts-and-figures-about-materials-waste-and-recycling/national-overview-facts-and-figures-materials (accessed on 9 July 2020).
  19. Lee, U.; Han, J.; Wang, M. Evaluation of landfill gas emissions from municipal solid waste landfills for the life-cycle analysis of waste-to-energy pathways. J. Clean. Prod. 2017, 166, 335–342. [Google Scholar] [CrossRef]
  20. Staff, W.T. Waste Today. EREF Releases Analysis on National Landfill Tipping Fees. Available online: www.wastetodaymagazine.com/article/eref-releases-analysis-national-msw-landfill-tipping-fees/#:~:text=Virtual%20Trade%20Show-,EREF%20releases%20analysis%20on%20national%20landfill%20tipping%20fees,percent%2C%20to%20%2455.36%20per%20ton (accessed on 29 October 2019).
  21. Alibaba. Available online: https://www.alibaba.com/products/carboxylate_salts.html (accessed on 14 May 2021).
  22. Thamkittikasem, J. Mayor’s Management Report. 2020. Available online: www1.nyc.gov/assets/operations/downloads/pdf/pmmr2020/2020_pmmr.pdf (accessed on 14 October 2020).
  23. Oden, M.W. City-Serviced Residential Waste Characterization Study; CB&I Environmental & Infrastructure, Inc.: Baton Rouge, LA, USA, 2015; p. 8. Available online: https://www.texasdisposal.com/sites/default/files/uploads/2015AustinCommunityDiversionStudyFinal04.29.16.pdf (accessed on 14 October 2020).
  24. Weaver, D.; Najarian, A. General Counsel-Public Works; Resolution No. 11-241; Glendale, CA, USA, 2011; pp. 1–14. Available online: https://www.glendaleca.gov/home/showdocument?id=6864 (accessed on 14 October 2020).
  25. U.S. EPA. Green Waste Solutions; SMART Waste Management: Atlanta, GA, USA, 2009; p. 6. Available online: https://ilsr.org/wp-content/uploads/2012/02/atlanta-payt.pdf (accessed on 14 October 2020).
Figure 1. Process diagram of the current design.
Processes 09 00958 g001
Figure 2. Schematic I/O diagram for the current MixAlco design.
Processes 09 00958 g002
Figure 3. (a) The effect of biomass feed rate and city size on payback time. (b) The effect of selling price on payback time. (c) The effect of shipping distance on payback time. (d) The effect of biomass composition on payback time.
Processes 09 00958 g003
Table 1. Biomass conversion platform and theoretical yield comparison for ethanol and hydrocarbon production [8].
Ethanol Production
(gal/ton)
Hydrocarbon Production (gal/ton)
Thermochemical Platform14595.8
Sugar Platform175115
Carboxylate Platform175115
Table 2. Carboxylic Acid Salt Product Spectrum at 40 °C [8].
Carboxylic Acid SaltWeight Percent (%)
C2-Acetic41
C3-Propionic15
C4-Butyric21
C5-Valeric8
C6-Caproic12
C7-Heptanoic3
Table 3. Assumptions associated with the current process design.
Project Lifetime15 years
US DollarNovember 2019
Depreciation model$2247 for 10 years
Piggybank output stream16,782.92 kg/h
$55.00/US ton biomass
Financing100% equity
Construction period30 months
Start-up time4 months
Income tax rate40%
Operating season7920 h/year, 330 days/year
Working capital investment4,108,722 (thousand $)
Table 4. Assumptions associated with current process design unit operations.
UnitParameterValue
Cellulose PiggybankInlet biomass flow rate18.5 US ton/h
Co-treatmentSpecific Power0.1 kW/(kg/h)
FermentationFinal Temperature
Reaction Time
Conversion
Selectivity
40 °C
5 weeks
0.8 g digested/g volatile solids fed
0.65 g carboxylic acids/g volatile solids digested
Degasification% Carbon Dioxide Removed100%
CentrifugationParticulate concentration1034.73 g/L
HeatingTemperature of the exit product stream
Heating Duty
98 °C
2,500,442.74 kJ/h
EvaporationRelative Mass Evaporation Rate of water100,000
TransportationQuantity per Shipment
Shipping Distance
20.00 m3
1000 km
Table 5. Key performance parameters for the MixAlco design.
UnitParameterValue
Co-treatmentOperating Throughput16,782.92 kg/h
FermentationWorking Volume15,324.12 m3
DegasificationThroughput
Steam Temperature
17,830.75 L/h
152.00 °C
CentrifugationThroughput17,706.06 L/h
HeatingHeating Agent (Steam)
Mass Flow Rate
Temperature

1156 kg/h
152 °C
EvaporationVacuum Steam Temperature
Flow (Heating agent)
152 °C
9201 kg/h
TransportationShipping Frequency2759 shipments/year
Cellulose PiggybankThroughput16,782.92 kg/h
Table 6. Profit contributions of each revenue stream based on the market selling price and weight harvested [21].
ComponentSelling Price
[$/kg]
Weight
[US ton/h]
Annual Profit
[$]
Biomass tipping fee [19]0.0618.507,975,242
Sodium acetate0.731.166,110,227
Sodium propionate3.000.408,721,347
Sodium butyrate 5.000.5519,605,435
Sodium valerate5.070.207,366,066
Sodium hexanoate100.3021,326,929
Sodium heptanoate50.072,620,356
Table 7. Key project totals and indices associated with the specific MixAlco design.
IndicesValue
Total capital investment$28,949,000
Fixed capital investment$23,657,000
Annual operating cost$54,618,000
Annual revenues$73,809,000
Gross margin26.00%
ROI47.54%
Payback time2.10 years
IRR (after tax)35.28%
NPV at 7%$69,803,000
Table 8. Cost components of the minimum selling price.
Cost ComponentUS $/kg of ProductContribution (%)
Raw Materials1.3054.72
Labor0.125.00
Facility Dependent Cost (maintenance, overhead, depreciation, and local tax)0.166.79
Waste Treatment and Disposal0.124.94
Utilities0.104.19
Transportation0.187.56
Income Tax0.2811.76
Total$2.3894.96
Table 9. Total plant direct and indirect costs.
Total Plant Direct Cost (TPDC)Total Plant Indirect Cost (TPIC)
Equipment purchase cost$3,956,000Engineering$3,214,000
Installation$1,463,000Construction$4,500,000
Process piping$1,385,000
Instrumentation$1,583,000
Insulation$119,000
Electrical$396,000
Buildings$1,780,000
Yard improvement$593,000
Auxiliary facilities$1,583,000
Table 10. The cities with their respective population and waste generation.
CityPopulationWaste Generated
(US ton/h)
New York (NYC)8,600,000451.1
Austin950,71524.3
Glendale, CA201,36118.5
Atlanta486,29011.4
Table 11. The effect of biomass feed rate and city size on the process economics of each MixAlco facility.
Biomass Feed Rate
(US ton/h)
Total Capital Investment
($)
NPV @ 7%
($)
Annual Operating Cost ($/year)Payback Time (Years)
11.422,707,000−21,095,00050,159,000205.22
18.528,949,00069,808,00054,618,0002.10
24.2833,668,000138,468,00059,411,0001.40
451.1280,116,0005,247,480,000352,325,0000.36
Table 12. The effect of carboxylate salt mixture selling price on process economics.
Selling Price ($/kg)Total Capital Investment
($)
NPV @ 7%
($)
Annual Operating Cost ($/yr)Payback Time (Years)
1.7928,949,000185,00054,618,0007.35
1.9028,949,00012,337,00054,618,0005.03
2.3828,949,00069,803,00054,618,0002.10
6.0028,949,000494,891,00054,618,0000.39
10.0028,949,000963,812,00054,618,0000.21
Table 13. The effect of product shipping distance to centralized facilities on process economics.
Shipping Distance (km)Total Capital Investment
($)
NPV @ 7%
($)
Annual Operating Cost ($/yr)Payback Time (Years)
10028,949,00080,499,00052,135,0001.90
25028,949,00078,716,00052,549,0001.93
50028,949,00075,745,00053,239,0001.98
100028,949,00069,803,00054,618,0002.10
150028,949,00063,861,00055,997,0002.24
Table 14. The effects of biomass composition on process economics.
Biomass CompositionTotal Capital Investment
($)
NPV @ 7%
($)
Annual Operating Cost
($/year)
Payback Time
(Years)
1–27 wt.% cellulose, 5.4 wt.% lignin, 67.6 wt.% water$28,949,000$69,803,000$54,618,0002.10
2–24.3 wt.% cellulose, 8.1 wt.% lignin, 67.6 wt.% water$29,036,000$42,148,000$54,395,0002.93
3–21.6 wt.% cellulose, 10.8 wt.% lignin, 67.6 wt.% water$29,114,000$14,776,000$54,174,0004.76
4–24.3 wt.% cellulose, 5.4 wt.% lignin, 70.3 wt.% water$29,040,000$42,712,000$54,265,0002.90
5–29.7 wt.% cellulose, 5.4 wt.% lignin, 64.9 wt.% water$28,839,000$95,555,000$55,317,0001.66
Table 15. Relationship between the critical input factors and process economics.
InputTotal Capital InvestmentNPV @ 7%Annual Operating CostPayback Time
Biomass Feed RateIncreases with increased feed rate/city population sizeIncreases with increased feed rate/city population sizeIncreases with increased feed rate/city population sizeDecreases with increased feed rate/city population size
Mixed Carboxylic Acid Salt Selling PriceNo impactIncreases with increased selling priceNo impactDecreases with increased selling price
Distribution CostNo impactDecreases with increased distribution cost/shipping distanceMinimal impact with increased distribution cost/shipping distanceMinimal impact with increased distribution cost/shipping distance
Biomass CompositionMinimal impact with changes in cellulose %Increases with increase in cellulose %Minimal impact with changes in cellulose %Decreases with increase in cellulose %
Publisher’s Note: MDPI stays neutral with regard to jurisdictional claims in published maps and institutional affiliations.

